Extended abstracts of the lectures presented during the symposium Fossil Fuels: Reserves and Alternatives – A Scientifi c Approach, organised by the Earth and Climate Council of the Royal Netherlands Academy of Arts and Sciences and Clingendael International Energy Programme, 9 December 2004
Fossil fuels
Royal Netherlands Academy of Arts and Sciences
r e s e r v e s a n d a lt e r n at i v e s – a s c i e n t i f i c a p p r o a c h
Amsterdam, 2005
edited by:
lucia c. van geuns
© 2005 Royal Netherlands Academy of Arts and Sciences
No part of this publication may be reproduced, stored in a retrieval system or transmitted in any form or by any means, electronic, mechanical, photo-cop y ing, re cord ing or otherwise, without the prior written permission of the publisher. P.O. Box 19121, 1000 GC Amsterdam, the Netherlands
T + 31 20 551 07 00 F + 31 20 620 49 41 E knaw@bureau.knaw.nl www.knaw.nl
ISBN 90-6984-441-9
The paper in this publication meets the requirements of ∞ iso-norm 9706 (1994) for permanence.
Contents
Foreword 7H. Doust, Petroleum systems and the hunt for oil and gas 9 C.P.J.W. van Kruijsdijk, Resources, reserves and peaking 15
J.P. Gerling, Non-conventional hydrocarbons: What, where, how much 19 J.G. van der Linde, What drives the oil price? 29
H.J. Chase, Energy geopolitics and investment 35 R. van Dorland, Climate change - an overview 41
H.J.W. de Baar, Role of the oceans in the high- CO2 world 49 I.L. Ritsema, Clean fossil fuels 61
H.J.M. de Vries, Wind, solar and biomass: Their role in a sustainable future 73 M.M.A. Beurskens, The future of fi ssion and fusion 77
Foreword
On Thursday 9 December 2004, the Clingendael International Energy Programme (CIEP) and the Earth and Climate Council of the Royal Netherlands Academy of Arts and Sciences (RAK/KNAW) organised a symposium entitled Fossil Fuels: Reserves and Alternatives – A Scientifi c Approach at the Royal Netherlands Academy of Arts and Sci-ences (KNAW) Het Trippenhuis, Kloveniersburgwal 29, Amsterdam.
The symposium provided a scientifi c insight in the discussion on the future con-tribution of fossil fuels to the global energy system and what technologically feasible alternatives are currently and in the future available in order to meet the world’s rapidly rising energy demand. Extended abstracts of the presentations are bundled in this booklet providing an up-to-date view on the subject.
Interest in fossil fuels has gained momentum. Petroleum experts around the world speculate on remaining oil and gas resources and reserves. Easy-to-produce crude oil and natural gas are non-renewable fi nite resources. Many analysts estimate that world oil production will peak before 2020, marking the start of a long period of de-cline. At the same time, potential demand will be very strong as economies like India and China industrialize. Currently new conventional oil fi elds are being discovered at a rate of less than one third of the world’s annual production on average. The same holds for gas albeit with greater uncertainty, whereas coal reserves are still large though less preferable as an energy source for environmental reasons. In any case, our geological heritage is being depleted at a fast rate.
Meeting the world’s future energy demand is going to be a major challenge. There is little doubt that we will eventually change to a new energy system. Timing however, is still an issue of concern. The drivers of this change are a combination of the geol-ogy and geopolitics of fossil fuels, the rising CO2 concentrations in the atmosphere and oceans, and the options made available by new technologies. It is predicted that the energy system of the future will continue to show substantial diversity with no single primary source, nor a single energy carrier.
The need to ensure a long-term supply of energy creates a renewed interest in the large existing non-conventional hydrocarbon resources (heavy oil, tar sands, gas hy-drates etc.) and for coal. Key technologies which make it possible to transform these different resources into clean fuels and energy while minimising CO2 emissions are required. Will clean fossil energy be the technologists’ answer to global warm-ing? Will wind, biomass and solar win over hearts and minds sooner than might be expected? Or will nuclear energy, highly advanced nuclear fi ssion and in particular nuclear fusion, provide a solution?
Energy will be on the scientifi c and political agenda for a long time to come. We hope that the contributions in this volume will provide readers with a fresh insight on where we stand today and fuel the discussions of the future.
Lucia C. van Geuns, M.Sc.
Clingendael International Energy Programme, The Hague Prof. dr. Jan W. de Leeuw
h a r r y d o u s t
Petroleum systems and the hunt for oil and gas
Summary
The importance of petroleum as a fuel for the World’s economies cannot be exagger-ated – it has proved to be one of our most adaptable and valuable commodities. In its gaseous, liquid or solid form, it is a uniquely common, cheap and effi cient natural resource. Though widespread in sedimentary rocks below the Earth’s surface, useful quantities are typically confi ned to petroleum systems, portions of sedimentary basins where a source horizon and reservoirs are combined with appropriate structural geometries. Within petroleum systems, oil and gas is produced from concentrations that form accumulations or fi elds. Geologists who hunt for petroleum make use of a range of principles and technologies, coupled with local knowledge of the subsurface, to identify situations where it may occur. In spite of major advances, however, our knowledge of both the process of petroleum generation, accumulation and retention, as well as of the subsurface geology is in many areas not adequate to make very con-fi dent predictions. Exploration for new con-fi elds remains a risky undertaking, therefore, while the defi nition of volumes located continues to be accompanied by uncertain-ties. For these reasons, predictions of where future reserves may be encountered and of the volumes that may be discovered continue to be controversial.
Petroleum and its significance
Petroleum is formed of a very complex mixture of organic compounds of carbon and hydrogen called hydrocarbons. Hydrocarbons repel water and are essential to all life forms. Through our ability to match living compounds with chemical fossils found in oil, we know in fact that all signifi cant quantities of petroleum are derived from the thermal conversion of dead plant and animal material, or kerogen, into natural gas, liquids (oil) or solids (tar or asphalt).
Oil is one of the most important and adaptable commodities that man has ever found, and it is largely thanks to its ready availability in the past century that whole societies have been able to build and enjoy standards of living that would previously have been considered unthinkable. Petroleum products touch every aspect of our lives today, providing feed-stocks for electricity generation and petrochemical prod-ucts as well as, notably, transport and heating fuels. Gas and oil currently provide about 65% of the World’s energy needs and ready access to supply is of crucial impor-tance to the economies of most countries.
The Petroleum System and how it works
and how petroleum occurs, is found and subsequently produced is astonishingly rudimentary. This is perhaps due to the very specialized nature of the geological understanding required to search for and exploit oil and gas and of the remarkably small nature of the community that carries out the work, but it is certainly not helped by lack of public attention and education on the subject.
All decisions and strategic plans related to the hunt for petroleum rely on geo-logic predictions of conditions below the Earth’s surface. Through the past century, geologists have built experience in identifying the essential elements that lead to the accumulation of petroleum, and have encapsulated this experience in the concept of the Petroleum System.
Petroleum is a relatively common constituent of the shallower parts of the Earth’s crust, but useful quantities are found only within the areas of petroleum systems, where they reside in concentrations called accumulations or fi elds. What are the ele-ments needed to satisfy such conditions? They can be summarized as follows: – A source rock, a sediment relatively rich in organic material (kerogen) which, when
heated to a certain temperature through burial can yield signifi cant quantities of volatile hydrocarbons (oil and gas),
– A reservoir rock, a sediment with suffi cient pore space between the grains to allow oil and gas to reach a suitable concentration. Typical reservoirs include sandstones and limestones, where the pore space may constitute up to 30% of the rock, – A seal to prevent the leakage and loss of oil and gas from the reservoir; this is
usu-ally a clay or other impermeable rock type,
– A structure to collect and hold the concentration below the Earth’s surface: This will usually be a convex-upwards fold in the sedimentary layers called a trap.
The accumulation of oil and gas depends on the upward movement or migration of hydrocarbons from the source rock through the sediment pore space into a reservoir sealed in a trap structure. This occurs under the infl uence of buoyancy. Needless to say, a suffi ciently thick pile of sedimentary rocks is required to allow buried kerogen to generate its hydrocarbons – petroleum systems are therefore limited to sedimentary basins – and that all the essential elements must be present and have the appropriate relationship to each other.
Geologists study the characters of different types of petroliferous sedimentary basins and the families of accumulations they contain, and try to predict the distribu-tion and character of the elements described above. They use these to identify prom-ising locations for drilling new traps, called prospects.
Why some areas are rich in petroleum and others have none
Oil and gas fi elds are distributed very unevenly in the World’s sedimentary basins. There may be several reasons for this, but the main ones are related to variations in the development, character and quality of the elements essential for the process of petroleum accumulation. Scientists and engineers involved in the hunt therefore de-vote a huge amount of time and resources to the study of both the processes involved as well as in investigation of the local geographical development of source rocks, reservoir-seal combinations and traps.
Perhaps the most celebrated petroleum province is the Middle East, surrounding the Gulf. Here the elements are of good quality over large areas and are juxtaposed with each other in a particularly favourable fashion. Two particularly rich source rocks are present and large quantities of their generated hydrocarbons are effi ciently collected and trapped in large, simple traps – an example of a large area with a favour-able and simple petroleum system. Other areas tend to be smaller and considerably more complex, with more local variations in the essential parameters. In such areas accumulations are often smaller, more complex and more diffi cult to fi nd, while many promising traps contain nothing. It is important to appreciate how little of the total amount of hydrocarbons generated from source rocks eventually reside in ac-cumulations that can be commercially produced: Often this will be between 1 and 5% – the remainder is simply lost, partly to low concentrations in the sediment, partly to the Earth’s surface.
Looking for oil and gas – considerations and strategies
Exploration for petroleum carries huge risks, due to our imperfect understanding of the processes that lead to hydrocarbon accumulation (although this is constantly improving) and the generally limited knowledge of the particular area that is being explored (although this will improve over time as experience is gained). For these reasons, worldwide exploration success is rarely sustained at more than about 30%, while commercial success rates are usually lower.
To protect themselves from risk and to balance short and longer term objectives, most companies will seek to invest in a varied portfolio of drillable prospects, usually with a spread of risk versus reward potential; e.g. a mixture of those with a high risk, but large potential volume/reward from less well-known areas and those with lower risk/lower reward from better-known areas. Thus the hunt can be divided into differ-ent categories, depending on the level of knowledge:
– Frontier exploration involves areas from which production has not yet been achieved. These are the least known, and the most risky. In order to justify the risk of exploring in such areas, with overall success rates rarely better than 10 – 20%, the potential rewards must be high. Thus, in frontier areas, geologists look for ‘high risk/high reward’ potential. If successful, achieving production will often take several years.
– Emergent areas. These are recently successful areas, where potential for more dis-coveries is good. To succeed in such provinces against competition, it is essential to identify them very early, preferably while they are still frontiers. They represent relatively risky, but very important mid-term elements of a company’s portfolio. – Mature areas. These consist of areas that have been producing for a long time, but
where room for exploration still exists, particularly that classifi ed as ‘near-fi eld/faci-lity exploration’. Typically, both risk and rewards are low, but the activity can be very profi table as it makes use of existing facilities and any oil or gas can be produced immediately: Cut-off volumes for economic development are typically lower than for the other categories.
By diversifying the portfolio, a company avoids undue reliance on one type of area or risk category and aims to combine short-term needs with provision for a secure future.
Exploration objectives and the strategies to address them vary according to the nature of the economic and political climate, forecasts of oil price and the quality of opportunities available versus alternative investment opportunities. Exploration may require years of patient investment before profi tability can be realized, so the nature of the organization will be an important infl uence too: Large international companies usually aim for a broad portfolio spread across several countries, while smaller com-panies tend to have more specifi c goals. National (state) comcom-panies will be concerned with understanding the magnitude of the resources available and ensuring long-term domestic supply.
Success may have a major impact on a company, but also on the host country, its government and the local population. In recognition of the fact that oil/gas explora-tion has an important impact on a wide spectrum of people, much effort is spent of ensuring that operational activities not only address the ‘bottom line’ or the compa-ny’s fi nancial interest, but also consider the best interests of the local population and the environment.
Making predictions in an uncertain world
Risk and uncertainty are inherent to exploration and most processes supporting stra-tegic decision-making revolve around management of them.
Because understanding and knowledge is always incomplete, explorers’ predictions invariably involve some guesswork. Exploration strategies are therefore concerned with objectively estimating the risk that the subsurface concept may be wrong or only partially correct, and evaluating the range of possible error in the assumptions. Both risk (the chance that the outcome of drilling is unwelcome, for instance that no hy-drocarbons are present in a prospect) and uncertainty (the range of possible volumet-ric outcomes, assuming that hydrocarbons are identifi ed) are involved.
Because of the multiple risks and uncertainties, most predictions of expected volumes are expressed in terms of probabilities and are subjected to probabilistic economic screening.
What may the future bring?
Petroleum is produced from reserves that were discovered some years ago. Current rates of production (which are forecasted to rise) are considerably higher than the rate of new reserves identifi cation – in the case of oil by twice as much. Unless this changes, a supply shortage is bound to arise at some stage within the next century. Precisely when this may be is currently highly controversial. Two schools of thought exist: the ‘Neo-Malthusians’ believe that such an energy crisis may not be far off; in fact they predict that World production may start to decline within the next few years, leading to an oil famine after 2020. The other school, the ‘New Cornucopians’, pre-dict that considerable new reserves can and will be accessed in the coming years, and that the World’s demands will be easily met at least for the next half century.
The assumptions that underpin these views are based on petroleum system analysis, geological models, analogue studies and a variety of statistical techniques. The fact that they can be so divergent emphasises the very signifi cant uncertainties related to predicting the results of future exploration: In addition, all sorts of issues, technical, fi nancial and political will have an impact, while all statistical projections are made diffi cult by constantly changing frames of reference.
In spite of the above, we can be fairly certain that in the short to medium term the hunt will result in the identifi cation of signifi cant new reserves, especially in cur-rently productive or mature provinces like the Middle East, perhaps through the application of new technologies and better accumulation models. Exploration in less well known frontier areas, like the deeper waters of continent margins and the Arctic will be more risky, but here we can expect to see considerable activity that will result in discoveries of new reserves – It is, however, diffi cult to predict the scope of such volumes.
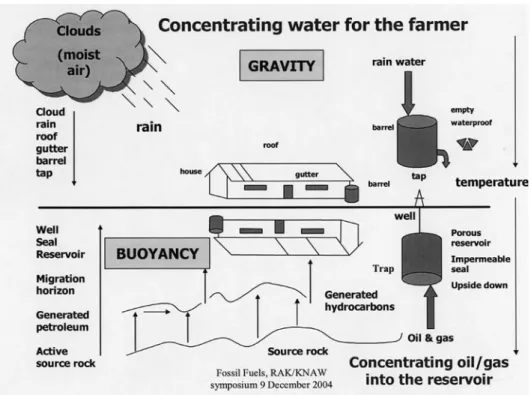
Fig. 1. Cartoon illustrating a comparison between fl uid movement processes in the atmosphere, where they take place under the infl uence of gravity, and below the ground where they are controlled by the buoyancy difference between gas, oil and water. A farmer wishing to save water will concentrate the rain that falls on his roof in a barrel (which needs to have several specifi c characteristics) and tap it off when needed. The process of of petroleum generation, accumulation and trapping into a usable concentration is in many ways similar, though it acts in an opposite direction below ground. In this case the barrel is represented by a trap containing an oil or gas fi eld.
Fig. 2. This fi gure shows some of the means that are used in the petroleum industry to predict the vol-umes of oil and gas that might be found in the future. On the left total production versus time has been plotted for the US and the World. Assuming that the eventual profi le will follow a bell-curve, it is pos-sible to extrapolate the trends to an end point, and predict the volume still to be found and produced. Such statistical techniques are subject to great uncertainties (see some of the caveats in the box) and should be viewed as possible scenarios only. One of the potential infl uences may be related to optimism in the hunt – as shown by the results shown top right from recent industry activity in Norway.
Fig. 3. Some of the areas where oil and gas may be located in the future. Currently most discoveries are made in deep waters along continental margins, largely guided by direct seismic evidence for oil and gas (top left). Advances in knowledge and technology are expected to permit new and incremental re-serves to be identifi ed in traditionally rich areas like the Middle East. A return to areas that have been lightly explored, and are therefore poorly known in the past can be expected too – such provinces occur in many countries and include the margins of the Arctic Ocean. A general move towards exploitation natural gas can be noted and non-traditional fuels, like tar sands are assuming a larger profi le.
c o r v a n k r u i j s d i j k
Resources, reserves and peaking
Resources
Hydrocarbons in various forms are present in the subsurface. Hydrocarbons in gase-ous or liquid form may exist in porgase-ous and permeable deposits. Currently most of the oil and gas produced comes from these reservoirs. Some oil and gas are produced di-rectly from the buried and transformed organic material called source rock including coal. Three key questions need to be answered before the usually large investments that are required to bring a given fi eld into production can be allocated:
– How much oil and gas is present? – How much of it can we get out? – How quickly can we get it out? Hydrocarbons Initially in Place (HIIP)
The size of the hydrocarbon accumulation (HIIP) is determined by estimating the volume the hydrocarbons occupy in the subsurface. This requires delineating the 3D structure that bears the oil and gas (rock bulk volume, RBV), predominantly using seismic data. Although current 3D seismic is of unprecedented quality, many error sources (time depth conversion, interpretation error) still exist that result in a large uncertainty of the rock bulk volume. Moreover, this volume (RBV) needs to be corrected for those parts that are not considered reservoir rock (net-over-gross, N/G). Subsequently the rock fraction (1-φ) and water (Sw) that will be present need to be subtracted. This information is derived from various measurements taken along the wall in the available wells that penetrate the reservoir (well logs). The well logs, however, measure these quantities in a very indirect way and are calibrated on core samples taken from the wells. Unfortunately most reservoirs tend to be heterogene-ous and the wells effectively only sample a very small part of the reservoir. Again this introduces a signifi cant source of error. Finally the volume of oil is corrected for the volume change when it is transported from the subsurface to atmospheric condi-tions (B). The entire process is summarized by the following equation HIPP=RBV. N/G.φ(1-Sw)/B.
All data sources introduce uncertainty. Moreover, many of the errors are strongly correlated and non-gaussian. Consequently the HIIP is best represented by a prob-ability density curve. It is not unusual that the ‘best’ and ‘worst’ case are more than 70% up or down from the best estimate (i.e. the standard deviation is easily half the mean).
Recovery factor (RF)
The fraction of the oil or gas we can produce is a function of the recovery process and is called the recovery factor (RF). Gas is produced by expansion due to pressure de-cline which is a very effi cient process for strongly compressible fl uids. The recovery factor for gas is usually quite good and generally falls between 70 and 90%. Unfor-tunately it is far more diffi cult to produce oil. Over half of the world’s oil is produced by water injection, where water displaces the oil. The current average recovery factor for oil is 33% with a range from 2 to 50%. These numbers depend strongly on the heterogeneity of the reservoir and the fl uid mobility. Lower heterogeneity and higher mobility usually leads to higher recovery factors.
Production rate
The rate at which the oil or gas is produced has to be high enough to justify the up-front cost of building the production infrastructure (wells, surface facilities, transport etc.). The production rate depends strongly on the mobility of the fl uids in the rock which is defi ned by the fl uid viscosity and rock permeability. Both properties can vary many orders of magnitude. The viscosity is easily obtained from a fl uid sample. The rock permeability on the other hand can only reliably be measured on a rock sample. Unfortunately reservoirs tend to be extremely heterogeneous.
Reserves
Finally combination of HIIP and RF leads to the technical reserves probability den-sity functions. The industry works with three defi nitions: proved, probable and possible reserves. These often are interpreted as the P90, P50 and P10 points. Proved reserves are subject to a few additional contractual and legal constraints. The SEC rules are somewhat out of step with the industry. They require certain test data to be available which companies today do not consider to be necessary (i.e. cost effective) from a business point of view. Companies will and have started development (commis-sioning platforms etc.) without the data required by the SEC. Of course the related reserves may not be classifi ed as proved for SEC reporting.
Fig. 2. The light (grey) curve illustrates the HIIP probability density function. The dark (black) curve is the cumulative pdf. In addition the P10, P50 and P90 points are indicated.
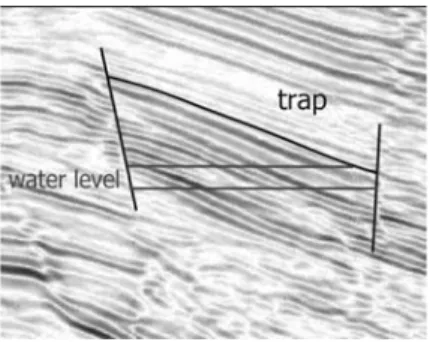
Fig. 1. The background shows the refl ectors calculated from the seismic data. From this a bounding structure (trap) is derived.
Productivity profile
A typical production profi le for a medium to large sized fi eld starts with a ramp up as the wells are brought into production. Initially the production will be limited by the capacity to handle the fl uid streams (surface facilities). This results in a plateau that can be maintained for a period from fi ve to twenty years typically. After this period the well productivity will have dropped to the point were they become the bottleneck and if no measures are taken the production will go into a decline phase. This period is terminated when the fi eld is shut in based on economic constraints (e.g. negative cashfl ow). However, the plateau phase can be extended by additional investments in the fi eld such as infi ll wells. These are additional wells that target bypassed oil and/or boost total fi eld production. In addition, or in a later phase, enhanced oil recovery techniques may be applied. Enhanced oil recovery techniques rely on the use of chemical additives (e.g. surfactants, polymers etc.) and/or the addition of external energy (e.g. through steam injection). Again this requires additional investment both in terms of capital expenditure and operational costs.
Peaking
Straightforward summation of the production decline curves of the fi elds in opera-tion may lead to the conclusion that global oil producopera-tion has or soon will (5-8 years) reach a peak after which a rapid decline is inevitable. However, this analysis ignores the fact that the past two decades investments in the oil industry have been severely reduced. This has resulted in premature production decline that may be repaired by stepping up investments. In addition technology is progressing rapidly. Moreover, with a sustained high oil price, enhanced oil recovery and unconventional hydrocar-bons will add to the reserves. The current technical outlook foresees a move into ever deeper water adding reserves in the deeper offshore. In addition instrumented fi elds operated under a measurement and control approach (smart fi elds) have the poten-tial to add 5 to 15% to the current recovery factors for oil. Moreover, this technology allows for an ever decreasing environmental footprint. Better technology and higher oil prices will also bring on stream more unconventional sources such as tar sands, gas hydrates and coal bed methane.
Oil price pressures
The oil supply infl uences the oil price in two ways. Given that oil is a fi nite resource, ultimately the remaining reserves will start to infl uence the oil price. However, cur-rently it is the limited production capacity that dictates the current high oil prices. Systematic underinvestment (infi ll wells, EOR, etc.) has eroded the spare capacity on the supply side. Together with the growing demand this has created the current market.
Increasing capacity
Once the production goes off plateau there are a few options to (signifi cantly) ex-tend it, such as drilling infi ll wells or switching to an EOR process. This however, does require additional investments and takes time to implement. The time scale to signifi cantly increase production capacity from existing fi elds is on the order of one or two years. Bringing on new reserves requires at least fi ve years. To prevent short term pressure on the oil price these activities and investments have to be planned signifi cantly ahead of time. This also requires a good handle on the development of the demand for fossil fuel.
Conclusions
Estimating hydrocarbon reserves is characterized by large uncertainties resulting from the lack of direct access to these resources. Current estimates are very con-servative, particularly those related to proved reserves. Nevertheless the hydrocarbon reserves are fi nite and will have to be replaced in time by more sustainable energy sources. However, the crossover point from fossil fuel to sustainable energy domi-nated supply is not expected to take place before mid this century. The timing may even be driven by cost breakthroughs in sustainable energy rather than by dwindling hydrocarbon reserves. The current high oil prices are related to capacity problems rather than decreasing reserves.
The dominant role that fossil fuels will play the next fi fty years demands a clean fos-sil fuel strategy. Recent technological advances based on a measurement and control paradigm allow a signifi cant reduction of the environmental footprint of hydrocarbon production. The Dutch geo-energy sector is in an excellent position to play a leading role in this. However, the current political research agenda is dominated by sustain-able energy. Realignment of the energy policy, acknowledging the dominant role of fossil fuels in the next half century, is required to capitalize on the strong position of the Dutch geo-energy sector.
p e t e r g e r l i n g
Non-conventional hydrocarbons:
What, where, how much
Introduction
Primary energy consumption has increased by 70% over the last three decades. Recent studies dealing with future energy supply (e.g. IEA 2004) predict that oil and gas will remain playing the key role during the coming decades. The IEA – as well as the EIA in the USA – predict that the earth’s energy resources are even more than ad-equate to meet a 60% increase in demand until 2030. Some experts from the ‘supply side’ doubt that these predictions will become reality.
How is the current supply situation? According to BGR (2004), reserves (that part of total resources which can be recovered economically using current technology) of non-renewable fuels at the end of 2003 are estimated to amount to about 35,500 EJ (Table 1). Coal has the largest reserves (50.3%), followed by conventional oil (18.8%), and conventional natural gas (15.9%). Resources (that part of the total resources which are (i) either proved but at present not economically recoverable or (ii) geologi-cally indicated) of non-renewable fuels amounted to about 196,500 EJ at the end of 2003. Again, coal is estimated to have the largest resource amounts, with a share of 53.6%, followed by non-conventional natural gas (24.8%), and lignite (6.1%). Table 1:
Type of energy Reserves % of total Production 2003 static lifetime Resources % of total [EJ] specifi c unit [years] [EJ] specifi c unit
Hard coal 17,885 763 Gt 50.3 4,421 Mt 173 105,334 4,401 Gt 53.6 Oil, conventional 6,686 160 Gt 18.8 3,549 Mt 45 3,515 82 Gt 1.8 Natural gas, conventional 5,639 178 T.m³ 15.9 2,697 G.m³ 66 6,886 207 T.m³ 3.5 Oil, non-conventional 2,301 66 Gt 6.5 ca. 100 Mt > 200 10,460 250 Gt 5.3 Lignite 1,602 182 Gt 4.5 928 Mt 225 11,925 1,017 Gt 6.1 Uranium 874 1.7 Mt 2.5 34,997 t 49 8,738 17 Mt 4.4 Thorium 495 1.2 Mt 1.4 n.n. 964 2.4 Mt 0.5 Natural gas, non-conventional 63 2 T.m³ 0.2 > 130 G.m³ n.n. 48,633 1,533 T.m³ 24.8 Total 35,545 361 EJ 196,455
Table 1 : Reserves, production and resources of non-renewable energy resources at the end of 2003 (BGR 2004). n.n. = unknown; EJ = Exajoule = 1018 J
Considering the current annual consumption of 3,549 Mt1 oil and 2,697 G.m32
natural gas, the so-called static lifetimes3 for these fossil fuels are only 45 years and
66 years. These numbers seem to indicate that there is suffi cient oil and gas, and plenty of time to transfer resources into reserves or to base the world’s economy on other energy sources. However, the important moment is the one when demand and supply do not correspond any more. And this moment may be closer than anticipated by many people. It will most probably appear when the world oil/gas production will reach its peak which may be even earlier than the depletion mid-point (= consump-tion of 50% producconsump-tion of reserves). Consequently, it seems appropriate to include non-conventional hydrocarbons into the world’s production portfolio as much and as soon as possible.
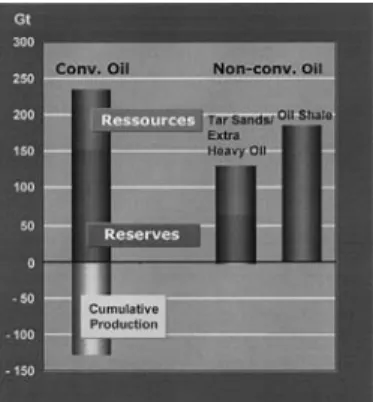
Non-conventional oil
Non-conventional oils have a large potential. Reserves amount already to more than 40% of the conventional oil, the resources exceed those of conventional oil by three times (Fig. 1). Non-conventional oils comprise heavy oil (20-10°API, 0.934-1.000 g/ cm3 density), extra heavy oil and tar sand/bitumen. Both latter ones are heavier than
water, only differentiated by their viscosities (</> 10,000 mPas.s). Heavy oil will not be discussed in the following text, because this type of oil is often not clearly sepa-rated in oil reserve reports given by countries or organisations. Oil shale – it should better be named shale oil – is a specifi c category since this sediment contains per se not oil but kerogen which can be converted into oil when exposing it to heat.
Fig. 1. Worldwide reserves and resources of conventional and non-conventional oils
Tar sands/bitumen
Tar sands are naturally occuring mixtures of bitumen, water, sand, and clay. On average, tar sands contain around 12% bitumen by weight. The product generated
from tar sand is called crude bitumen or synthetic bitumen. Around 580 Gt4 of tar
1 Mt = mega tons = million tons = 106 t 2 G.m3 = giga m3 = billion m3 = 109 m3
3 static lifetime = ratio of currently known reserves and last year’s production. This term is only
useful for orientation since both reserves and production change permanently.
sands (oil in place) are reported to exist in around 70 countries worldwide, always occurring in rather shallow deposits (Meyer & Attanasi 2004). Due to technical progress acquired during the last two decades in exploitation and processing, about 39.3 Gt of this ‘oil’ are already classifi ed as reserves.
The major proportion – 27.8 Gt – of the reserves is located in Alberta/Canada cov-ering an area of 77,000 km2. At the same location, another 22.3 Gt are classifi ed by
the Alberta Energy and Utilities Board as resources. The bitumen is bound to highly porous and highly permeable, unconsolidated Cretaceous sandstones, from shallow depth down to 600 m below surface.
Around 20% of this deposit can be exploited by surface mining, allowing a recov-ery rate of about 90% of the bitumen. Mining shovels dig the unconsolidated sedi-ment and load it into big trucks. Tar sand is taken to crushers where it is prepared for extraction. Hot water is added, and the slurry is then fed via hydrotransport to the extraction plant. The bitumen will be extracted in separation vessels, the tailings are pumped afterwards into settling ponds from where the water (up to 80%) is recycled.
The other 80% – in sediments more than 75 m below surface – can only be recov-ered by in-situ treatments. Currently, cyclic steam stimulation (CSS; huff & puff) or steam assisted gravity drainage (SAGD) are in operation. During CSS, the cycle starts with several weeks of steam injection through the vertical well into the reservoir. The viscosity of the bitumen is reduced, supported by pressure-induced microfractures allowing a better migration. After shutting in a certain time, heated oil and water are pumped to the surface. Though this cycle can be repeated several times, the overall recovery rate does not exceed 15-20%. SAGD involves drilling a pair of horizontal wells separated vertically by about 5 m at the bottom of a thick unconsolidated res-ervoir. Steam is injected into the upper well. The heat reduces the oil viscosity and develops a ‘steam chamber’. While steam and gas rise, oil and condensed water are removed through the lower well. The sweep effi ciency of this process is high, creat-ing recovery factors up to 60%. The minimum zone thickness (net pay thickness) necessary is about 15 m for exceptionally good reservoirs with high permeability (> 2 Darcy), high bitumen saturation (So > 0.80), and few shale streaks (Dusseault 2005). One can anticipate that due to the high recovery ratios possible, SAGD will probably displace pressure-driven thermal processes in all cases where the reservoir is reason-able thick. Nevertheless, there are certain challenges for SAGD: The crude bitumen has to be upgraded (as in any other production method), the high energy demand for steam production (1500 MW for 100,000 bopd), and the related CO2-emissions (1 ton CO2 per ton synthetic crude oil) (Cupcic 2003).
Both, the bitumen from the extraction plant (open pit mining) as well as that produced via in-situ methods have to be upgraded into a synthetic crude oil (SCO) through thermal cracking, hydrocracking and/or deasphalting the crude bitumen. For pipeline transportation to the upgrader, the bitumen has to be diluted, e.g. using condensate or light oil (up to 40%). Because of the foreseeable limits on diluent avail-ability, new transport blends – e. g. mixtures of raw bitumen with SCO – will have to be developed for existing refi neries in the USA, where most of the oil is sent. Typical residues of the upgrading process are petcoke, asphalts, and sulphur. Stockpiling
of these residues is avoided by e.g. using sulphur for the production of gypsum and fertilizers whereas the organic substance could be combusted or gasifi ed in order to generate steam.
Until the end of 2004, about 724 Mt of bitumen have been produced in Canada. The annual production rose from 48.1 Mt (2002) to 55.7 Mt in 2003, and about 58 Mt in 2004. Since the development of new open pit mining plants is signifi cantly faster than the development of new in-situ production facilities, the bitumen production from open pit mining is supposed to be in the year 2012 about double as much as from in-situ production (85.8 Mt/a vs. 44.9 Mt/a).
Extra heavy oil
Extra heavy oil is a natural product similar to the bitumen in tar sands, but with lower viscosity (< 10,000 mPas.s) under reservoir conditions. Deposits are known from 21 countries, the most important ones are located in Venezuela, in the CIS (e.g. Mele-kess, Olenek, Siligir), Canada (Lloydminster), and Madagaskar. The largest deposit occurs in Faja del Orinoco in Venezuela. 7.5 Gt from total 7.7 Gt reserves occurring worldwide do exist in Venezuela (Meyer & Attanasi 2004), in an area of roughly 54,000 km2. Miocene sandstones, 500-1000 m deep, are the reservoir rocks.
‘El-evated’ reservoir temperatures of about 55°C allow a ‘cold production’ from horizontal wells. Production as high as 2000-2500 b/d have been achieved in single wells where sediments with permeabilities in excess of 5-6 Darcy are exploited. Unfortunately, this technology can only achieve 10-12% recovery, because lower permeable zones that contain 40% of the resource are totally ignored at the moment. In order to in-crease the recovery ratio, SAGD is evaluated to be used in Venezuela as well.
28.8 Mt of crude oil have been produced in 2002 – the annual oil production is estimated to increase to 70 Mt in 2025 (EIA 2004). At the surface, the crude is diluted prior to pipeline transportation (up to 200 km) to the upgrader. The crude oil (e. g. 8.5° API) is partly refi ned into a typical light oil (e. g. 32° API), partly mixed with water resulting in a product named Orimulsion® (70% crude oil, 30% water) which is usually shipped overseas where it is burnt in power plants.
Oil shales
Oil shales contain a vast amount of energy – the worldwide resources are estimated to be 184 Gt. The term ‘oil shale’ is misleading since it does not contain oil. Oil shales are defi ned as fi negrained brown or black sedimentary rocks containing a signifi -cant proportion of solid organic matter that will yield liquid or gaseous hydrocarbons upon heating and distillation. Only those oil shales are of economic interest that yield more than 40 L of oil per tonne shale (Sæter 2004) – this is equivalent to a TOC-con-tent of 8%. Giant resources of oil shale exist in the western part of the United States, namely in form of the Tertiary Green River oil shales. Besides, other large deposits are the Tertiary Stuart oil shales in Queensland, Australia, the Paleozoic deposits on Scandinavia (Alum Shale) and Estonia (Kukkersite), and the Cretaceous El-Lajjun deposit in Jordan. Large scale mining of oil shale started already before 1900 in Scot-land (oil production), followed by activities in Estonia, Russia, China, and Brazil. Pro-duction peaked in 1980 when more than 46 million metric tons of oil shale per year
was mined, with roughly 30 Mt in Estonia. The following decline was mostly due to the gradual downsizing of the Estonian oil shale industry (production of electricity).
The decline was mainly due to the fact that – using current technology – oil shale could not compete economically with conventional petroleum as an energy resource. Three major reasons are to be named:
– The retorting of oil shale can either be done in situ or after mining and crushing, and subsequent treatment in a processing plant. The energy consumed during these processes is at leat 40% of the outcome. Both processes also use considerable amounts of water.
– Retorting of oil shale is accompanied by large releases of CO2, NOx and SO2 as well as by huge particulate emissions (enriched with a variety of metals, organics, etc.). – The spent shale occupies 20-30% greater volume after processing than raw shale
due to a popcorn effect.
Nevertheless, oil shales can be considered as a strategic reserve. The future development and expansion of the oil shale industry will be governed by the price of crude oil, the possibilities to reduce greenhouse gas emissions, and the implementation of favourable remediation strategies.
Non-conventional natural gas
Four different types of non-conventional gases can be differentiated. These are, ordered accordingly to their economic relevance: gas from almost tight reservoirs (so-called ‘tight gas’), coal gas occurring either in coal seams or in coal mines, gas hydrates from marine sediments of the continental margins or continental polar permafrost regions, and aquifer gas dissolved almost ubiquitous at low concentration in each deeply buried aquifer.
‘Tight gas’
So-called ‘tight gas’ is defi ned as natural gas from reservoirs having an extremely low permeability below 0.1 mD (MilliDarcy). Such reservoirs usually exist in great depths, the geological/geochemical situation is complex and often poorly understood. The economic production of these gases usually requires large stimulation, e. g. fraccing the reservoir. Worldwide reserves are estimated to be rather low (1 T.m3), whereas the
resources are estimated to amount to 80 T.m3 (BGR 2003). Tight gas reservoirs have
been developed in the USA, in Canada, China, Australia, the Middle East, in Egypt, and in Germany.
In northern Germany, 85 prospects and leads of tight gas reservoirs have been identifi ed in Rotliegend and Carboniferous sediments (Liermann & Jentsch 2003). Their natural gas content is estimated to be around 300 G.m3 – 30-50% of this gas is
expected to be recoverable. This would prolongate the static lifetime of the domestic gas production by another 7-8 years. Core questions regarding the commercial devel-opment of these gases include the predictability of reservoir quality, detailed knowl-edge about the stress regime (recent and paleo), the understanding of frac propaga-tion, and reliable possibilities of production forecasts. However, on top of this are the economic factors: development costs of German tight gas reservoirs are 3-4 times higher than those of conventional boreholes (Fig. 2).
Coal gas
Three different gas types are hidden behind this term: coalbed methane (a gas mix-ture containing 90-95% CH4) which occurs in un-touched seams, coalseam methane (mixed gas with 25-60% CH4 and 7-17% O2) degassing in active coal mines during mining activities into the galleries, and coalmine gas (mixed gas with 60-80% CH4, but no oxygen) from abandoned mines. Generally, coal gas can be generated in or degas from coal seams having reached or exceeding the rank ‘high volatile bitumi-nous B coal’ (which corresponds to 0.7% vitrinite refl ectance). Coal gas is reported to occur in 52 states (BGR 2003), 16 of those – namely the USA, Canada, Mexico, Australia, China, Japan, Germany, Great Britain, Poland, France, the Czech Republic, Bulgaria, Russia, Ukraine, Kazakhstan, and South Africa – recover this type of gas. Highest total resources (= recoverable reserves + in situ resources) are reported to be in Russia (50 T.m35), followed by China (31 T.m3), Canada (12.5 T.m3), USA (10.7 T.m3),
Australia (9.3 T.m3), Ukraine (7 T.m3), Indonesia (6 T.m3), Germany (3 T.m3), Great
Britain (2.5 T.m3), and Poland (1.3 T.m3). The mean worldwide coal gas potential is
estimated to be about 143.2 T.m3. 1.1 T.m3 from these can be characterized as reserves,
meaning they can be economically extracted at present with existing technologies. Highest reserves are reported from the USA (> 400 G.m3), reserves of more than
100 G.m3 exist in Russia, Canada, and China. These elevated amounts are the result
of extensive exploration programs, which – vice versa – allow the conclusion that the worldwide increase of exploration on coal gas will lead to a reserve growth between two and fi ve times.
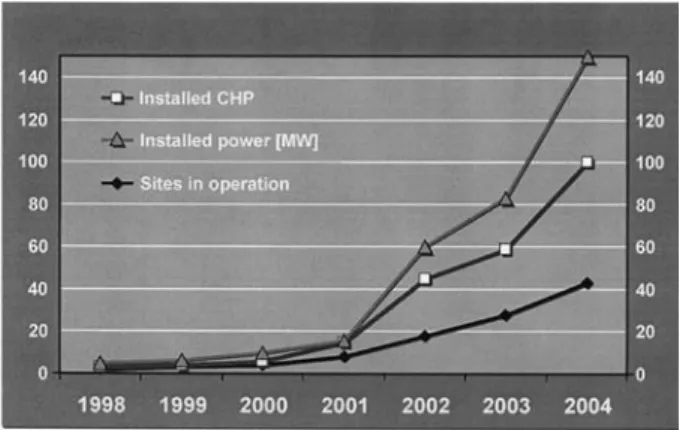
An interesting German development should be mentioned at this point: Stimu-lated by the EEG (Renewable Energy Law) and based on a monthly production 6-7 M.m36 mine gas, more than 40 CHP (combined heat and power plant) have been
in-stalled since 1998 on shafts of abandoned coal mines using the emanating coalmine gas for a monthly generation of > 4 GWh heat and around 10 GWh power (values of 2004) (Fig. 3).
Fig. 2. The development of tight gas in northern Germany is 3-4 times more expensive than the costs of conventional gas (source: Liermann & Jentsch 2003)
5 T.m3 = trillion m3 = 1012 m3 6 M.m3 = million m3 = 106 m3
Gas hydrates
Gas hydrates are ice-like solids that form rigid cage structures under specifi c con-ditions of pressure, temperature, and gas and water concentrations. Marine gas hydrates are stable in pore spaces of sediments in water depths larger than about 300 m beneath the slopes of continental margins. The lower limit of hydrate occurrences is determined by the geothermal gradient, so that the zone of hydrate stability gener-ally is within the fi rst few hundred meters of sediment. Continental hydrates occur in polar permafrost regions in the Arctic and Siberia. Most of the hydrates which have been investigated so far contain methane of microbial origin. Thermogenic hydro-carbons – catched in different hydrate structures – have been detected only at specifi c locations like the Golf of Mexico or the Caspian Sea where neotectonics allow these hydrocarbons to migrate from deep below into the sediments where gas hydrates are built.
Seven major international research programs are underway to characterize the resource potential, to test exploration methods and play concepts, and to develop production technologies. Perhaps 250 million US$/year are currently spent on R&D by the leading national programs of Japan, China, Korea, Taiwan, USA, India, and Canada. Greatest efforts are made by Japan, which have a drilling program of 17 wells in the Nankai trough, off shore.
Although there are still a lot of uncertainties about the production potential, a few facts seem to be generally occurring: gas hydrates are widespread in the marine envi-ronment, but at low concentrations (2-20 vol% of sediment). In contrast, continental hydrate occurrences are by far smaller, but concentrated up to 80%. Beside these differences in gas concentrations, future production technologies will have to deal with the fact that offshore sediments containing hydrates will probably become weak after destabilizing the hydrates (and migration pathways may just collapse) where in permafrost regions may remain stable due to the permafrost. Considering all this, the worldwide resource estimate of 500 T.m3 given by BGR (2003) is most probably
by far too high.
Aquifer gas
Pore space and fractures of sediments in the earth’s crust are usually fi lled with water. Large volumes of natural gas can be dissolved in this ‘ground water’ – the term ‘aquifer gas’ has been created for this type of gas. Gas solubility in water depends on several factors, e. g. pressure, temperature, salinity, and the solubility of other gases. Generally, solubility increases with depth. Under hydrostatic pressure, the solubility of methane in groundwater can exceed 5 m3 per cubic meter of water – under
lithos-tatic pressure even 10 m3/m3. Higher gas concentrations (up to 90 m3/m3) are known
from great depths or overpressured zones. The latter have been an exploration target in the USA.
Aquifer gas can only be produced by pumping water. The productivity of a reservoir depends on the water quality, and especially on porosity and permeability of the sedi-ment. According to calculation given by BGR (2003) the world’s aquifer gas resources are estimated to be between 24 and 1,500 T.m3. Due to high production costs this type
of gas is currently – and for the next decades – beyond economic interest. Conclusions
Non-conventional hydrocarbons have a large potential and will play a growing role in the world’s future energy supply. The relevant oil and gas industry will only be able to produce these if suffi cient capital will be invested, suffi ciently skilled human resource are available, and technological progress is continuously made. Especially technological improvements – and possibly in a faster way than before – are neces-sary to increase recovery rates from already known fi elds, and to develop new, more challenging prospects. Often, non-conventional hydrocarbons are situated in rather remote, sensible environments, or/and can only be exploited with the currently exist-ing technology while emittexist-ing harmful substances. Thus, environmentally sensi-tive technologies for exploration, drilling, production and transportation have to be developed or used.
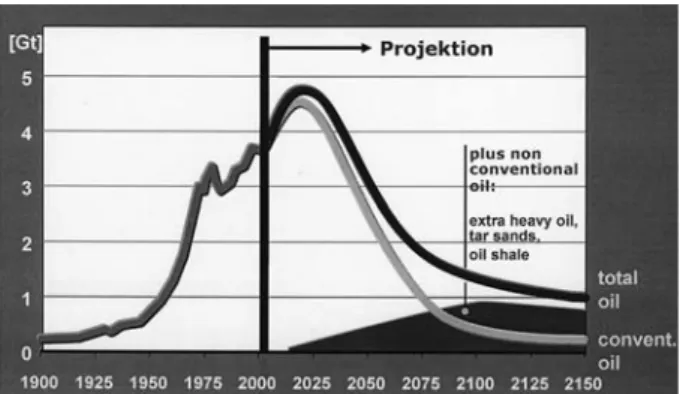
Fig. 4. Historical development and projection of future oil production: conventional oil vs. total oil, including non-conventional oils.
References
BGR – Bundesanstalt für Geowissenschaften und Rohstoffe (2003): Reserven, Resourcen und Verfügbarkeit von Energierohstoffen 2002. – Rohstoffwirtschaftliche Länderstudien, Band XXVIII, 400 S., 128 Abb., 98 Tab, 1 CD; Hannover.
BGR – Bundesanstalt für Geowissenschaften und Rohstoffe (2004): Die Bundesre-publik Deutschland – Rohstoffsituation 2003. – Rohstoffwirtschaftliche Länderstu-dien, Band XXXII, 205 S., 28 Abb., 117 Tab; Hannover.
Cupcic, F. (2003): Extra Heavy Oil and Bitumen. Impact of Technologies on the Recovery Factor. ‘The Challenges of Enhanced Recovery’. – Proceedings of the 2nd
International Workshop on Oil Depletion, Paris, France, May 26-27, 2003 (http://www.peakoil.net/iwood2003/ppt/CupcicPresentation.pdf)
Dusseault, M. B. (2005): Future trends in the oil and gas industry, Canadian heavy oil resources, and new production technologies. – Presentation given at the IEA work-shop ‘Technology Issues for he Oil and Gas Sector’, Paris, January 13-14, 2005. EIA – Energy Information Administration (2004): Energy Outlook. (http://www.eia.
doe.gov/oiaf/ieo/index.html)
IEA – International Energy Agency (2004): World Energy Outlook 2004. – IEA publi-cations; Paris.
Meyer, R.F. & Attanasi, E. (2004): Natural Bitumen and Extra Heavy Oil. – In: World Energy Council, 2004 Survey of Energy Resources, p. 93-117.
Sæter, O.M. (2004): Oil shale – an alternative energy resource? – GEO ExPro, November 2004, p. 26-32.
c o b y v a n d e r l i n d e
What drives the oil price?
There are as many oil price forecasts as there are oil price fl uctuations and unfor-tunately all those forecasts share the same quality: they are way off. Depending on exactly why one needs to know the future oil price level, for instance for investments, determining production costs in consuming industries, etc., the uncertainties with regard to oil price forecasting can be overcome by approaching future oil prices dif-ferently. The approach we employ is to take account of the fundamentals in supply and demand and in additions take account of the upward and downward pressures on the current oil prices in order to determine which direction oil prices will move. For our type of analysis it would be great if we could exactly predict market outcomes, but we can live with less precise outcomes as long as we understand the direction of price movements and why.
Our approach is to make an assessment of both the international political and economic pressures on the oil price and relate these to the current oil market circum-stances. The volatility of oil prices in the last decade is a refl ection of both the matu-rity of the international oil market (expressed in relatively low yearly average world growth compared to other industries) and the political and economic uncertainties about demand and supply. The surprising surge in Chinese oil demand in 2004 and the inability to accommodate this increasing demand at relatively stable market prices is an excellent example of both short term changes in the market balance and the inability of the market to prepare for such fl uctuations. The lack of idle capacity in the market, which can be partly seen as a refl ection of past oil price expectations, amplifi ed price fl uctuations. Oil prices are a refl ection of both long and short term factors, national and international developments, political and economical changes, and fundamental and psychological movements in the market. For our analysis we look, among other things, at:
Economic factors:
– Demand and supply (f.i. strong demand growth U.S., China in 2004) – Transport chokepoints
– (Lack of) Investments – (Uncertainties) Reserves
– Production/refi ning capacity constraints – Monetary developments
Geopolitical factors:
– Political unstable producer countries – Import dependence of consuming countries – Competition between consumer states
– Security: infrastructure vulnerable to terrorism Demand and supply
The year 2004 was a memorable year for oil prices both in terms of the nominal level of oil prices (over $50 a barrel) and the speed at which prices increased. Both develop-ments indicated that demand and supply were very tight. This tight market can be explained by the unexpected surge in demand of China and the robust recovery of oil demand in other Asian economies and the US. The surge in demand very quickly pressured OPEC countries to abandon the production restrictions. After June 2004, world production was approaching its peak capacity. Also OPEC countries had only very limited idle capacity left at their disposal. It was clear that increasing demand had not been fl owed by a steady increase in supply, at least not in the OPEC coun-tries. Non-OPEC supply has increased substantially in the past 25 years but growth has levelled off. Given the distribution of reserves the 2004 oil market made it very clear that future increases in production have to come from OPEC countries. OPEC’s role of residual or swing supplier of the world market and manager of oil prices requires suffi cient spare capacity to fulfi l this role. However, investing in spare capac-ity is very costly and very likely the costs cannot be recouped in the market. The fact that Saudi Arabia had to keep up this capacity for use within 3 months for a very long period of time can become a burden when competing domestic expenditures begin to take preference. Although OPEC countries attach great importance to their role as swing producer, both the ability and the solidarity to carry these costs as a group has been low. Most of these costs were carried by Saudi Arabia, United Arab Emirates and in the past Kuwait. The other OPEC members have had economic and political diffi culties to keep up production and expenditures in the oil industry without this additional burden.
In 2004 the oil market was so tight that every barrel of lost production had an im-mediate upward effect on the oil price. The fact that commercial oil stocks were low meant that price increases could not be cushioned in consumer markets. Notable disruptions of supply in 2004 came from the domestic political unrest in Venezuela and Nigeria, strikes in Norway, the highly unstable security situation in Iraq, storms in the Gulf of Mexico and the problems of surrounding Yukos. Since every barrel counted, supply disruptions, even minor ones, pushed prices upward. In the second half of 2004, the thirst for oil was so large that consuming countries engaged more actively in competition for future oil fl ows.
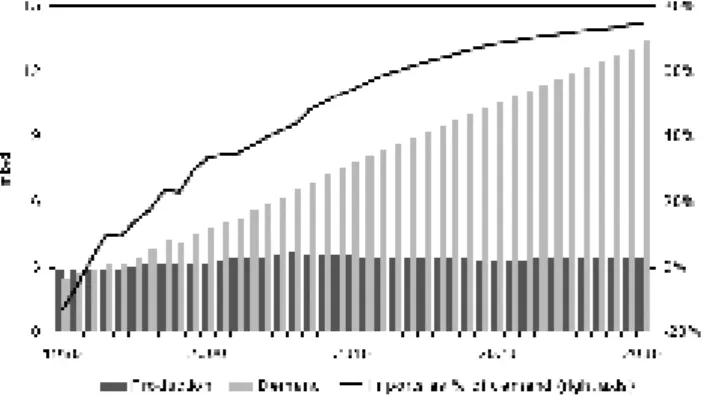
Fig. 1. Chinese oil demand outlook to 2020 (left-scale: mbd), source: IEA
Given the upward prediction of world demand and the time-lag to increase produc-tion to meet these new demand levels, it is likely that prices will be substantially high-er than the oil price band that OPEC ($22-28 phigh-er barrel) employed between 2000 and 2004. According to the IEA World Energy Outlook, the world is expected to consume 125 million barrels per day (mbd) in 2030, compered to 80 mbd in 2004. The main drivers behind future demand growth continue to be China and India, whose econo-mies grow some 2-3 times faster than the developed Western econoecono-mies. Although China and India have only a modest energy consumption per capita compared to Western countries – China uses only 0.75 litres of oil per capita, while this is eleven litres in the U.S. – its energy intensity (energy input per unit of GDP) is actually four times higher than Western economies. This means that every percentage of growth of the Chinese GDP will be accompanied by an energy input that is four times higher than that of the U.S. and 5-6 times more than that of the E.U.
Production and investments
The challenge for the world is both to meet new oil demand and, crucially, at the same time replace the production capacity in mature oil fi elds that cover current de-mand levels. Large investments are required to meet this double challenge. Although many experts claim that the amount of required investments should not pose a prob-lem, the shift in these market from predominantly investments in OECD countries to less secure energy investment markets in the Persian Gulf, Caspian Sea region and Russia, may pose a problem to securely employ this capital. Particularly when inter-national oil companies with deep investment pockets of their own, cannot participate in these projects, banks will demand additional securities to express the higher level of risk. This problem is connected to limited access for foreign direct investments in a large number of OPEC countries and the fact that national oil companies hold a monopoly on exploration and production. The IEA calculated that only 35% of the current proven oil reserves are accessible to foreign investors. The remaining share belongs to national oil companies. Furthermore, countries that have opened up for foreign direct investments and have a potential for capacity enlargement, like Russia, are still considered to have an unstable investment climate. Legal stability and
owner-ship rights are poorly developed, as the Yukos affair has demonstrated. In West-Af-rica, political unrest forms a barrier for investment.
Choke points
Infrastructural problems may occur in the future. Already a few major chokepoints in trade routes exist and traffi c is still increasing. Already some 15 mbd of oil passes through the Straits of Hormuz and some 3 mbd passes through the Bosporus. There inevitably comes a point that these seaways can either not handle more traffi c or the energy traffi c becomes more vulnerable to criminal or terrorist attacks: particularly if we bear the expansion of gas trade in the form of Liquifi ed Natural Gas (LNG) in mind and that these LNG-ships will have to use the same sea routes (Strait of Hor-muz, Suez canal). Therefore a variety of investments have to be made to accommo-date future shipping of oil and gas.
The distribution of proven world reserves of oil is heavily biased towards the Persian Gulf. Since 1974, the production share of the Persian Gulf countries has decreased due to the particular role of some countries in OPEC and the devastation to production capacity due to war in the region (Iran, Iraq, Kuwait). The oil crisis of 1973/1974 was followed by intensifi ed exploration and production activities outside the OPEC countries. The market share of Non-OPEC oil increased substantially to the detriment of OPEC’s share in world trade and production. It is clear, however, that in the future a greater call on OPEC, and in particular on the Persian Gulf oil, must be made to satisfy growing demand. Some important Non-OPEC oil regions are reaching maturity and despite intense investments, growth of Non-OPEC supply will be modest compared to the need of new supplies.
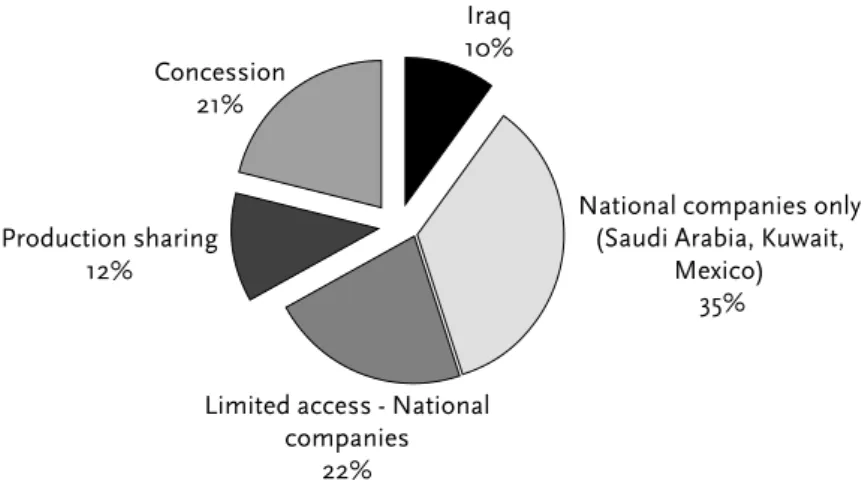
Fig. 2. Foreign investment possibilities (source: IEA 2004)
National companies only (Saudi Arabia, Kuwait,
Mexico) 35%
Limited access - National companies 22% Production sharing 12% Concession 21% Iraq 10%
Fig. 3. Proven world oil reserves according to BP (source: BP statistical review of energy 2004)
Given the fact that the lion’s share of the remaining proven oil reserves in the world are found in the countries around the Persian Gulf, their share in world production must increase. In 2004 uncertainty with regard of the size Persian Gulf reserves appeared. The fact that reserves remained unchanged for years and little transpar-ency is offered about the quality of mature fi elds, raised doubts about the potential for production capacity expansion. Also reserve fi gures are used to determine the distribution of production quota in OPEC and could have led in the past to reserve infl ation. Nevertheless, even with uncertainties about reserves, it is clear that the bulk of the reserves reside under the countries of the Persian Gulf.
Security of supply
The distribution of future demand and supply leads to one conclusion: the import dependency of major consuming countries/regions is not only set to increase but will also be concentrated on but a few suppliers. This will heighten concerns about secu-rity of supply. It is seen as both politically and economically undesirable to import oil from only a few suppliers. Security of supply concerns are further sharpen because consumer countries must increasingly compete for supplies. The buyers market of the 1980s and 1990s has switched to a seller market. Given the political tension in the world, politics matter again and oil fl ows could again become politically deter-mined. For countries that had banked on purchasing oil in the international market place, where oil had been stripped of its nationality, this might be a crucial change in international oil relations.
The expected dependence on OPEC oil makes the consumer countries also more vulnerable to political and economic fl uctuations in producer countries. The OPEC production policies have become more and more income driven when government budgets needed to be fi nanced. Most OPEC countries have a relatively young popula-tion and the pressure on government to create jobs is very large. Furthermore, the
Persian Gulf countries have seen their security budgets increase substantially in the past few years. Based on these domestic spending needs, many OPEC countries (also Saudi Arabia) need at least a real oil price of about $25 to balance their budget. The depreciation of the dollar, therefore, created additional pressure on the oil price because OPEC countries wanted to compensate for the loss of purchasing power.
Currently, the EU imports about 55% of its oil consumption, compared to 35% in North America and China and 90% for Pacifi c Asia. By 2030 these fi gures will have dramatically changed. The EU will import about 85% of consumption, North Ameri-ca about 55%, China 80% and Pacifi c Asia 95%. Although the North AmeriAmeri-can fi gure of 55% seems relatively modest compared to the other consumer regions/countries, in absolute volumes the imports will increase to 18-20 mbd (depending on demand growth), by far the largest volume of all countries.
The policy response for consumer countries could be to diversify to other fuels, such as gas. Gas reserves are substantial, although also relatively far removed from the market, and the emission of CO2 is lower than oil. Although coal reserves are abundant, environmental policies steer demand away from coal. In the future, under the pressure of security of supply problems in oil and gas and environmental needs, clean coal technologies could become an important instrument to address security of supply problems. Renewable and nuclear energy could to a certain extent help manage the import dependency. At the moment, the high rate of dependency of the transportation sector implies that oil will remain an important fuel in our economies for some time to come. The driving forces of the oil market will therefore require our full attention in the next decades!
h o wa r d c h a s e
Energy geopolitics and investment
Introduction
What are the recent events that are shaping our thinking on energy security? As we all know, the price of oil on the international market rose sharply over the last year from $28 to a peak of over $50/bbl before falling back to under $40/bbl today (Dec. 2004). To understand the reasons for these shifts you have to look back at the events of the last fi ve years.
What has changed and what are the consequences of those changes?
Back at the end of the 1990s we were all accustomed to an oil price which averaged a reasonably stable $18 a barrel with only occasional excursions beyond $20 per barrel, and one brief fall at the end of the 1990s to $10. That was the picture for a decade, from the end of the fi rst Gulf war onwards. Throughout the 1990s technological ad-vances extended the range of economic production. Adad-vances in seismic technology reduced the risks and costs of exploration. Advances in deep water technology opened up new areas for exploration and development. Advances in reservoir management technology pushed up recovery factors. And political change also opened new doors. International companies were able to invest in areas previously closed to them – in-cluding Russia, the Caspian, Central Asia and China. These developments created a situation in which costs were falling and in which prices were moderate and seemed more likely to decline than increase. The factor which changed the outcome was the decision in April 2000 by the OPEC member states to use their market power to set a price framework for oil at around $25 a barrel – varying up or down from that level by no more than $3 a barrel. That was a major step, and OPEC’s successful manage-ment of their production kept prices at those levels throughout the period from 2000 to the end of 2003.
The next fundamental change came on the demand side. The growth in demand for oil in 2003 and 2004 has been so strong that - for the fi rst time in 30 years - the rate of oil demand growth worldwide has almost matched the growth of GDP. That is the context in which we have seen the sharp price movements of the last twelve months. That rise in global demand has been led by China, which remarkably has increased its imports of oil by 400% in just four years. Other developing economies have also contributed to the overall demand growth.
For most of the last two decades the market has operated with around 3 million barrels per day of spare capacity. This year that spare capacity fell at times to around 1 million barrels per day – which is less than production from a number of areas where continuity of supply has been threatened by disruptions – including Iraq, Nigeria