RIVM report 250912004/2005 Biodiversity in Bacillus cereus A. Pielaat, M. Fricker, M.J. Nauta, F.M. van Leusden
Contact:
Annemarie Pielaat
MGB; Microbiologisch laboratorium voor gezondheidsbescherming
annemarie.pielaat@rivm.nl
This investigation has been performed in cooperation with the partners as recognized in the acknowledgements by order and for the account of the Fifth European Community
Framework Programme, within the framework of project QLK1-CT-2001-00854, Bacillus
cereus: Preventing Bacillus cereus foodborne poisoning in Europe; detecting hazardous
strains, tracing contamination routes and proposing criteria for foods. And, by order and for the account of Food and Consumer Product Safety Authority (VWA), within the framework of project 250912, Quantitative research of Bacillus cereus within the scope of hazard characterization and exposure assessment.
RIVM, P.O. Box 1, 3720 BA Bilthoven, telephone: 31 - 30 - 274 91 11; telefax: 31 - 30 - 274 29 71, E-mail address: annemarie.pielaat@rivm.nl
Het rapport in het kort
In het kader van een EU project zijn door de verschillende partners experimenten uitgevoerd om inzicht te krijgen in de variatie in eigenschappen van B. cereus stammen welke bijdragen aan de mate van virulentie. Hiertoe zijn 100 B. cereus stammen geselecteerd en
eigenschappen zoals toxine vorming, hitteresistentie, ontkieming en groeicurves bepaald. De experimentele gegevens zijn in dit rapport samengevat en geanalyseerd om de biodiversiteit binnen en tussen bepaalde karakteristieke B. cereus groepen in kaart te brengen. De 100 stammenset is daarvoor opgedeeld in 4 groepen, nl. omgevings-, voedsel-, diarree-, en braakstammen. Resultaten laten zien dat de biodiversiteit in B. cereus groot is, zowel tussen als binnen groepen. Doch, braakstammen vormen veelal een uitzonderlijke groep. Zij groeien niet bij temperaturen ≤ 7 °C en hun sporen zijn beter bestand tegen verhitting vergeleken met de andere groepen. Zij vormen dan ook snel een risico wanneer verhitte producten buiten de koelkast worden bewaard. Diarreestammen groeien juist wel bij 7 °C en, hoewel hun sporen minder resistent zijn, ze overleven nog steeds pasteurisatieprocessen. Zij kunnen groeien als koelkasttemperaturen de 7 °C bereiken, vooral in voedingsmiddelen met een neutrale pH. Wanneer normale voorzorgsmaatregelen in acht worden genomen zal de groei van deze stammen beperkt zijn, maar er is een smalle veiligheidsmarge. Statistische analyses wezen uit dat 1- goed gereguleerde koelkasttemperaturen (< 7 °C, ter voorkoming van groei
diarreestammen tijdens bewaren), 2- het produceren van niet pH neutrale producten en 3- snel afkoelen (middels bijvoorbeeld. opdelen in kleine porties) van grote hoeveelheden voorbereid voedsel (ter voorkoming van groei braakstammen en daarmee gepaard gaande braaktoxine productie) bijdragen aan het voorkomen van voedselinfecties door B. cereus in Europa.
Trefwoorden: voedselmicrobiologie, voedselcriteria, contaminatieroute, braaktoxine,
Abstract
Experiments have been performed by different partners to identify variability in properties of
Bacillus cereus strains that contribute to the extent of their virulence as part of an EU project.
To this end, 100 B. cereus strains were selected and screened for biological properties, such as toxin production, heat resistance, germination and growth curves. This report gives a summary of the experimental data and subsequent analysis to identify the biodiversity within and between certain characteristic B. cereus groups. The 100 strain set was, therefore, divided into 4 categories, i.e. environmental, food, diarrhoeal and emetic strains. Results show that the biodiversity in B. cereus is large, both between and within groups. Yet, emetic strains often form a distinct group. They do not grow at temperatures ≤ 7 °C and their spores are more heat resistant compared to the other groups. Emetic strains will, therefore, form a risk when heated products would be kept outside the fridge. Diarrhoeal strains do grow at 7 °C and, although their spores are more heat resistant, still they will survive pasteurization processes. They can grow when fridge temperatures reach 7 °C, especially in food products having a neutral pH. So, growth of diarrheal strains can be prevented when standard safety measures are being considered, still, this safety margin is small. Statistical analyses revealed that 1) well regulated fridge temperatures (< 7 °C, to prevent growth of diarrhoeal strains during storage), 2) producing food products with a non-neutral pH value and 3) portioned chilling to rapidly lower the temperatures of precooked food (to prevent growth of emetic strains and, with that, emetic toxin production) will contribute to prevent B. cereus foodborne poisoning in Europe.
Keywords: food microbiology, hazardous strains, contamination route, emetic toxin,
Contents
Samenvatting 7
Summary 8
1. Introduction 9
2. Brief overview of experimental assessments 11
3. Experimental results and Data analysis 13
3.1 Growth temperatures 13 3.1.1 Experimental results 13 3.1.2 Data analysis 15 3.2 Toxin production 21 3.2.1 Experimental results 21 3.2.2 Data analysis 23 3.3 Heat resistance 26 3.3.1 Experimental results 26 3.3.2 Data analysis 30 3.4 Germination 35 3.4.1 Experimental results 35 3.4.2 Data analysis 38 3.5 Growth characteristics 40 3.5.1 Experimental results 40 3.5.1.1 Model fitting 40 3.5.1.2 Parameter estimates 45 3.5.2 Data analysis 53
3.6 B. cereus and food source 58
3.7 Correlation between physical features of B. cereus strains 59
4. General conclusions 65 4.1 Growth temperatures 65 4.2 Toxin production 65 4.3 Heat resistance 66 4.4 Germination 67 4.5 Growth characteristics 67
4.6 Correlation between physical features of B. cereus strains 68
5. Recommendations 69
5.1 Environmental strains 69
5.2 Food strains 70
5.3 Emetic strains 70
6. Discussion 73
References 75
Acknowledgements 77
Samenvatting
Algemeen: Dit rapport is tot stand gekomen in het kader van een EU project met als doel voedselvergiftiging door de bacterie Bacillus cereus in de toekomst te kunnen reduceren.
B. cereus is een voedselgerelateerde pathogeen waarvan de eigenschappen die bijdragen aan
de virulentie nauwelijks gekwantificeerd zijn. Dit is mede te wijten aan de grote biodiversiteit tussen B. cereus stammen. De meeste stammen zijn waarschijnlijk niet of mild pathogeen. Daarnaast bestaan echter ook zeer virulente stammen die hoge concentraties braak- en/of enterotoxines kunnen produceren.
Dit rapport: Doel van dit onderzoek is inzicht te krijgen in de biodiversiteit van B. cereus en met deze kennis te komen tot aanbevelingen ten aanzien van het reduceren van dit
microbiologische voedselprobleem.
Methode: Biofysische eigenschappen welke experimenteel zijn onderzocht door partners binnen dit project omvatten onder andere minimum en maximum groeitemperatuur, toxineproductie, hitteresistentie, ontkieming en het bepalen van groeicurven voor een geselecteerde groep van 100 B. cereus stammen. Om potentiëel gevaarlijke stammen te kunnen identificeren zijn sommige data gebruikt om biologisch relevante parameterwaarden te schatten. Zo zijn decimale reductietijden (D-waarden) en tijd tot eerste decimale reductie (d-waarden) geschat uit hitteresistentiedata en zijn aangeleverde groeicurves gebruikt om lag-tijden en groeisnelheden te schatten. Om vervolgens te komen tot een waardevolle analyse met betrekking tot het identificeren van potentiëel belangrijke contaminatieroutes is de 100-stammenset opgedeeld in 4 groepen, te weten: diarree-, braak, omgevings- en
voedselstammen.
Resultaten: Resultaten geven aan dat de biodiversiteit in B. cereus groot is zowel binnen als tussen groepen. Doch, braak- en diarreestammen vormen vaak een aparte groep met
betrekking tot biologische eigenschappen in relatie tot voedselveiligheid. Braakstammen groeien namelijk niet bij temperaturen ≤ 7 °C. Daarnaast zijn hun sporen veel resistenter tegen hittebehandeling vergeleken met de andere groepen. Het buiten de koelkast bewaren van verhitte producten brengt dan ook een verhoogd risico op voedselvergiftiging door braakstammen met zich mee. Zo’n 75 % van de onderzochte diarreestammen groeien bij 7 °C en, ook al zijn hun sporen minder resistent, pasteurisatieprocessen kunnen ze overleven. Tevens is de groeisnelheid bij verschillende temperaturen optimaal wanneer het gaat om voedingsmiddelen met een neutrale pH.
Aanbevelingen: Statistische analyses hebben geleid tot de volgende aanbevelingen ten aanzien van het voorkomen van B. cereus voedselvergiftiging in Europa. Tijdens bewaren kan groei van diarreestammen voorkomen worden door koelkasttemperaturen beneden de 7 °C te houden. Op basis van minimale groeitemperaturen van braakstammen (≥ 10 °C) zal voorgekookt voedsel zo snel mogelijk afgekoeld moeten worden door middel van
bijvoorbeeld geportioneerd koelen om groei, en daarmee gepaard gaande
braaktoxineproductie, te voorkomen. Om directe bacteriegroei te voorkomen moet voedsel een niet neutrale pH hebben.
Summary
General: This report describes research within the framework of a EU project with a focus on the future prevention of food poisoning caused by the bacterium Bacillus cereus. Little is known about the characteristics that contribute to virulence of this food borne pathogen. This is partly due to the huge biodiversity in B. cereus strains. Most strains are presumably
innocuous or mildly pathogenic. Still, some strains are able to produce high concentrations of emetic or enterotoxins.
This report: Main goal of this study is to get insight in the biodiversity of B. cereus and, with this knowledge, make recommendations on how to reduce this food microbiology problem.
Method: Partners in this project have performed several experiments in order to assess biophysical properties. For example, minimum and maximum growth temperatures, toxin production, heat resistance, germination and growth curves were assessed for a selected set of 100 B. cereus strains. Some of the data were used for parameter estimation to quantify
biologically relevant properties. That is, decimal reduction times (D-values) and times until first decimal reduction (d-values) were estimated from heat resistance data. In addition, available growth curves were used to estimate lag-times and growth rates. Furthermore, the 100 strain set was subdivided into 4 categories, i.e. diarrhoeal, emetic, environmental and food strains, to identify potential important contamination routes.
Results: Analysis show a large biodiversity both within and between groups of B. cereus strains. Yet, emetic and diarrhoeal strains often form a distinct group with respect to the tested biophysical characteristics in relation to food safety. Emetic strains do not grow at temperatures ≤ 7 °C. Furthermore, their spores are more heat resistant compared to the other groups. This results in a high risk on emesis when preheated food products are being kept outside the fridge. About 75 % of the studied diarrhoeal strains do grow at 7 °C and, although their spores are less heat resistant, they can survive pasteurization processes. Also, growth rates appeared to be optimal at different temperatures in food products with neutral pH. Recommendations: Statistical data analysis showed that preventing B. cereus food borne poisoning in Europe would primarily ask for: 1- fridge temperatures below 7 °C to prevent growth of diarrhoeal strains during storage, 2- minimal growth temperatures of emetic strains (≥ 10 °C) plead for a rapid temperature decrease of precooked food by, for example,
portioned chilling in order to prevent growth and, with that, toxin production of emetic strains and 3- producing food products with a non neutral pH-value in order to prevent instant
1.
Introduction
Bacillus cereus is a foodborne pathogen consisting of a huge variety of strains. Its hazard is
characterized by the production of both emetic and enterotoxins and survival under extreme conditions due to spore formation (Ehling-Schulz et al., 2004; Granum, 1997; Kotiranta et al., 2000; Wijnands et al., 2002). Still, little is known about the virulence potential in relation to characteristics of specific strains.
Therefore, 100 strains were selected (see Appendix 1) to assess key factors affecting
virulence of B. cereus. This selection was based on the characterisation of an earlier selected strain set (Ehling-Schulz et al., 2005) and includes strains from the environment, different food products and food poisoning outbreaks. Partners in this project have done several
experiments to both qualify and quantify the virulence of different strains. Characterisation of the 100 B. cereus strains included:
i. Growth temperatures ii. Potential toxin production iii. Heat resistance
iv. Germination
v. Growth characteristics
This report gives a general overview of the experimental results obtained by the different laboratories concerning above mentioned assessments. In addition, parameter estimates were performed using the heat resistance data and provided growth data to extract biologically relevant strain characteristics from the data. To ultimately identify remarkable strain properties in relation to sources, strains were divided into four categories. That is, strains selected from:
1- the environment (n=15), 2- food products (n=35) and
strains selected from food poisoning cases, i.e.
3- strains shown to have caused emesis (emetic strains, n=10) and 4- strains shown to have caused diarrhoea (diarrhoeal strains, n=40).
Most of the data and further analysis are presented according to these categories. Results, as found during summarising the data according to B. cereus group 1 to 4, were subsequently subjected to statistical analysis. Our goal was to link the results of different bacteriological assessments to strain origin in order to improve hazard identification within the B. cereus group. The key question to be answered to accomplish this goal is:
→ Can hazardous strains within the B. cereus group be traced based on specific biophysical characteristics?
In order to get insight in what the actual assessments represent and how the experimental results were obtained, a brief overview of the experiments is given in the next section. A short method description and results of the different assessments will be summarised in subsequent separate subsections and remarkable results will be pointed out. Then, an analogous order of subsequent sections will reveal whether remarkable
associations/differences between the strain categories are actually supported by statistical analysis. Finally, general conclusions will be followed by recommendations about potential hazards associated with B. cereus contamination in Europe.
2.
Brief overview of experimental assessments
Table 1 gives a brief overview of the assessments done by the different institutes on the 100 selected B. cereus strains. The experiments will be explained in more detail in the separate sections.
Table 1 Laboratories (2nd column) and their assessments (1st column) on the 100 selected Bacillus
cereus strains.
Selection of representative strains
FTIR1 analysis of strains
Minimum growth temperature
Technical University Munich (TUM) and National Institute for Agronomical Research (INRA)
TUM TUM
Maximum growth temperature TUM
Effect temperature on growth TUM
Effect pH on growth Emetic toxin production by:
TUM - PCR-800/NRPS2 (qualitative, +/- values) TUM
- Cereulide LC-MS3 (qualitative, +/- values) University of Helsinki (UH-DACM)
- Cytotoxicity test (quantitative, titer) Enterotoxin production4:
Ludwig Maximilians University (LMU)
- Overall (quantitative (titer)) LMU
- HBL-L2 production (quantitative (titer)) LMU - HBL-B production (quantitative (antigen titer) LMU - NHE-A production (qualitative, +/- values (antigen) LMU - NHE-B production (quantitative (antigen titer)
Enterotoxin gene detection4,5 by:
LMU - PCR (detecting ≥ 1 gene of the Hbl-operon (qualitative,
+/- values)
INRA - PCR (detecting ≥ 1 gene of the Nhe-operon (qualitative,
+/- values by PCR)
INRA - PCR ( cytK gene detection (qualitative, +/- values) INRA
Heat resistance INRA
Germination RAPD6
INRA
Swedish Diary Association (SDA)
Adhesion capacity Norwegian School of Veterinary Science (NVH)
1Fourier transformed infrared spectroscopy (Kummerle et al., 1998).
2Cereulide is the emetic toxin produced by B. cereus. The gene complex responsible for cereulide production
(NRPS, Nonribosomal peptide synthetase gene complex) has recently been described by Ehling-Schulz et al. (2005).
3Liquid chromatography - mass spectrometry (Haggblom et al., 2002).
4 Bacillus cereus can produce several enterotoxins, three of which are known to cause disease, i.e. HBL, NHE
and CytK. From the four genes that form the HBL operon, three encode the three enterotoxin proteins, i.e. HBL-L2, HBL-L1 and HBL-B. The NHE operon consists of three genes encoding for the enterotoxin proteins
NHE-A, NHE-B and NHE-C. The CytK toxin is produced by expression of the cytK gene. Expression of the HBL, NHE and CytK genes is regulated by the PlcR gene (Okstad et al., 1999; Lund et al., 2000; Granum et al., 1999).
5(Guinebretiere et al., 2002).
6Random amplified polymorphic DNA analysis (Andersson et al., 1999).
Appendix 1 gives a summary of a majority of the assessments as named in Table 1. That is, Appendix 1 includes those assessments that were provided before February 1st, 2004 and used for summarizing purposes and further statistical analysis as described in this report.
Results as presented on the emetic strains, however, needs some further explanation. That is, the TUM and UH-DACM did experiments in which 17 of the 100 tested strains were detected to possess the gene related to emetic toxin production. In addition to the 10 food poisoning strains, 5 food strains and 2 environmental strains showed to possess the gene. Results and analysis on “emetic strains” will, therefore, be presented for both the n=17 and n=10 strains according to this argument throughout the report.
3.
Experimental results and Data analysis
3.1
Growth temperatures
3.1.1 Experimental results
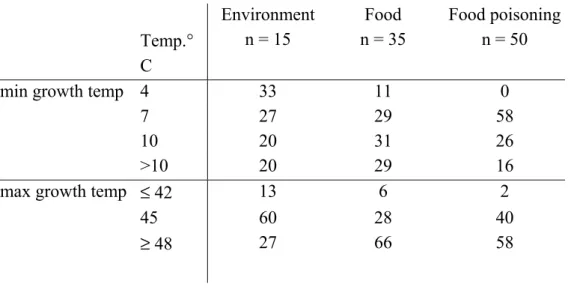
Table 2 summarizes the results on minimum and maximum growth temperatures of the 100 selected B. cereus strains ordered by origin (Environment, Food and Food poisoning). Most notable result is that the strains selected from food poisoning cases show no growth at 4 °C and a majority of these strains have a minimum growth temperature at 7 °C. Detailed information on the behaviour of the food poisoning strains can be seen in Table 3 where food poisoning strains are divided into emetic and diarrhoeal categories. Note that, as explained in Section 2, the emetic category in Table 3 shows both the results on growth temperatures for the strains possessing the emetic toxin gene (n=17, see Appendix 1), and the results for a subgroup of these strains which actually have shown to cause emesis (n=10, see Appendix 1). Yet, all emetic strains seem to need temperatures of ≥ 10 °C to be able to grow. The most frequent minimum growth temperature for diarrhoeal strains seems to be 7 °C.
Environmental strains seem to grow less well at temperatures ≥ 48 °C, compared to the other strains.
Table 2 Minimum and maximum growth temperatures of B. cereus strains. Values are expressed in percentages of total strain number (n) per growth temperature according to category.
Environment Food Food poisoning
Temp.° C
n = 15 n = 35 n = 50
min growth temp 4 33 11 0
7 27 29 58
10 20 31 26
>10 20 29 16
max growth temp ≤ 42 13 6 2
45 60 28 40
≥ 48 27 66 58
A further characterization on growth temperatures can be based on the division of strains in mesophilic and psychrotolerant categories.
Mesophilic strains are here defined by growth temperatures ≥ 10 °C. Psychrotolerant strains can grow at low temperatures (< 10°C). Table 3 shows that, according to this definition, all emetic strains are mesophilic and a majority of the diarrhoeal strains seem to have
psychrotolerant traits.
Another method to distinguish psychrotolerant from mesophilic strains is by analysing RAPD patterns (Andersson et al., 1999). However, classification of B. cereus in psychrotolerant and mesophilic strains based on RAPD-patterns were not at all consistent with classifications based on growth temperature ranges. Therefore, division of strains based on RAPD patterns were omitted in this research.
Table 3 Minimum and maximum growth temperatures of B. cereus strains specified by the two food poisoning categories. Values are expressed in percentages of total strains (n) per growth temperature according to category.
Emetic1 Diarrhoeal
Temp. °C
n = 17 (n=10) n = 40
min growth temp 4 0 (0) 0
7 0 (0) 72
10 41 (60) 18
>10 59 (40) 10
max growth temp ≤42 0 (0) 2
45 0 (0) 50
≥48 100 (100) 48
1 Test results using either the n=17 or n=10 emetic strains (see Section 2. for explanation)
A general overview of Tables 2 and 3 on the link between origin of strain and growth temperature ranges is shown in Figure 1a,b. It can immediately be seen that the food
poisoning strains used in this study do not grow at 4 °C and, on top of that, strains associated with emesis do not grow at 7 °C. All tested emetic strains have maximum growth
Figure 1a,b Percentages of B. cereus strains in the different growth temperature groups categorized by strain origin. Figure a represents minimum growth temperature groups. Figure b represents the maximum growth temperature groups.
3.1.2 Data analysis
General differences in minimum and maximum growth temperatures between categories of
B. cereus strains were shown in Table 2. A test for independence (X2-test, or Goodness-of Fit
test) can reveal significant discrepancies in growth temperatures among the categories. This would be useful to get insight in potential hazardous strains for consumers. A first hypothesis is: 0% 25% 50% 75% 100% Environment, n=15 Food, n=35 Food poisoning, n=50 Emetic, n=17 Emetic, n=10 Diarrheal, n=40 <=42 C =45 C >=48 C 0% 25% 50% 75% 100% Environment, n=15 Food, n=35 Food poisoning, n=50 Emetic, n=17 Emetic, n=10 Diarrheal, n=40 4 C 7 C 10 C >10 C 1a 1b
• H0: Proportion of B.cereus strains in each temperature group is the same for each category.
In order for a X2-test to be appropriate, the following assumptions have to be taken into account, i.e.:
1- Observed counts are based on a random sample and
2- Sample size is large, that is, every expected count (obtained when the null hypothesis is true) is at least 5.
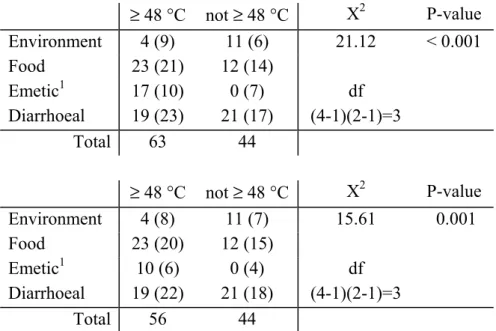
Since not all expected counts in the minimum growth temperature groups are ≥ 5 , they were combined into two groups, i.e. ≤ 7 °C and ≥ 10 °C. Table 4 shows the test results. With a P-value < 0.001, H0 is rejected. There is strong evidence to support the claim that the
proportions of B.cereus strains which have a minimum growth temperature ≤ 7 °C and ≥ 10 °C is not the same for environmental, food, emetic and diarrhoeal strains. Emetic and diarrhoeal strains have the largest weight in this difference (Table 4). Emetic strains do not seem to grow at low (fridge) temperatures, whereas the number of diarrhoeal strains having low (7 °C) minimum temperatures is higher than the number having minimum temperatures ≥ 10 °C.
Table 4 Observed (Expected) strains per minimum growth temperature group and subsequent results of a X2-test to reveal differences in minimum growth temperatures of B. cereus strains between
strain categories. n ≤ 7 °C ≥ 10 °C X2 P-value Environment 15 9 (7) 6 (8) 27 < 0.001 Food 35 14 (17) 21 (18) df Emetic 171 0 (8) 17 (9) (4-1)(2-1) = 3 Diarrhoeal 40 29 (19) 11 (21) n ≤ 7 °C ≥ 10 °C X2 P-value Environment 15 9 (8) 6 (7) 20 < 0.001 Food 35 14 (18) 21 (17) df Emetic 101 0 (5) 10 (5) (4-1)(2-1) = 3 Diarrhoeal 40 29 (21) 11 (19)
1 Test results using either the n=17 or n=10 emetic strains (see Section 2. for explanation)
A similar test was performed for maximum growth temperatures (Table 5). The test revealed that the number of strains in the two maximum growth temperature categories are
disproportionally spread over strain categories. More specific, the number of environmental and emetic strains with growth temperatures ≤ 45 °C and ≥ 48 °C are not in the same order as the numbers one would expect when H0 was true. This implies that environmental strains have relatively low maximum growth temperatures, whereas emetic strains feel comfortable at high temperatures.
Table 5 Observed (Expected) strains per maximum growth temperature group and subsequent results of a X2-test to reveal differences in maximum growth temperatures of B. cereus strains
between strain categories.
n ≤ 45 °C ≥ 48 °C X2 P-value Environment 15 11(6) 4(9) 20.50 < 0.001 Food 35 13(15) 22(20) df Emetic 171 0(7) 17(10) (4-1)(2-1) = 3 Diarrhoeal 40 21(17) 19(23) n ≤ 45 °C ≥ 48 °C X2 P-value Environment 15 11(7) 4(8) 14.83 0.002 Food 35 13(16) 22(19) df Emetic 101 0(5) 10(5) (4-1)(2-1) = 3 Diarrhoeal 40 21(18) 19(22)
1 Test results using either the n=17 or n=10 emetic strains (see Section 2. for explanation)
Results from the above, general, X2-tests ask for more elaborated statements about the behaviour of B. cereus strains at population level based on the 100 tested strains. Therefore, more statistical analyses were performed on the environmental strains, the diarrhoeal strains and on emetic strains in particular.
First a general hypothesis test concerning minimum growth temperatures of the different strain categories at 7 °C was performed, following:
• H0: Proportion of B.cereus strains that have a minimum growth temperature at 7 °C is the same for each category.
A minimum growth temperature of 7 °C shows to be disproportionately divided among categories (Table 6). Diarrhoeal strains have disproportionately more and emetic strains show to have disproportionately less strains with a minimum growth temperature at 7 °C compared to the other categories. This means storage temperatures for food potentially containing potentially diarrhoeal strains can be very critical.
Another more general question to answer is whether there is a difference between environmental, food, emetic and diarrhoeal strains concerning a maximum growth temperature of ≥ 48 °C. The null hypothesis for this particular question is:
• H0: Proportion of B.cereus strains that have a maximum growth temperature of ≥ 48 °C is the same for each category.
Table 7 shows the distribution of strains per category having a growth temperature ≥ 48 °C and subsequent test results. A P-value of <0.001 (0.001 based on 10 emetic strains) shows sufficient evidence to conclude that a relationship exists between a maximum growth
temperature of ≥ 48 °C and strain categories. Emetic and environmental strains show to have the highest weight in this difference. Indicating a statistically significant number of
environmental strains have a maximum growth temperature which is less than 48 °C and a disproportional large number of emetic strains do grow at maximum temperatures ≥ 48 °C.
Table 6 Observed (Expected) strains per minimum growth temperature group and subsequent results of a X2-test to reveal differences in minimum growth temperature at 7 °C of B. cereus strains
between strain categories.
7 °C not at 7 °C X2 P-value Environment 4 (6) 11 (9) 31.90 < 0.001 Food 10 (14) 25 (21) Emetic1 0 (7) 17 (10) df Diarrhoeal 29 (16) 11 (24) (4-1)(2-1)=3 Total 43 64 7 °C not at 7 °C X2 P-value Environment 4 (7) 11 (8) 26.35 < 0.001 Food 10 (15) 25 (20) Emetic1 0 (4) 10 (6) df Diarrhoeal 29 (17) 11 (23) (4-1)(2-1)=3 Total 43 57
Table 7 Observed (Expected) strains per maximum growth temperature group and subsequent Results of a X2-test to reveal differences in maximum growth temperature at 48 °C of B. cereus strains between strain categories.
≥ 48 °C not ≥ 48 °C X2 P-value Environment 4 (9) 11 (6) 21.12 < 0.001 Food 23 (21) 12 (14) Emetic1 17 (10) 0 (7) df Diarrhoeal 19 (23) 21 (17) (4-1)(2-1)=3 Total 63 44 ≥ 48 °C not ≥ 48 °C X2 P-value Environment 4 (8) 11 (7) 15.61 0.001 Food 23 (20) 12 (15) Emetic1 10 (6) 0 (4) df Diarrhoeal 19 (22) 21 (18) (4-1)(2-1)=3 Total 56 44
1 Test results using either the n=17 or n=10 emetic strains (see Section 2. for explanation)
Now that we have discovered general features of B. cereus strain categories a more in depth analysis concerning properties of individual strain categories can be perfomed.
Investigation of 17 (10) emetic strains on growth characteristics shows that all these strains have a minimum growth temperature ≥ 10 °C and a maximum growth temperature ≥ 48 °C (Table 3). For future hazard identification purposes it would be interesting to know if emetic strains in general have these growth characteristics. Yet, more samples should be tested to be able to draw conclusions on population level about specific growth characteristics of emetic strains. In general, the criteria for calculating a large sample Confidence Interval (C.I.) about a population proportion is:
1- Sample proportion (p) is calculated from a random sample, and 2- Sample size (n) is large ( n p ≥ 10 and n(1-p) ≥ 10).
From a hazard characterisation perspective it would, in addition, be interesting to know whether, for example, a majority of the diarrhoeal strains in general have a minimum growth temperature of 7 °C or whether this observation is more likely to be due to sampling
A Goodness-of Fit test can determine whether strains of a specific origin are likely to have equal frequency of minimum growth temperatures at 4, 7 10 and > 10 °C or not. The corresponding hypothesis test is:
• H0: Proportion of diarrhoeal strains is equal in each minimum growth temperature group.
This test in this particular setting requires a sample size of at least n=20 samples for the expected counts all to be ≥ 5 and so equally distributed over the 4 temperature groups as would be expected under H0. Considering the tested number of diarrhoeal strains to be n=40, a Goodness-of Fit test was performed with diarrhoeal strains using Table 2. This resulted in a
X2-value of 50.6, with df =3, and so a P-value < 0.001. This means there is sufficient evidence to conclude that a relationship exists between minimum growth temperatures and diarrhoeal strains. Moreover, a significant majority of diarrhoeal strains have a minimum growth temperature at 7 °C. Calculating a C.I. about the proportion of diarrhoeal strains growing at 7 °C can quantify this “significance”.
Investigation of the 40 diarrhoeal strains shows that, in fact, 72.5 % of the tested strains were found to grow at a minimum temperature of 7 °C (Table 3). Since n p = 29 and n(1-p) = 11 are both ≥ 10, the sample size is large enough to use the formula for a large-sample
confidence interval. Based on this sample data, we can be 95 % confident that the true proportion of diarrhoeal strains that have a minimum growth temperature of 7 °C is between 58.7 and 86.3 %. This would mean that if food is stored at sufficiently low temperatures, i.e. < 7 °C, diarrhoeal strains are less likely to multiply.
Only 9 of 100 tested B.cereus strains had a minimum growth temperature of 4 °C (i.e. 5 environmental and 4 food strains, Table 2). A X2-test to reveal whether this minimum growth temperature is equally divided over the different strain origins, in a hypothesis test as done above, is therefore redundant. Still it can be noted that non of the 50 (10 emetic, 40 diarrhoeal) food poisoning strains appeared to have a minimum growth temperature at 4 °C. This asks for a more elaborated investigation without going into a hypothesis test for
independence.
Assume that the probability of selecting a B. cereus strain with a minimum growth temperature of 4 °C is the same for the food poisoning strains (n=50) and the non-food poisoning strains (n=50). Then, the result in the previous paragraph would indicate the
probability of selecting a B. cereus strain having a minimum growth temperature at 4 °C to be Binomially distributed with a constant probability of successes estimated as 9/50. Following this reasoning, the probability of finding 0 successes out of 50 trials would be Bin(0, 50, 9/50) < 0.001. In other words, the probability of finding 0 out of 50 randomly selected
B. cereus strains with a minimum growth temperature of 4 °C would be less than 0.1 % under
the assumption that growth temperatures for food poisoning strains are not different from non-food poisoning strains. This result suggests that having a growth temperature at 4 °C is strain origin dependent. Moreover, it seems like food poisoning strains in general do not grow
at 4 °C. Still, a t-test would need to be performed to show whether a significant number of food poisoning strains do not grow at 4 °C. The hypothesis test is then:
• H0: Proportion of B. cereus strains that grow at 4 °C is the same for non-food poisoning and food poisoning strains.
• Ha: B. cereus causing food poisoning has significantly less strains with a minimum growth temperature at 4 °C than the non-food poisoning category has.
A t-test can be performed using the Normal distribution, N(μ,σ2), as an approximation for the Binomial distribution of minimal growth temperatures. Then, μ= n π and σ2= n π (1- π) and the P-value becomes 0.001. Using α=0.05, H0 is rejected and we can conclude that food poisoning B.cereus strains have significantly less than 9/50 strains with a minimum growth temperature at 4 °C.
3.2
Toxin production
3.2.1 Experimental results
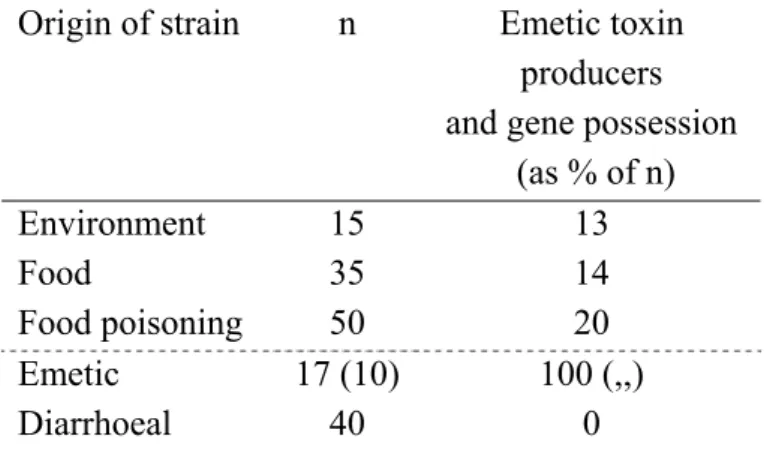
Emetic toxin production does not seem to be related to strain origin (Table 8). That is, the probability of finding an emetic strain does not seem to be related to whether the strain was selected from the environment, a food product or from a food poisoning case in general. Non of the strains related to diarrhoea outbreaks, however, were emetic toxin producers, nor did they possess the gene. As the emetic strains were preselected from emesis cases (10 strains), or on toxin production (17 strains) it is evident that these strains both have the gene and are toxin producers. As can be seen from Appendix 1, qualitative (+/-) results on the gene responsible for emetic toxin production from TUM (PCR 800/NRPS test, (Ehling-Schulz et al., 2005)) and UH-DACM (Toxicity to sperm cells test, (Haggblom et al., 2002)) were compatible with the quantitative results obtained by LMU (Cytotoxicity test) and, therefore, combined in Table 8.
Table 8 Percentage of B. cereus strains (n) that can produce emetic toxins according to strain origin. Percentages correspond to gene possession.
Origin of strain n Emetic toxin producers and gene possession
(as % of n) Environment Food Food poisoning 15 35 50 13 14 20 Emetic Diarrhoeal 17 (10) 40 100 (,,) 0
The previous statement about compatibility of qualitative and quantitative test results for emetic strains does, however, not apply to enterotoxin assessments (Tables 9 to 12). For example, a qualitative positive PCR test for the HBL operon does not indicate a gene is actually expressed in enterotoxin production (Table 11, Appendix 1). This indicates that, for some strains, expression of the HBL genes was not effected by the regulating PlcR gene (see Section 2. for explanation of the mechanism).
Almost all strains produce enterotoxin proteins, i.e. either HBL and/or NHE (Table 9 and Appendix 1 “Diarrhoeal (LMU)”). As no tests are available yet to show the production of CytK, Table 10 only shows information about possession of the cytK gene. The cytK gene seems to be related to diarrhoeal strains over strains from other origins (Table 10 and
Appendix 1). The Hbl-operon nor HBL-L2/-B production seems to be related to strain origin, except for the emetic strains (Table 11). Almost all of the strains produce some form of NHE enterotoxin and thus possess the gene (Table 12 and Appendix 1).
Table 9 Percentage of B. cereus strains (n) that can produce enterotoxins according to strain origin.
Origin of strain n Quantitative overall enterotoxicity test (as % of n) Environment Food Food poisoning 15 35 50 93 89 90 Emetic Diarrhoeal 17 (10) 40 82 (80) 92
Table 10 Percentage of B. cereus strains (n) that possess the cytK gene according to strain origin.
Origin of strain n cytK gene (as % of n) Environment Food Food poisoning 15 35 50 20 37 50 Emetic Diarrhoeal 17 (10) 40 12 (20) 57
Table 11 Percentage of B. cereus strains (n) that possess at least one of the genes of the Hbl-operon, that can produce HBL-L2 and HBL-B proteins according to strain origin.
Origin of strain n Hbl-operon (i.e. ≥ 1 gene present)
(as % of n) HBL-L2 production (as % of n) HBL-B production (as % of n) Environment Food Food poisoning 15 35 50 87 66 62 60 26 40 53 26 38 Emetic Diarrhoeal 17 (10) 40 41 (40) 67 0 (,,) 50 0 (,,) 47
Table 12 Percentage of B. cereus strains (n) that possess at least one of the genes of the Nhe-operon, that can produce NHE-A and NHE-B proteins according to strain origin.
Origin of strain n Nhe-operon (i.e. ≥ 1 gene present)
(as % of n) NHE-A production (as % of n) NHE-B production (as % of n) Environment Food Food poisoning 15 35 50 100 100 98 93 91 98 93 91 92 Emetic Diarrhoeal 17 (10) 40 100 (,,) 97 94 (100) 97 82 (80) 95
3.2.2 Data analysis
A hypothesis test, using α=0.05, resulted in a difference between the B.cereus strains over the categories (Table 12) concerning the cytK gene. The cytK gene has been detected more frequently in diarrhoeal strains and, in general, less frequently in other strains (particularly in
the emetic strains) than would have been expected if proportionality is assumed. Detection of the cytK gene in subsequent strains is, therefore, an indicator for an increased enterotoxic food poisoning hazard.
There is no significant difference in Hbl-operon possession between categories from what would have been expected under the null-hypothesis (Table 14). However, Hbl-L2 and Hbl-B production does differ significantly between strain categories (Tables 15 and 16,
respectively). Emetic, followed by environmental, strains have the largest weight in the difference concerning HBL-L2 production. Relatively little emetic strains and many
environmental strains produce HBL-L2 compared to the other categories. Emetic, followed by the diarrhoeal, strains show to have the largest impact on the X2-value for HBL-B production. Again, relatively little emetic strains, but, in this case, many diarrhoeal strains produce HBL-B compared to the other categories. This might indicate that one should rather select on HBL-B production than on HBL-L2 production when looking for hazardous strains. And, gene possession does not seem to reveal any information on strain origin concerning the HBL enterotoxin.
Table 13 Observed (expected) cytK gene possession per group and subsequent results of a X2
-test to reveal differences in cytK gene possession of B. cereus strains between strain categories.
n cytK gene no cytK gene X2 P-value
Environment 15 3 (6) 12 (9) 13.45 0.004
Food 35 13 (13) 22 (22) Df
Emetic1 17 2 (7) 15 (10) (4-1)(2-1) = 3 Diarrhoeal 40 23 (15) 17 (25)
n cytK gene no cytK gene X2 P-value
Environment 15 3 (6) 12 (9) 9.27 0.026
Food 35 13 (14) 22 (21) Df
Emetic1 10 2 (4) 8 (6) (4-1)(2-1) = 3 Diarrhoeal 40 23 (17) 17 (23)
Table 14 Observed (expected)Hbl-operon possession per group and subsequent results of a X2-test to reveal differences in Hbl-operon possession of B. cereus strains between strain categories.
n Hbl-operon no Hbl-operon X2 P-value
Environment 15 13 (10) 2 (5) 7.49 0.058
Food 35 23 (23) 12 (12) Df
Emetic1 17 7 (11) 10 (6) (4-1)(2-1) = 3 Diarrhoeal 40 27 (26) 13 (14)
n Hbl-operon no Hbl-operon X2 P-value
Environment 15 13 (10) 2 (5) 5.95 0.114
Food 35 23 (23) 12 (12) Df
Emetic1 10 4 (7) 16 (3) (4-1)(2-1) = 3 Diarrhoeal 40 27 (27) 13 (13)
1 Test results using either the n=17 or n=10 emetic strains (see Section 2. for explanation)
Table 15 Observed (expected) HBL-L2 production per group and subsequent results of a X2-test to reveal differences in HBL-L2 production of B. cereus strains between strain categories.
n HBL-L2 no HBL-L2 X2 P-value Environment 15 9 (5) 6 (10) 18.4 <0.001 Food 35 9 (13) 26 (22) Df Emetic1 17 0 (6) 17 (11) (4-1)(2-1) = 3 Diarrhoeal 40 20 (14) 20 (26) n HBL-L2 no HBL-L2 X2 P-value Environment 15 9 (6) 6 (9) 13.90 0.003 Food 35 9 (13) 26 (22) Df Emetic1 10 0 (4) 10 (6) (4-1)(2-1) = 3 Diarrhoeal 40 20 (15) 20 (25)
Table 16 Observed (expected) HBL-B production per group and subsequent results of a X2-test to reveal differences in HBL-B production of B. cereus strains between strain categories.
n HBL-B no HBL-B X2 P-value Environment 15 8 (5) 7 (10) 15.6 0.001 Food 35 9 (12) 26 (23) Df Emetic1 17 0 (6) 17 (11) (4-1)(2-1) = 3 Diarrhoeal 40 19 (13) 21 (27) n HBL-B no HBL-B X2 P-value Environment 15 8 (5) 7 (10) 11.5 0.009 Food 35 9 (13) 26 (22) Df Emetic1 10 0 (4) 10 (6) (4-1)(2-1) = 3 Diarrhoeal 40 19 (14) 21 (26)
1 Test results using either the n=17 or n=10 emetic strains (see Section 2. for explanation)
3.3
Heat resistance
3.3.1 Experimental results
Decimal reduction times (D-values) were calculated from heat resistance experiments (INRA, Appendix 1) in which the number of cultivable spores (S) were assessed after 0, 10, 20, 30, 60 and 120 minutes at 90 °C (Carlin et al., submitted). D-values were estimated using a least squares fit of the data to the linear model (Van Gerwen and Zwietering, 1998)
t ) ln( ) ln(St = S0 −k , (1) where, k = ln(10) / D, S0 = number of spores at t=0.
Spores of four strains could not be counted at a certain time. In those cases a regression line, and so a D-value, was based on counts at the remaining five points in time. For two strains (one environmental and one food strain) no spores were detected on the agar plates during the experiments, which were evidently left out of the calculations.
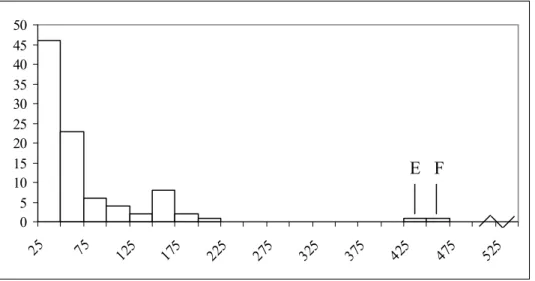
Estimates for both the arithmetic mean ( ) and the median (m) D-values for B. cereus
according to strain origin are shown in Table 17. The fact that all estimated median D-values lie below the mean indicates D-values for the 98 selected strains are positively skewed
(Figure 2). Emetic strains seem to have a relatively high inactivation time, i.e. slow inactivation. Furthermore, the 5 emetic strains with very slow spore inactivation (i.e.
D-values ≥ 500 min., Figure 2) all stem from the strains that have shown to cause emesis
(n=10). Still, one should consider that these estimates lie well outside the time range of the experiments which ran up to 120 min. and so these values should be interpreted with caution.
Table 17 Estimated D-values (decimal reduction times), using eq. 1, per B. cereus strain category (n). Values represent averages ( ) and median (m) values.
Origin of strain n D-value, (min) D-value, m (min)
Environment Food Food poisoning 14 34 50 109 193 197 85 140 92 Emetic Diarrhoeal 17 (10) 40 424 (496) 123 371 (455) 72
Figure 2 Distribution of D-values (decimal reduction times) for 98 B. cereus strains. D-values ≥ 500 min. (over 8 hours) consist of 5 emetic strains (E), 2 food strains (F) and 1 diarrhoeal strain (D).
In addition, inactivation data often show a non-linear relationship.Instead of using a D-value to quantify spore inactivation, another statistic, i.e. time until the first decimal reduction (d-value, (Mafart et al., 2002) can be estimated using a least squares fit of the data to the non-linear Weibull model
0 5 10 15 20 25 30 25 100 175 250 325 400 475 550 625 700 775 850 925 1000 F E F E D
p t S d S ⎟ ⎠ ⎞ ⎜ ⎝ ⎛ − =Log( ) t ) ( Log 0 , (2) where p = shape parameter.
Results of the average, , and median, m, d-values per category are given in Table 18. Also d-values show higher average values than median values, indicating positive skewness of this variable (Figure 3). The emetic strains seem to have higher d-values. In addition to the extreme d-value for one emetic and a food strain (Figure 3), more extreme values were found for two emetic strains, a food strain and a diarrhoeal strain, with estimated d-values of 1007, 1145, 4309 and 6266 minutes, respectively (not shown). Because these few large d-values increase the average, it would be better to use the median to quantify the center of this distribution. It seems like strains selected from the environment are more sensitive to heat, with both a low mean and a low median d-value, compared to other strains (Table 18). Furthermore, emetic strains seem to be highly heat resistant.
Table 18 Estimated d-values (time until first decimal reduction), using eq.2, per B. cereus strain category (n). Values represent averages ( ) and median (m) values.
Origin of strain n d-value, (min) d-value, m (min)
Environment Food Food poisoning 14 34 50 37 179 215 12 24 31 Emetic Diarrhoeal 17 (10) 40 241 (329) 187 130 (137) 25
Figure 3 Distribution of d-values (time until first decimal reduction) for 98 B. cereus strains. d-values ≥ 425 min (over 7 hours) consist of at least 1 emetic (E) and 1 food (F) strain. A further 4 “extreme” values are not shown here.
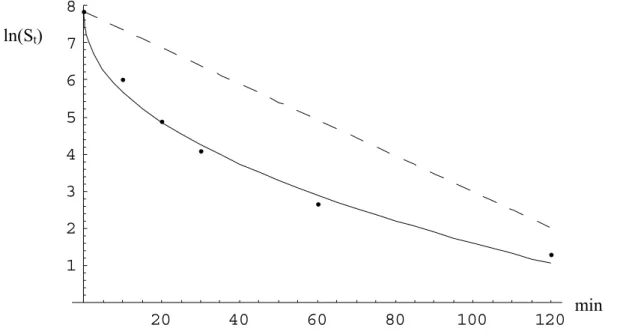
Figures 4 and 5 show examples of fitting both the linear (eq.1) and non-linear (eq.2) model to data of a food poisoning (diarrhoeal, WSBC 10605 (Appendix 1)) strain (D=49, d=15.6,
p=0.86) and a strain originating from food (WSBC 10616 (Appendix 1) (D=48, d=1.87, p=0.46) respectively. It seems like a non-linear model (i.e., where p > 1 or p < 1) does not
always improve the fit (Figure 4). Still, Table 11 shows that, on average, p values seem to differ from 1 and so a non-linear model would in most cases be preferred over a linear model to fit the data. In addition, the median p-values show that 50 % of all p-values are smaller than 0.3, 0.5 or 0.6. This means that at least 50 % of all inactivation curves show a non-linear concave shape as shown in Figure 5.
Table 19 Estimated p-values (shape parameter), using eq.3, per B. cereus strain category (n). Values represent averages ( ) and median (m) values.
Origin of strain n p-value, p-value, m
Environment Food Food poisoning 14 34 50 0.7 0.5 1.4 0.6 0.5 0.6 Emetic Diarrhoeal 17 (10) 40 2.1 (3.4) 0.9 0.3 (,,) 0.6 0 5 10 15 20 25 30 35 40 45 50 25 75 125 175 225 275 325 375 425 475 525 E F
Figure 4 Linear (dotted line, eq.1) and non-linear (solid line, eq.2) model fitted to inactivation data of a B. cereus strain selected from a diarrhoeal source (D=49, d=15.6, p=0.86).
20 40 60 80 100 120 1 2 3 4 5 6 7 8
Figure 5 Linear (dotted line, eq.1) and non-linear (solid line, eq.2) model fitted to inactivation data of a B. cereus strain selected from a food source (D=48, d=1.87, p=0.46)
3.3.2 Data analysis
Experiments on heat resistance showed relatively high decimal reduction times (D-values) for the selected emetic strains (Table 17). A test to show whether emetic strains give statistically higher average D-values seems unreasonable as only 17 (10) emetic strains were used. As n is not ≥ 30, a test would only be valid if a Normal distribution of D-values would be assumed for emetic strains on population level. Still, without going into detailed tests, 95 %
confidence intervals (C.I.’s) about the mean were calculated for B. cereus strains according to
20
40
60
80
100
120
1
2
3
4
5
6
7
8
min ln(St)category (Table 20). This gives a general indication of the spread of D-values about the mean. Any further statistical inferences concerning emetic and environmental strains will be omitted due to the small sample size (n<30).
Table 20 95 % C.I.’s (lower value, Min, and upper value, Max) and average decimal reduction times ( D-value) of B. cereus strains according to strain category.
n Min. Average Max.
Environment 14 48 109 170
Food 34 134 193 252
Emetic 17 311 424 537
Emetic 10 320 496 672
Diarrhoeal 40 79 123 167
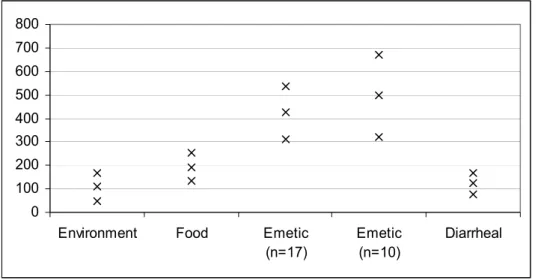
Figure 6 visualizes the C.I.’s of Table 20. Although more emetic strains should be tested, these results give an indication that emetic strains have higher D-values. That is, the C.I. for emetic strains does not overlap with the C.I. for the other strains (Table 20 and Figure 6). This would indicate that if a relatively high D-value was to be estimated for a future isolated
B.cereus strain one could conclude it very likely to be an emetic strain. Meaning, inactivation
during heating would be slow. As all other C.I.’s show some overlap between categories, no further indications for possible strain properties could be given based on these results.
0 100 200 300 400 500 600 700 800
Environment Food Emetic
(n=17)
Emetic (n=10)
Diarrheal
Figure 6 95 % C.I.’s (lower value (Min.) and upper value (Max.)) and average decimal reduction times (D-value) of B. cereus strains according to strain category
Note, however, that C.I.’s for the environmental and emetic strains are only valid under a Normal population distribution of D-values. In addition, recall that 42 of the estimated
D-values lie outside the time range of the experiment, i.e. > 120 minutes (see Appendix 1).
One should, therefore, be cautious in drawing conclusions from these estimates. That is, bringing D-value estimates of over 8 hours into practice based on experimental inactivation data of 2 hours should be avoided. Still, these estimates can very well be used for qualitative comparison reasons. Furthermore, weighted average D-values should be calculated when averages are based on individual parameter estimates. That is, each estimated D-value (per strain) has a standard error. One should account for these individual standard errors when calculating an average D-value and resulting C.I. per category. As for the explorative
character of this study the use of weighted averages was omitted in any of the analysis in this section.
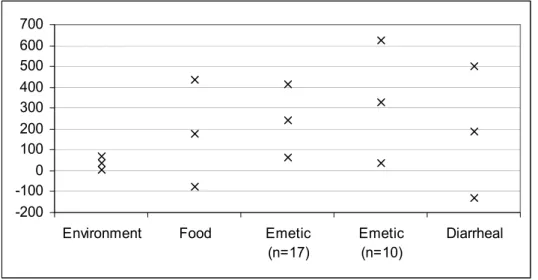
Table 18 showed that emetic strains seem to have higher d-values and environmental strains to have lower d-values compared to the other categories. However, when a C.I. is calculated for the average d-value per category, these indications vanish (Table 21 and Figure 7). Note that the large variability in the data causes large C.I.’s about the mean resulting in the negative minimum values in Table 21. Although Tables 17 and 18 could imply that the high
D-values for emetic strains are associated with high d-values, correlation is moderate
(r=0.63).
Table 21 95 % C.I.’s (lower value, Min., and upper value, Max.) and average time until first decimal reduction (d-value) of B. cereus strains according to strain category.
n Min. Average Max.
Environment 14 5 37 69
Food 34 -77 179 435
Emetic 17 66 241 416
Emetic 10 36 329 622
-200 -100 0 100 200 300 400 500 600 700
Environment Food Emetic
(n=17)
Emetic (n=10)
Diarrheal
Figure 7 95 % C.I.’s (lower value, Min., and upper value, Max.) and average time until first decimal reduction (d-value) of B. cereus strains according to strain category.
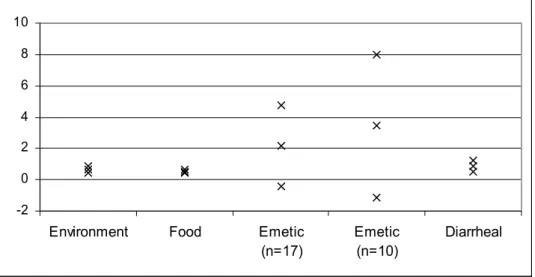
The value of the shape parameter p of the non-linear model seemed, with an average value of 2.15 (3.44), to result in more convex inactivation curves for emetic strains compared to the other categories (Table 22). However, this result is not strengthened when comparing the C.I.’s about the mean for the shape parameter between categories (Table 22 and Figure 8). Again, note that the negative minimum values in Table 22 are a result of the large variability in the data. This, subsequently, causes large C.I.’s about the mean.
Table 22 95 % C.I.’s (lower value, Min., and upper value, Max.) and average value of the shape parameter in eq.2 (p-value) of B. cereus strains according to strain category.
n Min. Average Max.
Environment 14 0.47 0.68 0.89
Food 34 0.42 0.55 0.68
Emetic 17 -0.44 2.15 4.74
Emetic 10 -1.12 3.44 8
-2 0 2 4 6 8 10
Environment Food Emetic
(n=17)
Emetic (n=10)
Diarrheal
Figure 8 95 % C.I.’s (lower value, Min., and upper value, Max.) and average value of the shape parameter in eq.2 (p-value) of B. cereus strains according to strain category.
In addition, a t-test was performed to analyse whether the average value for the shape parameter differs significantly from 1 in the different categories. In other words, can a non-linear model, on average, better predict the inactivation for future strains. Table 23 shows the resulting P-values, indicating that, except for the emetic strains, with p=2.15
(P-value=0.1730) and p =3.44 (P-value=0.113), and the diarrhoeal strains, with p =0.89 (P-value=0.2683), the average values for the shape parameter p differ significantly from 1. Note, however, that, when accounting for sample sizes, this conclusion is only valid for the food and the diarrhoeal strains. More specific, food strains have, on average, non-linear concave shape inactivation curves as shown in Figure 5. Meaning, relatively fast inactivation during heating. Inactivation of diarrhoeal strains can, on average, equally well be described by the more simple linear model.
Estimated p-values for the individual strains shows that a majority (≥ 70 %) of B.cereus strains have concave shaped inactivation curves (i.e. p < 1) independent of strain category (Table 24).
Table 23 Results of a t-test revealing whether the average estimates of the p-values in Table 24 differ significantly from 1, i.e. P(p<1) or P(p>1).
Environment 14 P(p<1) = < 0.001 Food 34 P(p<1) = < 0.001
Emetic 17 P(p>1) = 0.173
Emetic 10 P(p>1) = 0.113
Table 24 Percentage of strains (n) with concave shaped inactivation curves (p<1) according to strain category. Emetic n=17 82 % Emetic 10 70 % Environment 14 71 % Food 34 85 % Diarrhoeal 40 83 %
3.4
Germination
3.4.1 Experimental results
Bacillus cereus spores of the 100 strain set were incubated at 7 °C for 7 days and at 30 °C for
50 minutes (INRA). Spore numbers were counted just before incubation and after pasteurization at the end of the incubation period. Replicates were performed for each experiment. The extent of germination was expressed as
⎟⎟ ⎠ ⎞ ⎜⎜ ⎝ ⎛ = 1 0 10 N N Log x , (3) where
N0 Initial spore number,
N1 Number of spores after incubation.
Average germination values were calculated from the replicates for each strain (Appendix 1). Subsequently, an average ( ) and median (m) germination value was calculated for each category of strain origin (Table 25). As germination is expressed as 10Log(N0/N1), resulting values should be exceeding 0 for those strains where germination occurred. And, high values means many spores have germinated. The actual percentage of germination can easily be derived from equation 3, where:
1
0 10 N
N = x . (4)
Substituting the fraction of spores germinated,
0 1 0 N N N − , (5)
in eq. 4 gives the
fraction germinated =1−10−x (6)
as a readily usable formula to calculate germination percentages. For example, the number 1.8 in Table 25 indicates that, on average, 98 % of spores were germinated after an
incubation period of 7 days at 7 °C.
Table 25 Germination of B. cereus strains at 7 °C and 30 °C according to strain category (n). Values are expressed in average ( ) and median (m) values following eq.3.
Origin of strain n 7 °C, 30 °C, 7 °C, m 30 °C, m Environment Food Food poisoning 14 34 50 1.80 1.53 1.49 2.06 1.90 2.50 2.07 1.61 1.47 1.89 1.80 2.36 Emetic Diarrhoeal 17 (10) 40 0.55 (0.38) 1.77 1.66 (1.64) 2.72 0.25 (0.23) 1.78 1.79 (1.85) 2.56
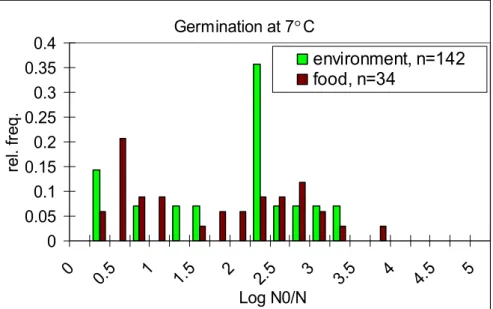
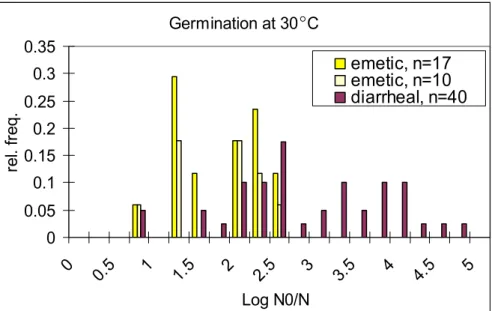
Table 25 shows that emetic strains have the lowest average germination value, both at 7 °C and at 30 °C, corresponding to percentages of 72 (58) and 98 (98) for the 17 (10) selected strains respectively. Environmental strains show to have the highest average germination at 7 °C (98 %) and diarrhoeal strains at 30 °C (100 %). Still, recall that germination values are expressed on a logarithmic scale and a value > 1 in Table 25 indicates a germination
percentage > 90 %. This means that all but the emetic strains at 7 °C show high germination. Figures 9 to 12 show the distribution of the germination values at 7 °C and 30 °C for the strains in the different categories. These figures confirm the observations from Table 25. Figures 9 and 11 show the difference in spore germination between the food poisoning strains in particular. Diarrhoeal strains seem to germinate better both at 7 °C and at 30 °C than emetic strains do. Furthermore, Figures 9 to 12 seem to show a large amount of variability in germination values of strains within the same category. Again, notice that a value of
1 corresponds to germination of 90 % and a value of 5 indicates > 99 % of the spores have germinated.
Germination at 7 C 0 0.1 0.2 0.3 0.4 0.5 0.6 0 0.5 1 1.5 2 2.5 3 3.5 4 4.5 5 Log N0/N re l. fr eq . emetic, n=17 emetic, n=10 diarrheal, n=40
Figure 9 Distribution of germination values of B. cereus strains (at 7°C) selected from emetic and diarrhoeal food poisoning cases.
Germination at 7 C 0 0.05 0.1 0.15 0.2 0.25 0.3 0.35 0.4 0 0.5 1 1.5 2 2.5 3 3.5 4 4.5 5 Log N0/N re l. fr eq . environment, n=142 food, n=34
Figure 10 Distribution of germination values of B. cereus strains (at 7 °C) selected from the environment and food products.
°
Germination at 30 C 0 0.05 0.1 0.15 0.2 0.25 0.3 0.35 0 0.5 1 1.5 2 2.5 3 3.5 4 4.5 5 Log N0/N re l. fr eq . emetic, n=17 emetic, n=10 diarrheal, n=40
Figure 11 Distribution of germination values of B. cereus strains (at 30 °C) selected from emetic and diarrhoeal food poisoning cases.
Germination at 30 C 0 0.05 0.1 0.15 0.2 0.25 0 0.5 1 1.5 2 2.5 3 3.5 4 4.5 5 Log N0/N re l. fr eq . environment, n=14 food, n=34
Figure 12 Distribution of germination values of B. cereus strains (at 30 °C) selected from the environment and food products
3.4.2 Data analysis
Possible differences between B. cereus strains based on calculated germination values were
pointed out in section 3.4.1. Further investigations on the average germination potential between categories of B. cereus strains are shown in Table 26 and Figure 13.
For the same reason as in the previous section only 95 % confidence intervals were calculated to point out potential differences between strains of different categories. Table 26 shows a relatively low average germination value for emetic strains at 7 °C. Figure 13 confirms this
° °
observation when comparing C.I.’s for the different categories. Environmental strains, however, do not seem to give higher germination values compared to other strains at 7 °C.
Table 26 95 % C.I.’s (lower value, Min., and upper value, Max.) and average germination value of B. cereus strains at 7 and (30) °C according to strain category.
n Min. Average Max.
Environment 14 1.26 (1.55) 1.80 (2.06) 2.34 (2.57) Food 34 1.17 (1.56) 1.53 (1.90) 1.89 (2.24) Emetic 17 0.10 (1.39) 0.55 (1.66) 1.00 (1.93) Emetic 10 0.13 (1.25) 0.38 (1.64) 0.63 (2.03) Diarrhoeal 40 1.43 (2.41) 1.77 (2.72) 2.11 (3.03) 0 0.5 1 1.5 2 2.5 3 3.5
Environment Food Emetic
(n=17)
Emetic (n=10)
Diarrheal
Figure 13 95 % C.I.’s (lower value, Min., and upper value, Max.) and average
germination value of B. cereus strains at 7 °C (solid lines) and 30 °C (crosses) according to
strain category.
Although diarrhoeal strains do seem to show little overlap with environmental strains for germination values at 30 °C, finding a relatively high germination value would not necessarily indicate the selection of a B. cereus strain that causes diarrhoea. That is, a
germination value of > 1 on this scale means a germination percentage of > 90 % (see Section 3.4.1). Furthermore, although emetic strains have the lowest average germination value at 30 °C, this observation is not significant when comparing C.I.’s for the different categories (Figure 13)
3.5
Growth characteristics
3.5.1 Experimental results
3.5.1.1 Model fitting
Bacterial growth was assessed experimentally using an optical density (OD) method (TUM). Selected B. cereus strains were suspended in a liquid medium (buffered PC broth) and the
proportion of light absorbed by the culture in time (also called the optical density) was measured using a photometer. The relationship between OD and cell density is
,
xcl
OD=− where (7)
x is a scaling constant
c is concentration of cells
l is length of light path.
This linear relationship is, however, only valid over an OD range from 0.01 to 0.14, which corresponds to cell densities in the order of 106 to 107.5 cells ml-1 (McMeekin et al., 1993) The influence of temperature and pH on bacterial growth (expressed in OD values) over time was tested using two temperatures, i.e. 24 0C and 37 0C, and three pH values, i.e. pH 5, 7 and
8. With these temperature and pH combinations B. cereus growth was assessed in a
photometer during 48 hour experiments. The OD value was measured automatically every hour by the photometer. As experiments for each of the 100 strains was done in at least three fold, this resulted in at least 1800 growth curves, i.e. 2 temperatures * 3 pH values * 100
strains * ≥ 3 experiments per strain (see Table 27 in Section 3.5.1.2).
Experimental results were used to quantify growth characteristics for the 100 selected
B. cereus strains. For this purpose the growth model developed by Baranyi and Roberts
(1994) was fitted to the OD data, and the four parameters growth rate (expressed as the change in the optical density per time unit, OD h-1), lag time (h), minimum OD (OD0) and maximum OD (ODmax) were estimated. Figures 14 and 15 show some common (left hand side) and some atypical fits (right hand side) of the model to the data.
Reliable growth characteristics can generally be measured within the first 24 hours of an in vitro culture. After that, lack of nutrients or turbid medium can influence the measurements. Therefore, fitted curves are based on the first 24 hours in the experiment.
In general, the Baranyi and Roberts (1994) model fits the data well, except for measurements done at 37 °C and pH 8 (Figure 15 bottom left hand side). At 37 °C, pH 8, the culture
reaches its stationary phase already within the first 10 hours of the experiment, followed by a decrease in OD value. As the model gives equal weight to all measurements over the 24 hour period, a negative growth rate is estimated. As these fits do not represent a realistic growth pattern, the model was again fitted to the data now only including the first 10 hours of the measurements (Figure 16). This figure shows improved fits and, in addition, in cases where OD values dropped within 10 hours, these values did not result in a negative growth rate estimate.
Figure 14 Common (left column) and atypical (right column) growth curves fitted with the Baranyi and Roberts (1994) model to data of B. cereus growth at 24 °C and pH 5 (top row), pH 7 (middle row) and pH 8 (bottom row).
(24 , pH7) 0 2 4 6 8 10 12 14 0 10 20 30 time Log OD *10 (24 , pH5) 0 1 2 3 4 5 6 7 0 10 20 30 time Log OD *10 (24 , pH5) 0 1 2 3 4 5 6 0 10 20 30 time Log OD *10 (24 , pH7) 0 2 4 6 8 10 12 14 0 10 20 30 time Log OD *10 (24 , pH8) 0 2 4 6 8 10 12 0 10 20 30 time Log OD *10 (24 , pH8) 0 1 2 3 4 5 6 7 8 0 10 20 30 time Log OD *10 C, C, C, C, C, C,
Figure 15 Common (left column) and atypical (right column) growth curves fitted with the Baranyi and Roberts (1994) model to data of B. cereus growth at 37 °C and pH 5 (top row), pH 7 (middle row) and pH 8 (bottom row).
(37 pH5) 0 1 2 3 4 5 6 7 8 9 0 10 20 30 time Log OD *10 (37 pH5) 0 0,2 0,4 0,6 0,8 1 1,2 0 10 20 30 time Log OD *10 (37 pH7) 0 2 4 6 8 10 12 0 10 20 30 time Log OD *10 (37 pH7) 0 2 4 6 8 10 12 0 10 20 30 time Log OD *10 (37 pH8) 0 2 4 6 8 10 12 0 10 20 30 time Log OD *10 (37 pH8) 0 1 2 3 4 5 6 7 8 9 10 0 10 20 30 time Log OD *10 C, C, C, C, C, C, C,
Figure 16 Common (left) and atypical (right) growth curves fitted with the Baranyi and Roberts (1994) model to data of B. cereus growth at 37 °C and pH 8 using only the first 10 hours of the growth data.
Measurements at 24 °C resulted in good fits, although sometimes an ODmax was not reached within 24 hours (Figure 14 top right) resulting in no estimate for this parameter. Occasionally a culture grew further after a preliminary constant OD value over a short time span (Figure 14 middle right). And, if the OD value decreased over a short time span after the maximum was reached, the model estimated an ODmax somewhat lower than the maximum OD value reached by the culture (Figure 14 bottom right).
At 37 °C and pH 5 some cultures would not start growing at all within 24 hours, resulting in a minimum OD of its initial value, no estimate for the ODmax and the lag time, and a growth rate of 0 (Figure 15 top right). At this higher temperature and pH 7, ODmax values generally already occurred within the first 10 hours of the experiment (Figure 15 middle). However, as OD values did not drop as much as they did at pH 8, good fits were found in general.
Note that although Figures 14 to 16 show general (left hand side) and particularly found fits (right hand side) for the different experimental set-ups, this does not mean that these results only apply to those experiments. That is, a result as shown in Figure 14 (top) could also have appeared at any other temperature/pH combination, however not as frequently as it was found at 24 °C and pH 5. This also applies to the other results as shown in these figures.
(37 pH8_10h) 0 1 2 3 4 5 6 7 8 0 5 10 15 time Log OD *10 (37 pH8_10h) 0 2 4 6 8 10 12 0 5 10 15 time Log OD *10 C, C,