National Institute for Public Health and the Environment
Refined exposure assessment of E150
food colours with use levels provided by
the industry
RIVM Letter report 050015001/2014 C. Sprong et al.
Colophon
© RIVM 2014
Parts of this publication may be reproduced, provided acknowledgement is given to: National Institute for Public Health and the Environment, along with the title and year of publication.
C. Sprong M. Niekerk G. van Donkersgoed Z. Etemad
Contact: Corinne Sprong Food Safety corinne.sprong@RIVM.nl
This investigation has been performed by order and for the account of VWS, within the framework of KV 5.1.5
Rapport in het kort
Verfijning berekening blootstelling aan E150 kleurstoffen. Uitgevoerd met data van de industrie
Aan sommige voedingsmiddelen, zoals bepaalde likeuren, donkere bieren, en koekjes, worden karamelkleurstoffen (E150) toegevoegd om het product een bruine kleur te geven. Er is nu een verfijndere manier beschikbaar om te berekenen in welke mate consumenten aan deze kleurstof blootstaan. Deze verbeterde berekening was mogelijk omdat de industrie gegevens beschikbaar heeft gesteld over de werkelijke gehalten aan karamelkleurstoffen per product dat op de Nederlandse markt verkrijgbaar is. Deze gehalten zijn vervolgens gekoppeld aan de dagelijkse consumptie van deze producten. De blootstelling voor volwassenen valt dan lager uit dan bij eerdere berekeningen; voor kinderen is er geen aantoonbaar verschil. Dit blijkt uit een studie van het RIVM.
Het is van belang om na te gaan of de blootstelling aan kleurstoffen binnen de veilige marge valt, omdat een overschrijding de gezondheid mogelijk kan schaden. Voorheen werd voor een bepaald product dat minder of geen E150 bevat (bijvoorbeeld pils) gekeken naar de hoogste concentratie van de kleurstof in een bredere productgroep (bijvoorbeeld ‘ alle bieren inclusief bruin bier’, dat hogere gehalten E150 bevat). Voor deze soorten producten wordt dan een hogere blootstelling aan E150 geschat dan feitelijk het geval is.
Meerdere partijen zijn gebaat bij de verfijndere methode. De risicomanager (het ministerie van VWS) hoeft geen kostbaar monitoringsprogramma op te zetten dat op metingen is gebaseerd. Daarnaast beschikken de
blootstellingsdeskundigen over nauwkeurigere gegevens. Ten slotte zijn zowel de overheid als de industrie gebaat bij een realistische inschatting. Zowel de overheid als industrie hoeven bijvoorbeeld geen maatregelen te nemen om de risico’s van een overschrijding tegen te gaan in die gevallen waarbij dat in feite onnodig was.
Het onderzoek is uitgevoerd op initiatief van het ministerie van Volksgezondheid, Welzijn en Sport (VWS) en de Federatie Nederlandse Levensmiddelen Industrie (FNLI). Het draagt bij aan de ontwikkeling van een nieuw monitoringssysteem voor additieven en smaakstoffen dat ook voor alle EU-landen kan worden gebruikt.
Trefwoorden:
Karamel, kleurstoffen, E150, jonge kinderen, volwassenen, blootstelling via de voeding
Abstract
Refined exposure assessment of E150 food colours with use levels provided by the industry
The dietary exposure to caramel (E150) food colours can be more accurately assessed using data on use levels obtained from the food industry. The National Institute for Public Health and the Environment (RIVM) drew this conclusion based on a study in which the total dietary exposure to E150a, E150b, E150c and E150d was estimated by applying use levels provided by the food industry. Previously, exposure to E150 was estimated using maximum use levels linked to aggregated food categories (e.g. all beers, including blond beer, were assumed to contain the maximum reported use level of dark beer), which results in overestimates of exposure. Collection of use levels of foods present on the Dutch market allows refined linkage of these concentrations to foods on the food group level (e.g. use levels of kidney bean soup were linked to the consumption of ‘legume soup’ instead of to all foods belonging to the food category ‘soups and broths’) or even on food level (e.g. use levels of ‘speculaas’ were linked to the consumption of this food instead of all foods belonging to the food category ‘fine bakery wares’). When refining the exposure assessment in this way using food consumption data from the Dutch National Food Consumption Survey (DNFCS) 2007-2010, a lower and more realistic exposure estimate for E150 was obtained for the adult population aged 17-30 years compared with a recent EFSA
exposure assessment. For children aged 2-6 years (DNFCS-young children), the exposure estimate was comparable to that obtained by EFSA.
The study was performed on the initiative of the Dutch Ministry of Health, Welfare and Sport (VWS) and the Federation of the Dutch Food and Grocery Industry (FNLI), in order to develop a risk-based monitoring system as requested in EU Regulations EU 1332/2008 (food enzymes), 1333/2008 (food additives) and 1334/2008 (flavourings). The cooperation between risk
managers, exposure assessors and the food industry results in a win-win-situation for all parties by 1) providing a cost-effective approach for risk managers, 2) providing exposure assessors a reliable and representative data set and 3) providing a realistic estimate, which is important for both the government and the industry. The monitoring system may be used to assess exposure levels of additives and flavourings in other European Member States. It is recommended to explore the use of the monitoring system in the other
Member States.
Keywords:
Contents
1 Introduction−6 2 Intake calculations−8
2.1
Collection of E150 food colours concentration data−8
2.2
Food coding −9
2.3
Intake calculations−9
2.5
Data handling−10
3 Results and Discussion−15
3.1
Data collection process−15
3.1.1
Uncertainties related to the data collection process−15
3.2
Concentration data−16
3.2.1
Completeness and representativeness of the data set−16 3.2.2
Other uncertainties−19
3.3
Intake calculations−19 3.3.1
Exposure to E150c−19
3.3.2
Exposure to combined food colours−23
3.4
Main contributors−24
3.5
Comparison with EFSA calculation−27
3.6
Conclusion−28
4 Future perspectives−29
4.1
Refining data collection process−29
4.2
Refining completeness and representativeness of the dataset−29 4.2.1
Market shares−29
4.2.2
Database label information−29
4.2.3
Refining FoodEx2 coding: use of flavour facet codes−30 4.2.4
Exposure calculation model−31
4.3
Public-private cooperation for data collection system for exposure monitoring−31
4.3.3
International developments−32
5 Conclusions and recommendations−33
5.1
Conclusions−33
5.2
Recommendations−33
References−35
Appendix 1. Template of actual use levels, to be completed by the industry−37
Appendix II. The number of data received, the number of foods positive for a specified E150 colour and the range of use levels (mg/kg product) provided by the industry, and use levels used by EFSA in 2012−38 Appendix III. Main contributors to high (P97.5) dietary exposure of E150 food colours for the Dutch population aged 7-69 years−40 Appendix IV. Main contributors to high (P97.5) dietary exposure of E150 food colours of young children aged 2 – 6 years−43
1
Introduction
According to Regulations EU 1332/2008 (EU 2008a), 1333/2008 (EU 2008b) and 1334/2008 (EU 2008c) both European Member States and industry are obliged to provide information on actual use and intake of food enzymes, additives and flavours. In 2011, the Dutch Ministry of Health, Welfare and Sports (VWS), the Federation of Dutch Food and Grocery Industry (FNLI) and the National Institute for Public Health and the Environment (RIVM) started a pilot study in which the cooperation with the industry on providing use levels was explored. To this end, the food additives E120 (Carmine) and E133 (Brilliant Blue; Wapperom et al. 2011), and smoke flavours (Sprong et al. 2013) were used as case studies. The conclusion of these studies was that cooperation with the industry resulted in a win-win-situation for all parties:
1) Delivery of use levels by the industry is a cost-effective approach for Member States to monitor exposure to agents added to food, since collection of data on use levels is less costly than a monitoring system based on analysing food;
2) Exposure assessors obtain a more reliable and representative data set compared with other methods of data collection on use levels;
3) An accurate exposure estimate is important for both government and industry.
On request of the Dutch Ministry of VWS, a refined exposure assessment was performed for E150 (caramel) food colours using actual use levels provided by the industry.
E150 food colours comprises E150a (plain caramel), E150b (sulphite caramel), E150c (ammonia caramel) and E150d (sulphite ammonia caramel), according to the reactants used in their manufacture. Caramel food colours are generated during heating of carbohydrates. These caramel food colours are therefore complex mixtures of several chemical compounds (e.g. disaccharides, glucose, and substances like 1,6-anhydroglucose, laevulinic acid and furanes formed during the heating process; EFSA 2011a). For E150 food colours generated in the presence of ammonia, substances like acrylamide and imidazoles, such as 2-acetyl-4-tetrahydroxy-butylimidazole (THI) and 4-methylimidazole (4-MEI), can be generated (EFSA 2011a). The complex nature and limited knowledge of the chemical composition of caramel colours makes their analysis in food difficult. Based on limited data on analysis of acrylamide and imidazoles in commercial samples of caramel food colours, acrylamide could not be determined in E150c and E150d (EFSA 2011a), whereas the imidazoles THI and 4-MEI were present in E150c, but not in E150d (EFSA 2011a). A group ADI of 300 mg/kg bw/d has been established for the combined exposure to all E150 colours (EFSA 2011a). Because of the presence of imidazoles in E150c, and that of THI in particular, an additional ADI of 100 mg/kg bw/d was established for E150c (EFSA 2011a). In 2012, EFSA performed a refined exposure assessment for caramel colours (EFSA 2012). This study showed that at high intakes (P95), the ADI of
100 mg/kg bw/d was exceeded by Dutch toddlers and the adult population aged 17-30 years for E150c (Table 1). The group ADI (300 mg/kg bw/d) for combined exposure to E150 food colours was not exceeded.
Table 1. High exposure (P95, expressed as mg/kg bw/d) of the Dutch
population according to EFSA calculations performed in 2012.
E150c Combined E150 food colours
Toddlers (2-3 years)1 106.3 158.4
Children (4-6 years)2 93.5 146.4
Adults (18-30 years)3 137.3 148.2
1 Dutch National Food Consumption survey (DNFCS) young children.
2 EFSA age group 4- 9 years, but for the Netherlands DNFCS young children
aged 2-6 years was used.
3 EFSA age group 18- 65 years, but for the Netherlands DNFCS young adults
(18-30 years) was used.
The EFSA calculation was performed using maximum reported use levels of finished products for each food category of Annex II of Regulation 1333/2008 and the Comprehensive Database with FoodEx1 classification up to level 4 (EFSA 2012). Use levels were obtained from FoodDrinkEurope and the European Technical Caramel Association. However, E150 intake calculations may be further refined by:
Use of mean use levels for foods relevant for the Dutch market and improved linking of consumption to concentration data, since not all foods containing E150 contain this food colour at the maximum
reported use level of the corresponding food category. For example not all sauces contain the same amount of E150 as the dark-brown coloured sauces ‘gravy’ or ‘peanut sauce’;
Inclusion of foods not containing E150 in the calculations (‘zeroes’) for foods belonging to food categories of Annex II of Regulation 133/2008. Not all foods that may contain E150 according to Annex II of Regulation 1333/2008 contain this food colour. For example, only certain brown-coloured ices contain E150 (e.g. cola-flavoured or caramel-flavoured ices), whereas other flavoured ices (e.g. vanilla) do not contain this food colour. Assuming that all edible ices contain E150 would result in an overestimation of the exposure.
In the present study a new exposure calculation taking these aspects into account was performed.
2
Intake calculations
2.1 Collection of E150 food colours concentration data
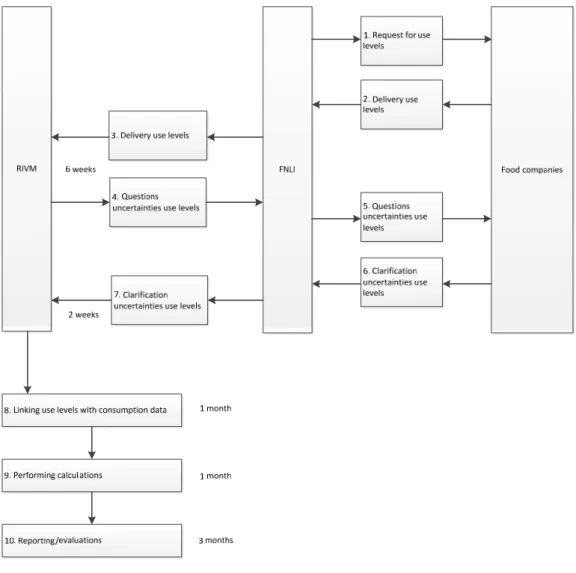
Data on use levels of E150 food colours were obtained from food companies with products on the Dutch Market. Food companies were explicitly asked to provide data on products containing E150 food colours, as well as on products not containing these food colours (‘zeroes'). Figure 1 shows a schematic
presentation of the data collection process. To obtain data on E150 food colours use levels, a template made by RIVM (see Appendix 1) was used. When
uncertainties regarding the concentration of E150 food colours in food products occurred (e.g. on use levels in dried foods, such as soups and sauces), food companies were approached. Collection of all these data was facilitated by the Federation of Dutch Food and Grocery Industry (FNLI; see Figure 1).
Figure 1. Process and running time of exposure estimations with use levels obtained from the industry.
2.2 Food coding
Linking use levels to food consumption data is performed using the FoodEx coding systems FoodEx1 (EFSA 2011b) and FoodEx2 (EFSA 2011c). The FoodEx coding systems were developed by EFSA to enhance harmonization in food coding for exposure assessments within Europe. FoodEx1 is a hierarchical
system based on 20 main food categories that are further divided into subgroups up to a maximum of 4 levels. For example, chocolate cake is given a numerical code responding to ‘grain and grain-based products’ at level 1, to ‘fine bakery wares’ at level 2, to ‘pastries and cakes’ at level 3, and to ‘chocolate cake’ at level 4. This system displayed some drawbacks for exposure assessments. Therefore, a new coding system was developed, FoodEx2. FoodEx2 consists of alphanumerical codes. An important improvement of this system is the ability to use facet description codes for e.g. processing or flavor note facets, which is not possible with the FoodEx1 coding system.
In the study described in this report, foods were coded by the hierarchical coding of FoodEx1 (EFSA 2011b) up to level 4 and by FoodEx2 using the parent codes (EFSA 2011c). These parent codes are more or less comparable with level 4 of FoodEx1, although some discrepancies exist.
2.3 Intake calculations
Calculations for young children were performed using food consumption data of the Dutch National Food Consumption Survey (DNFCS)-Young children (Ocké et al., 2008). This survey covers the dietary habits of young children aged 2 to 6 years and was conducted in 2005 and 2006. The Dutch National Food
Consumption Survey-Young children is available in the harmonized FoodEx1 coding system. Calculations for subjects > 6 years were performed using food consumption data of the Dutch National Food consumption Survey 2007-2010 (van Rossum et al., 2011). This survey includes the eating habits of people aged 7-69 years, with the exception of pregnant and breast-feeding women. This food consumption survey is available in the harmonized FoodEx2 coding system. The DNFCS was divided into 3 age groups: 1) children aged 7-16 years, 2) adults 17-30 years (to be able to compare exposures with the EFSA estimate), and 3) adults aged 31-69 years.
2.4 Tiered approach
In a previous assessment with use levels of food colours (Wapperom et al. 2011); a 3 tiered approach was proposed:
Tier 1: using aggregated food categories and Maximum Permitted Levels;
Tier 2a: using aggregated food categories and typical or maximum use levels;
Tier 2b: using partly disaggregated food categories and typical or maximum use levels;
Tier 3: using individual food consumption data and typical or maximum use levels
Since E150 is used Quantum Satis (QS), calculations with MPLs cannot be performed. Tier 2 was already performed in the EFSA calculations. Therefore, the following tier calculations were performed in the present assessment:
Tier 1: Individual food consumption data and maximum use levels; Tier 2: Individual food consumption data and mean positive use levels; Tier 3: Individual food consumption data and mean use levels including
industry. In this tier, foods of which no use levels were obtained were set at maximum use levels of the corresponding food category.
In this study, another tier (tier 4) was explored: Use of all use levels (including zeroes) and omission of those foods or food categories for which no use levels were received and for which the presence of E150 in foods could not be established according to food product databases. For example, if no use levels were obtained for ‘pancakes’ and E150 is not listed as an ingredient according to food product databases, pancakes may be assumed to contain no E150 and should be omitted from the calculation instead of assigning maximum use levels of the food category ‘fine bakery wares’ as done in Tier 3. These food product bases are not freely accessible. Because RIVM has a licence to use the INNOVA database (www.INNOVAdatabase.com), a database on new food product releases, the use of this database was explored. However, data obtained from INNOVA do not always match with the data received from the industry. For example, some breakfast cereals that contain E150c according to INNOVA contained E150a according to the industry. Since the main objective of INNOVA is to monitor new product launches, it is not clear whether the database is cleaned up on a regular base. Therefore, it was concluded that the INNOVA database was not always representative, and Tier 4 calculations were not performed. Other food product databases may be more representative for the occurrence of additives; this should be explored upon another occasion.
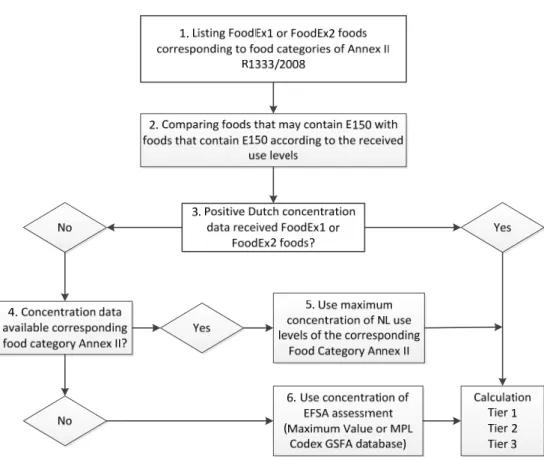
2.5 Data handling
Figure 2 shows the process of assigning use levels to foods for each individual E150 food colour. For the combined exposure to E150, individual use levels per product were summed (e.g. the sum of E150c and E150d concentrations for a particular sauce of brand A). The use of food additives such as E150 is regulated in Annex II of Regulation 1333/2008 (EFSA 2008b). This Annex lists in which of 18 defined food categories (and their subcategories) the use of an additive is allowed. Therefore, foods coded in FoodEx1 or FoodEx2, which may contain E150 according to this Annex, were listed first (Step 1 of Figure 2). These foods were compared with the foods of which use levels were obtained (Step 2). When positive use levels of a particular food (whether or not accompanied with zeroes) had been received (Step 3), these concentrations were used for calculations with maximum use levels (Tier 1), with mean positive E150 use levels (Tier 2) and mean E150 use level after inclusion of zeroes (Tier 3). Concentrations were linked as much as possible at the food level rather than the food category level. For example, when both positive use levels and zeroes were obtained for ‘speculaas’, a Dutch cookie, these concentrations were linked to the consumption of this particular food. When positive use levels and zero
concentrations were received for ‘lebkuchen’, a food belonging to the same food category of Annex II of Regulation 1333/2008 as ‘speculaas’ (i.e. fine bakery wares’), the use values of ‘lebkuchen’ was linked to the consumption of this particular food.
When no use levels were available for a particular food, but use levels were available for the corresponding food category of Annex II of Regulation
1333/2008 (Step 4), the maximum use level of this food category was assigned to the food, to account for the possible presence of E150 in this food (Step 5). For example, when no use levels were obtained for vegetable soup, the maximum use level of the food category 'soups and broth' was used. These maximum use levels were used in all tiers.
For some foods, only zero concentrations were received. As outlined in Section 2.4, foods with only zero concentrations can be true zeroes. Since the market coverage rate of the received use levels is unknown, it is possible that some brands use E150 in their foods. To compensate for the possible presence of E150 in brands for which no use levels were obtained, the same procedure accounted as for foods of which no use levels were obtained: the maximum use level of the corresponding food category of Annex II of Regulation 1333/2008 was assigned to the food (step 5) for the tiered calculations. These maximum use levels were used in Tier 1 and Tier 2. In Tier 3, zero concentrations in addition to the maximum use level were used.
For some food categories of Annex II of Regulation 1333/2008, no use levels were obtained. For food colours with a MPL, this value could be assigned to missing food categories. However, caramel colours are authorised QS level in the EU (Regulation 1129/2011) and therefore no MPL can be assigned to missing food categories. In case no use levels were available for a particular food
category, the use level of the EFSA calculation was therefore assigned to the food (Step 6). This could be the highest use level obtained from
FoodDrinkEurope or the European Technical Caramel Association, or proposed MPLs from the General Standard for Food Additives (GFSA) database of the Codex Alimentarius (www.codexalimentarius.net/gsfaonline/additives). For example, no use levels were obtained for E150c in foods belonging to the food category ’Dietary foods for weight control diets’. Therefore, a concentration of 20000 mg/kg product, the proposed MPL of the GFSA database, was assigned to foods belonging to this food category, such as meal replacers.
Some food companies provided use levels lower than a certain concentration. In that case, as part of a conservative approach, the concentration limit was used in the assessment. For example, if the use level in a certain flavoured non-alcoholic drink was < 200 mg/kg, a concentration of 200 mg/kg was assigned to the particular drink.
Figure 2. Decision tree on data handling for received and absent E150
concentration data. MPL means maximum permitted level, GFSA means General Standard for Food Additives
The procedure as depicted in Figure 2 was followed for all food categories, except for the following (in ascending order of Annex II of Regulation 1333/2008):
1.7.3 Edible cheese rind. No use levels were obtained for edible cheese rind.
Gouda-like cheeses and other (semi-)hard cheeses are the most frequent consumed cheeses in the Netherlands. These cheeses contain non-edible cheese rinds. Brie, Camembert and blue cheeses, the most frequent consumed cheeses with an edible cheese rind in the Netherlands, are not likely to contain E150 food colours, since they are white-coloured. Other cheeses with an edible cheese rind are niche products. Therefore, edible cheese rind was excluded from the
calculation. Neglecting this category will very likely lead to only a minor underestimation of the exposure.
1.7.4. Whey cheese: No data were received for this particular food category.
However, this food category corresponds to white-coloured cheeses such as ricotta which are unlikely to contain caramel colours, and were therefore omitted from the calculation.
4.2.4.1. Fruit and vegetable preparations excluding compote, only mostarda di frutta: Mostarda di frutta is not referenced in FoodEx1 and 2 nomenclature, and
therefore not taken into account. This item is a niche product and not recorded in both Dutch Food Consumption Surveys.
5.4 Decorations, coatings and fillings, except fruit based fillings covered by the category 4.2.4: Although concentrations were obtained for this category, these
concentrations were not taken into account, since this category is part of food products such as fine bakery ware, edible ices, candy and confectionary. Concentration data were obtained for these particular food products.
6.6 Batters: Similar to decorations and coatings, batters are part of composite
foods and present in the Dutch food consumption surveys as composite foods such as pastries, of which concentration data are received.
7.1 Bread and rolls, only malt bread. No use levels were obtained for malt
bread. Malt bread is not referenced in the FoodEx1 and 2 nomenclature and is a niche product. Therefore, this food item was not taken into account.
Concentration data were only obtained for bread containing muesli. Bread containing muesli or raisins are covered by the FoodEx2 codes A00BL (‘buns’) and A005E (wheat bread and rolls, brown or whole meal) and comparable FoodEx1 codes. Therefore, only these food codes were taken into account.
8.2.3 Casings and coatings and decorations for meat, except edible external coating of pasturmas: As for decorations and coatings, these products are part
of composite foods, such as sausages that are covered by category 8.2.1. Therefore, this category was not taken into account.
13.4 Foods suitable for people intolerant for gluten: No data were received for
these food types. Since these foods are not included in the Dutch food consumption surceys, this category was not taken into account.
14.2.5 Mead: This food is not referenced in the FoodEx1 and 2 nomenclature.
Mead is a niche product in the Netherlands. Therefore, omission of mead will very likely lead to only a minor underestimation of the exposure.
17 Food supplements. No use levels were obtained for this food category.
Although the consumption of food supplements is recorded in the Dutch food consumption surveys, it is not yet coded according to the FoodEx 1 and 2 coding system. Due to the limited time available for the intake calculations and the expected small contribution (supplements consumed in the Dutch food
consumption surveys are mostly consumed as pills, capsules, sachets, spoons of powdered or liquid formula’s, indicating consumption of only a few grams), this category was not taken into account. This very likely will result in only a minor underestimation of the exposure assessment.
Ready to eat composite foods like ‘mashed potatoes with kale, gravy and cooked
smoked sausage’ are coded in the DNFCs according to the individual components of the meal, such as ‘cooked kale’, ‘mashed potatoes’, ‘gravy’ and ‘cooked smoked sausage’, and therefore included as such in the exposure assessment.
2.6 Monte Carlo Risk Assessment
To assess the long-term exposure, ideally statistical models should be used that correct the variation in long-term exposure between individuals for the within individual variation (Hoffmann et al., 2002; Nusser et al., 1996; Slob, 1993). However, an important prerequisite for this is that the logarithmically
transformed daily exposure distribution is normally distributed (de Boer et al., 2009). Since the exposure data were not normally distributed for E150 food colours (not shown), the observed individual means (OIM) method was used.
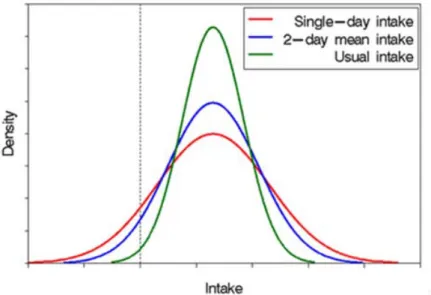
The OIM method calculates the intake per day per subject and averages the intake of the 2 recall days per subject. This implies that the high exposure percentiles are underestimated (Figure 3.) The Monte Carlo Risk Assessment programme (MCRA), Release 7.1 (de Boer and van der Voet, 2010) was used for the exposure assessment.
By using the bootstrap approach, the uncertainty around the exposure estimate due to the limited size of the concentration and food consumption dataset was determined. The uncertainty is reported as the 95% confidence interval around the percentiles of exposure.
Figure 3. Usual intake versus the OIM method. The Observed Individual Means (OIM) method used in this report is based on a 2-day mean intake. Therefore, this method deviates from the usual intake, since a mean intake based on two days is more sensitive to extreme consumption levels of foods than those based on a longer period. The OIM method may underestimate the mean intake and may overestimate the upper percentiles. Figure is obtained from the National Cancer Institute.
3
Results and discussion
In this chapter the results of the data collection process, received E150 use levels, exposure estimates to E150 and the main contributors to E150 are shown and discussed.
3.1 Data collection process
The running time of six weeks for delivery of use levels by the industry was frequently too short for several (large) companies. However, data collection of use levels is presently coupled to issues on the agenda of the Working Groups on additives and flavourings of the European Committee and exposure estimates have thus to be performed according to a tight time schedule. For this reason, a longer running time is not preferred.
Use levels were obtained from 48 food companies (103 approached; response of 47%) with products on the Dutch market. The response was comparable to the one obtained with smoke flavourings (45%; Sprong et al., 2013) and higher compared with a previous data collection of food colours E120 and E133 (40%; Wapperom et al., 2011). This increase in response might be due to factors like a higher familiarity with the process, building trust between industry, exposure assessor and risk manager, and/or encouragement by the results of the former data collections. In this study, the industry was requested to also provide information on foods that do not contain E150. This may also explain the higher response, since several companies that do not use E150 also provided
information.
3.1.1 Uncertainties related to the data collection process
There are some uncertainties related to the use levels that can be attributed to the data collection process. Use levels were not always provided as levels in the product as consumed. For example, use levels in sauces or soups were provided both as liquid products and as powdered products to be diluted before use. Because of familiarity with the products, most of the products to be diluted before use were recognised and dilution factors were obtained by contacting the data provider.
Another example of use levels not provided for the product as consumed are products partly containing an additive. This could be the case in products with toppings and coatings, such as iced biscuits, where the concentration of E150 in the topping or coating might be provided instead as the use level in the product as consumed. Another example of a food partly containing E150 is mixed products, such a brown and black liquorice candies where only the brown candies contain E150. Because of the limited running time of the project and the large number of data received, no inquiries were made into these products. This may have resulted in an overestimation of the exposure, because it was
assumed that the use levels provided accounted for the product as consumed as part of a conservative approach.
3.2 Concentration data
Data of approximately 2350 foods were obtained, of which 652 foods were positive for one of the E150 food colours. The remaining foods did not contain E150 food colours. Table 2 shows the number of positive foods received for each E150 colour. The highest number of positive foods was obtained for E150d, equal numbers of positive foods were obtained for E150a and E150c, whereas the smallest number of positive foods were obtained for E150b.
Table 2. Number of positive use levels received by the industry for each E150 food colour and the number of corresponding food groups in FoodEx1 and FoodEx2.
Number of positive foods
Number of food groups Food colour FoodEx1 FoodEx2
E150a 139 34 38
E150b 11 3 3
E150c 131 34 35
E150d 371 53 58
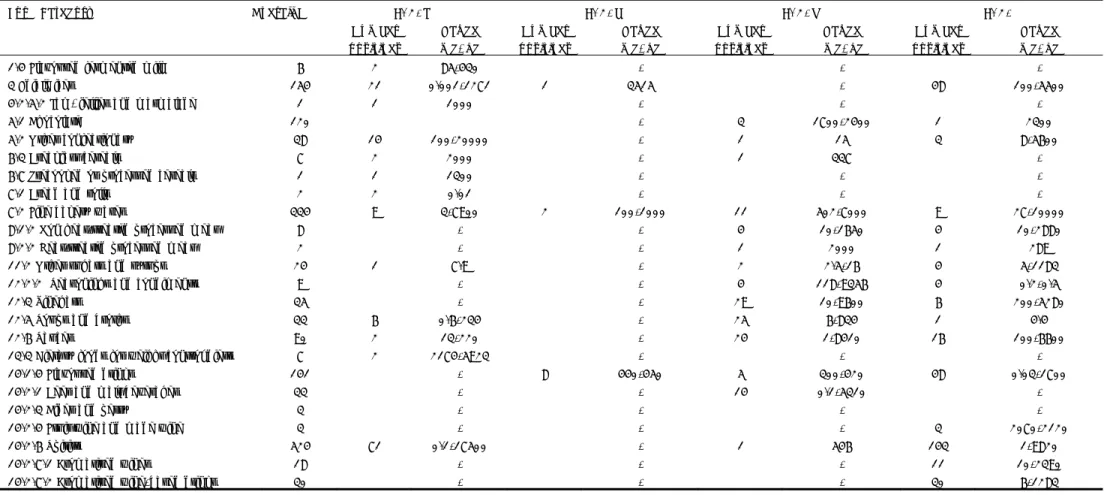
Table 3 shows the number of positive use levels received per food category of Annex II of Regulation 1333/2008 for each E150 food colour, as well as the total number of use levels received (including zeroes). The number of zeroes per food category is the resultant of the overall number of use levels received per food category minus the number of positive use levels received. Appendix II shows more detailed data, including zero concentrations. Most data were received for 'spirits', 'fine bakery wares', 'edible ices' and 'flavoured drinks’ (Appendix II). Within food categories, use levels may vary considerably. This is because the food categories comprise different foods, each of which may contain a broad concentration range of E150, depending on the colour of the food. For example, the use of E150a varies from 0 in non-brown coloured spirits to 17500 mg/kg in dark-brown coloured spirits. For some food categories, maximum use levels were lower or higher than used in the EFSA calculation (Appendix II).
3.2.1 Completeness and representativeness of the data set
As stated above, 47% of the approached industries supplied information on use of E150. Main manufacturers and brands, including private labels, were included in the dataset. Due to the high number of main brands in the concentration dataset, the data are expected to cover a large part of the market. However, the actual coverage rate is not known, since market shares are not available.
Inclusion of market shares would improve the completeness and the
representativeness of the data set. Data on market share are highly confidential and therefore not easily obtained from the food industry. Market share data could be obtained from specific companies, but are very expensive.
By approaching (multinational) companies with food products on the Dutch market, the data collection included also imported foods. Again, no exact figures of the completeness could be used, since market shares are not available.
Table 3. Number of use levels, minimal positive concentration and maximum use levels (mg/kg) per food category. Data were received from the industry.
Food Category Overall N E150a E150b E150c E150d
Number positives Range (mg/kg) Number positives Range (mg/kg) Number positives Range (mg/kg) Number positives Range (mg/kg)
1.4 Flavoured fermented milk 6 2 85-430 - - -
3 Edible ices 154 21 0.001-1271 1 3515 - 48 100-5500
4.2.5.2 Jam, jellies and marmalade 1 1 1000 - - -
5.1 Chocolate 120 - 3 1700-2400 1 2300
5.2 Other confectionary 38 14 100-20000 - 1 15 3 8-5600
6.3 Breakfast cereals 7 2 2000 - 1 337 -
6.7 Precooked or processed cereals 1 1 1300 - - -
7.1 Bread and rolls 2 2 0.01 - - -
7.2 Fine bakery wares 334 9 3-7900 2 100-1000 11 502-7000 9 27-10000
8.1.2 Non heat-treated processed meat 8 - - 4 10-1650 4 10-2880
8.2.2 Heat-treated processed meat 2 - - 1 2000 1 289
11.2 Other sugars and syrups 24 1 7.9 - 2 2.5-16 4 5-1183
12.2.2 Seasonings and condiments 9 - - 4 118-9356 4 0.2-0.5
12.3 Vinegars 35 - - 29 10-9600 6 200-5280
12.5 Soups and broths 33 6 0.6-234 - 25 6-834 1 4.4
12.6 Sauces 90 2 13-220 - 24 1-8410 16 100-6600
13.3 Dietary foods for weight control diets 7 2 2174-5923 - - -
14.1.4 Flavoured drinks 141 - 8 440-450 5 300-420 48 0.03-1700
14.2.1 Beer and malt beverages 33 - - 14 0.1-5310 -
14.2.3 Cider and perry 3 - - - -
14.2.4 Fruit wine and made wine 3 - - - 3 2070-2120
14.2.6 Spirits 524 71 0.1-17500 - 1 546 143 1-9820
14.2.7.1 Aromatised wines 18 - - - 11 10-2390
Number positives Range (mg/kg) Number positives Range (mg/kg) Number positives Range (mg/kg) Number positives Range (mg/kg)
14.2.8 Other alcoholic drinks 52 - - - 36 10-4500
15.2 Processed nuts 1 1 1630 - - -
16 Desserts 42 4 1260-2286 - - -
3.2.2 Other uncertainties
With respect to E150a, plain caramel, an additional uncertainty existed. Foods can contain caramel, caramelised sugar or caramel sauce as an ingredient. The food industry does not consider these ingredients to be E150a. In the exposure calculation, a food was defined as containing E150a when the use of this ingredient was stated on the food product label.
3.3 Intake calculations
Exposure assessments were performed for each individual E150 food colours as well as for the combined exposure to E150 food colours. Table 4 shows the exposure estimates per E150 food colours for the Dutch population aged 7-69y, as well as for the combined E150 food colours. Table 5 shows the exposure estimates for Dutch young children aged 2 - 6 years. Since a group ADI exist for the combined exposure and an additional ADI exists only for E150c, the
exposure to E150c and the combined exposure are discussed below. The exposure to the other individual E150 food colours are only shown for
comparison of exposure between individual E150 food colours and the combined exposure to E150 food colours.
3.3.1 Exposure to E150c
In Tier 1, in which all foods that can contain E150c were assumed to contain this food colour at maximum reported use levels, the high exposure (P95 and P97.5) did not exceed the ADI of 100 mg/kg for the Dutch population aged 7-69 years (Table 4). For Dutch young children, the P97.5 exposure equalled the ADI, whereas the P95 was below the ADI (Table 5). Tier 1 is a very conservative estimate, since not all foods contain E150c at maximum use levels.
Tier 2 calculations, in which all foods that can contain E150c were assumed to contain this food colour at mean positive levels, did not result in lower exposure estimates for the three older age groups. In young children, the exposure was however slightly reduced compared to the Tier 1 assessment. The P97.5 exposure estimate was now lower than the ADI. Tier 2 is also a conservative approach, since not all foods that may contain E150c contain this food colour (Appendix II). Therefore, in addition to the mean positive use levels, mean use levels based on the inclusion of the zero concentrations obtained from the industry were used in Tier 3 calculation.
Tier 3 resulted in lower exposure estimates in all age groups compared to the Tier 2 estimates. Tier 3 is still partly conservative, since foods for which no information was obtained from the industry were set at maximum use levels of the corresponding food category or at the maximum level used in the EFSA calculation. For example, no use levels were obtained for ‘pancakes’. Therefore, the concentration of E150c in ‘pancakes’ was assumed to be 7000 mg/kg, i.e. the concentration for ‘lebkuchen’, whereas ‘pancakes’ most likely do not contain E150c. This may have resulted in an overestimation of the exposure. The main concern with respect to Tier 3 calculations is representativeness of the zero concentrations used. For foods with both positive use levels and zeroes, all the concentrations were equally treated in the mean concentration calculation, since no weighing factors based on market shares are available. This may have led to either an over- or underestimation of the exposure. Although the true exposure cannot be calculated yet in Tier 3, the inclusion of zeroes indicates that the true exposure to E150c is likely lower than that obtained from Tier 2 calculations.
Table 4. Exposure to individual E150 food colours (mg/kg bw/d) and combined exposure to E150 food colours of the Dutch population aged 7-69 years using different tiers.
E150a E150b E150c E150d Combined
Tier P50 P95 P97.5 P50 P95 P97.5 P50 P95 P97.5 P50 P95 P97.5 P50 P95 P97.5 7-16 y 1 38 (36-39) 86 (79-91) 98 (94-104) 20 (19-20) 65 (60-70) 82 (76-82) 20 (19-20) 49 (47-51) 60 (54-65) 45 (43-50) 96 (92-102) 111 (106-115) 50 (49-52) 106 (101 -114) 124 (118-135) 2 34 (32-36) 76 (74-84) 96 (84-97) 20 (19-20) 65 (60-71) 82 (75-93) 19 (18-21) 48 (46-51) 60 (54-65) 38 (36-41) 84 (79-92) 99 (91-106) 38 (35-40) 82 (79-89) 97 (89-104) 3 7 (6-8.3) 28 (25-33) 36 (33-41) 6.1 (5.1-6.8) 24 (20-34) 31 (25-48) 6.8 (5.9-7.4) 25 (22-28) 32 (28-35) 15 (13-16) 46 (43-41) 55 (51-61) 16 (14-17) 46 (43-51) 56 (52-62) 17-30 y 1 21 (20-23) 58 (53-62) 71 (63-78) 16 (15-17) 69 (63-78) 89 (80-118) 12 (11-13) 35 (33-37) 42 (37-47) 25 (23-26) 57 (55-62) 69 (63-75) 28 (27-30) 67 (63-71) 79 (74-85) 2 20 (18-21) 54 (51-59) 66 (60-74) 16 (14-17) 69 (63-78) 89 (81-113) 12 (11-13) 34 (33-36) 41 (38-47) 22 (20-23) 52 (50-56) 62 (55-68) 22 (21-24) 56 (52-60) 64 (60-69) 3 4.2 (3.3-5.0) 16 (14-19) 23 (20-27) 4.2 (2.9-4.9) 19 (13-30) 25 (17-37) 4.5 (3.9-4.7) 17 (15-19) 23 (18-28) 10 (9-11) 34 (31-37) 45 39-51) 12 (10-12) 37 (33-41) 46 (39-55) 31-69 y 1 14 (13-14) 37 (35-40) 45 (41-47) 14 (12-15) 62 (56-66) 73 (69-79) 9.6 (9.6-10.4) 29 (26-31) 36 (32-37) 18 (16-18) 44 (42-46) 50 (47-43) 21 (21-22) 51 (48-53) 56 (54-56) 2 12 (11-13) 35 (33-37) 40 (37-42) 14 (13-15) 62 (56-66) 73 (69-80) 9.7 (9.2-10.3) 28 (26-30) 34 (31-36) 15 (14-16) 40 (38-43) 46 (43-48) 15 (14-16) 39 (37-42) 45 (43-48) 3 3.0 (2.4-3.4) 11 (10-12) 13 (12-15) 3.1 (2.0-3.7) 15 (10-23) 27 (14-43) 3.5 (3.1-3.9) 12 (11-13) 15 (13-20) 6.2 (5.7-7.1) 22 (20-24) 26 (24-39) 7.4 (6.5-7.9) 22 (21-24) 28 (25-31)
Tier1 Tier 2 Tier 3 P50 P95 P97.5 P50 P95 P97.5 P50 P95 P97.5 E150a 41 (39-43) (91-101) 95 (105-133) 109 (33-39) 36 (77-90) 81 (87-106) 95 (9-11) 10 (45-54) 48 (56-67) 61 E150b 27 (26-28) (82-94) 88 (97-113) 109 (25-28) 27 (82-92) 88 (98-113) 109 (5-10) 8 (21-33) 25 (27-41) 32 E150c 39 (37-40) (82-92) 88 (93-107) 100 (33-38) 36 (76-86) 81 (87-99) 93 (13-15) 14 (44-52) 49 (54-68) 60 E150d 57 (54-59) (119-133) 128 (137-156) 146 (43-52) 48 (100-127) 109 (114-143) 122 (14-20) 16 (57-69) 64 (72-87) 79 E150 combined (62-65) 64 (131-142) 137 (144-171) 158 (42-52) 46 (96-120) 102 (108-137) 119 (19-23) 21 (62-73) 67 (76-89) 81 Yellow highlighted values indicate that value equals or exceed the ADI of E150c (100 mg/kg bw/d)
The calculation tool MCRA enables the quantification of the percentage of the population exceeding the ADI. Table 6 shows the percentage of the population aged 7-69 y exceeding the ADI for E150c. The ADI was exceeded by the age groups 17-30 years and 31-69 years in Tiers 1 and 2. This is due to dietary foods for weight control (set at MPL in the GSFA database), high consumption of beer (set at the maximum use level of dark beer), and/or extreme use of cola beverages (set at maximum use level of energy drinks). When zeroes were included at Tier 3 for cola beverages, regular beer (blond beer), wheat beer (white beer), alcohol-free beer (including alcohol-free blond beers) and mixed beer drinks, the percentage of subjects exceeding the ADI for E150c was reduced to zero. According to the upper limit of the 95% confidence interval of the population aged 17-30 years at Tier 3, 0.3% of this population may still exceed the ADI. This is because of the proposed MPL used for dietary foods for weight control according to the GSFA database, which is set at 20000 mg/kg. The upper consumption of these food products was 775 g. This means that daily 15.5 g E150c will be ingested. It is not known whether the MPL of the GSFA database applies for solid or liquid foods, whereas the 775 g consumed is a shake rather than a solid food.
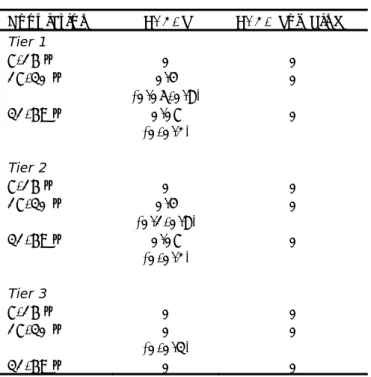
Table 6. Percentage of subjects (and 95% confidence interval between brackets) of the population aged 7-69 years exceeding the ADI for E150c (100 mg/kg/bw) and the ADI for the combined exposure to E150 food colours (300 mg/kg/bw).
Population E150c E150 combined
Tier 1 7-16 y 0 0 17-30 y 0.4 (0.05-0.8) 0 31-69 y 0.07 (0-0.2) 0 Tier 2 7-16 y 0 0 17-30 y 0.4 (0.1-0.8) 0 31-69 y 0.07 (0-0.2) 0 Tier 3 7-16 y 0 0 17-30 y 0 (0-0.3) 0 31-69 y 0 0
Table 7 shows the percentage of young children exceeding the ADI of E150c for all three Tiers. Even in Tier 3, a small percentage of the children exceeded the ADI for E150c. This is due to high consumption of pancakes (200 to 425 g), the main contributor, which was set at the maximum concentration of fine bakery wares (7000 mg/kg). Given these uncertainties, the reliability of the percentage of subjects exceeding the ADI is questionable.
Table 7. Percentage of subjects of young children aged 2 – 6 years exceeding the ADI of E150c (100 mg/kg/bw) or the ADI for the combined exposure for E150 food colors (300 mg/kg/bw).
Tier E150c E150 combined
Tier 1 2.5 (1.6-3.1) 0 Tier 2 1.4 (0.8-3.3) 0 Tier 3 0.3 (0.1-0.5) 0
3.3.2 Exposure to combined food colours
For each Tier, the combined exposure was lower than the sum of the individual food colours (Tables 4 and 5). This can be explained by substitution of zero concentrations with maximum use levels in the summation of the individual food colours vs the use of the use levels of the actual E150 food colour present in the food used for the combined exposure estimate. Most foods contain only one type of E150 food colour (Appendix II). In the exposure estimates for the individual E150 food colours, the absence of a certain E150 food colour is substituted by the maximum use level of the corresponding food category. For example, cola beverages which contains only E150d (maximum use level 1700 mg/kg), are substituted with maximum use levels of the food category in the exposure calculation of the other individual E150 food colours (i.e. E150a: 1500 mg/kg, E150b:450 mg/kg and E150c 420 mg/kg). When summing the exposure estimates of the individual E150 food colours, it is assumed that cola beverage contains all these use levels in addition to E150d. Thus, the use level for cola beverages in the sum of the individual food colours in Tier 1 is assumed to be 4070 mg/kg, which is far more than the actual maximum use level of 1700 mg/kg E150d. Summing the individual E150 food colours clearly overestimates the combined exposure to E150 food colours.
The combined exposure to E150 food colours did not exceed the group ADI (300 mg/kg bw/d) at each Tier by each age group (Tables 3-7). Tier 2 calculations were generally slightly lower than Tier 1 calculations. Tier 3 calculations are far lower than Tier 2 calculations. The main concern of Tier 3 calculations as outlined for E150c (Section 3.3.1), inclusion of maximum values for foods that might be true zeroes and the lack of weighing factors for zeroes and positive concentrations, applies also to the combined exposure to E150d. Nonetheless, Tier 3 calculations indicate that the true combined exposure is likely lower than those obtained from Tier 2 calculations.
3.4 Main contributors
Tables 8 and 9 show the main contributors to the exposure to E150c and the combined exposure to E150 food colours for the three age groups of the Dutch population and for young children, respectively. The main contributors to the exposure to the other individual E150 food colours is shown in the Appendices III and IV for the three age groups of the Dutch population and for young children, respectively.
For E150c, fine bakery wares were a main contributor regardless the tier or age groups. Other main contributors were confectionary, dessert, alcoholic
beverages, non-alcoholic beverages and dietary foods for weight control, depending on age groups and tier. For the combined exposure to E150, fine bakery wares and non-alcoholic drinks were main contributors, regardless of age groups. Depending on age group and tier, confectionary, sauces, beer, alcoholic beverages other than beer and dessert were identified as other main
Population Tier 1 Tier 2 Tier 3 E150c
7-16 y Fine bakery wares (50%) Confectionary (13%) Dessert (16%)
Non-alcoholic beverages (7%)
Fine bakery wares (51%) Confectionary (13%) Dessert (16%)
Non-alcoholic beverages (7%)
Fine bakery wares (75%)
17-30 y Dietary foods for weight control (29%) Beer (19%)
Fine bakery wares (17%) Non-alcoholic beverages (9%)
Dietary foods for weight control (29%) Beer (19%)
Fine bakery wares (17%) Non-alcoholic beverages (9%)
Fine bakery wares (44%) Beer (13.6%)
Dietary foods for weight control (12%)
31-69 y Beer (32%)
Fine bakery wares (18%)
Alcoholic beverages except beer (18%) Dessert (9%)
Beer (28%)
Alcoholic beverages except beer (20%) Fine bakery wares (19%)
Dessert (8%)
Beer (39%)
Fine bakery wares (35%)
E150 total
7-16 y Non-alcoholic beverages (32%) Fine bakery wares (32%) Confectionary (10%)
Fine bakery wares (43%) Non-alcoholic beverages (35%) Confectionary (6%)
Fine bakery wares (58%) Non-alcoholic beverages (24%) 17-30 y Non-alcoholic beverages (36%)
Fine bakery wares (17%) Confectionary (12%) Beer (11%)
Sauces (9%)
Non-alcoholic beverages (33%) Fine bakery wares (23%) Beer (15%)
Sauces (7%) Confectionary (6%)
Non-alcoholic beverages (42%) Fine bakery wares (28%)
31-69 y Non-alcoholic beverages (20%) Fine bakery wares (19%) Beer (12%)
Alcoholic beverages other than beer (12%) Confectionary (105)
Non-alcoholic beverages (33%) Fine bakery wares (25%) Beer (13%)
Meat (6%)
Confectionary (6%)
Non-alcoholic beverages (47%) Fine bakery wares (26%)
E150 food colour
Tier 1 Tier 2 Tier 3
E150c Fine bakery wares (39%) Dessert (31%)
Confectionary (10%) Sauces (7%)
Desert (36%)
Fine bakery wares (35%) Confectionary (12%)
Fine bakery wares (66%) Confectionary (15%) Dessert (7%) E150 total Fine bakery wares (28%)
Non-alcoholic beverages (23%) Dessert (22%)
Sauces (10%)
Fine bakery wares (51%) Non-alcoholic beverages (21%) Dessert (7%)
3.5 Comparison with EFSA calculation
Comparing the EFSA exposure estimates (obtained with maximum use levels; EFSA 2012) with Tier 1 of the current exposure estimates (maximum use levels) resulted in a much lower exposure estimate for adults in this study (Table 10). Several factors may have contributed to this:
Different DNFCS used for the adult exposure calculation, i.e. DNFCS 2003 in the EFSA calculation vs. DNFCS 2007-2010 in the current calculation;
Difference in FoodEx food classification used, FoodEx1 in the EFSA calculation and FoodEx2 in the current calculation. This factor is not easily addressed, since no DNFCS is available in both FoodEx coding systems;
Linking of maximum use levels at food level (this study) vs linking at food category level (EFSA). To explore this possibility, a calculation was performed for the exposure to E150c in young adults, in which the maximum use level of a food category was assigned to all foods belonging to that particular food category. Table 11 shows that this scenario increased the high exposure. ‘Beer and beer-like drinks’ contributed for 84% to the high (P97.5) exposure in this scenario. This was mainly due to ‘regular beer’, which contributed for 79% to the high exposure. Regular beer, the main consumed beer in the Netherlands, is blond beer, with maximum E150c levels of < 0.1 mg/kg, whereas the maximum use levels of the food category ‘beer and malt drinks’, 5310 mg/kg, is obtained from dark beer. Thus, using maximum use levels of the food category regardless the characteristics of the food may result in a large overestimation of the exposure. Refined linking of use levels on the food level instead of the food category level is only possible when the exposure assessor is familiar with the consumed products. Obviously, this is difficult in a Pan-European approach.
For children, the current exposure estimate for the combined E150 exposure did not differ from the EFSA calculation (Table 10). For E150c, the current exposure estimate was slightly lower (Table 10). This discrepancy from the adult exposure estimate was caused by the fact that most FoodEx1 groups belonging to the main contributors of high exposure ‘fine bakery wares’, ‘dessert’ and
‘confectionary’ were already set at maximum use levels of the food category. Indeed when calculations were performed with maximum use levels of the food categories assigned to food groups, the exposure estimate did not differ significantly (Table 11).
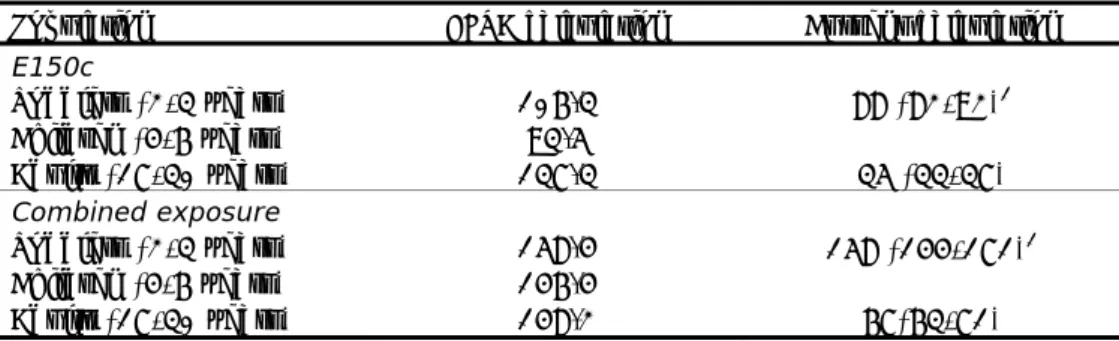
Table 10. High exposure (P95, mg/kg bw/d)) estimates E150c and combined exposure to E150 food colours in EFSA calculation and Tier 1 of the current calculation.
Population EFSA calculation Current calculation
E150c Toddlers (2-3 years) 106.3 88 (82-92)1 Children (4-6 years) 93.5 Adults (17-30 years) 137.3 35 (33-37) Combined exposure Toddlers (2-3 years) 158.4 158 (144-171)1 Children (4-6 years) 146.4 Adults (17-30 years) 148.2 67(63-71)
Table 11. Comparison of Tier 1 calculations (mg/kg bw/d) with maximum use levels for food categories and with maximum use levels per FoodEx1 food group.
Population Maximum use levels Food Category
Maximum use levels Food
Young children (2-6 years)
P50 45 (42-46) 39 (37-40) 88 (82-92) P95 92 (89-97) P97.5 104 (101-109) 100 (93-107) Adults (17-31 years) P50 17 (16-18) 12 (11-13) 35 (33-37) P95 94 (80-117) P97.5 137 (118-158) 42 (37-47) 3.6 Conclusion
E150 use levels provided by the industry resulted in a high quality, reliable data set that could be used for refined exposure assessments with use levels linked at the food level rather than food category level. Using these use levels, a more realistic exposure to E150 food colours was obtained. The exposure to E150c and the combined exposure to E150 food colours was much lower for the adult population aged 17-30 years compared to a recent EFSA calculation. For children aged 2-6 years, comparable estimates were obtained.
Tier 3 calculations, in which zeroes were included, indicated that the true exposure is likely to be lower, but weighing factors for market shares are needed to perform a more reliable estimate.
As for all exposure assessments, the current refined exposure assessment is subjected to uncertainties. Some of the uncertainties can be reduced by further refinement. The next chapter, future perspectives, addresses some possibilities for further refinement.
4
Future perspectives
This chapter describes the possibilities for further refinement of the exposure assessment of food additives using use levels provided by the industry. This includes further refining regarding the data collection process, the completeness and representativeness of the dataset, food coding system and the calculation tool. In addition, the public-private cooperation for data collection system for exposure monitoring is elaborated.
4.1 Refining data collection process
As indicated in Section 3.1.1 uncertainties may exist regarding the nature of products that may be present in powdered or liquid form. Inclusion of columns addressing dilution of products in the data collection template may reduce this uncertainty in future data collections. Another advantage of inclusion of such information in the data collection is that it will speed up the running time of the data collection process. Uncertainties may also exist for products with toppings, coatings and fillings and for foods consisting of mixtures (Section 3.1.1). Inclusion of columns addressing the concentrations in toppings, fillings and coatings and the percentage of the product containing the specific additive in the data collection template will reduce this uncertainty and will accelerate the process of data collection.
4.2 Refining completeness and representativeness of the dataset
The completeness and representativeness can be further refined by the inclusion of market shares, use of databases containing label information, use of facet codes available within FoodEx2, and/or using more refined exposure models.
4.2.1 Market shares
Because of a lack of data on market shares, the completeness and representativeness of the dataset cannot be quantified. In addition, when market shares are known, weighing factors for positive use levels and zeroes can be introduced, allowing reliable Tier 3 calculations.
A possible way to obtain data on market shares is to extract brands from the Dutch food consumption databases for each food category or, preferably, for each food of the FoodEx system. In addition to information on the completeness of the dataset, these market shares can be used to introduce weighing factors in the calculation describing the percentage of products within a food or food category that does not contain the additive. For example, if only zeroes are obtained for a certain food category and the received data covers 80% of the brands registered in Dutch food consumption surveys, a weighing factor of 0.2 and 0.8 can be introduced to assign a maximum use concentration or MPL to foods with an unknown concentration and a true zero concentration to foods known not to contain the additive, respectively. The possibility of extracting brands from the food consumption survey needs to be explored in future calculations.
4.2.2 Database label information
Another option for checking the completeness of the dataset is the future database on label information. Article 14 of Regulation 1169/2011 on the
provision of food information to consumers (EU 2011b) states that ‘mandatory food information shall be available before the purchase is concluded and shall appear on the material supporting the distance selling’. This means that for each food to be sold on line also label information must be available on line. This includes information on additives, as specified in Annex VII, part C of Regulation 1169/2011 (EU 2011b). GS1 is an organization aiming to the design and
implement global standards and solutions to improve the efficiency and visibility of supply and demand chains globally and across sectors. GS1, together with FNLI, is developing a database including all label information of food products on the Dutch market (personal communication Martine Kampman, FNLI). The GS1 database should be completed by December, 13, 2014, the date of application according to Article 55 of Regulation 1169/2011 (EU 2011b). Thus, in 2015, a database with up-to-date information on presence of specified additives in food products will be available to establish true zeroes and completeness of the dataset. Together with the information on market shares, even Tier 4 calculations (exclusion of foods and food categories that do not contain the specified additive) can be performed using this GS1 database. This will provide a more realistic exposure estimate.
The GS1 database may also be useful for selectively approaching industries, i.e. approaching those food companies with food products containing the specific additive.
4.2.3 Refining FoodEx2 coding: use of flavour facet codes
In the current study, individual food consumption data was linked to use levels using the FoodEx 1 classification system for young children aged 2 -6 years and the FoodEx2 classification system for the general population aged 7 to 69 years. With respect to FoodEx1, the level with the highest detail (level 4) was used wherever possible. However, even this level is not always detailed enough for the calculation of the exposure to additives. For example, the icing used on the food ‘iced biscuits’ may contain any colour allowed according to Annex II of Regulation 1333/2008. This results in an overestimation of the exposure to food colours, because not all types of icing contain the same type of food colour. For FoodEx2, facet codes have been introduced. For example, facet codes for sweeting agents and a facet code for use of preservative additives are available facilitating the exposure calculation of artificial sweeteners and preservatives, respectively. In addition, flavour note facet codes are available. These flavour note facet codes not only facilitate the calculation of exposure to flavours, but may also give an indication of the colour of the food product. For example, a product with strawberry flavour is likely to contain a red food colour. Whereas for some products, such as soft drinks, flavour facets are already included in the food consumption database of the population aged 7-69 years, this is not (yet) true for other food products. For example, no flavour facet codes are included for ‘starchy pudding’ or ‘custard’, whereas these products could have flavours like ‘caramel’, ‘vanilla’ or ‘raspberry’, each having a different colour. This results in an overestimation of exposure. For example , custards with ‘caramel’ flavour may contain E150, but those with flavours ‘vanilla’ and ‘raspberry’ will not. Assuming that all custards contain E150 thus overestimates the exposure. Extending the use of facet codes will further refine the exposure estimate.
4.2.4 Exposure calculation model
In the current calculations, the OIM method was used, since not all exposure distributions were normally distributed after a logarithmic transformation. Therefore, more refined statistical models such as Logistic Normal-Normal LNN model could not be used. As outlined in Section 2.6, the OIM method estimates the high exposure percentiles conservatively. Recently, within a new version of the MCRA calculation tool (MCRA 8.0), an additional method called Model-Then-Add has been implemented. With this method, the exposure via individual foods or food groups can be modelled separately using a statistical model. This
separate modelling per food (group) can include all relevant foods or only part of the foods. In the latter case, the exposure via the remainder of the foods is modelled using OIM. These exposure estimates per food (group) are
subsequently added to assess the total long-term exposure (van der Voet et al., 2013). It was shown that this model resulted in a more reliable, lower estimate of the exposure to smoke flavours compared to the OIM method (van der Voet et al., 2013). The use of this method in future exposure calculations needs to be explored.
4.3 Public-private cooperation for data collection system for exposure monitoring
The conclusion from the three studies performed with use levels obtained from the industry (Wapperom et al, 2011; Sprong et al, 2013; and the study
described in this report) is that public-private cooperation on data collection is a powerful tool for exposure assessment and the subsequent risk management. This data collection method has several advantages for the risk assessor as well as for the risk manager:
4.3.1 Advantages for the exposure assessor
High quality, representative data are essential for an adequate exposure assessment. An important advantage of the system described in this report, is that national branch organisations can build bridges between the industry, (governmental) institutes and governments. By emphasizing the need for data by national branch organisations, industries are more willing to provide data. Branch organisations can help to estimate the representativeness of the
database based on presence of main brands, although an exact figure cannot be obtained.
By using the system described in this report, exposure assessors obtain a representative dataset with:
less uncertainties in concentration data, since exposure assessors are able to get in contact with data providers via FNLI to fill gaps in the database or to clarify indistinct data. When using data from
international branch organisations such as NATCOL or FoodDrinkEurope, this is often not possible as these central organisations collect
(anonymized) data from their members and do not have precise information on these data;
use levels on the national level. Together with familiarity of the exposure assessor with the products on the national market and acquaintance with products consumed in the food consumption survey, this allows better linkage of use levels to food consumption based on food products rather than broad food categories
Taken together, this results in a refined and more realistic exposure assessment.
4.3.2 Advantages for the risk manager
According to Article 27 of the European Regulation on additives (1333/2008) the Member States shall maintain systems to monitor the consumption and use of food additives on a risk-based approach and report their findings with
appropriate frequency to the Commission and to the Authority. The method described in this report can be used to collect data for exposure monitoring, as stated above. Delivery of use levels by the industry is a cost-effective approach for Member States to monitor exposure to agents added to food, since collection of data on use levels is less costly than a monitoring system based on analysing food. For some additives, such as E150, analysis in food is presently not possible due to either the complex nature of the additive or a complex food matrix. Another main advantage is that the data are country-specific, in contrast to data obtained from international branch organisations. Although a European dataset can be very useful for a first exposure estimate (tier 1), regional differences may occur due to differences in use levels and eating habits. It is therefore advisable, when a pan-European assessment results in a possible health risk for a Member State, to investigate whether further refinement is possible, as part of a tiered approach.
4.3.3 International developments
DG Sanco of the European Commission has opened a tender for
an ad-hoc study into the development of a common methodology for gathering information by the Member States on the consumption and use of food additives and flavourings in the European Union. The methodology described in this report may be a cost-effective approach for other Member States as well. The
calculation of the exposure to additives combining individual food consumption data of other countries with use levels may be done with the MCRA platform, as has been done in the EU project ACROPOLIS (www. Acropolis-eu.com). In this EU project, MCRA was used to estimate the cumulative exposure to pesticide residues with food consumption and residue concentration data of different Member States classified according FoodEx1.
5
Conclusions and recommendations
5.1 Conclusions
The study described in this report underpins the conclusion of two former pilot studies: use level data provided by the industry result in a more reliable and representative dataset that can be used for exposure assessment, although exact figures on the completeness of the dataset cannot be provided. Data obtained in this way allow a refined exposure assessment, in which use levels of food products, rather than broad food categories, can be linked to the
consumption of these foods. This results in a more accurate exposure assessment.
This study showed that the exposure estimates of the adult population to E150c and to the combined exposure of E150 food colours were much lower
(approximately factor of 4 and 2, for E150c and the combined exposure, respectively) than those calculated by EFSA in 2012. For children, the exposure estimate for E150c was slightly lower (factor 1.2) than that calculated by EFSA 2012, whereas the exposure to combined E150 food colours did not differ from the EFSA calculation.
The present study also showed that the method can be used to obtain true zeroes. However, the representativeness of zero concentrations needs to be confirmed in future exposure assessments, before using these zeroes in Tier 3 calculations. Data on market shares and data on label information can be used for this purpose. Data on market shares can also be utilized to derive weighing factors for zeroes and positive use levels to be used in the calculation of the exposure estimates.
Taken together, the method of data collection of food colourings by public private cooperation between the national government and national branch organisations resulted in a cost-effective, powerful tool for refined exposure assessment to food additives and flavourings, with a win-win-situation for both risk managers and assessors, and the industry. The data collection system could also be adapted for use in other European countries.
5.2 Recommendations
Uncertainties in the dataset of additives and flavourings can be further reduced by introducing columns in the data collection template that provide information on dilutions of dried or concentrated products and on products that partly contain the food additive, if relevant.
Because information on market shares is important for determining the completeness of the data set, and for the introduction of weighing factors to assign zero concentrations to certain foods within a food that do not contain the additive in question, it is recommended to explore cost-effective methods of obtaining information on market shares, such as extraction of brand data recorded in the (Dutch) National Food Consumption Surveys.
Acknowledgements
The authors would like to thank Geert de Rooij from FNLI for his highly effective approach to obtain data from food industries, Polly Boon, Martine Bakker and Gerrit Wolterink (RIVM) for their valuable comments on the almost final version of the letter report.