Emissions by “other routes than air”
from protected crop systems
Position paper
letter report 607050004/2009 A.M.A. van der. LindenRIVM, P.O.Box 1, 3720 BA Bilthoven, the Netherlands. Tel +31 30 274 9111. www.rivm.nl
RIVM report letter 607050004
Emissions by “other routes than air” from protected
crop systems (greenhouses and crops grown under
cover)
Position paper
AMA van der Linden January 2009 Contact:
Laboratory for Ecological Risk Assessment Ton.van.der.Linden@rivm.nl
This investigation has been performed by order and for the account of EFSA, within the framework of contract NP/EFSA/PPR/2008/04.
Preface
The work described in this report has been performed by order and for the account of EFSA under contract CT/EFSA/PPR/2008/04. Remarks of members of the Working Group on emissions from protected crops on drafts of the report are gratefully acknowledged. Finally, thanks go to dr Frank Swartjes and dr Mark Montforts (both from RIVM) for reviewing the report.
RIVM Report letter 607050004 3
Het rapport in het kort
Emissies van gewasbeschermingsmiddelen uit bedekte teelten via
'niet-lucht routes'.
RIVM heeft onderzoek gedaan naar emissies naar water van gewasbeschermingsmiddelen die in Europa in bedekte teeltsystemen worden gebruikt. Doel is te voorkomen dat oppervlakte- en grondwater aan te hoge concentraties gewasbeschermingsmiddel blootstaan. Op dit moment blijkt onvoldoende informatie
beschikbaar om te kunnen bepalen welke emissies uit bedekte teelten het meeste effect hebben op het milieu. Deze rangschikking is nodig om scenario’s voor de toelatingsbeoordeling van gewasbeschermingsmiddelen te kunnen ontwikkelen. Met deze scenario’s kan worden bepaald of het middel mag worden gebruikt. Om een rangschikking mogelijk te maken, zijn bovendien gedefinieerde beschermdoelen nodig voor onder andere grondwater en oppervlaktewater.
Er bestaan modellen, met voldoende validatiestatus, om de uitspoeling van gewasbeschermingsmiddelen uit grondgebonden bedekte teelten naar grond- of oppervlaktewater te beoordelen. Dit geldt niet voor emissies uit substraatteelten, die als teeltsysteem steeds belangrijker worden. Bestaande modellen om de
waterstromen in substraatteelten te berekenen, lijken voldoende ontwikkeld om daaraan stofgedragmodellen te koppelen.Stofgedragmodellen geven weer hoe gewasbeschermingsmiddelen zich in het teeltsysteem gedragen en hoeveel in het oppervlaktewater terechtkomt.
Trefwoorden:
Abstract
Emissions by “other routes than air” from protected crop systems
(greenhouses and crops grown under cover)
Position paper
This report deals with a number of aspects relevant with respect to emissions from protected crop systems and scenario building to estimate these emissions. The aspects are:
Improving the scientific argument and review criteria for scoring and ranking of emissions
Insufficient information exists to rank emissions from protected crops. Protection goals have to be established in order to score emissions. Current scenarios for leaching from open fields are not representative of soil-bound protected crops systems.
Critical review of available models and calculation methods
Leaching models with sufficient validation, which can be used to simulate leaching from soil-bound protected crops, exist. Simulation models for emissions from hydroponic systems need to be developed. Coupling fate models to existing models of water flow for such systems seems promising. Existing models of water flow in hydroponic systems seem sufficiently detailed to be coupled to (not yet existing) models on fate of plant protection products.
Outline of scenario calculations
The approach taken for calculating leaching from open field applications seems promising for calculating emissions from protected crops. Firstly water flow is calculated for a large number of growing seasons (for example 20) in order to capture variability of water flow in time. Secondly fate models are run which use fate parameters of plant protection products and the output of the water models. From the results appropriate endpoints can be chosen.
Need for data and/or models
For both soilless and soil-bound cultivations data on precipitation, irrigation or water flow need to be gathered or generated, for all types of greenhouse construction. These data are essential for running models and derive realistic worst case emission scenarios.
Models of fate of plant protection products in hydroponic systems need to be developed and tested. Existing models are probably not capable of simulating leaching from soil-bound systems where plant protection products and / or water are not evenly applied to the soil. It is probably necessary to develop models for this, for example for simulating cultivations with drip irrigation.
Quantitative indication of emissions
Concentrations of a relatively mobile hypothetical substance in soil pore water at approximately 1 m depth were up to 0.37 µg/l in Palagiano (Italy) and 1.16 µg/l in Almeria (Spain). As a first impression, discharge emissions from hydroponic systems seem to be potentially higher than leaching emissions from soil-bound systems, but physico-chemical and fate properties of plant protection products as well as management will play a significant role in the actual emissions from protected crop systems.
Key words:
glasshouse, greenhouse, plant protection product, surface water, groundwater, soil-bound cultivation, hydroponics
RIVM Report letter 607050004 5
Samenvatting
1Over emissies van gewasbeschermingsmiddelen uit bedekte teeltsystemen in Europa heeft het RIVM
onderzoek gedaan naar onderstaande aspecten:
Kennis om emissies te rangschikken
Op dit moment is onvoldoende informatie beschikbaar om emissies uit bedekte teelten goed te kunnen rangschikken naar hun effect op het milieu. Bovendien is het nodig dat beschermdoelen voor onder andere grondwater en oppervlaktewater worden gedefinieerd om rangschikking mogelijk te maken.
Bestaande modellen en berekeningsmethoden
Er bestaan modellen, met een voldoend hoge validatiestatus, om de uitspoeling van
gewasbeschermingsmiddelen uit grondgebonden bedekte teelten te beoordelen. Dit geldt niet voor emissies uit substraatteelten. Bestaande modellen om de waterstromen in substraatteelten te berekenen, lijken voldoende ontwikkeld om daaraan stofgedragmodellen te koppelen.
Contouren van scenarioberekeningen
De huidige scenario’s om uitspoeling van gewasbeschermingsmiddelen naar het grondwater bij open teelten te berekenen, zijn niet representatief voor de bedekte teelten. De aanpak om uitspoeling uit open teelten te berekenen lijkt ook goed bruikbaar om emissies uit bedekte teelten te berekenen. In deze aanpak worden eerst de waterstromen voor een groot aantal (bijvoorbeeld twintig) teeltseizoenen berekend, waaraan het stofgedrag wordt gekoppeld. Dit levert een indruk op van de variabiliteit in emissies als gevolg van wisselende weersomstandigheden en voldoende informatie voor een toelatingsbeoordeling.
Beschikbaarheid van gegevens en/of modellen
Voor zowel grondgebonden als substraatteelten moeten gegevens over neerslag, irrigatie en/of waterstromen worden verzameld of gegenereerd, voor alle typen bedekking. Zonder deze gegevens kunnen modellen niet worden gedraaid en kunnen geen geschikte emissiescenario's worden afgeleid. Modellen voor het gedrag van gewasbeschermingsmiddelen in substraatteelten dienen nog te worden ontwikkeld en getest. Bestaande, breed geaccepteerde uitspoelingsmodellen zijn niet in staat de uitspoeling te berekenen voor situaties waarin water en gewasbeschermingsmiddelen niet homogeen op de bodem terecht komen. Zowel onder- als overschatting van de uitspoeling is dan mogelijk. Zo'n situatie kan zich bijvoorbeeld voordoen als water via een druppelsysteem wordt toegediend.
Indicatie van de grootte van emissies
Voor een relatief mobiele stof, toegepast op bedekte teelten in Palagiano (Italië) en Almeria (Spanje), werden op ongeveer 1 m diepte poriewaterconcentraties tot 0.37 en 1.16 microgram per liter, boven de norm van 0.1 microgram per liter, berekend. De eerste indruk is dat bij lozing van restanten
voedingsoplossing op het oppervlaktewater de emissies van gewasbeschermingsmiddelen hoger kunnen zijn dan uitspoeling bij grondgebonden teelten. Dit is afhankelijk van stofeigenschappen, maar kan ook worden beïnvloed door bedrijfsmanagement.
1 De samenvatting is gebaseerd op het abstract. In geval van twijfel is het abstract leidend. The 'Samenvatting' is based on the
RIVM Report letter 607050004 7
Contents
Abstract 4
Samenvatting 5
1 Introduction 9
1.1 Working group emissions from protected crops 9
1.2 Scope of the assignment 9
1.3 Classifications 10
1.3.1 Cover construction types 10
1.3.2 Cultivation systems 10
1.3.3 Application types 10
1.4 Potential emission routes 11
2 Reading guidance 13
3 Leaching and drainage 15
3.1 Development of leaching scenarios 16
3.2 Example calculations 17
3.2.1 Almeria 17
3.2.2 Palagiano 19
4 Discharge 21
4.1 Application to the nutrient solution 21
4.1.1 Preliminary sensitivity analyses 23
4.2 Spray application to the crop 25
5 Emissions 27
6 Discussion, conclusions and recommendations 29
References 33
Abbreviations 35
RIVM Report letter 607050004 9
1
Introduction
1.1
Working group emissions from protected crops
The Scientific Panel on Plant Protection Products and their Residues (PPR Panel) of EFSA
has been asked to develop an inventory of protected crop systems (e.g. greenhouses and cultivations grown under cover) and emissions of plant protection products (PPP) from these systems to relevant environmental compartments, and to provide guidance on the importance of emission routes including the circumstances under which they are relevant. To assist in the establishment of these products, the Working Group on Emissions from Protected Crops (WGEPC) has been established. The WGEPC consists of several members of the PPR Panel and five 'ad hoc experts' from England, Italy, the Netherlands and Poland.
In one of the early meetings of the Working group, it was agreed to that emission is the sum of all substance flows leaving the external (actual or virtual) boundary of the cover construction. The lower boundary of the cover construction is assumed to be at a depth of 1 m below soil surface, in line with adopted practice in scenarios on leaching from open field applications (FOCUS, 2000). In order to be able to compare emissions, a useful definition is: emission is the fraction (usually expressed as percentage) of the dose flowing out of the protected crop system. The dose is defined as the amount applied per unit area (usually taken to be one hectare).
1.2
Scope of the assignment
The position paper is expected to address the following2:
• Improving the scientific argument and review criteria for scoring and ranking of emissions through different (water and soil) routes (discharge from circulation drainage tank, discharge of rinsing water, controlled discharge of condensation water, not controlled emission of condensation water, leaching of applied substance to different receptors (air, surface water and sediment, groundwater, soil, Sewage Treatment Plants). The relevance to non-target organisms (terrestrial environment) and birds and mammals as potential receptors is also to be considered.
• Critical review of available models and calculation methods and level of validation that could be used for ranking and eventually scoring of emissions.
• Provide an outline of scenario calculations that would be needed for ranking and eventually scoring the emission (supported by practical examples).
• Highlight need for data and/or models that may not be available yet. Identification of parameters with high impact on the emission ranking. In addition proposals how to reduce uncertainty when these calculations are applied at different cover systems, crop categories, growing systems and different geographical areas.
2 Exact copy of part 3 of the terms of reference
1.3
Classifications
In the first few meetings of the WGEPC several classification systems were defined in order to
conveniently arrange possible emissions from application of plant protection products in the broad field of cultivation of crops under cover. Considered classifications are: 1) the construction of the cover, 2) the cultivation system and 3) the application type.
1.3.1
Cover construction types
The WGEPC considers six types of construction in (or under) which protected crops are grown: GlH glasshouse
GrH greenhouse LT low tunnel PS plastic shelter SH shade / net house WT walk-in tunnel
The construction types differ in their influence on climatic and environmental conditions under which crops are grown. The construction type may therefore have influence on the emission of plant protection products from the system.
1.3.2
Cultivation systems
Four cultivation systems are considered, depending on the crop being soilbound or not and the water, necessary for the growth of the crop, is recycled or not:
SnoR soil without recycling S+R soil with recycling SLnoR soilless without recycling SL+R soilless with recycling
1.3.3
Application types
Furthermore, the way in which the plant protection product is applied may significantly influence the relative importance of emission routes which may be considered and herewith the emission. Application types are:
DI drip irrigation3 FogFum fogging or fumigation Inj injection into the soil Spray spraying of the crop SoilAp soil application
RIVM Report letter 607050004 11
1.4
Potential emission routes
The following emissions routes were identified: − spray drift emission at moment of application − gas phase emission at moment of application
− gas-phase emission during compulsory ventilation prior to re-entry − long-term gas phase emission through uncontrolled openings − long-term gas phase emission through regulated openings − leaching
− discharge from tank − discharge of rinse water
− discharge of condensation (controlled) − discharge of condensation (uncontrolled) − run-off
This report covers the leaching and discharge emission routes, whereas spray drift and gas phase emission routes are treated in a separate position paper (Stanghellini, 2009). Run-off emission is not included in a position paper.
RIVM Report letter 607050004 13
2
Reading guidance
In the early stages of its work, the working group (WGEPC) decided to consider five receptors: air, groundwater, soil, sewage treatment plant and surface water. This report considers the receptors groundwater, surface water and sewage treatment plant. The receptor air is not considered, as the leaching and discharge emission routes do not end up in the air compartment. Furthermore, run-off is not considered. The report focuses on leaching in chapter 3 and discharge from (recirculation) drainage tanks in chapter 4. Emission of rinse water after cleansing of a cultivation system is considered different from discharge from drainage tanks as crop uptake will not occur in such a situation. Otherwise processes governing these two routes are not very different.
Chapter 5 describes emission routes in some detail, whereas chapter 6 discusses the aspects of scenario development and ranks emissions with respect to each other. Emission after condensation on cover materials and flow of condensation water and dissolved PPP in it, is not explicitly treated in this report. The process might become part of the overall scenarios for covered crops, i.e. when all appropriate emission routes from the whole systems are considered simultaneously. Tentatively these emissions are ranked relative to leaching and discharge from tanks.
The receptor soil is relevant for run-off and uncontrolled discharge of condensation, i.e. flow of condensation water to soil outside the covered crop system. Emission by discharge of condensation (uncontrolled) to soil probably can be judged from the condensation process in a discharge to surface water scenario. Proper scenarios for emissions via condensation water can only be established when emission via air is also taken into account. Emissions via air are treated in a separate report
RIVM Report letter 607050004 15
3
Leaching and drainage
Leaching and / or drainage of PPPs may occur if the PPP is applied to a soil-bound crop or – in case of soilless cultivation – the PPP reaches the soil or a permeable floor below the growing system. Leaching and / or drainage may be sharply diminished if the percolating water is captured and reused as a water supply for the growing crop.
The models which are used at the European level to calculate leaching to groundwater after application of a PPP in the open field (MACRO, PEARL, PELMO and PRZM (FOCUS, 1995)) in principle are also capable of calculating leaching of the PPP after application to covered crops. These models however were not developed for simulating situations in which water and / or PPP are unevenly applied, i.e. applied spot wise or band wise (see also paragraph 3.1). One may give preference to a particular model depending on prevailing circumstances (Dubus et al., 2002). For example, if interaction with groundwater has to be considered and drainage to surface water may occur, then the use of the PEARL model (Tiktak et al., 2001) is suggested.
Unlike the models, the scenarios developed for evaluating leaching under open field conditions (FOCUS 2000), will not be adequate for or representative of leaching of PPP under conditions
prevalent in covered crop systems. Conditions with respect to (artificial) precipitation, temperature and evaporation will deviate substantially from those in the open field. Leaching scenarios for protected crop systems have to be developed.
Definition of a scenario.
In 1995, FOCUS has given a rather pragmatic definition of a scenario. In the framework of the authorisation evaluation of plant protections products (PPPs) a scenario is defined as: a full set of data and parameters necessary for the calculation of a Predicted Environmental Concentration (PEC), excluding the plant protection product parameters (DOC 4952/VI/95).
Five categories of data and parameters, which are necessary input for the calculation of a PEC in a soil or a soil – groundwater system, can be distinguished (extension of list given by Klein and Knoche (1995)):
1. soil data and soil parameters;
2. hydrological data and boundary conditions; 3. climate data;
4. crop data and crop parameters; 5. plant protection product parameters.
In case of hydroponic systems, soil data and soil parameters should be replaced by data defining the characteristics of the hydroponic system and 'climate data' is probably best replaced by 'water regime and temperature' and category 2 data are probably not necessary.
Although parameters of the PPP are important for the PEC calculation, they are not regarded as part of the scenario as PPP are the subject of the evaluation. Parameters of the PPP include the
physico-chemical characteristics as well as information on the dose, the application method and timing of the application. So, in the definition of FOCUS, a scenario encompasses all data and parameters contained in categories 1 – 4.
3.1
Development of leaching scenarios
A number of sensitivity analyses have been performed regarding the influence of scenario data on the leaching of plant protection products to groundwater, using the models mentioned in the previous paragraph or their predecessors (see amongst others Boesten, 1991; Tiktak, 1994; Dubus et al., 2003). In general it is found that sensitivities depend on the position in the parameter space. In other words, there is no unique order in sensitivities found. Nevertheless, a general tendency can be seen, the leaching is:
− highly sensitive to pesticide properties (sorption and transformation);
− moderately sensitive to climatic conditions (amount and distribution of precipitation, temperature and its variability);
− slightly sensitive to soil properties not related to the sorption process (texture, hydrological parameters);
− slightly sensitive to crop parameters (times of emergence and harvest, rooting depth).
One should keep in mind that the crop development is important with respect to the amount (fraction of the dose) reaching the soil surface (FOCUS, 2000). This was not part of the sensitivity analysis. Soil properties interfering with the sorption process are the organic matter or organic carbon content, the bulk density and the pH. Soil hydraulic properties are important in case a low or non-sorbing PPP is applied.
When constructing scenarios, one should therefore primarily take into consideration: − amount and distribution in time of the (artificial) precipitation;
− temperature;
− organic matter content of the soil; − bulk density of the soil;
− soil pH (relevant only in case sorption is dependent on pH).
The approach followed when constructing the scenarios for open field applications (FOCUS, 2000) took account of the most influencing factors and therefore might be followed for deriving scenarios for covered crops as well4. Variations in climatic conditions might be taken into account through selecting representative time series of temperature and precipitation. Of course, representative scenarios might be different for different construction types. One should keep in mind that for most covered crops artificial precipitation (amount, pattern, intensity) is – to a large extent – controlled by the farmer. The water regime may influence the leaching of substances, especially the leaching of substances having low sorption.
The leaching process is only slightly sensitive to crop parameters. For open field applications, FOCUS (2000) more or less average crop parameters were chosen (from existing data), which reasonably matched climatic conditions for the scenario area. The same approach could be applied when
constructing scenarios for soil-bound crops grown under cover. It seems logic to constrain the number of crops to the most important ones (in terms of acreages), for selected (climatic) regions.
In open field systems, especially in South European countries, irrigation water is supplied to a number of crops. The irrigation water is not always distributed evenly over the field but applied in bands or spot wise, for example by means of drip irrigation. This also occurs, and probably evenmore frequent, in
4 The procedure as followed by FOCUS has been updated and will be reported within the not too distant future (FOCUS, in
RIVM Report letter 607050004 17 crops grown under cover. As pointed out by Leistra (1985) non-evenly distribution of (irrigation) water may influence the leaching. Part of this paper describes the influence of stagnant and mobile zones in the soil. Keeping the overall downward water flow at the same level, the leaching of substances sharply increases compared to the situation in which stagnant phases are absent. More research is needed to learn more about the relevance of such situations for the leaching process. Another part of this study describes the leaching of a substance applied to the stagnant zone in comparison to the same substance applied to the mobile zone. The simulations led to the results that hardly any substance leached when applied to the stagnant zone, whereas considerable leaching occurred when the substance was applied to the leaching zone. This finding seems quite relevant for crops grown under cover (in soil-bound cultivation). If the substance is applied with the irrigation water and the irrigation water is not spread evenly, then the leaching may be higher than anticipated from the situation in which the same amount of PPP is applied but the water is distributed evenly. As a first approach, the treated area within the field / parcel could be taken as the basis for the calculation, i.e. both PPP and water are supposed to reach only the treated part of the parcel.
If (part of) the PPP is applied to or reaching areas within the parcel not receiving water or receiving much less water, for example under low tunnels or partial plastic shelters, the leaching may be lower than anticipated. There is no easy approach for such situation as the number of unknown variables is too large. As a first approach, recognising that the leaching will be overpredicted, such a case could be considered covered by a normal application i.e. assuming that both water and PPP are spread evenly over the parcel. It is recommended that further research is conducted concerning models designed for such situations.
Soils used in soil bound covered crop cultivation might be influenced to a larger extent than open field soils, because of the construction activities or for other reasons (see also paragraph 3.2). Also,
development of soils might be different because of differences in climatic conditions due to the cover. It is unknown to what extent soils are influenced and what the differences (for example in organic matter content) between the soils are. Probably the soils' databases used by FOCUS are not representative of the soils used in covered crop cultivation. It might be necessary to make an appropriate survey of these soils.
3.2
Example calculations
Two example calculations were performed, one for a glasshouse situation in Almeria (Spain) and one for a covered vine crop in Palagiano (Italy). The vine crop in Palagiano was permanently covered with a hail net and temporarily covered with a plastic sheet. The scenarios are fully hypothetical, except that climate data were real measurements. The PEARL model has been used to calculate leaching of imidacloprid and procymidone in a glasshouse in Spain (Garratt et al., 2007). Their meteofile was used for the Almeria simulation. The soil profile of the Almeria experiment seems to be highly influenced as the top layer appeared to have a very low organic matter content. As it is unknown whether this is representative of large areas of covered crop cultivation, it was decided not to use this profile for the example calculations.
3.2.1
Almeria
Climatic data were obtained from James Garratt (personal communication, September 2008) and extended to meet requirements for a 26 years simulation period according to the FOCUS approach. Further input to the calculations were: FOCUS Sevilla soil and crop Sevilla-tomatoes (FOCUS, 2000). Plant parameters were adjusted to be in line with the climate data. A hypothetical substance (FOCUS
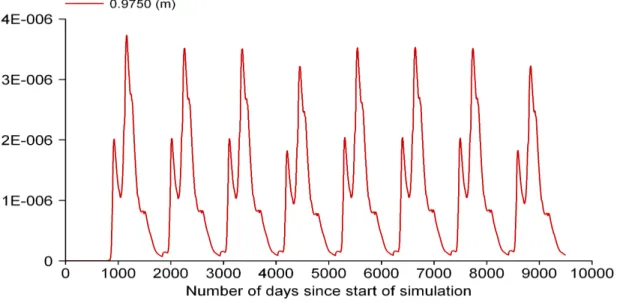
example D) with a half-life (DegT50) of 20 days and a sorption constant Kom of 35 dm3/kg was applied 5 times per year (starting 50 days after emergence with an interval of 10 days) at a rate of 0.25 kg per ha (net application rate to the soil surface) and the application scheme was repeated for each year of the simulation of 26 years. All other parameters were set to default PEARL parameters. Figure 3.1 gives the concentrations in the soil pore water at approximately 1 m depth in the soil profile. Given the conditions, the leaching concentrations at approximately 1 m depth range up to
approximately 4E-6 µg/l. The amount leached through the reference depth of 1 m below soil surface was negligible (<0.001% of the applied dose per year). The graph clearly shows a repeating pattern, due to the extension of the climate file.
At first glance, the leaching is somewhat lower than the leaching calculated for a standard FOCUS run for Sevilla tomatoes (open field applications). A simulation with the same substance and relative application scheme would result in a target leaching concentration (80th percentile of 20 successive
years) of 0.015 µg/l. The lower leaching level for the Almeria situation is due to a much lower water supply. The water percolation at the depth of 1 m is approximately ten times higher in the Sevilla scenario. Indeed, the water supply in the Almeria situation was optimised to the crop needs and in this way excess water minimised (James Garratt, personal communication October 2008). It has not been investigated whether such practise is representative of normal growth practices in the Almeria area. For a better comparison with open field applications, representative climatic conditions for a longer period of time need to become available, such that FOCUS type calculations can be performed with realistic variability in climatic conditions.
Fig 3.1 Simulated concentration of the FOCUS substance D at approximately 1 m depth after applications in an Almeria glasshouse scenario.
RIVM Report letter 607050004 19
3.2.2
Palagiano
Climatic data were obtained from Annalisa Merli / Ettore Capri (personal communication, September / October, 2008) for the period 22/05/2005 – 21/03/2007. Data from the days 01/01/2006 – 21/05-2006 were copied and put in front of the other data. The crop received some irrigation water, but this was not taken into account in the simulation. So the simulated leaching will be underestimated somewhat. Further input to the calculations were: Palagiano top soil with FOCUS Thiva subsoil and crop Piacenza vines (FOCUS, 2000). A hypothetical non-volatile substance with a half-life (DegT50) of 50 days and a sorption constant Kom of 10 dm3/kg was applied 5 times per year (starting June 1, 2005 with an
interval of 7 days) at a rate of 0.5 kg per ha (net application rate to the soil surface). The simulation period started at January 1, 2005 and ended at March 11, 2007. All other parameters were set to default PEARL parameters.
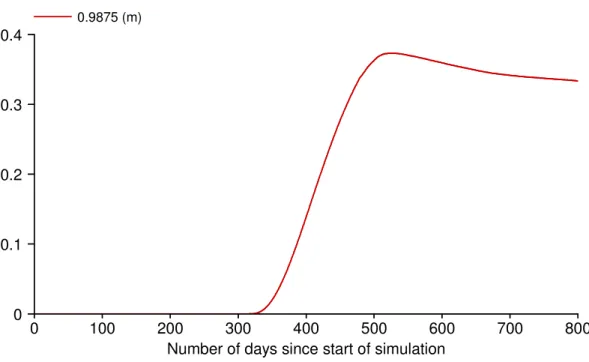
Figure 3.2 gives the concentrations in the soil pore water at approximately 1 m depth in the soil profile. Given the conditions, the leaching concentrations at approximately 1 m depth range from 0 to
maximally 0.37 µg/l. The amount leached through the reference depth of 1 m below soil surface was less than 0.01% of the applied dose. The maximum concentration is reached at day 530, almost one year after the first application. As in the simulation for Almeria, at first glance, the leaching is rather low compared to standard FOCUS leaching calculations for open field applications. Supposedly in the Palagiano situation this is due to the single application (no 'warm-up' period as in the standard runs) and the rather low water supply.
0 100 200 300 400 500 600 700 800
Number of days since start of simulation 0
0.1 0.2 0.3
0.4 0.9875 (m)
Substance concentration in the liquid phase (µg L-1) at different depths (m) (Run:8)
Substance code used for graph : "GHAB"
Figure 3.2 Simulated concentration of the hypothetical substance GHAB at approximately 1 m depth after application in a Palagiano vine stand covered with a permanent hail net.
RIVM Report letter 607050004 21
4
Discharge
The receptor of discharge water in this chapter is taken to be either surface water or a sewage treatment plant (STP). Actually the report is only about emissions from the covered crop system. Emissions are assumed to end up in the surface water compartment or the STP. Concentrations in the receiving water will depend on the emission as well as on the characteristics of the receiving water. The latter are not considered here.
4.1
Application to the nutrient solution
A literature search was performed in order to find out whether models exist which describe fate and behaviour of PPP in hydroponic systems. See Appendix 1 for the search profile. Unfortunately such models were not found. However, several models were found with which water flows in such systems can be simulated, depending on the quality (with respect to salinity) of the source and crop growth conditions (temperature in the glasshouse, irradiation conditions, air humidity and other), see for example Carmassi et al. (2007). In the leaching models (see chapter 2) the simulation of water flows in the system is independent of the simulation of the behaviour of the PPP. For example, the PEARL model uses results from a separate water model (SWAP) to calculate movement of the PPP through the system (see for example Tiktak et al., 2000). Likewise, it should be possible to couple water flow from an existing model to a PPP fate model for hydroponic systems.
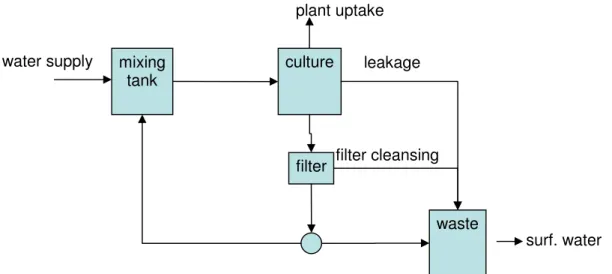
As a pilot, a simple model for simulating fate in and emissions from a hydroponic system was developed and coupled to results of a water flow model. A schematic presentation of the hydroponic system is given in Figure 3.1. The water flow model generates daily volume fluxes between the water reservoirs and the cultivation system as well as volumes of water discharged to surface water or sewage treatment plant. The simple fate model assumes first-order degradation kinetics in the reservoirs and passive uptake of the substance by the plants, using a transpiration stream concentration factor. Furthermore, the reservoirs are assumed to be perfectly mixed and temperature in all water tanks and pipelines is assumed constant (20 ºC).
Figure 4.1 Schematic presentation of the hydroponic system.
mixing
tank
culture
filter
waste
water supply
plant uptake
leakage
filter cleansing
surf. water
Figure 4.2 gives the results of the water flow model, which were used as input to the fate model. Volumes are calculated for a cultivation system of 1 ha. The water supplied to the cultivation system amounts approximately 20 m3/d at the start of the simulation in early January and peaks to
approximately 50 m3/d during summer and drops to again approximately 20 m3/d at the end of the year.
The amount of water taken up by the crop follows more or less the water supply, but is 5 – 10 m3/d
less. Most of the water not taken up is collected and recirculated to the crop. At rather regular intervals, starting at day 90, water is discharged from the system because of too high salt concentrations in the system. The rather irregular discharge around day 250 resulted from the necessity to use supply water having a lower quality (i.e. a higher salt content). The figure clearly shows the dynamics of the water requirements of the system.
Figure 4.2 Water volume fluxes. Fcult2crop is water taken up by crop, Fdrain2rct is recirculated water, Fdrain2wwt is water pumped to the waste water tank, Frct2cult is water pumped from the nutrient mixing tank to the cultivation system, Fwwt2sw is water discharged from the waste water tank to the surface water.
0 20 40 60 80 100 120 0 50 100 150 200 250 300 350 400
Time (d), Jan - Dec
vo lu m e flu x (m 3/ d) #Fcult2crop #Fdrain2rct #Fdrain2wwt #Frct2cult #Fwwt2sw
RIVM Report letter 607050004 23
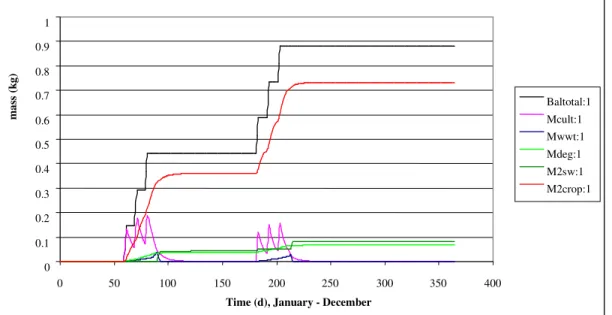
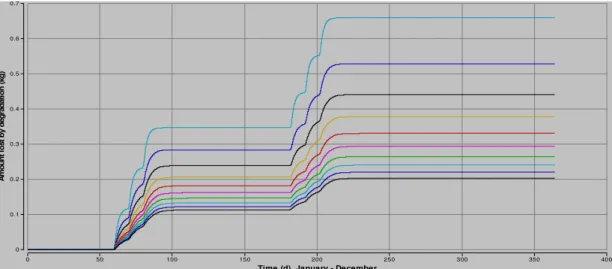
Figure 4.3 Results of the pilot model. Baltotal is the total amount of substance applied to the system, Mcult is the mass of substance in the cultivation part of the system, Mwwt is the mass in the waste water tank, Mdeg is the total amount transformed, M2sw is the amount discharged to surface water, M2crop is the amount taken up by the crop. Total amount applied is 0.88 kg.
Figure 4.3 gives the results of a run with the pilot model, for which the application data were supplied along with the water flow data. This nominal run resulted in approximately 80% uptake by the crop, 10% degradation in the water before discharge and 10% discharge to surface water. The parameters of the plant protection product in the nominal run were as follows: DegT50 in water = 73 days,
transpiration stream concentration factor (TSCF) = 0.5 and the volume of the cultivation system 125 m3 (per ha). In this situation, most of the PPP is taken up by the roots. Plant uptake is a very important process, in the example around 80% of the applied substance is taken up by the crop and therefore not liable to discharge to surface water. Plant uptake in a hydroponic system is relatively high compared to a soil-bound system because of relatively high concentrations of the substance in the solution. Also, substances with a relatively low TSCF will not be applied to the nutrient solution. In the example, approximately 10% of the PPP is degraded in the water system and also approximately 10% is discharged to surface water. The three dissipation processes, plant uptake, degradation and discharge, depend on each other. Discharge is – to some extent - controlled by the farmer and therefore the timing of discharge in relation to the application is an important parameter in the development of appropriate scenarios.
It must be noted that the pilot model does not include sorption of the PPP to the substrate of the hydroponic system nor sorption to organic matter residing in the substrate. Sorption may affect the emissions, as it retards the movement of the substance emissions might become smaller. This item, however, needs additional investigation. It is expected that sorption can be neglected when ranking emissions.
4.1.1
Preliminary sensitivity analyses
The water flows were obtained from an external model and, because the model itself was not available, water flows could only be used as such.
0 0.1 0.2 0.3 0.4 0.5 0.6 0.7 0.8 0.9 1 0 50 100 150 200 250 300 350 400
Time (d), January - December
m as s (k g) Baltotal:1 Mcult:1 Mwwt:1 Mdeg:1 M2sw:1 M2crop:1
Figure 4.4 gives the changes in the amount degraded in the system if the half-life of the substance is changed in the range 2 – 20 days, so much smaller than in the nominal run. The amount degraded changes form approximately 70% at a half-life of 2 days to approximately 20% of the dose at a half-life of 20 days. So the amount degraded is inversely correlated with the half-life. The differences between the amounts degraded become smaller when the half-lives become larger. The difference between 2 and 4 days is as large as the difference between 10 and 20 days. Differences become very small if the half-life gets above 50 days.
400 350 300 250 200 150 100 50 0 0.7 0.6 0.5 0.4 0.3 0.2 0.1 0
Time (d), January - December
A m ou n t l o st b y d eg ra da tio n (k g )
Figure 4.4 Influence of changing the half-life of the substance in the system, DegT50 is resp. 2, 4, 6, …, 20 d. The upper line is for a DegT50 of 2 d while the lower line is for a DegT50 of 20 days. Total amount applied is 0.88 kg. 400 350 300 250 200 150 100 50 0 0.7 0.6 0.5 0.4 0.3 0.2 0.1 0
Time (d), January - December
C ro p up ta ke a nd e m is si on to s ur fa ce w at er (k g)
Fig 4.5 Influence of changing TSCF on crop uptake and emission to surface water. TSCF is
respectively 0.1, 0.2, 0.3, 0.4 and 0.5. The lines starting increasing at approximately day 60 indicate the crop uptake, the lines starting increasing at approximately day 85 indicate the emission to surface water. Crop uptake increases with increasing TCSF, emissions decrease with increasing TSCF. Total amount applied is 0.88 kg.
RIVM Report letter 607050004 25 If the transpiration stream concentration factor is 0, nothing is taken up by the crop. The amount taken up increases with the TSCF, but not linearly. The effect tends to become smaller with increasing TSCF. A higher plant uptake goes along with a lower discharge to surface water. Also here the additional effect tends to be smaller with increasing TSCF. Even if the TCSF is equal to one, some discharge will still occur because not all the water is taken up by the plants.
Application times of the PPP in relation to water discharge events are important as well. It is anticipated that more substance will be discharged to surface water if application takes places around the water discharge events around days 200. Also if discharge of excess water is more continuous, it is anticipated that discharge of substance will become higher. More information should become available on discharge strategies of farmers, which might be dependent on the crop grown.
The water volume of the cultivation system will also influence the emissions (personal communication Cecilia Stanghellini, September 2008). This was investigated further by varying the volume of the cultivation system in the range from 100 to 150 m3/ha. In this analysis the DegT50 was 10 d. Varying
the volume has effect on the amounts taken up by the crop and the amounts degraded. It has hardly any effect on the emission to the surface water (see Figure 4.6). As can be seen, the effects appear to be linear.
Figure 3.6 Influence of the volume of the cultivation system on the emissions of a PPP to surface water. M2crop = mass taken up by the crop (curves at top), Mdeg = mass degraded (curves in the middle), M2sw = mass to surface water (curves at bottom).
4.2
Spray application to the crop
As described in chapter 1, emission of a PPP may be due to controlled or uncontrolled discharge of condensation water. Uncontrolled discharge may end up in soil or surface water. Emissions to soil may occur when condensation water is not collected and this water directly flows to soil.
In some countries collection of condensation water in glasshouses is statutory. Usually condensation water is used as a source for the water supply of the growing crop. If the crop is soil-bound, then the fate and behaviour of a PPP contained in the condensation water can be treated as a new application. Emission to groundwater or surface water as a result of leaching may occur, but in comparison to a normal dose, the amount of substance will usually be quite low and may be considered negligible. If the crop is grown soilless, substance arriving in the condensation water may be the single source of the substance in the nutrient solution. In principle the further behaviour of the substance can be handled as described in paragraph 4.1. Subsequently, the water model has to calculate the (dynamic) flows of condensation water to the growing system. For the calculation of the amount of substance flowing to the system the concentration in the condensation water has to be known. Possibly this can be calculated by assuming equilibrium between the glasshouse air and the condensation water. Discharge of
condensation (uncontrolled) can be calculated likewise. In comparison to the situation in which the PPP is applied to the nutrient solution, the emission to surface water and / or groundwater will be small as the 'effective dose' is relatively small. The calculation of the amount of condensation water is included in at least one of the models referred to in paragraph 4.1.
RIVM Report letter 607050004 27
5
Emissions
Five possible emission routes have been identified in which water is the carrier of the substance. Whether or not an emission poses a problem is not only dependent on the amount emitted, but also on the time in which the amount is emitted and characteristics of the receptor to which it is emitted. The time pattern of the emission will be produced by an appropriate model once scenarios have been established. For the assessment of risks, characteristics of the receptors as well as protection goals for these receptors should be defined (see for example Van der Linden et al., 2008).
Discharge from circulation drainage tank
This emission route typically goes along with a soilless cultivation system. A PPP that is contained in the nutrient solution is discharged to surface water or a sewage water treatment plant along with surplus nutrient solution. This emission route mostly will occur in glasshouses or greenhouses, but occasionally also in walk-in tunnels. This emission route is described in more detail, in terms of quantities emitted, in chapter 4.
Discharge of rinse water
This emission route is possible in all construction types having a waste water tank. Cleansing water originates from cleaning filtration systems and rinsing substrates, but also from scrubbing the floor and cleaning the (glass)cover. Such emission will therefore mostly occur in glasshouses. Some of the emissions attributed to this route may be covered in a scenario in which a PPP applied to a crop temporarily resides on a filter or on a floor. Total emissions may then be calculated in one run. A totally different scenario may be required for the situation in which a special product is applied specifically to the system in order to disinfect the system. In that case, the residence time in the system may be relatively short and processes like plant uptake will not occur. Emissions due to such
applications may be relatively high, depending on physico-chemical properties of the PPP (disinfectant), higher than discharge from drainage tanks, referred to above, because some of the dissipation processes will not occur5. This emission route is not further discussed in this report.
Discharge of condensation (controlled)
Discharge of condensation occurs in construction types equipped with a collection system for condensation water. In some countries, e.g. the Netherlands, such a collection system is statutory for glasshouses. Condensation water may contain PPPs because of exchange processes with the air in the system. Usually the condensation water is used as a water supply for the growing system, but surplus water will be discharged to surface water or sewage treatment plant. If any PPP is still left in the waste water tank, it will be disposed of at the same time. It seems logical to include the condensation water and the PPP contained in it in the scenario for calculating emissions for both soil-bound and
hydroponic growing systems. At the moment insufficient knowledge is available to include this route in the examples given in the two preceding chapters. Knowledge on drift and volatilisation (Stanghellini, 2009) needs to be incorporated in scenario and model development. If the condensation water is (re)used to fulfil the crop's water requirements, the emissions to surface water, soil and / or groundwater will be lower than when the water is not reused. In soil bound systems this is due to
5 It may be argued that such an application is a biocide application and therefore should not be evaluated according to
procedures for plant protection products. Evaluation according to the Biocides Directive procedures might then be more appropriate.
transformation in the soil and some plant uptake. In hydroponic systems this is primarily due to plant uptake (see also chapter 4).
Discharge of condensation (controlled)
If a collection system for condensation water is not installed, as e.g. is the case in low tunnels and walk-in tunnels, the condensation water is emitted in an uncontrolled way. Condensation water usually flows to the soil, which (partly) has to be considered as not being part of the covered crop system. A conservative assumption in this case is that the total amount in the condensation water flowing from the crop cover is regarded to be emission.
Leaching
Leaching of PPPs may occur after application of the substance to a soil-bound cropping system. In addition, leaching may occur after a spray application to a soilless cultivation if part of the applied PPP reaches the soil underlying the system (provided the floor of the system is not watertight). This emission route is treated in more detail is chapter 3.
Emissions of plant protection products may also originate from the disposal of crop remnants or crop support materials or even crop covers materials. These emissions are not considered by the WGEPC.
RIVM Report letter 607050004 29
6
Discussion, conclusions and recommendations
Improving the scientific argument and review criteria for scoring and ranking of emissions
As compared to emissions from open fields, emissions of PPP from protected crops have received little attention. Knowledge for scoring and ranking still largely has to be developed. Yet, methods applied to open field systems most probably can be adapted for protected crop systems. The basic approach applied in open field systems, i.e. coupling of PPP fate models to models of water and heath transport, can be applied to protected crop systems as well, when water is the carrier of the substance. Scenario development, i.e. establishing appropriate sets of input parameters for models, will be the most challenging task as the variability in conditions and practices seems quite large.
Without the help of simulation models, scoring and ranking of emissions will be impossible as databases on emissions covering all emission routes appear to be absent. Once appropriate scenarios and / or models have been established, ranking of emissions in term of amounts emitted is
straightforward. Protection goals for different receptors have to be set before the importance of emissions to different receptors can be scored against each other. Setting of the protection goals is a political task, not a scientific one.
The receptors most important in view of the emission routes discussed in this report are surface water, sewage water treatment plants, groundwater and soil. The latter is important only with respect to the emission of condensation water if this water is not collected and (re)used as a water supply for the crop. In order to quantify this emission to the soil, a link has to be established with the gaseous emission routes and the exchange between air and condensation water. Soil can also be exposed when run-off takes place, but this is restricted to the more open construction types only. Run-off is not further explored in this report.
Birds and mammals will have no access to the more closed construction types, glasshouse and
greenhouse. If only emissions are considered, birds and mammals will only be exposed indirectly from emission routes. Discharge emissions from drainage tanks and rinse water will cause the relatively highest exposure levels as emissions will be highest, dependent of course on properties of the PPP.
Critical review of available models and calculation methods
Existing leaching models seem to be fit for calculating leaching of plant protection products applied to soil bound crops grown under cover as well as leaching of plant protection products reaching the soil after spraying or fogging applications to soilless cultivations, at least when both water and PPP can be assumed to be spread evenly over the soil. These models are already used for several years in the EU as well as in EU Member States. The validation status may be considered rather high, at least compared to other available leaching models.
PPP and / or water will not always be evenly spread over the soil. Current leaching models used in the authorisation process are not developed to account for such situations. Some attempts have been made to develop models which account for spot or band application of water and / or PPP. These models indicate that both overestimation and underestimation of the leaching may be predicted by ordinary models, dependent on the situation. Underestimation may occur when water and PPP are applied at the same spots or bands. As a first approximation, leaching can be estimated assuming a smaller surface area, i.e. the area on which both water and PPP are applied. Overestimation may occur when the PPP is applied to those parts of the parcel which are not reached by precipitation or irrigation. At the moment
there is no (approximate) solution for this situation, but a normal calculation would be conservative. The validation status of the models, capable of simulating spot or band applications, is rather low.
Outline of scenario calculations
Scenario calculations typically are done in two steps. Firstly movement of water (and heath which is usually incorporated in the water model), in soil or in hydroponic systems, is calculated using an appropriate model of water flow (and heath). Secondly, the behaviour of the PPP is calculated based on the physico-chemical properties of the PPP and the results from the water model. In order to derive appropriate scenarios for evaluation purposes, for example 90th percentile vulnerable scenarios, it will
be necessary to gather appropriate climate data for each of the distinguished construction types, covering wide ranges in precipitation or water flows. Like in the FOCUS scenarios for open field, variability in time may be captured by calculating for long series of time, for example 20 years.
Need for data and/or models
Although leaching models exist for soil bound cultivations, appropriate scenarios to calculate emissions have to be developed. According to sensitivity analyses of the existing leaching models most important parameters and data in the selection procedure are:
- climate data (temperature and (artificial) rain, including their variation in time); - soil properties (organic matter or organic carbon content, bulk density and pH).
It is recommended to follow the approach taken with the development of the leaching scenarios for open field applications. This approach will be feasible for all construction types, except probably plastic shelters.
In covered crop systems, soils may have developed away from the original soil or be highly influenced by man. Existing soil databases may not be representative of soils occurring in covered crop systems. This needs to be checked and possibly new databases have to be established, based upon surveys of soils in covered crops systems.
Models for fate and behaviour of PPP in soilless cultivation systems, in which the PPP is applied to the nutrient solution, were not found in literature. However, models for simulating crop water requirements exist, for at least the Mediterranean area and for the North-Western part of Europe. In a pilot (see chapter 4), it was shown that water flows generated by such a model could be coupled to a simple behaviour model. Concentrations in the soilless cultivation system and in discharged waste water were in the same order of magnitude as concentrations found in practice. First analyses with this coupled system showed that following aspects are important for emitted amounts:
- the necessity for discharging water, which is largely dependent on the quality of the water source;
- the timing of the application with respect to the waste water discharge events; - the uptake of the PPP by the crop;
- the transformation (DegT50) of the PPP in the nutrient solution.
The transformation appeared to be important only in case of relatively low DegT50s.
It is recommended to search for existing records of water flow and temperature dynamics in soilless cultivation systems or generate such records using available models. Water flows and temperatures for southern European conditions may be different from water flows and temperatures for western and northern European conditions. This is not only due to general climatic conditions, but also to the quality of the water which can be used. In general higher salt contents in the source necessitate the use of more water as the salt concentrations otherwise may become too high to allow growth.
RIVM Report letter 607050004 31
Quantitative indication of emissions
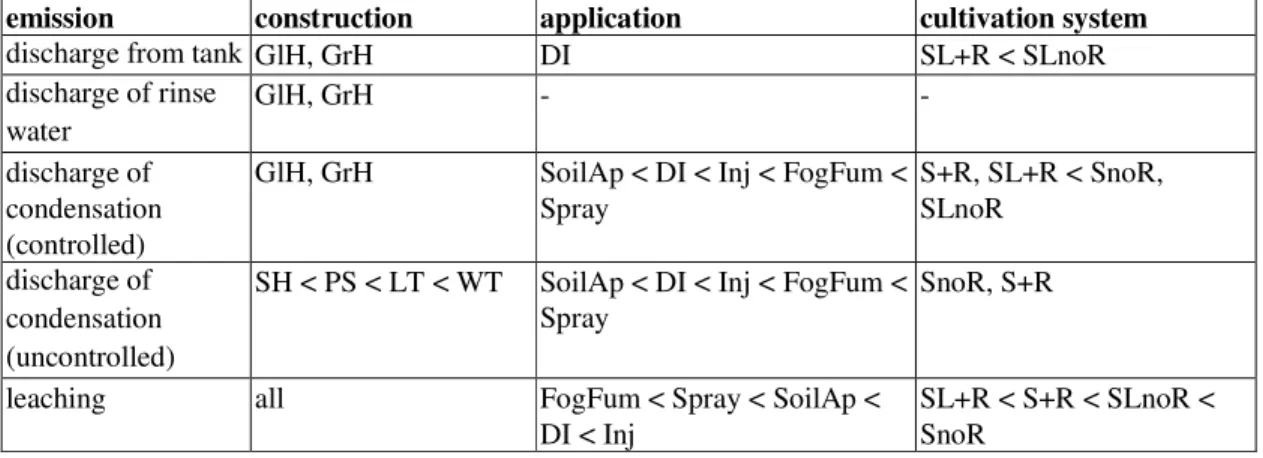
Emissions to groundwater, surface water and sewage treatment plants will be highly dependent on the physico-chemical and fate properties of the PPP. Tentatively, however, the emissions can be ranked as follows: leaching will be lower than discharge from the drainage tank or discharge of rinse water. The position of discharge of condensation (both controlled and uncontrolled) is unclear, they may be in between leaching and discharge from drainage tanks. Controlled discharge of condensation water will be smaller than uncontrolled discharge, but the receptor is different. Leaching will in general not exceed 1% of the dose. Concentrations of a relatively mobile hypothetical substance in soil pore water at approximately 1 m depth were up to 0.37 µg/l in Palagiano, Italy. For an Almeria glasshouse scenario with rather low water supply pore water concentrations at approximately 1 m depth stayed below the level of 4E-6 µg/l. From open field applications it is known that the groundwater threshold level will be exceeded if the amount leached is above approximately 0.1% of the dose (of around 1 kg/ha). The calculated leaching in the Almeria example was less than 0.1%. Leaching to deeper groundwater or emissions via drainage to surface water will be smaller if the leachate is collected and reused as a water source for the growth of the crop. The calculated emission from the hydroponic example in chapter 4 was higher than 1% of the dose, for a substance with a relatively high TSCF and a relatively high DegT50 in water. It was shown that the emission is highly dependent on this TSCF and (water)management in relation to the application of the PPP. Emission due to discharge of rinse water may be larger than emission due to discharge of water from the drainage tank, because plant uptake does not occur when cleaning the system. Table 6.1 gives tentative rankings of potential emissions to groundwater, surface water and sewage treatment plants as influenced by construction type, application type and cultivation system, for each emission route separately.
Table 6.1 Tentative ranking of influence of construction type, application type and cultivation system on emission routes "other than air"
emission construction application cultivation system
discharge from tank GlH, GrH DI SL+R < SLnoR
discharge of rinse
water GlH, GrH - -
discharge of condensation (controlled)
GlH, GrH SoilAp < DI < Inj < FogFum <
Spray S+R, SL+R < SnoR, SLnoR discharge of
condensation (uncontrolled)
SH < PS < LT < WT SoilAp < DI < Inj < FogFum <
Spray SnoR, S+R
leaching all FogFum < Spray < SoilAp <
RIVM Report letter 607050004 33
References
Boesten JJTI. 1991. Sensitivity analysis of a mathematical model for pesticide leaching to groundwater. Pestic. Sci. 31: 375-88
Carmassi G, L Incrocci, R Maggini, F Malorgio, F Tognoni, A Pardossi. 2007. An aggregated model for water requirements of greenhouse tomato grown in closed rockwool culture with saline water. Agricultural water management 88, 73 – 82.
Dubus IG, Beulke S, Colin D Brown CD. 2002. Calibration of pesticide leaching models: critical review and guidance for reporting.Pest Manag Sci 58:745-758.
Dubus IG, Colin D Brown CD, Beulke S. 2003. Sensitivity analyses for four pesticide leaching models.
Pest Manag Sci 59:962–982.
Garratt JA, Wilkins RM. 1999. A new approach to 2-dimensional modelling of pesticide transport in soil. In
Del Re AM, Brown C, Capri E, Errera G, Evans SP, Trevisan M. (Eds.).
Proceedings of the XI Symposium Pesticide Chemistry, September 11-15, 1999, Cremona, Italia.Garratt JA, Kennedy A, Wilkins RM, Urena-Amate MA, Gonzalez-Pradas E, Flores-Cespedes F, Fernandez-Peres M. 2007. Modeling Pesticide Leaching and Dissipation in a Mediterranean Littoral Greenhouse. J. Agric. Food Chem. 55, 7052-7061.
FOCUS. 1995. Leaching models and EU registration. Doc 4952/VI/95. Available at: http:://focus.jrc.ec.europa.eu/
FOCUS, 2000. FOCUS groundwater scenarios in the EU review of active substances. Report of the FOCUS groundwater scenarios workgroup. EC Document. Sanco/321/2000 rev.2., 202 pp. Available at http://viso.ei.jrc.it/focus/gw
Klein and Knoche. 1995. In: Leaching models and EU registration. Doc 4952/VI/95. Available at: http:://focus.jrc.ec.europa.eu/
Leistra M. 1985. Computer simulations of the transport of pesticides with non uniform water flow in greenhouse soils. Soil Science 140 (3), 161-169.
Linden AMA van der, Boesten JJTI, Brock TCM, Eekelen GMA van, Horst MMS ter, Jong FMW de, Montforts MHMM , Pol JW. 2008. Revised proposal for the risk assessment of persistence of plant protection products in soil. RIVM Report 601712003/2008
Stanghellini C. 2009. Emissions by aerial routes from protected crop systems (greenhouses and crops grown under cover). A position paper. Wageningen UR Greenhouse Horticulture, Report 224. Tiktak A, Swartjes FA, Sanders R, Janssen PHM. 1994. Sensitivity analysis of a model for pesticide
leaching and accumulation. In: Grasman J, Straten G. van (eds.). Predictability and nonlinear
modelling in natural sciences and economics. Kluwer Academic Publishers, Dordrecht, the
Netherlands, pp 471-484.
Tiktak A, Berg F van den, Boesten JJTI, Leistra M, Linden AMAvan der, Kraalingen D van. 2000.
Pesticide Emission Assessment at Regional and Local Scales: User Manual of FOCUS Pearl version 1.1.1. RIVM Report 711401008, Alterra Report 28, RIVM, Bilthoven, 142 pp. Available at http://www.pearl.alterra.nl
RIVM Report letter 607050004 35
Abbreviations
DegT50 degradation half-life of a substance EFSA European Food Safety Authority
Emission all substance flows leaving the external (actual or virtual) boundary of the construction under
which the covered crop is grown
Kom organic matter sorption coefficient of a substance PEC Predicted Environmental Concentration
PPP Plant Protection Product
PPR Panel EFSA Scientific Panel on Plant Protection Products and their Residues RIVM Netherlands National Institute for Public Health and the Environment STP the receptor Sewage Treatment Plant
TCSF Transpiration Stream Concentration Factor, factor which describes the uptake of a PPP relative
to the uptake of water
RIVM Report letter 607050004 37
Appendix 1 Scopus search profile
The following search profile was employed to search literature (in August 2008) with respect to information on emissions from covered crops. The search was performed in all databases linked to the SCOPUS system. See http://info.scopus.com/detail/what/ and included links for details on covered journals and other information.
The procedure started with searching titles, abstracts and keywords for the occurrence of the words glasshouse or greenhouse or covered crops. This resulted in an enormous number of references. The next steps involved elimination of references based on the occurrence of specific words in title, abstract or keywords.
Approximately 200 references remained, which were scanned manually. Search profile
Your query: (((ABS-KEY(glasshouse OR greenhouse OR "covered crop") AND NOT TITLE-ABS-KEY(econom* OR politic* OR polic* OR "greenhouse gas" OR fertili* OR manure OR morphol* OR physio* OR nitro* OR phosph* OR "climate change" OR producti* OR nutrit* OR mortal* OR cd OR copper OR cf4 OR sf6 OR arctic OR antarct* OR metal* OR landfill)) AND SUBJAREA(mult OR agri OR bioc OR immu OR neur OR phar OR mult OR ceng OR CHEM OR comp OR eart OR ener OR engi OR envi OR mate OR math OR phys)) AND (water OR
RIVM
National Institute for Public Health and the Environment P.O. Box 1
3720 BA Bilthoven The Netherlands