TRENDS IN GLOBAL CO
2
AND
TOTAL GREENHOUSE GAS
EMISSIONS
2017 Report
J.G.J. Olivier, K.M. Schure and J.A.H.W. Peters
Trends in global CO2 and total greenhouse gas emissions: 2017 Report
© PBL Netherlands Environmental Assessment Agency The Hague, 2017
PBL publication number: 2674
Corresponding author jos.olivier@pbl.nl
Author(s)
J.G.J. Olivier, K.M. Schure, J.A.H.W. Peters
Acknowledgements
We thank IEA, USGS, IFA and GCP for providing recent statistics. We thank the members of the EDGAR team at EC-JRC for their support in the data compilation of the CO2 Fast Track 2016 and comments on an earlier draft of this report.
Graphics
PBL Beeldredactie
Production coordination PBL Publishers
This publication can be downloaded from: www.pbl.nl/en. Parts of this publication may be reproduced, providing the source is stated, in the form: Olivier J.G.J. et al. (2017), Trends in global CO2 and total greenhouse gas emissions: 2017 report. PBL Netherlands Environmental Assessment Agency, The Hague.
PBL Netherlands Environmental Assessment Agency is the national institute for strategic policy analysis in the fields of the environment, nature and spatial planning. We contribute to improving the quality of political and administrative decision-making by conducting outlook studies, analyses and evaluations in which an integrated approach is considered paramount. Policy relevance is the prime concern in all of our studies. We conduct solicited and
Contents
EXECUTIVE SUMMARY
4
Global greenhouse gas emissions and emission trends 4
CO2 emissions 5
CO2 concentrations 5
1
INTRODUCTION
6
2
TRENDS IN GLOBAL EMISSIONS
8
2.1 Global trends in total greenhouse gas emissions 8
2.2 Global trends in CO2 emissions 13
2.3 Global atmospheric CO2 concentrations surged in 2016 16
3
TRENDS IN LARGEST EMITTING COUNTRIES AND THE EU28 17
3.1 China 20 3.2 United States 24 3.3 European Union 28 3.4 India 32 3.5 Russian Federation 35 3.6 Japan 38
APPENDICES
41
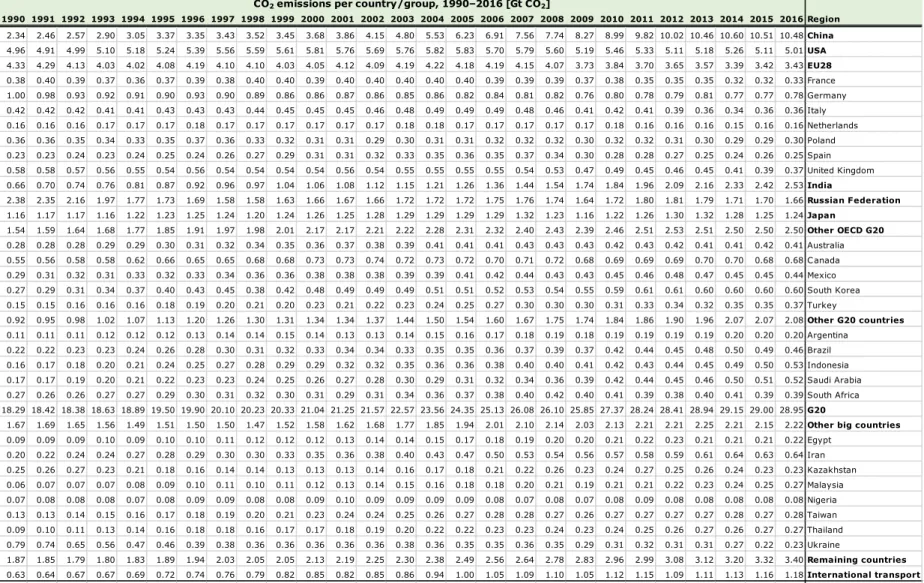
A. CO2 emissions: per country, per capita, per USD of GDP 41
B. Greenhouse gas emissions: total, CH4, N2O, F-gases 45
C. Recent trends in electricity production:fossil, renewable, nuclear 50
D. Methodology for non-CO2 emission estimates 2013–2016 54
Greenhouse gases and activity data 54
Data sources and methodology used for estimating 2013–2016 emissions 55 Revisions in emissions by switching from EDGAR v4.2 FT2010 to v4.3.2 57
Quality and completeness of data 57
Executive summary
In 2016, total global greenhouse gas (GHG) emissions (excluding those from land use) continued to increase slowly by about 0.5% (±1%), to about 49.3 gigatonnes in CO2 equivalent (Gt CO2 eq). Taking into account that 2016 was a leap year, and therefore 0.3% longer, and together with the 0.2% increase in 2015, the 2016 emission increase was the slowest since the early 1990s, except for global recession years. This is mainly the result of lower coal consumption from fuel switches to natural gas and increased renewable power generation; in particular, in wind and solar power. Most of the emissions (about 72%) consist of CO2, but methane (CH4), nitrous oxide (N2O) and fluorinated gases (so-called F-gases) also make up substantial shares (19%, 6% and 3%, respectively).
These percentages do not include net emissions from land use, land-use change and forestry (LULUCF), which are usually accounted for separately, because they are inherently very uncertain and show large interannual variations. When including LULUCF emissions — for 2016 estimated at about 4.1 Gt CO2 eq — estimated global total GHG emissions come to 53.4 Gt CO2 eq. The trend in global CO2 emissions excluding those from LULUCF has remained more or less flat, over the last two years (±0.5%). Non-CO2 greenhouse gases retained an annual growth rate of about 1%.
Global greenhouse gas emissions and emission trends
• Total global greenhouse gas emissions have shown a slowdown in growth, and increased in 2016 by about 0.5% to reach 49.3 Gt CO2 eq (excluding those from LULUCF, thus also from forest and peat fires) (uncertainty estimate in the trend ±1%).
• Since the early 1990s, such slow annual emission increases have only occurred in 2015, during the global economic recession in 2008–2009, and during the major global financial crisis in 1998 that resulted from the Asian financial crisis.
• Over the past three years, non-CO2 greenhouse gas emissions have continued to grow somewhat faster than CO2 emissions, namely by 1.5% (2014), 1.2% (2015) and 1.0% (2016), whereas over the same period CO2 increased by a respective 0.8%, -0.2% and 0.3%.
• Globally, the combined share of CH4, N2O and F-gas emissions is about 28% in total GHG emissions (19%, 6%, and 3%, respectively), of which F-gases show the highest growth rate of about 3% in 2016, followed by N2O of about 1.3%, whereas methane has remained at 2015 levels in 2016.
• The global share of non-CO2 greenhouse gases is estimated to have declined from 35% in 1970 to 27% in 2013, after which it started to increase, slowly, to about 27.5% in 2016, because of the reduction in the growth in CO2 emissions.
• For methane (CH4), coal mining, oil and natural gas production and gas distribution, together, account for 25% of methane emissions. Cattle are responsible for another 23% of methane emissions, worldwide, and rice cultivation contributes 10%. The relatively large fraction of methane that stems from energy-related emissions, together with stagnation of growth in energy-related emissions, causes methane to show the least growth in non-CO2 GHG emissions.
• The main sources of N2O emissions are agricultural sources, such as animal manure and the use of fertilisers, which together account for about 75% of N2O emissions. Contrary to energy-related emissions, agricultural-related emissions continue to grow.
• F-gases are a very heterogeneous category, with large differences in growth rates and often very large uncertainties in emissions. The largest sub-categories are HFC-134a from refrigeration and air conditioning (about 19%), HFC-125 and HFC-143a from consumption (17% and 19%), and HFC-23, which is a by-product of the production of HCFC-22 (19%). • Net emissions from land-use change are usually accounted for separately, among other
things because they are inherently very uncertain and show large interannual variation. In 2016, those emissions are estimated at 4.1 Gt CO2 eq.
CO
2emissions
• The trend in global CO2 emissions, excluding those from LULUCF, has remained more or less flat over the last years at 35.7, 35.6 and 35.8 Gt CO2 in 2014 to 2016 with -0.2% and +0.3%,respectively (uncertainty estimate in the trend ±0.5%).
• In 2016, the five largest emitting countries (China, the United States, India, the Russian Federation, and Japan) and the European Union, which together account for 51% of the world population, 65% of global gross domestic product (GDP) and 67% of the total primary energy supply (TPES1), accounted for 68% of total global CO2 emissions and about 63% of total global GHG emissions.
• The group of 20 largest economies (G20) accounted for 81% of global CO2 emissions and 78% of global GHG emissions.
• Most of the large countries showed a decrease in CO2 emissions in 2016; most notably the United States (-2.0%), the Russian Federation (-2.1%), Brazil (-6.1%),
China (-0.3%), and, within the European Union, the United Kingdom (-6.4%). The CO2 emissions in the European Union as a whole remained flat.
• The largest absolute increases in 2016 were seen in India (+4.7%) and Indonesia (+6.4%) and smaller increases in Malaysia, Philippines, Turkey and the Ukraine. • Emissions from international transport (aviation and shipping) constitute about 3% of
global total greenhouse gas emissions.
• Despite lower GDP growth in recent years, compared to pre-crisis years, the energy intensity of the economy, defined as total primary energy use (TPES1) per unit of GDP has continued to decrease, but no structural change on this indicator has occurred in recent years.
• The emission intensity of energy, represented by CO2 per unit of energy, has decreased over most of the past five years. This can be attributed to the recent trend of coal having been substituted by other fuels (with lower emission factors) and of renewable energy having increased in the energy mix, in particular in China and the United States.
CO
2concentrations
• The global average CO2 concentration in the atmosphere increased in 2016 by a record amount of 3.3 parts per million, which is in part due to a very strong El Niño event in 2015/2016: in tropical regions more forest and peat fires and regional less photosynthesis and more carbon decomposition due to local dryer and generally much warmer weather and less ocean absorption has led to more CO2 emissions and less CO2 removal by the LULUCF sector and thus to more net emissions.
1 TPES, or Total Primary Energy Supply, is the total amount of energy consumption of a country (or the world). It is calculated as in BP (2017): using a substitution method for nuclear, hydropower and other non-biomass
1 Introduction
In this report we present recent trends, up to 2016, in greenhouse gas (GHG) emissions for both CO2 and non-CO2 greenhouse gas emissions. We calculated these emissions based on the new EDGAR database version 4.3.2 (Janssens-Maenhout et al., 2017a,b). In 2017 this version of the EDGAR database has been finalised and includes comprehensive activity and emission factor data up to 2012, and where available until later years. For the years after 2012 up to 2016 a Fast Track method was used for CO2 emissions (using the methodology as described in Olivier et al. (2016a) and Box 1.1), and for non-CO2 emissions we used a hybrid method of partly fast track and partly extrapolation for non-CO2 emissions, see Box 1.1 and Appendix D for more details.
The JRC booklet by Janssens-Maenhout et al. (2017b) provides for all countries and the European Union one graph showing the emissions of CO2 and one for the three main greenhouse gases CO2, CH4 and N2O using data from EDGAR v4.3.2 (1990–2012). The CO2 graph in that report shows the trend up to 2016 as compiled in FT2016 for this report, whereas the greenhouse gas graph covers the 1990-2012 period.
Please note that the EDGAR v4.3.2 data set, and thus also the JRC booklet, does not include emissions from savannah burning (IPCC/UNFCCC subcategory 3E of the Agriculture sector), because international statistics are lacking. However, the FAO has compiled emission
estimates for CH4 and N2O per country for this source based on the figures of area burned on a spatial grid of pixels in the GFED4.1s data set2 (Van der Werf et al., 2010) and default emission factors from IPCC (2006). Therefore, to have a complete data set covering all sources of greenhouse gas emissions, we included in this report the CH4 and N2O emissions from savannah burning as reported by the FAO. The share of these emissions in global total emissions is 1.5% for CH4 (5.6 Mt CH4 or 140 Mt CO2 eq) and 5% for N2O (0.5 Mt N2O or 149 Mt CO2 eq). However, for individual countries the shares can be much larger, in example for Australia, which savannah burning emissions are one third of the global total, shares in the national CH4 and N2O emissions in the EDGAR data set are 25% and 50%, respectively.
Non-CO2 emissions constitute a significant fraction of global greenhouse gas emissions. For climate policies this refers to methane (CH4), nitrous oxide (N2O) and the so-called F-gases (HFCs, PFCs, SF6 and NF3). To our knowledge this report is the first to provide estimates of the total global emissions including 2016 that is based on detailed activity data and trends in emission factors for these years. Other work is available for historical time series of
anthropogenic greenhouse gas emissions until 2005, 2012 and 2014, respectively: US Environmental Protection Agency (EPA) on global non-CO2 greenhouse gas emissions for 1990–2005 (US EPA, 2012); the CAIT database for greenhouse gas emissions for 1990–2012 compiled by the WRI (2015) and the PRIMAP-hist data set for 1850–2014 developed at the Potsdam Institute for Climate Impact Research (PIK) (Gütschow et al., 2016).
For net CO2 emissions from land use, land-use change and forestry (LULUCF), we used data recently generated in the Global Carbon Project (GCP) (Houghton et al., 2012) through 2015
2 The UN Food and Agricultural Organisation (FAO) has compiled savannah burning emissions using monthly burned area data per 0.25ox0.25o grid cell for five land cover types from the GFED4.1s dataset (Van der Werf et al., 2010), multiplied by biomass consumption per hectare and tier 1 emission factors from IPCC (2006) and aggregated at country level. The GFED data cover the period 1996-2014. For years before 1996 FAO used the average of the 1996 to 2014 values and for 2015 and 2016 we used the average of the 2010 to 2014 values. For details see: (a) Dataset Information at http://fenixservices.fao.org/faostat/static/documents/GH/GH_e.pdf, (b) Metadata at http://www.fao.org/faostat/en/#data/GH/metadata.
(Houghton and Nassikas, 2017), which include data on CO2 emissions from forest and peat fires from the Global Fire Emissions Database version GFED4.1s through 2016 (Van der Werf et al., 2010). Those data are inherently very uncertain and therefore typically not included in representations of emission data. However, for the comprehensive overview of all GHG emissions and removals, we included them in the main figure (Figure 2.1) to illustrate their share in overall, total global anthropogenic GHG emissions. Discussions on emission data focus on those derived from the EDGAR database, which excludes LULUCF emissions.
The focus of this report is on the top 5 emitting countries and the European Union, and the global total. Uncertainty in non-CO2 emissions data is by nature much larger than that for the CO2 emissions (excluding forest and other land-use related emissions, ‘LULUCF’). This is because these sources are much more diverse and emissions are determined by
technological or other source-specific factors, whereas for CO2 the emission factors are mainly determined by the fossil fuel type and carbon content.
In Chapter 2 we discuss the global emission trends. Firstly, in section 2.1, we discuss the total greenhouse gas emissions, with a focus on the non-CO2 greenhouse gases, which are new in this report. Secondly, in section 2.2, we will discuss the trends of CO2 emissions, for which we also make use of the Kaya identities (Kaya, 1990) to distinguish trends in gross domestic product (GDP), energy intensity, and emission intensity. In Chapter 3 the five main emitting countries and the European Union are discussed separately in more depth.
Tables with the new data on CO2 and total GHG emissions and on electricity production can be found in Appendices A–C, and the new methodology that we have used to estimate non-CO2 emission trends up to 2016 is discussed in Appendix D. There we also summarise the revisions in greenhouse gas emissions by switching from EDGAR v4.2 FT2010 to the new v4.3.2. Finally, we discuss in Appendix D the quality and completeness of CH4 and N2O emissions by comparing trends in the EDGAR dataset with the trend in total CH4 and N2O emissions from the official reported national emissions.
Box 1.1 Extending EDGAR v4.3.2 from 2012 to 2016: Fast Track method for CO2 and hybrid
method for non-CO2 gases
The data presented here have been calculated using the new EDGAR 4.3.2 data set, which provides emissions per source and country, for the 1970–2012 period (Janssens-Maenhout et al., 2017a,b). The data set was extended for CO2, using international statistics through 2016 (so-called Fast Track 2016), and for other greenhouse gases, using statistics through 2014 (FAO), 2016 (IEA, BP), and other data sources (including CDM projects in developing countries through 2016 to account for reductions in CH4, N2O and HFC-23 emissions). In cases where data through 2016 were lacking, which was often the case for non-CO2 greenhouse gases, we extrapolated data from three recent years. For a more detailed description of the Fast Track methodology for CO2, see Olivier et al. (2016), and, for the hybrid methodology of partly fast track and partly extrapolation and the data sources used for estimating the non-CO2 greenhouse gas emissions beyond 2012, see Appendix D. The total in greenhouse gases emissions is expressed in terms of gigatonnes of global annual CO2 equivalent emissions (Gt CO2 eq), calculated using the so-called Global Warming Potentials for 100 years (GWP-100) as listed in the IPCC Fourth Assessment Report (AR4) (IPCC, 2007). These GWP’s are now also used by so-called Annex I countries (developed countries) which are annually reporting their national GHG emissions inventory (NIR) to the UN Climate Secretariat (UNFCCC, 2017). The historical GHG emission trends from the EDGAR database are also presented in UNEP’s Emissions Gap Report 2017, but using the GWPs of the IPCC Second Assessment Report (UNEP, 2017). These GWP’s are still used by so-called non-Annex I countries (developing countries) in their biannual reported Biennial Update Report (BUR) to the to the UN Climate Secretariat (UNFCCC, 2017).
2 Trends in global
emissions
2.1 Global trends in total greenhouse gas emissions
In 2016, total global greenhouse gas emissions continued to increase slowly by about 0.5% (±1%), to about 49.3 gigatonnes in CO2 equivalent (Gt CO2 eq). Taking into account that 2016 was a leap year, and therefore 0.3% longer, and together with the 0.2% increase in 2015, the 2016 emission increase was the slowest since the early 1990s, except for global recession years. This is mainly the result of lower coal consumption from fuel switches to natural gas and increased renewable power generation; in particular, in wind and solar power. Most of the emissions (about 72%) consist of CO2, but methane (CH4), nitrous oxide (N2O) and fluorinated gases (F-gases) also make up substantial shares (19%, 6% and 3%, respectively).
These percentages do not include net emissions from land use, land-use change and forestry (LULUCF), which are usually accounted for separately, because they are very uncertain and show large interannual variations. They mostly consist of net CO2 emissions from changes in land use and land cover, plus small amounts in CH4 and N2O from forest and peat fires. When including LULUCF emissions — for 2016, estimated at about 4.1 Gt CO2 eq — estimated global total GHG emissions come to 53.4 Gt CO2 eq. The trend in global CO2 emissions excluding those from LULUCF has remained more or less flat over the last two years (±0.5%), as shown by the blue area in Figure 2.1.
It should be noted that the time series data for total global CO2 emissions used have been updated since the 2016 report (Olivier et al., 2016). The updated estimate for total global total CO2 emissions in 2015 is now 35.6 Gt CO2, which is slightly lower than the estimate of 36.2 Gt CO2 as presented last year. The changes are due to regular annual statistical revisions of fuel consumption in International Energy Agency (IEA) and BP statistics (for example the decrease in global coal consumption in 2015 was revised from -1.8% to -2.7%) as well as revisions and some full updates, including emission factors, for several other sources (gas flaring, cement production, solvent use, ammonia production, urea and lime application). For more details, also on the revision of the non-CO2 greenhouse gases, when changing from EDGAR 4.2 FT2010 to EDGAR v4.3.2, we refer to Appendix D.
Non-CO2 greenhouse gases retained an annual growth rate of about 1%. In contrast, net emissions from LULUCF show a highly varying pattern that reflects the periodically occurring strong El Niňo years, such as in 1997–1998 and 2015–2016, as shown by the grey area above the dashed line in Figure 2.1.
Over the past two years, total global greenhouse gas emissions (excluding those from LULUCF, thus also from forest and peat fires) have shown a slowdown in growth, reaching 49.3 gigatonnes CO2 equivalent in 2016, with calculated increases of 1.0%, 0.2% and 0.5%,
Figure 2.1
in 2014, 2015 and 2016, respectively (see Figure 2.1). Note that 2016 was a leap year and, therefore, about 0.3% longer than a normal year. Since the early 1990s, such slow annual emission increases have only occurred during the global economic recession in 2008–2009 and the major global financial crisis in 1998 that resulted from the Asian financial crisis.
Non-CO2 GHG emissions originate from many different sources and are much more uncertain than CO2 emissions (their uncertainty on a country and global level is of the order of 30% or more, whereas for CO2 this is about ±10% or less). Over the past three years, non-CO2 GHG emissions have continued to grow somewhat faster than CO2 emissions, namely by 1.5% (2014), 1.2% (2015) and 1.0% (2016), whereas CO2 over the same period increased by a respective 0.8%, -0.2% and 0.3%. Note that, due to limited statistical data for 2015 and 2016 for these sources, the annual trends in the emission of CH4, N2O and F-gases are much more uncertain than those in CO2. Appendix B provides tables with the 1990–2016 time series of total GHG emissions for the top 30 countries/regions and for CH4, N2O and F-gas.
Although varying per country, non-CO2 emissions constitute a significant share in total GHG emissions. The global share of non-CO2 GHGs is estimated to have declined from 35% in 1970 to 27% in 2013, after which it started to increase, slowly, to about 27.5% in 2016, because of the reduction in the growth in CO2 emissions.
In 2016, methane (CH4) emissions have remained at virtually the same level as in 2015, with an estimated increase of 0.3%, which can be attributed to 2016 being a leap year, to a total of 9.2 Gt CO2 eq. Methane is the largest contributor to non-CO2 greenhouse gas emissions, predominantly from non-dairy cattle, with over 16% of global CH4 emissions in 2016. Dairy cattle add another 5%, and cattle manure management another 1% — together, making cattle responsible for 23% of methane emissions, worldwide. Coal mining, oil and natural gas production and gas distribution, together, account for 25% of methane
methane. Since 2000, emissions from both this category and from coal and natural gas production have grown by more than 65% (despite decreasing emissions from coal
production in the last four years). Methane emissions from industrial waste water is one of the fastest growing categories, accounting for 3% of CH4 emissions. However, with an estimated 1.2% increase in 2016, landfills were the fastest growing source of methane emissions in 2016. In the same year, methane emissions from agriculture increased by 0.4%, while those from energy decreased by 0.3%. Emission factors can vary widely per country, for instance for crop cultivation and livestock, as a result of soil conditions and production methods.
N2O emissions in 2016 amounted to 2.9 Gt CO2 eq, and increased by 1.3% with respect to
2015. The main sources of N2O emissions consist of the manure in pastures, rangeland and paddocks, and synthetic fertilisers (22% and 18%, respectively, in 2016). Figure 2.2 (bottom) shows the top 12 sources of N2O emissions. Agriculture, including indirect N2O emissions, accounted for about 75% of N2O emissions, and this was also the fastest growing category over the past three years (by a respective 1.7%, 2.1% and 1.3%). In recent years, savannah fires have been responsible for about 5% of N2O emissions.
F-gases make up the smallest category but show the strongest emission growth in non-CO2 emissions with an estimated global growth rate of 4.5% in 2016, extrapolated using on the
annual average 2007-2010 trend. Using this estimation method, total F-gases emissions amounted to 1.5 Gt CO2 eq worldwide. We note that these are very heterogeneous categories, with large differences in growth rates for the different constituents, and often with very large uncertainties in emissions, at country level of the order of 100% or more. Using these estimates, the largest sub-categories are HFC-134a from refrigeration and air conditioning (about 19%), HFC-125 and HFC-143a from consumption (17% and 19%), and HFC-23, which is a by-product of the production of HCFC-22 (19%).
Net emissions from land-use change are usually accounted for separately, among other things because they are inherently very uncertain and show large interannual variation. Thus, they are less suited for determining trends in anthropogenic global GHG emissions. Estimates vary between 3 and 6.5 Gt CO2 eq for 2016 (assessment of data sets by Houghton et al. (2012), Van der Werf et al. (2010) and of model outcomes as described in Le Quéré et al. (2016, 2017). We use the estimates developed for the Global Carbon Project (GCP) as described in Houghton and Nassikas (2017) for net CO2 emissions and the GFED4.1s data set for the relatively small CH4 and N2O emissions from forest and peat fires from Van der Werf et al. (2010). They constitute net CO2 emissions from changes in land use and land cover (estimated at about 3.9 Gt CO2 in 2016) plus small amounts of CH4 and N2O emissions from forest and peat fires (about 0.2 Gt CO2 eq). This adds another 4.1 Gt CO2 eq, or 8%, to the global total GHG emissions, making it a significant component to consider for reducing greenhouse gas emissions.
Figure 2.3
In 2016, the five largest emitting countries and the European Union, which together account for 51% of the world population, 65% of global gross domestic product (GDP) and 67% of the global total primary energy supply (TPES1), accounted for 68% of total global CO2 emissions and about 63% of total global GHG emissions. Following UNFCCC reporting and accounting guidelines (UNFCCC, 2011), GHG emissions from international transport (aviation and shipping) are excluded from the national total in countries’ GHG emission reports, but
nevertheless constitute about 3% of total global GHG emissions. Figure 2.3 illustrates the 1990–2016 trends (left) and the shares per country and region in 2016 (right). CO2 is the dominant component of GHG emissions in all countries. A country’s share in global CO2 emissions often very similar to its share in global GHG emission. An exception to this is China, where the share of CO2 emissions in 2016 was 29% versus 26% in total greenhouse gas emissions, due to the large share of coal in the fossil fuel mix. The group of 20 largest economies (G203) accounted for 81% of global CO2 emissions and 78% of global GHG emissions (Figure 2.3).
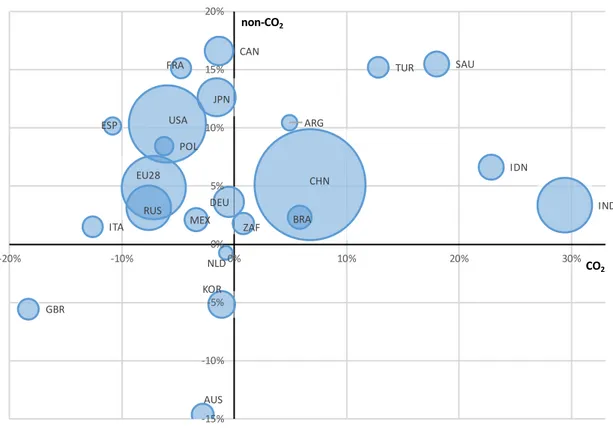
Figure 2.4 shows the recent trend over the last five years in emissions of CO2 and non-CO2 gases for the G20 countries and the European Union. The 5-year growth rate in CO2 emissions (horizontal axis) is plotted against the 5-year growth rate in non-CO2 emissions (vertical axis) for the G20 countries/regions. The size of the bubble is proportional to the CO2 emissions in 2016. In general, while most of the G20 countries are on the negative growth axis for CO2, most countries have shown growth in non-CO2 emissions in five years: more on the positive growth axis for non-CO2 than for CO2, amongst which are very large emitters. The spread in growth rates is large, both for CO2 and for non-CO2 emissions. On the CO2 growth axis India and Indonesia have the largest 5-year growth rates, while the United Kingdom shows strong negative growth in both CO2 and non-CO2 emissions. Non-CO2
emissions grow strongest in Canada, Saudi-Arabia, Turkey, and France, while the decrease is strongest in Australia. We note that for several European countries (Germany, Netherlands, Poland), the European Union as a whole and the Russian Federation the non-CO2 emissions have decreased since 1990. Apparently that trend has not continued over the last five years.
Figure 2.4
3 Group of Twenty: 19 countries and the European Union. The 19 countries are: Argentina, Australia, Brazil, Canada, China, France, Germany, India, Indonesia, Italy, Japan, Republic of Korea, Mexico, the Russian Federation, Saudi Arabia, South Africa, Turkey, United Kingdom, and the United States.
CHN USA EU28 FRA DEU ITA NLD POL ESP GBR IND RUS JPN AUS CAN MEX KOR TUR ARG BRA IDN SAU ZAF -15% -10% -5% 0% 5% 10% 15% 20% -20% -10% 0% 10% 20% 30% CO2 non-CO2
Five-year trend ([%], 2011–2016) in CO2emissions versus non-CO2emissions per
2.2 Global trends in CO
2emissions
The trends in CO2 emissions of the largest emitting countries/regions are shown in Figure 2.5. Most of them showed a decrease in CO2 emissions in 2016; most notably the United States (-2.0%), the Russian Federation (-2.1%), Brazil (-6.1%), China (-0.3%), and, within the European Union, the United Kingdom (-6.4%). In contrast, the largest absolute increases were seen in India (+4.7%) and Indonesia (+6.4%) and smaller increases in Malaysia, Philippines, Turkey and Ukraine. For many of the largest emitting countries, this is a continuation of the trend of 2015. With an estimated 0.2% increase in CO2 emissions, emissions in the European Union remained more or less the same in 2016. In contrast to most of the main emitters, the collective emissions from the rest of the world show a rising trend. Appendix A provides more detailed tables with the 1990–2016 CO2 emission time series for the top 30 countries/regions and also emissions per capita and per USD of GDP.
Figure 2.5
The trend in total greenhouse gas emissions and, more specifically, CO2 emissions, can be further analysed using a decomposition method called ‘Kaya identity’ (Kaya, 1990; Van Vuuren et al., 2007; Peters et al., 2017), which is useful for separating the effects from three drivers of energy-related emissions: 1) changes in gross domestic product (GDP), 2) energy use per unit of GDP, which is an aggregate indicator of the overall energy intensity of an economy, and 3) CO2 emissions per unit of energy (Figure 2.6). The latter depends on the share of fossil fuels in the total energy mix — with renewable energy sources and nuclear energy making up the remaining share – and also on the shares of coal, oil and natural gas within the fossil fuel mix. With respect to fossil fuel combustion, the combustion of coal emits more CO2 than that of oil products and about twice as much as that of natural gas.
Figure 2.6 shows for the global economy how these factors change over time. The blue bars show the annual growth of global GDP in per cent (where we used GDP at Purchasing Power Parity, PPP). Although the interannual change can be large, in particular around economic recessions such as in 2008–2009, in the period since 1990 global GDP has increased by 3.3% per year on average, with a period of higher growth from 2003 to 2011 when the average annual growth was 4.1% (even 4.9% when excluding recession years 2008–2009).
Over the same period the average annual growth of global energy use was about 1.4% less than that of GDP, thus about 2.0%. This is shown with the negative green bars. The purple bars show whether the CO2 emitted per unit of energy increased or decreased relative to the previous year. The increases shown for 2003 to 2007 coincide with years of high annual GDP growth, and this can be explained by China’s very high growth rate of GDP and energy consumption, notably coal. Similarly, since 2011 the increasing global use of hydropower and new renewable power sources and nuclear power, and the global shift from coal to more oil and natural gas consumption decreases the CO2 per unit of energy consumption on a global scale, as shown by the negative purple bars.
Figure 2.6
The declining growth in annual CO2 emissions since 2011 has continued over the past years, with 0.6% in 2012, 1.8% in 2013, and 0.8% in 2014, followed by -0.2% in 2015 and 0.3% in 2016 (±0.5%). This is not one-to-one related to the CO2 concentration in the atmosphere, though. For more information on the CO2 concentration, see Box 2.2. Over the last five years, global GDP has increased on average by about 3.3% per year, representing a
slowdown relative to pre-economic crisis growth rates between 2003 and 2007, during which typical global economic growth was around 5% per year (for the 5-year average).
In 2016, the energy intensity of the economy, defined as total primary energy supply (TPES4) per unit of GDP (shown in green in Figure 2.6), has decreased by 1.5%. This is similar compared to the pre-crisis period. From this it can be deduced that, despite lower GDP growth, the global economy as a whole has maintained its annually decreasing energy intensity, but no structural change on this indicator has occurred in recent years. According to the International Energy Agency (IEA, 2017c), the annual energy intensity improvements should be at least 2.6% to be consistent with the climate goals from the Paris Agreement. According to the International Energy Agency (IEA) most of the energy intensity
improvement in 2016 came from existing policies and two thirds of global energy supply is not covered by energy efficiency policies. Moreover, the rate of energy intensity
improvement varies largely across countries. For further reduction in global CO2 emissions, many more integrated policies on energy efficiency and renewable energy are pivotal.
4 TPES, or Total Primary Energy Supply, is the total amount of energy consumption of a country (or the world). It is calculated as in BP (2017): using a substitution method for nuclear, hydropower and other non-biomass renewable energy and assuming 38% conversion efficiency in all cases.
Examples of areas for new or extending policies are the efficiency of heavy goods transport and air-conditioning and other cooling equipment (IEA, 2017c).
In 2016, global Total Primary Energy Supply (TPES1) increased by 1.3%. However, the emission intensity of energy, represented by CO2 per unit of energy (shown in purple in Figure 2.6) has decreased over most of the past five years. This can be attributed to, firstly, the recent trend of coal having been substituted by other fossil fuels (with lower carbon emission factors) and, secondly, by renewable energy having increased in the energy mix, in particular in China and the United States. This trend is in sharp contrast with developments prior to the global economic crisis of 2008–2009. In several years in the early 2000s, global CO2 emissions per unit of energy increased, which can be largely attributed to the fast industrialisation of China. Globally, the share of coal in total energy supply peaked in 2011 at 27.6% and declined to 25.3% in 2016, which corresponds with that in China, with a peak in 2011 at 66% and a much faster decline to 57.5% in 2016. In the United States, the share of coal in TPES also decreased relatively fast, from 21% in 2011 to 15% in 2016, with 4 percentage points in the last two years. In the European Union, the share also declined in these five years, from 14% to 11%, mainly due to a reduction in coal use in the United Kingdom. In contrast, large increases were seen in India and Indonesia, where coal consumption increased by a respective 4% and 23% in 2016. These countries showed a similar pattern in 2015 (BP, 2017).
Coal-fired power plants are the largest global source of CO2 emissions. They contribute about one-third to global fossil-fuel related CO2 emissions, only followed by road transport (17%) and coal used in the manufacturing industry (12%) (IEA, 2016). Their long lifetime may limit the potential for rapid reduction in global CO2 emissions and new additions are therefore important for climate policy. More about trends and policies on coal-fired power plants can be found in Box 2.1.
Box 2.1 Coal-fired power plants worldwide
The amount of new coal capacity under construction plummeted in 2016, mainly due to a change in policy, economic conditions and the reducing costs of wind and solar power. In 2016, in China and India 68 GW was frozen at more than 100 project sites and globally more construction was frozen than entered the construction phase last year. With a total of 68 GW, retirements were very high in 2015 and 2016, mainly in the European Union and the United States (Shearer et al., 2017).
According to the most recent data at present there are 267 coal plants and units in construction, 154 of which are new coal plants and 113 are expansions of existing coal plants (new units) (Global Coal Plant tracker (Coalswarm, 2017). Of these 267, China is building 120 new plants and units (status of mid October 2017) and India has 45 under construction. Japan is building 14 new plants and units, the European Union is constructing 8 new station and units of which 5 are being build in Poland, and the Russian Federation is constructing 2 new plants. Other countries that have several under construction are Indonesia (13), the Philippines (11), Vietnam (10), South Korea (7), Pakistan (4). Turkey (3), Malaysia (3), and six more countries with 2 each (Morton, 2017).
As of July 2017 the Global Coal Plant Tracker showed a 40% decline in pre-construction planning capacity and a decline of 25% under construction, from the levels reported in July 2016. Although more coal-fired capacity is still being built than being closed, the average load factor for coal plants decreased globally since 2013. The average capacity factor of coal power plants in China and India is about 50% (Shearer, 2017). Investments in coal power in 2016 were down by 20%, with increasing investments in lower-cost solar, wind, and natural gas (IEA, 2017b).
Of the 1,675 companies owning coal-fired power plants or pursued development of them since 2010, over a quarter have exited the coal power business entirely, with no further development plans. India had most departing companies, followed by China, United States and Turkey (Huang, 2017).
In 2016, global fossil fuel consumption had a 75% share in total primary energy supply. The increase in oil and natural gas consumption of 2% more than offset the 1.4% decrease in coal use. The largest increases in the use of natural gas occurred in the European Union (notably in the United Kingdom and Germany), China and the United States. Oil consumption increased predominantly in China, India, the European Union, with smaller increases in South Korea and the United States. Hydropower and new renewable energy sources, such as wind and solar energy, had an 11% share, for nuclear power this was about 4.5%, and biofuels accounted for the remaining 10% of TPES. Wind and solar power together have continued to grow at double-digit growth rates, with a 20% increase in 2016. In absolute figures, the largest increases in wind and solar power in 2016 occurred in China and the United States.
The Global Carbon Project (GCP) has assessed the CO2 trend for the current year 2017 individually for China, the United States and India and used GDP projections for all other countries, including the European Union countries, resulting in a forecast for the change in global CO2 emissions in 2017 of +2.0% (range of +0.8% to +3.0%) (Le Quéré et al., 2017). In this report we made similar estimates for China, United States and the European Union based on available fossil fuel statistics for the first 8 months of 2017 for the consumption of coal, oil and gas (for China only monthly statistics for coal) and compared them with the GCP estimates (for details see Chapter 3).
In all cases, the estimates for 2017 based on more recent statistics suggest trends that are inconsistent with the GCP uncertainty ranges, which rises the question whether it is useful to estimate annual emissions in cases where only very partial and incomplete fuel statistics are available. Moreover, the estimation of CO2 emissions for the subsequent year by using the Kaya identity means that the estimate for the next year is strongly related to estimated GDP growth. However, GDP growth is not a good a predictor of energy consumption for a single year, because a very large fraction of GDP is determined by low-energy intensive economic activities such as the service sector (that comprises two-thirds of global GDP).
2.3 Global atmospheric CO
2concentrations surged in 2016
The increase of atmospheric concentrations of CO2 is primarily due by the global CO2 emissions from fossil fuel combustion, but the very large increase in 2016 was caused by other processes, as explained in Box 2.2.
Box 2.2 Global atmospheric CO2 concentrations surged in 2016
Globally, average concentrations of CO2 in the atmosphere surged at a record-breaking speed of 3.3 parts per million in 2016 to the highest level in 800,000 years of 403.3 ppm, an increase of 0.8%. The record increase in 2016 was mainly due to the man-made CO2 emissions from fossil fuel combustion and other human activities, which did not change much compared to 2015, and partly due to the very strong 2015/2016 El Niño event (WMO, 2017).
The 2015/2016 El Niño event was one of the strongest since the 1950s and triggered the driest droughts in the last three decades in the tropical regions of South America and Asia, causing much more large-scale forest and peat fires in these three regions. In dry South America much higher temperatures caused vegetation to slow down photosynthesis, thus removing less CO2 from the atmosphere. However, tropical Africa experienced hotter temperature but no drought, which enhanced the decomposition of dead vegetation, thus emitting more CO2 into the atmosphere. Since global CO2 emissions from fossil fuel use did not increase in 2015 and 2016, the strongly increased CO2 concentrations can be attributed to the reduced capacity of the “land sink” of CO2, the biosphere of forests and other vegetation also known as LULUCF, and/or a decrease in the “ocean sink” by less absorption of CO2 (Irving, 2017; Liu et al., 2017).
3 Trends in largest
emitting countries
and the EU28
In this chapter we discuss the emission trends of the six main emitters, consisting of five large countries, being the United States, China, India, the Russian Federation and Japan, and of the European Union (EU28) as a region. Between them there are large differences, in the share of the various GHGs, and in the emission intensity of their energy use. Globally, the combined share of CH4, N2O and F-gas emissions is about 28% in total GHG emissions (19%, 6%, and 3%, respectively), but it varies for the largest countries, from 11% for Japan to 31% for India. China’s current share is estimated at 20%, that of the United States and the European Union at 23%, and of the Russian Federation at 25%, as illustrated by the non-blue parts of the bars in Figure 3.1.
These shares reflect the relative importance of non-CO2 GHG emission sources, such as coal, oil and natural gas production (releasing CH4), agricultural activities such as livestock
farming (CH4 emissions from ruminants and manure), rice cultivation (wet fields release CH4 through fermentation processes in the soil), animal manure and fertiliser use on arable land (N2O), and landfill and wastewater practices (CH4).
Figure 3.1
As discussed in Chapter 2, the emission trends of the largest countries and regions, apart from India, of which GHG emissions are rising, are relatively flat in 2016. In absolute values,
the largest emitters are China, the United States, and the European Union, followed by India, the Russian Federation, and Japan. For non-CO2 emissions only, India and the European Union switch rank.
After China’s very rapid rise of its CO2 emissions caused by the fast industrialisation that started in 2002, in 2005 China surpassed the United States as the world’s largest emitting country. Since 2013 China’s CO2 emissions have been more than twice those of the United States (see Figure 2.5). However, for a proper perspective in comparisons between countries also the size of a country’s activities should be accounted for. Therefore, the per capita emissions, and the emissions per USD of GDP, and their trends, are presented below, which allows for better comparison of level and trends between countries because it eliminates either population size or size of the economy of a country from the equation. Apart from that, it also provides reference values to assess in what direction emissions will progress if structural changes occur in population or economy of a country (or in the rest-of-world countries as a group).
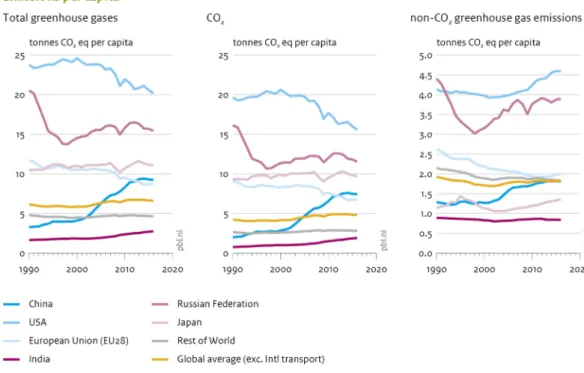
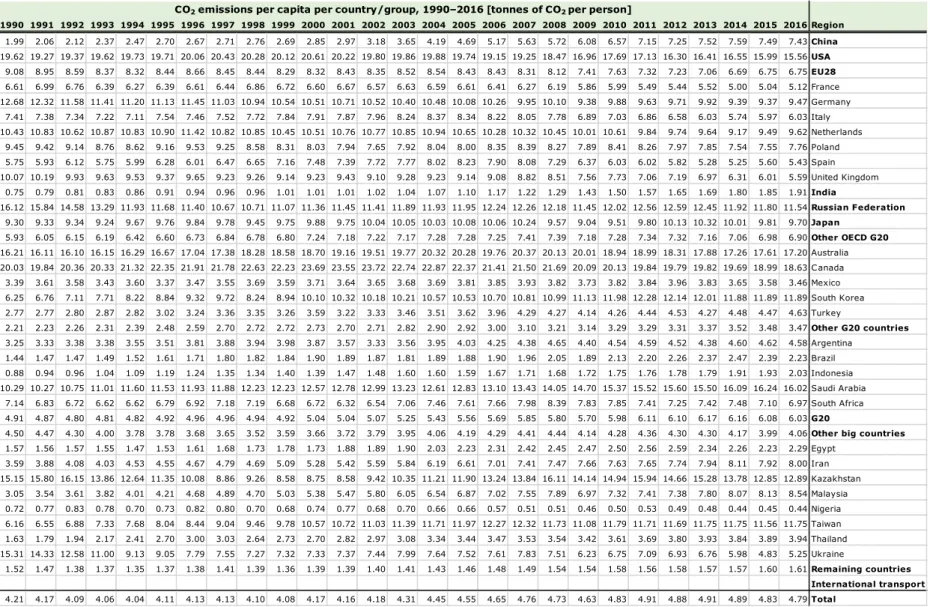
Figure 3.2 shows emissions per capita for the five main emitting countries, the European Union, the rest of the world, and for the world average. Separate graphs are presented for total greenhouse gas emissions, for CO2 only and for non-CO2 greenhouse gas emissions. Except for India, all main emitters have per capita emission levels that are significantly higher than those for the rest of the world and the world average. China, in this measure, has rank 4, rather than rank 1, which it has for absolute emissions. Although CO2 emissions in the United States have been steadily decreasing since 2000, from 20.6 tCO2/cap to about 15.6 tCO2/cap by 2016, it is the highest amount among the top 5 emitting countries and is only surpassed by three other G20 countries: Canada, Australia and Saudi Arabia. The United States, the Russian Federation, and Japan make up the top 3 for total and CO2 emissions, while the United States, the Russian Federation, and the European Union form the top 3 for non-CO2 emissions.
Figure 3.2
The emissions per USD of GDP (in 2011 prices and corrected for Purchasing Power Parity (PPP)) presented in Figure 3.3, show yet another image. Contrary to the per capita
emissions, the top 5 countries and the European Union are not all above the world average when it comes to emissions per USD of GDP. In the United States, emissions per USD of GDP are virtually equal to the world average, while those in the European Union are the lowest per USD of GDP worldwide, closely follow by Japan. Emissions in China and the Russian Federation are the highest, and, especially for CO2, significantly higher than the world average. The trend for all countries, except for the Russian Federation, is downward,
including that for the world average. This is consistent with the Kaya decomposition of global CO2 emissions in Figure 2.6, which shows that growing GDP not necessarily results in growth in total greenhouse gas emissions.
Figure 3.3
Appendix A provides in Tables A.2 and A.3 more details with 1990–2016 times series of per capita CO2 emissions for the top 30 countries/regions and also a similar table with CO2 emissions per USD of GDP.
In the remainder of this chapter we discuss the level and trends of emissions for the top-5 emitting countries and the European Union. We also show the relative trends of their CO2 and non-CO2 GHG emissions.
3.1 China
In 2016, according to our latest estimates, China’s CO2 emissions decreased by about 0.3% to about 10.5 Gt CO2. This was mainly due to a 1.4% decline in coal consumption, partly compensated by increases in the consumption of natural gas and oil products of 8% and 3%, respectively (percentages in energy units, e.g. in PJ) (BP, 2017).
For 2017, statistics available mid November for the first 10 months shows that coal power
decreased by 2.8% while total power generation increased by 2.5% and crude steel
production increased by 2.8%, compared with the same months in 2016 (NBS, 2017c). When coal consumption would decline by 2.5% in total 2017 and the use of gas and oil products would increase by 9% and 4.5% (the average of the last five years), then China’s CO2 emissions would decrease by about 1%. This estimate is outside the uncertainty range of the GCP estimate of +3.5% (range of +0.7% to 5.4%) for 2017, which is based on data available mid September (Le Quéré et al., 2017).
In Figure 3.4, the Kaya decomposition for China illustrates the drivers behind the CO2 emission trend. Looking at the 1990–2016 trend we see the following striking features. Already in the 1990s China showed a very large economic growth rate of almost 10% per year, according to official statistics. Because of the abundant domestic reserves of coal, China’s economic development relied for the energy demand mainly on coal rather than oil or natural gas, thereby increasing its CO2 intensity of energy use, which shows as the purple bars on top of the graph.
The very large increases shown for 2003 to 2007 coincide with the years of double digit annual GDP growth that occurred after it was admitted to the World Trade Organisation (WTO) in 2001. In 2003 and 2004 the growth of energy use was even higher than GDP growth, thus the two green bars on top of the GDP growth bars. In these years China’s industrialisation took a higher gear with cement production in the top year soaring by 19% and steel production by 21%, essential for the development of new building for
manufacturing and infrastructure for transportation of goods and people.
From the 1990s to 2010 China’s annual CO2 emissions per unit of energy increased since as coal consumption increases faster than other fossil fuels and more than non-fossil energy sources. However, since 2012, the growth of renewable power such as hydropower, wind and solar power, and nuclear power as well as the consumption of natural gas and oil products is higher than the growth in coal consumption, hence the CO2 intensity per unit of energy consumption decreased, as did China’s CO2 emissions.
China’s GDP has increased by 6.6% in 2016, while the population growth was only 0.5%. Thus, the CO2 emissions have continued to decouple from economic growth in China and have even decreased marginally, by 0.3%. In 2016 the GDP growth rate, although still very high compared to many other countries, was lower than in recent years, assisting the decrease in emission growth. Since 2012 total primary energy supply in China increased by 10%, while the Gross Domestic Product (GDP) on PPP basis saw a growth of 31% in that period (an average of about 7%, per year). The energy intensity, resulting from structural changes of China’s economy from energy-intensive industrial manufacturing, building and construction activities toward lower-energy economic activities, and national policies that also intervene with growth patterns in many parts of the economy, continues to decrease at a similar rate as in previous years. Energy efficiency improvement in China is important for reducing emissions of CO2 and air pollutants. Investments in China account for more than a quarter of global total investments in energy efficiency (IEA, 2017b). However, the decrease
in energy intensity has not become more pronounced in recent years, and therefore is not the main cause of the decrease in emissions.
Apart from decreasing GDP growth and continuing improvements in energy intensity of the economy, the main cause of the decrease in 2016 can be attributed to the CO2 intensity of energy. This is related to a 1.4% decline in coal consumption offset by increases in the consumption of natural gas and oil products (BP, 2017), which is also shown and discussed below with Figure 3.6, for which we will discuss the developments in total primary energy supply in more detail.
Figure 3.4
In Figure 3.5, we compare the CO2 trend to the trend in non-CO2 emissions, indexed on the 1990 emission values. The CO2 growth has been much steeper than the growth in non-CO2 emissions, according to EDGAR v4.3.2 estimates. Since 1975, the annual growth in CO2 emissions has exceeded that of non-CO2 emissions in China. Similar to the CO2 emissions, the non-CO2 emissions in 2016 have
started a flatter trend in recent years. In 2016, non-CO2 emissions have increased by a marginal 0.5%, not corrected for the leap year. F-gases have increased by 3.8%, but this is still a relatively small category. Methane emissions have stayed at the same level as in 2015, and N2O emissions increased by 0.5%. Total greenhouse gas emissions in China have
decreased by 0.1% in 2016.
The trend in total primary energy supply is shown in Figure 3.6 (left). As also observed in the Kaya decomposition, the recent decrease in emissions is mainly driven by decreases in coal consumption by about 2% in the last two years, partly offset by increases in the use of oil products of 6.3% and natural gas by 4.7% in 2016 (BP, 2017). The total fossil fuel
consumption remained almost flat since 2013 (IEA, 2016; BP, 2017). The resulting increase in energy demand in 2016 compared to 2013 of about 6% was mostly met by increased use of renewable energy sources: wind and solar power as well as hydropower, the share of which increased by 4 percentage points to almost 20% in 2016.
Figure 3.6
Of total national CO2 emissions from coal, oil and natural gas combustion, China has one of the highest shares of 81% CO2 emissions from coal, only beaten by South Africa coal with 83%. Other large countries with high coal shares are Indonesia (81%) and South Korea (75%), which are all high in comparison with the global average of about 46% that stem from coal combustion. About half of China’s CO2 emissions are from power generation, virtually all from coal-fired power plants, about one-third from the manufacturing industry, almost all from coal combustion, and almost one-tenth from the residential and commercial sector (houses, offices and shops) (IEA, 2016).
In response to the increasingly low load factors of Chinese coal power plants (47.5% in 2016), the government of China has implemented new measures to restrict further
expansion of coal-fired power capacity. These include suspension of new approvals in many provinces and halting the start of construction in several others, shut down of outdated coal plants, halting ‘provincial self use plants’ (e.g. aluminium smelters), and cancellation of
planning and construction of 85 plants. This resulted in investments in new coal-fired power plants to drop by 25% in 2016 (IEA, 2017b). In addition, in China’s 13th Five Year Plan a coal power capacity cap of 1,100 GW by the end of 2020 was announced (current capacity is 960 GW) (Shearer et al., 2017). This also means that a total of 150 GW of new coal power generation capacity construction will be halted or postponed from 2016 to 2020, the 13th Five-Year Plan period. In addition, 20 GW of outdated capacity will be shut down, and nearly 1,000 GW of coal power capacity will be upgraded to produce fewer emissions and use less energy (EIA, 2017f; Xinhua, 2017). The coal power cap of 1,100 GW means that on top of the present capacity of 960 GW and the 20 GW to be scrapped, still 160 GW of new coal power capacity may be added until the end of 2020 – or about 1 GW per week.
Addressing coal power overcapacity is getting more urgent by newly increased targets for wind and solar power capacity (Myllyvirta and Danqing, 2017). However, another issue that needs to be addressed in wind and solar power generation is to make better use of the renewable power that is generated. Presently, a large and growing proportion is going to waste. In 2016, the wind curtailment rate – the amount of wind power that could have been generated and used but wasn’t – reached 17%, more than double what it was in 2014. Meanwhile China’s solar curtailment rose by 50% in 2015 and 2016 (Boren, 2017). In the last three years total power generation increased by 4.0%, 2.9% and 5.6%,
respectively, resulting in a total increase of 23% since 2012. For 2017 the first 10 monthly statistics from the National Bureau of Statistics of China (NBS) from January to October show an increase of 2.5% in total power generation (NBS, 2017c). Power generation from
renewable and nuclear energy increased by 42% since 2012. In 2016, hydropower and nuclear power generation increased by 5.6% and 24.9%, respectively, resulting in shares of 18.9% and 3.5% (BP, 2017). Although the shares of wind and solar power are increasing fast, currently they account for only 3.9% and 1.1% of total power generation, respectively (BP, 2017). In 2017, electricity production by fossil fuel power sources decreased by 2.8% in the first 10 months statistics (January to October) compared with the same months in 2016. Almost all of ‘thermal’ refers to coal power with a few percent natural gas. However, all other (i.e. zero-CO2) power sources increased in these 10 months: hydropower was up 16.9%, nuclear power up 15.2%, wind power up %11.7% and solar power up by 35.7% (NBS, 2017c).
The manufacturing industries account for more than half of total electricity consumption. Of the energy-intensive industries, the production of crude steel, aluminium and ethylene increased in 2016 by 0.6%, 1.5% and 3.9% in 2016 and changed by -2.2%, +8.8% and +1.1% in 2015, respectively (NBS, 2017a,b). In 2017, production of these materials changed from January to October by +6.1%, -7.5% and 8.5%, respectively, compared with the same months in 2016 (NBS, 2017c). In the residential and commercial sectors, the demand for space heating, half of which is met by coal combustion, was about 4% higher in 2016 than in 2015 due to colder winter temperatures (based on heating degree days in 2015 and 2016, for the 21 largest cities). Since this affects only about 8% of CO2 emissions the impact on 2-16 emissions is only 0.2 percentage points.
Although most of China’s CO2 emissions stem from fossil fuel combustion (86%), about 7% originate from the calcination of limestone in the chemical process of cement clinker
production. Together with CO2 emissions from other industrial uses of limestone such as lime production, around 9% of national CO2 emissions stem from these calcination processes. Of other large countries, in Turkey, Egypt and Nigeria this share in total CO2 emissions is also around 10%. The production of cement decreased 5.3% in 2015 and increased 2.3% in 2016. In 2017, cement production decreased by 3.1% in the first 10 months (statistics from January to October), compared with the same months in 2016 (NBS, 2017a,b,c).
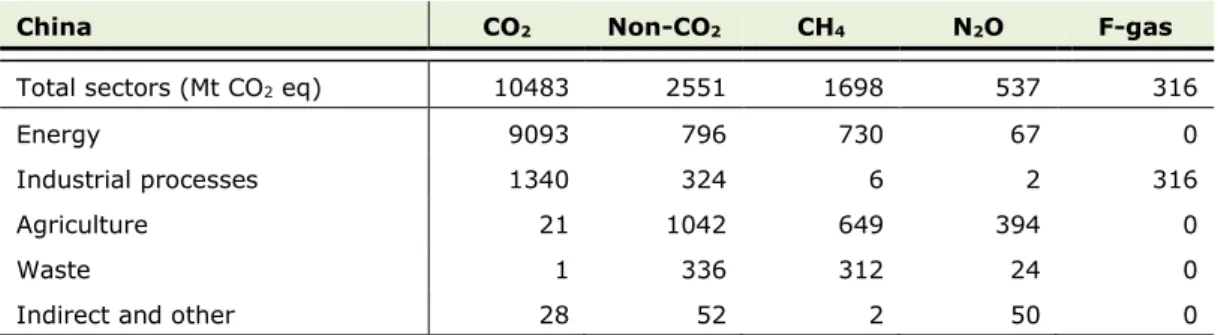
The non-CO2 emissions, shown in Figure 3.6 on the right, have increased only marginally in 2016, especially if you correct for the leap year. F-gases was the largest growing category, by 3.8%. The largest emission source of non-CO2 emissions by far is coal mining, responsible for 27% of methane emissions. Energy-related methane emissions in general cover 43% of methane emissions, and have decreased by 1.9%. Methane emissions associated with waste handling (mainly landfills and wastewater) is the fastest growing source, of which emissions in 2016 increased by 3%. Agricultural methane emissions are another large source, covering 38% of methane emissions. Contrary to most countries, in which cattle are the main source of agricultural methane emissions, in China the largest agricultural source is rice cultivation, responsible for 21% of total methane emissions. Methane emissions from agriculture have remained at the same level as in 2015. N2O emissions have only increased marginally in 2016. Its major source are synthetic and natural fertilisers. F-gas emissions are mainly due to the industrial production of halocarbons, resulting in HFC-23 emissions that make up over 70% of F-gas emissions (without accounting for additional abatement). Table 3.1.1 shows a snapshot for China of total greenhouse gas emissions per main source sector and gas in 2016.
Table 3.1.1 Emissions of CO2 and other greenhouse gases in China in 2016
China CO2 Non-CO2 CH4 N2O F-gas
Total sectors (Mt CO2 eq) 10483 2551 1698 537 316
Energy 9093 796 730 67 0
Industrial processes 1340 324 6 2 316
Agriculture 21 1042 649 394 0
Waste 1 336 312 24 0
Indirect and other 28 52 2 50 0
3.2 United States
In the United States, CO2 emissions decreased in 2016 by 2.0% to 5.0 Gt CO2. This was mainly due to an unprecedented 8.5% decrease in coal consumption, partly compensated by 0.8% increases in the consumption of both natural gas and oil products (BP, 2017). These percentages are very close to those reported by the U.S. Energy Information Administration, when taking into account that their numbers include fuel used for international transport (bunkers) (EIA, 2017a).
For 2017, available fuel statistics for the first 8 months shows that coal consumption was up 0.6%, oil products up 0.7% and natural gas down 5.2%, compared with the same months in 2016 (EIA, 2017g). However, the last third part of the year can significantly modify this, depending on the weather in the last four months from September to December (influencing the fuel demand for space heating, thereby affecting the demand for coal power and gas power). When fossil fuel consumption would change likewise in total 2017 then the US CO2 emissions would increase by about 2%. This estimate is outside the uncertainty range of the GCP estimate of -0.4% (range of -2.7% to +1.0%) for 2017 which was based on a projection by the EIA (Le Quéré et al., 2017).
In Figure 3.7, the Kaya decomposition for the United States further illustrates the drivers behind the CO2 emission trend. When looking at the annual change in CO2 emissions (black line), we see that since 1990 in most years emissions increased up to 2005, resulting in an increase over this period of almost 18%, whereas since 2005 CO2 emissions declined in most years to a level in 2016 that is 14% below the peak level of 2005. This is the combined
impact of the change in total primary energy supply since 2005: decreases in coal (-9 EJ) and oil (-6 EJ) versus increases of natural gas (+6 EJ) and wind and solar (+3 EJ) (see the TPES trends in Figure 3.9 (left)).
Part of the annual changes in CO2 emissions can be explained by varying winter
temperatures, with demand of fuel for space heating higher than normal in cold winters and lower in mild winters. Using the number of Heating Degree Days (HDD) as a proxy, that shows that the winter months of 1991 to 1997 were cold, 1993 and 1996 even very cold, so more fuel was used for space heating in these years – in very cold winters about 10% more. Other relatively cold winters were in 2003 and 2014, also resulting in more fossil fuels used and thus higher emissions. Conversely, years with mild winters were seen in 1998, 2006 and in recent years in 2012, 2015 and 2016. The winter months of 2012 and 2016 were
relatively very warm, with space heating more than 11% lower than in normal winters. This explains part of the relative large or small increases of total energy use, show in Figure 3.7 as relatively large or small changes in the energy intensity of GDP.
When looking at the changes in CO2 per unit of energy used, excluding the two recession years, we see that increases only occur in years before 2005 (positive purple bars), whereas in normal years after 2005 only decreases occur (negative purple bars). This mainly reflects the changes in the share of coal (notably coal-fired power plants) in the energy mix because that has the largest carbon content per unit of energy.
The rise, peaking in 2005 and fall of total CO2 emissions in the United States mirrors very much the trend in coal consumption. Coal is mainly used for power generation. Since 2005 the domestic production of natural gas by hydraulic fracturing soared, which boosted the use of gas for space heating in the residential sector and for power generation. Interestingly, the use in these sectors is interrelated: in cold winters the demand for space heating increases and so does the gas price. Then, when natural gas prices are high, utilities that can switch between fired and gas-fired power will use the most economic option and switch to coal-fired power plants. After the peak in 2007 of coal use for power generation, all years saw declining coal use, except in 2010 (recession) and 2013 (cold winter after very warm winter months in 2012). In recent years, the largest declines were in 2012, 2015 and 2016, by 11.7%, 18.3% and 8.3% respectively, due to the very warm winter months in these years and therefore low natural gas prices.
From this it can be concluded that the decreasing CO2 emission trend since 2005 is the combined result of a lower GDP, with similarly lower energy intensity, and lower CO2 intensity of energy due to the decline of coal power. GDP in 2016 increased by 1.6%, at a similar rate to that in 2013 and even 2011, but somewhat lower than the average over the past years. The CO2 intensity of energy in 2016 decreased by 2.2%, mainly due to a decrease in coal consumption (notably coal power) as a result of low natural prices because of the very warm winter months, but also due to increases in the consumption of other energy sources: natural gas, oil products and wind and solar power (BP, 2017). This is also illustrated and further discussed below in Figure 3.9 (left).
In Figure 3.8 we compare the CO2 trend to the trend in non-CO2 emissions, indexed on the 1990 emission values. Contrary to the CO2 emissions, the non-CO2 emissions continue to show a rising trend. Total GHG emissions decreased by 1.4% in 2016. Non-CO2 greenhouse gases in 2016 made up 23% of the total GHGs (excluding LULUCF), its highest share since 1990. As can be seen in Figure 3.9 (right) this can be attributed to the steady rise in F-gases since 1990, and partly to the rise in energy-related CH4 (mainly from coal mining and natural gas production) between 2010–2013.
The trend in total primary energy supply is shown in Figure 3.9 (left). The 97% share of total CO2 emissions stemming from fossil fuel combustion is the highest among the G20 countries. About 40% of CO2 emissions are from power generation, of which about three quarters from coal-fired power plants and one quarter from natural-gas-fired plants. The demand for electricity has remained rather constant since 2005, but in 2016 the carbon intensity of the power sector decreased by 5%, for the second consecutive year (EIA, 2017c), as a result of coal being substituted with natural gas and renewable energy. Over the last ten years natural gas has displaced coal in the power generation mix of the nine Northeast states. Due to increased access to natural gas its share increased from 23% in 2006 to 41% in 2016 and the share of coal-fired power generation in these states declined from 31% to 11% over these years (EIA, 2017d). This can be attributed to a combination of low natural gas prices and policy (Clean Power Plan and the Mercury and Air Toxics Standards (MATS) (EIA, 2017e)). In 2016, for the first time, natural gas was the leading fuel in power generation, displacing coal as the leading fuel. Coal consumption decreased, in 2016, by 8.5%, while natural gas and oil consumption increased, marginally (~1%) (BP, 2017).
The increase in oil consumption in 2016 is consistent with the increase in CO2 emissions from the transportation sector have increased in 2016 (EIA, 2017a,b). CO2 emissions from road transport account for two thirds of total oil-combustion-related emissions, with fairly equal shares for the remaining emissions between the manufacturing industry, other domestic transport, the residential and commercial sector (i.e. buildings) and refineries (IEA, 2016).
The increase in natural gas demand can be attributed to its increased consumption in the electricity sector — partly to substitute the decrease in coal-fired production (EIA, 2017a) and partly offset by a decrease in heating demand in the residential and commercial sector. In the United States, 2016 was recorded the second warmest year on record behind 2012 since records started in 1895. This resulted in relatively low number of Heating Degree Days (HDD) in these years, which are indicators for the demand for space heating (EIA, 2016b). Because heating degree days in the United States exceed cooling degree days by a factor of around 3, energy consumption in the residential and commercial sector is mainly the result of the number of heating degree days. The lower demand for space heating contributed to the decrease in CO2 in 2016 by about 0.5 percentage points.
Apart from the 97% in CO2 emissions from fossil-fuel combustion in the United States, half of the remaining 3% originates from industrial non-combustion processes, mainly from the production of chemicals such as ammonia and ethylene and from cement clinker production. These sources increased by about 2% in 2016 (USGS, 2017). Gas flaring is a relatively small source of CO2 emissions; however, due to emission increases from oil and natural gas extracted by hydraulic fracturing, total CO2 emissions from gas flaring increased by about two thirds since 2012.
Total CO2 emissions have steadily declined since 2005, whereas non-CO2 emissions have shown a steady rise since 2005 (Figure 3.9, right). The 0.7% increase in non-CO2 GHG
emissions in 2016 was due to a significant increase (~6%) of F-gases, partly offset by the decrease in methane (-3%) and N2O emissions (-1%). The F-gases trend is much steeper than the GDP trend, but we recall that those emissions are very uncertain.
Overall, in 2016 the increase of non-CO2 emissions per USD of GDP is 0.5% and the increase in non-CO2 emissions per capita is 1.4% (see also Figures 3.2 and 3.3). Methane emissions have, after an on average increasing trend since 2005, decreased in 2015 and 2016. This decrease can be attributed to decreases in methane emissions from energy (mainly reduction from coal mining, but also from oil and natural gas production) and from solid waste
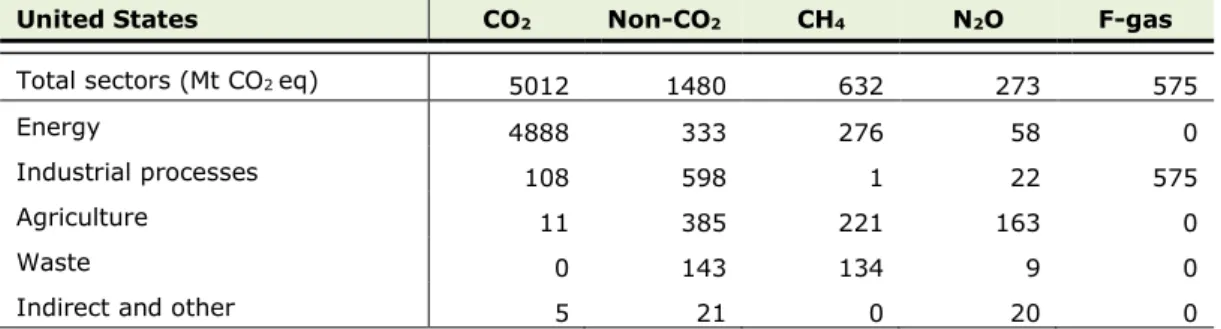
disposal, which are large categories of emissions. Emissions from energy constitute 43% of methane emissions, of which the largest categories are gas production, which contributes 19%, and flaring and venting from gas and oil production (another 14%). Agricultural emissions on the other hand have shown small increases and contribute 35% to methane emissions, of which non-dairy and dairy cattle in the United States are responsible for the majority, adding up to 25% of methane emissions. Over the past years, emissions from non-dairy cattle have shown a decrease of 1% to 2%, annually. Another fairly large agricultural source is rice cultivation, of which emissions have increased by two-digit growth rates yearly since 2013. However, they still contribute less than 2% of methane emissions, and emissions from this source have been this high before. Table 3.2.1 shows a snapshot for the United States of total greenhouse gas emissions per main source sector and gas in 2016.
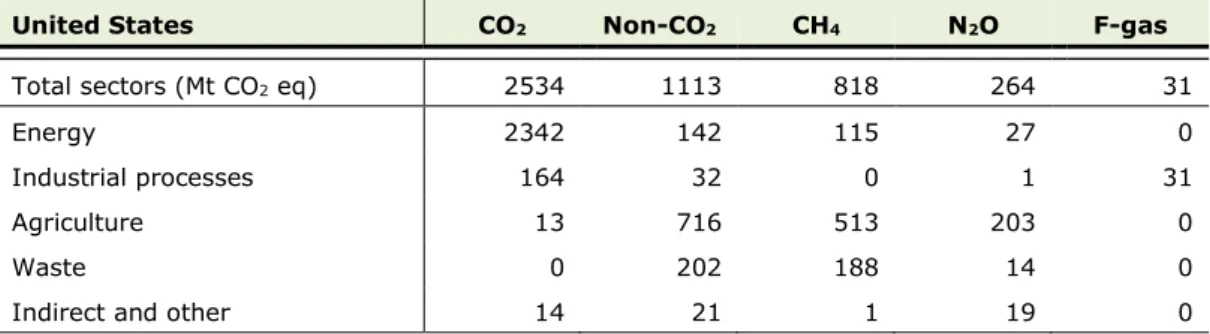
Table 3.2.1 Emissions of CO2 and other greenhouse gases in the United States in
2016
United States CO2 Non-CO2 CH4 N2O F-gas
Total sectors (Mt CO2 eq) 5012 1480 632 273 575
Energy 4888 333 276 58 0
Industrial processes 108 598 1 22 575
Agriculture 11 385 221 163 0
Waste 0 143 134 9 0
Indirect and other 5 21 0 20 0
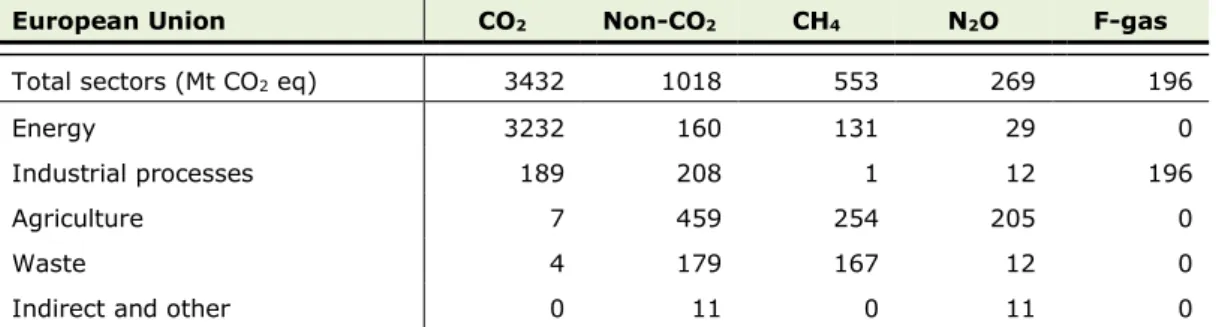
3.3 European Union
In 2016, total CO2 emissions in the European Union (EU28) have increased by about 0.2% to 3.4 Gt CO2. This flat trend was mainly due to an 8.7% decrease in coal consumption,
compensated by increases in the consumption of natural gas and oil products of 7.4% and 2.1%, respectively (BP, 2017). When corrected for the extra day of the leap year 2016, the CO2 trend would be slightly negative by 0.1%.
For 2017, available fuel statistics for the first 8 months shows that coal consumption was up 1.9%, oil products up 2.2% and natural gas up 8.8%, compared with the same months in 2016 (Eurostat, 2017c). However, the last third part can significantly modify this, depending on the weather in the last four months from September to December (influencing the demand for space heating and the wind and solar power produced, thereby affecting the demand for coal power and gas power). When fossil fuel consumption would change likewise in total 2017 then the European Union’s CO2 emissions would increase by about 3.7%. This estimate is outside the uncertainty range of the GCP estimate of -0.2% (range of -2.0% to +1.6%) for 2017 which is based on a projection of GDP and a simplified Kaya Identity (Le Quéré et al., 2017).