Green gains
In search of opportunItIes for the Dutch economyGreen Gains
In search of opportunities for the Dutch economy
PBL
Green gains – In search of opportunities for the Dutch economy © PBL Netherlands Environmental Assessment Agency
The Hague, 2014 ISBN: 978-94-91506-62-8 PBL publication number: 1262 Corresponding author ton.manders@pbl.nl Authors
Aldert Hanemaaijer, Ton Manders, Otto Raspe
Martijn van den Berge, Laurens Brandes, Stefan van der Esch, Jos Notenboom and Melchert Reudink Acknowledgements
PBL wishes to thank Herman Stolwijk (formerly of CPB), Rick van der Ploeg (University of Oxford), Richard Tol (University of Sussex) and Marko Hekkert (Utrecht University) for reviewing the draft report. Thanks also go to the Scientific Council for Government Policy (WRR) and government departments, particularly the Ministry of Economic Affairs, the Ministry of Infrastructure and the Environment, and the Ministry of Finance for their involvement and comments. Special thanks go to Netherlands Statistics for providing us with data on the cleantech sector.
English translation and editing Serena Lyon, Annemieke Righart Graphics
PBL Beeldredactie Photography
Filip Franssen / Hollandse Hoogte (p.29, p.42); Koen Verheijden / Hollandse Hoogte (p.37); PlantLab (p.38); Inge van Mill / Hollandse Hoogte (p.48); Laif / Hollandse Hoogte (p.59); ThinkStock / iStock (p.63); Caro Bonink / Hollandse Hoogte (p.71)
Production coordination PBL Publishers
Design and layout Textcetera, The Hague Printing
Haveka, Alblasserdam
This publication can be downloaded from: www.pbl.nl/en.
Parts of this publication may be reproduced, providing the source is stated, in the form: Manders, T. et al. (2013), Green gains – In search of opportunities for the Dutch economy, The Hague: PBL Netherlands Environmental Assessment Agency.
PBL Netherlands Environmental Assessment Agency is the national institute for strategic policy analyses in the fields of the environment, nature and spatial planning. We contribute to improv-ing the quality of political and administrative decision-makimprov-ing, by conductimprov-ing outlook studies, analyses and evaluations in which an integrated approach is considered paramount. Policy rele-vance is the prime concern in all our studies. We conduct solicited and unsolicited research that is both independent and always scientifically sound.
Contents
Foreword 5Trends 7
1 The paTh To a greener economy 13
2 compeTiTiveness and green innovaTion in The neTherlands 23 3 innovaTion and opporTuniTy 35
4 Business drivers and Barriers 47 5 greening in neighBouring counTries 57
6 Time For governmenT acTion 75 reFerences 91
5
Foreword
A strong Netherlands that is ready for the future: a fine ambition. But what would this future look like? Is it a future with a strong economy, or one with a small envir onmental footprint?
This report attempts to bridge the gap between these two – seemingly opposing – ambitions. The reason for this is simple: whoever wants to remain competitive in the 21st century is going to have to use energy and other natural resources in a much more efficient way. Ignoring nature degradation and climate change will have higher costs as a future consequence. We therefore need to become greener; not only for the good of the environment, but also for our economy. This calls for different products and production processes.
An earlier PBL trends report (Changing track, changing tack; Dutch ideas for a robust envir onmental policy for the 21st century) focused on what the Dutch Government, public and businesses could and should do to in a structural approach to tackle the envir-onmental problems of this century. One important issue related to this, is how to guarantee prosperity for the coming generations as we travel along the road towards a low-carbon economy, while also ensuring a radically more efficient use of natural resources. This is the challenge we face.
6
This trends report, Green gains, focuses on the interface between greening and competitiveness, and in particular on the opportunities provided by greening to ensure continued earnings for the future. It describes the current position of the Netherlands, also in comparison with other countries, names obstacles and barriers that companies face in attempting to realise their green ambitions, and looks beyond the Dutch borders to learn from other countries. Based on this analysis, the report outlines policy opportunities for encouraging a transition towards a green, innovative and competitive Dutch economy.
Although the Netherlands is in a strong position in several areas, we lag behind when it comes to green innovation. Therefore, we risk losing our strong competi-tive position. The Netherlands, at the moment, is not ready for the future; other countries seem to be more aware of this need for greening. For example, Germany and Denmark are quite a bit further in that transition.
In the coming years, innovation will be the key to change. If we are to take the ambition of becoming sustainable seriously, we need to review our innovation system. A green growth strategy must attempt to link green innovation to the already existing strengths of the Netherlands. There are plenty of opportunities, but if we are to reap the fruits we need to take action today. This calls for an active government role.
Professor Maarten Hajer Director-General
7
Trends
1. Greening of the economy is necessary
If we fail to use raw materials much more efficiently than we do today and can-not limit climate change and a further degradation of nature, we are putting our future economic growth at risk. Greening of the economy, therefore, is necessary, and companies need to switch to different products and production processes. The transition will also cause a shift in competitiveness. Some countries and com-panies do have that future in mind and are already working on such a transition. If the Netherlands wants to remain competitive, it will also have to do so.
2. The Netherlands is vulnerable
The Dutch economy and particularly its exports rely heavily on sectors with a high energy and material consumption, making the Netherlands vulnerable to increas-ing raw-material prices and supply shortages. For example, the minerals, food production and processing, chemicals, metal and transport sectors are important. The Dutch economy seems to be less well-equipped than other strong economies to make the transition towards cleaner and more efficient products and processes, as the Netherlands is lagging behind in green innovation. Relatively few sectors
8
are able to combine a comparative advantage with a leading position in new clean and efficient technologies. Sectors that are currently doing well but lag behind in green innovation may lose their competitive position in the future.
3. Germany and Denmark are ahead
Successful countries, such as Germany and Denmark, began earlier with the tran-sition towards a green economy, focus more on doing so, and have ambitious, long-term targets in place. They invest more in research, and public funding of innovation has a greater focus on greening. In Denmark, the government actively supports SMEs with regard to innovation and entering international markets. In Germany, there is guaranteed, long-term support for green electricity generation, although this has also had its problems, reflected in the German Energiewende with its high costs and problems with integration in the electricity grid.
These countries have made clear choices, based on their strengths. For example, greening of the German economy is inextricably linked to the ambition to keep the manufacturing of high-technology products inside the country. This ‘Made in Germany’ policy is successful and is being applied consistently. Related factors, such as education and business culture also receive attention, so that greening and competitive power are broadly anchored in policy.
4. Greening as well as earning
Greening is going to cost money, but it is able to strengthen our competitive pos-ition. Clean and efficient technologies can produce financial advantages, and there is a rapid worldwide growth in markets for clean and efficient products. Opportunities may lead to benefits if the Netherlands makes clever use of its in novative power, economic structure and export position. There are at least three promising themes for the transition towards a greener economy. These themes are strongly linked to agriculture and industry, but developments in these sectors also provide opportunities for expanding the Dutch services sector. Broad themes enable cooperation between sectors, and much innovation comes about at the interface between sectors.
a) The bio-based economy
A bio-based economy uses crops and biomass for food, feed, materials, chem-icals, energy and fuel as efficiently as possible. The Netherlands is holding some winning cards, with strong research and competitive positions in biotechnology, food chemistry, agri-food and chemicals. Given the right amount of innovation, the agri-ofood and chemicals sectors could successfully make the greening transi-tion. The challenge is to create strong links between the agri-food sector, which is already innovative and competitive, and the chemicals sector, which although strong is not a leader in green innovation.
9
b) The sustainable built environment
The Netherlands has a strong knowledge base in technologies that are applied in the built environment; in particular, in energy and lighting technology, as well as in energy saving within the built environment. The relatively dense urban struc-ture may become a breeding ground for innovations and applications in this area. As yet, the Dutch construction sector shows too little innovation and too little activity on an international level. However, Dutch architects and designers enjoy international recognition for their innovation and imagination. The theme of the sustainable built environment could be promising if the construction sector would be able to benefit from the success of those renowned architects.
c) The circular economy
The circular economy is based on the reuse of products and raw materials. The Netherlands has a sound knowledge base in this field; in production technology – as noted in the previous two themes – but also in knowledge relating to product design, which is important for the reuse of materials. It is an international leader in recycling and waste processing, which is a good basis for making the transition towards a circular economy.
5. Companies need to focus on exports and green
innovation
There are two main pathways to success. Companies and sectors that display green innovation but have no comparative advantage yet need to improve inter-nationalisation and attempt to increase their presence on international markets. Companies and sectors that are strong but not green need to make the transition towards greening. This will require a green innovation strategy. Of course, com-panies and sectors that are currently green and competitive need to ensure they maintain their position. This will not take place of its own accord, but the govern-ment can help by encouraging green exports and innovative power.
A successful green innovation system is based on entrepreneurship, investment in research and the dissemination and marketing of knowledge. This is where the Netherlands lags behind its neighbours. There are relatively few new companies – particularly knowledge-intensive companies – in the Netherlands, and even fewer that have the ambition to grow. Furthermore, SMEs could be much more active on an international level.
Supporting young and green innovative companies in the form of loan guarantees or temporary funding would help. It is also important that the government does not hinder such companies. Another way of helping would be to continue the Green Deals to detect and remove as many greening obstacles as possible.
10
6. Strong green innovation policy essential for green
growth
Without focused government policy, not enough green innovation will be achieved. Pricing or implementing standards would be effective, particularly with regard to innovation along the beaten path (efficiency improvements). However, more is required for totally new products and production processes (radical green innovation) as uncertainties are large and markets often lacking.
A successful innovation system requires concerted action by entrepreneurs, research institutes and the government. Various elements play a role in this: Green innovation should be leading
It would help if the Netherlands were to set a green ‘dot on the horizon’ and, simi-lar to other countries, focus its innovation policy more on societal objectives, such as greening. This would show that the Netherlands is ambitious in its transition towards a green economy and that it wants to be a leading competitive country. Such an ambition would firmly encourage businesses to focus more consistently on greening, based on the three themes of built environment, bio-based economy and circular economy.
Create more mass
It is important to ensure that the available energy and financial resources do not become too fragmented. Create more mass is important. This certainly applies to investment in research – a particular problem in the Netherlands. Government-funded research and development (R&D) as a proportion of total government spending has decreased in recent years. This is higher in Denmark and Germany, where spending is even increasing. Government investment can boost innovation and strengthen competitive power, as shown for example by the knowledge devel-opment related to the Delta works.
Although the market for green products is still small, the government could help through a sustainable procurement policy. Higher product standards, for ex ample, based on the costs of a product over its lifetime, could encourage sustainable innovation and increase the market for sustainable products.
Greater focus on challengers
Challengers to the established order should be the focus of innovation policy. After all, much radical green innovation comes from small, new, fast-growing companies. SMEs also often find it difficult to obtain funding and lack specific knowledge and expertise.
11
Link up with strong regions
Companies working on clean, efficient technologies (cleantech) are concentrated in knowledge-intensive regions with a good competitive position; in particu-lar, Brainport Eindhoven and the southern and northern wings of the Randstad. National policy on innovation and entrepreneurship, therefore, should be based on regional strength, which means investments should be focused on certain regions.
In conclusion: the Netherlands needs a green growth strategy
A green growth strategy tries to link green innovation to existing Dutch strengths. The Netherlands does not need a new industrial policy as much as it needs a stron-ger, greener innovation policy. This also requires innovation in current policy. For example, the top sector policy could focus more on green innovation and its marketing. This would demands an increase in public funding, and more focused choices within innovation policy. If this innovation is linked to the promising themes for the Netherlands, there is much to be gained. Creative, small companies also need to be given space. After all, investing in innovation and a green growth strategy now will pay off in the future.
13
1 The path to a greener
economy
The need for a greener economy
Anyone who invested in coal mines and steam engines in around 1800 was stand-ing at the forefront of the industrial revolution. In the 20th century, it was natural gas and petroleum that was responsible for an economic growth spurt. Now, any-one who wants to ride the wave of green growth of the 21st century needs to invest in sun and wind. Or, as climate adviser Lord Nicholas Stern put it, ‘The key mes-sage (…) is important and clear: a great competitive margin in the world is going to be over carbon and energy productivity. Countries that slip behind (…) are going to damage themselves and their competitiveness and prosperity in the coming years.’1
It is becoming more and more widely accepted that we need to change the way we use energy and resources. However, where several decades ago the message main-ly came from the environmental movement, it is now also being spread by large companies and international organisations, such as the World Business Council for Sustainable Development (WBCSD), the OECD, the World Bank and the IMF. Economic growth has led to climate change, resource depletion and biodiversity loss, and continued unbridled growth will make much greater demands of the Earth system (OECD, 2012a). The growth seen in China and India is unprecedented,
14
and the upcoming middle classes in these countries are demanding more and bet-ter food, housing, cars and infrastructure. This, in turn, requires more energy, more resources and more water.2
Continuing along existing trends will damage the ecological base on which the economy rests, putting future economic growth at risk. We therefore need to use natural resources more efficiently; in short, greening is necessary.
Green ‘confusion of tongues’
The terms ‘greening’ and ‘competitive power’ often are used with ease, but much less often explicitly defined. In this report too, the intention is not to provide a comprehensive defin ition. However, it would be helpful to explain our interpretation of these terms – in other words, to provide a fairly loose definition.
Greening is the more efficient use of natural resources and the restriction of damage to the
environment. Natural resources include a broad collection of renewable and nonrenewable resources – not just energy, metals and other minerals, but also water, land and biotic raw materials such as wood. Greening does not however guarantee that certain targets, such as the 2 °C climate change target or biodiversity targets, will be achieved. However, greening is a step along the path towards reaching these targets. Many other greeningrelated terms are also used, such as resource efficiency3, absolute (and relative) decoupling4, the circular
economy5 (including cradle to cradle), the biobased economy6 and the blue economy.7 Al
though the emphasis differs, they all have the common denominator of greening. Greening can be achieved by:
• A more efficient use of raw materials to produce goods and services, an example being Tata Steel’s UltraLow CO2 Steelmaking Technology which eliminates the need for the
preprocessing of cokes and iron ore but allows them to be used directly.
• Reuse of raw materials, with recycling and waste processing being obvious options. The concept of the circular economy takes this a step further by separating use and ownership.
• Find substitutes for polluting or scarce raw materials. For example, glass fibre can be used instead of copper for data transfer, and aluminium instead of copper in power transmission lines.
• Reduce the demand for polluting goods and services (change preferences), for example through mobility and dietary changes.
Competitiveness is also a loosely defined concept. Competitive power relates to the abil
ity of companies, sectors, regions or countries that are exposed to regional or international competition to generate added value and work opportunities. Competitiveness is a relative
15
The greening challenge is huge. In its vision for 2050 (WBSCD, 2010), the WBCSD names the following required steps:
• a four-fold to ten-fold efficiency improvement in resource use; • a halving of global greenhouse gas emissions compared with 2005;
• a doubling of agricultural production with no increase in the amounts of land and water required;
• an end to deforestation and an increase in the yield from tree plantations.
concept, as it is about the position of a company or country in relation to others. Very often, as in this report, it is expressed in terms of export: the extent to which a company or sector is able to sell its products and services in other countries. This can be influenced by product differentiation, service, design, novelty, reputation and reliability; all aspects that are rele vant to competitiveness. However, competitiveness is also largely about costs. The com petitive position of a company will only improve if the company concerned is able to reduce its costs to a greater extent than its competitors. By the same token, a company that lags behind other companies in the sector that have managed to reduce their resource use will see its competitive position suffer if it does nothing. If, for example, every company were to react in the same way to a decrease in the price of raw materials, little would change in terms of competitive position.
Green innovation involves both developing new clean and efficient technologies and dis
seminating and applying existing knowledge. Although incremental innovations (improve ments to existing products and processes) are important, they are not enough. What is more important is radical innovation: the creation of completely new products, services and pro cesses. Ecopatents are a measure of green innovation, but cover only part of the palette.8 In
this report, we also consider patents relating to biotechnology. Also, we do not just look at patents as a measure of innovation; process developments and the successful introduction of new products to the market are also considered.
The term cleantech (clean technology) is also used in this report. Cleantech focuses on the provision of clean technology solutions. It is a subset of the wider environmental sector and covers activities related to renewable energy systems and energy saving, environmental consultancy, engineering and other services, environmental technology construction activ ities and the production of industrial environmental equipment.9
Finally, the term green race is also used. This is a metaphor for a race in which companies, sectors or countries compete to hold or improve their competitive position, in particular with respect to the greening elements that contribute to this. It is not a single match, but a constant competition that can be won at various levels, such as on company or sector level.
16
Furthermore, the challenge differs from traditional environmental issues, to which successful policy responses have been found in recent decades.10 The global
scale at which current environmental issues play out means that we are faced with a dilemma: we will only remain within the limits of the carrying capacity of the planet if most countries work together. At the same time, there is the fear of a unilateral greening policy in fact disrupting competitive relationships,11 as stricter
regulations and higher taxes could result in higher costs, although the theory is not clear-cut, and opposing hypotheses for now are rampant (see Text Box: Green growth a utopia?). For example, although the Pollution Haven hypothesis sug-gests that countries could profit from not introducing a strict greening policy (as this could attract investments from polluting sectors) research shows that these effects are small (BIS, 2012). The Porter hypothesis, on the other hand, assumes that a tightening of environmental standards would encourage innovation and so possibly result in a competitive advantage. However, findings in support of either hypothesis are as yet inconsistent.
While governments struggle with the greening challenge, individual companies increasingly often invest in greening as they become convinced that this will pay off in either the short or the long term. These initiatives offer an attractive pros-pect for meeting at least part of the challenge.
The winners and losers of greening
A world that uses its natural resources more efficiently will alter the competi-tiveness landscape. After all, a green economy will demand new and/or different goods and services, and production processes will need to change. This will affect not just a few sectors, such as the energy sector, but the economy as a whole. It will not be sufficient to make only small adjustments, and the fundamental changes that are required will provide both opportunities and risk.
Greening may strengthen a company’s competitiveness. After all, there are valid economic reasons for being much more critical of resource use and material flows. Using energy and materials more efficiently than competitors can reduce costs; especially, if raw-material prices remain high. Companies that have more control over their raw materials will therefore most certainly have a competitive advan-tage. In addition, rapid growth is taking place in markets for clean and efficient products – an interesting prospect in these lean economic times. Since 2007, the global market for environmental technology and resource efficiency (green and cleantech) has grown by almost 12% annually (BMU, 2012). Companies, thus, can ride this green wave.
From a more negative perspective, not taking part in the transition presents cer-tain risks. Companies that fail to participate could become victims: they will be vulnerable to higher raw-material prices and will fall behind competitors that are
17
more successful in the transition towards a greener economy. This could mean that sectors that currently hold a strong position could find themselves in diffi-culty in the future.
Green ambitions in the Netherlands
The Netherlands, similar to many other countries, has large ‘green’ ambitions. The ambition to be one of the most competitive economies in the world is increasingly often linked to a green growth strategy; see for example the Kamerbrief Groene Groei: voor een sterke, duurzame economie (Parliamentary letter on Green growth: for a strong, sustainable economy) (EZ, 2013). Or, as expressed in the Coalition Agreement, ‘The innovative power of the business community, know-ledge institutions and the government will be focused on the transition towards a sustainable economy and green growth, also with an eye on strengthening the competitive power of the Dutch economy.’
When looking at the Netherlands, in this respect, the first impression would be that other countries are better at greening. For the United Kingdom, calculations show that about 8% of its national income was earned through green activities in 2012 (BIS, 2013). The number of these activities also increased; the production of green goods and services was one of the few growth sectors in 2012. The BIS ana-lysis shows that the United Kingdom is a leader in this respect, whereas the Netherlands holds 24th place. Meanwhile, China leads in investments in renew-able energy and green innovation, and is a major exporter of clean technologies. The impression that the Netherlands is lagging behind is strengthened when we consider the rapid developments in green technology taking place in Germany. Here, in addition to renewable energy use, there is a more efficient use of energy and materials, and sustainable transport, water treatment and material cycles (in particular waste recycling). In 2011, 1.5 million people were working in green jobs in Germany, and green technology was responsible for more than 10% of GDP (BMU, 2012). Another example is Denmark. The OECD is full of praise for the opportunities provided to green companies and technologies in Denmark, and the way in which greening has worked as a magnet in attracting foreign invest-ment; particularly in Copenhagen (OECD, 2012b).
The Netherland, however, also has positive examples of companies that benefit from the transition towards greening. The Netherlands is a major investor in Germany’s energy transition (Energiewende), with Tennet investing about six bil-lion euros in offshore infrastructure for wind at sea12 and Heerema Fabrication
Group building the required electrical substations. Construction of the newest platform alone is providing jobs for hundreds of workers.13 The Global Cleantech
100 published by The Guardian also includes many promising Dutch companies: Avantium uses biomass to replace oil in the production of materials and fuels, and Lemnis Lighting produces LED lighting for the horticultural sector. Other
18
companies focus on the reuse of materials. Desso, for example, produces carpet tiles based on the cradle-to-cradle principle.14 Philips has developed a concept
whereby it no longer sells light bulbs, but light. The light bulbs remain the prop-erty of Philips and are returned to the company after a few years of use. Large companies such as Unilever, AKZO and Philips also score well in the Dow Jones Sustainability Index. It seems that these multinationals are able to combine green-ing with successful business models.
Green growth a utopia?
Few would dispute that the greening of the economy is worth it in the long term (CPB, 2011). However, green growth goes a step further, as it suggests that jobs and value added are also delivered in the short term, and that the competitiveness of businesses is strengthened. To support the claim that greening also positively affects economic growth in the short term, the World Bank (Hallegatte et al., 2011) names three arguments:
1. a green Keynesian spending impulse in times of recession, a good example being the insulation of existing homes.
2. the increased consideration of the value of our natural capital in financial decisions. For example, cleaner air results in less disease and less sickness absence, which benefits prosperity.
3. green growth may reinforce technological developments and therefore boost future growth (Porter and van der Linde, 1995).
However, the claim that greening goes hand in hand with shortterm growth is not undis puted. The (orthodox) belief that strict environmental policies slow down rather than boost shortterm growth, still applies. After all, costs come before the profit. Nor is it the case that greening automatically results in the much desired growth and jobs. There are winners, but also losers. Companies fear that greening will push up costs and, thus, will put them at a competitive disadvantage. For example, energyintensive companies, such as in the chem icals and steel industries, are saddled with higher costs due to European climate policy. This fact may cause companies to relocate to regions with a less strict regime.
Past experiences with waste prevention and energy saving, however, have shown that win-win situations are in fact possible, although not at an unlimited scale. This certainly applies to the national level; more jobs are created, while other jobs are lost through greening. Green growth therefore needs to be seen primarily as a structural reinforce-ment for the long term, and not as an answer to the current crisis. In addition, this crisis does not make it easy to focus on green growth. Financial resources and budgetary leeway are limited, after all. On the other hand, the current recession does offer opportunities for eliminating existing in efficiencies. This is the moment for encouraging polluting com-panies to change, so that they do not become a victim of the ‘green shake-out’. It therefore would seem that a strategy focused on green growth makes sense, particularly at this point in time.
19
Green competitive power
It is not yet clear which countries, sectors and companies will be the winners (Fankhauser et al., 2012), or what factors will determine the chance of winning the green race. Green competitiveness is derived primarily from existing com-parative advantages, skills and production patterns (Hidalgo et al., 2007).15 For
example, Germany was able to develop its current position in renewable energy due to its existing expertise in mechanical engineering (Huberty et al., 2011). In general terms, however, two success factors can be defined (see too Fankhauser et al., 2012):
1. Innovation. Green innovation says something about the extent to which green production can replace conventional products and processes. Innovation may be in the form of a new product, but could also consist of process innovation. Innovation is therefore applied in the broadest sense of the word. There is a strong relationship between innovation, productivity and economic growth. 2. The current economic structure. The future position of a country or sector is based
on its current competitiveness. It is important to consider not just the com-parative advantages, but also the size of the sectors. After all, greening in a large sector would achieve greater results than in a small sector.
This report
In this report, we focus on the interface between greening and competitive power. How could greening and increased competitiveness go hand in hand? What are the opportunities for the Dutch economy to strengthening competitiveness through greening? Is the Netherlands ready for the future?
It is important to know where the Netherlands stands when it comes to competi-tiveness and green innovation. Are the export sectors that form the pillars of the Dutch economy ready for renewal? Are companies involved in the transition towards a greener economy to the same extent as those in other countries? Answering these questions, calls for a comparison with other countries.
If the Netherlands wants to lead the way, mediocrity simply will not be good enough. Rather, it will need to look at what seem to be the frontrunners. Germany, Denmark and the United Kingdom are used as references in this report. Similar to the Netherlands, these countries have open, competitive economies in which knowledge and innovation form an important basis for economic growth. However, they seem to be greening their economies more rapidly than the Netherlands.
In reality, it is not countries but companies who compete with one another and who will need to make the successful transition towards a greener economy. The focus in this report, therefore, is on what moves companies to successfully
20
embrace greening, and what holds them back (see Text Box: Input from innovative companies).
In the process of greening, the starting position of the Netherlands gives cause for concern. It is not among the leaders in all areas, as is shown in Figure 1. The Netherlands is relatively strong in areas such as the waste recycling and green taxation, but in others it lags behind the previously named reference countries. There would seem to be opportunities for the Netherlands in several fields, such as the bio-based economy, a sustainable urban environment and the circular econ-omy. The challenge is to apply greening in a way that will enable the Dutch economy to profit to the greatest degree, while limiting negative effects as much as possible. Innovation is an important part of this. However, a successful
Input from innovative companies
To gain a better understanding of what drives companies and what holds them back, for this report, six small green innovative companies were interviewed. A conscious choice was made to talk to smaller companies that focus on radical green innovation. The following companies were approached:
• Van Houtum produces sanitary paper products and provides total solutions for the sani tary needs of businesses and institutions. Van Houtum has introduced ‘Satino Black’ – a line of products fully based on recycled raw materials.
• Desso manufactures carpets and artificial grass and endeavours to base the full produc tion process on the cradle to cradle principle. Their carpet tiles product line is now fully produced in accordance with this principle.
• DyeCoo specialises in techniques for painting on textile based on liquid CO2. This method
saves significant amounts of water and reduces the discharge of dyes.
• PlantLab focuses on optimising growing conditions for plants through a drastic form of climate control; for example, using LED lighting. This makes it possible to reduce water use by 90%, compared with conventional cultivation methods.
• Ibis Power is developing a system for the conversion of wind energy into electricity that can be integrated into the roofs of buildings (IRWES). The company thus provides a solu tion for an aesthetic application of wind energy in urban environments.
• Powerhive is developing offgrid solar energy stations for areas in developing countries with no access to an electricity grid. It is possible to purchase a certain amount of elec tricity using a mobile telephone.
PBL, in addition, also held more general discussions with the World Business Council on Sustainable Development (WBCSD), Shell, DSM and Royal Association MKBNederland (the Dutch association of small and mediumsized enterprises). These talks were also used as input for this report on greening and competitive power.
21
Figure 1
Position of the Netherlands, compared to that of other countries
Source: PBL, based on OECD, 2013
Frontrunner Last in line
Frontrunner Last in line
Resource use and environmental burden
Innovation
Policy tools
Green patents, compared to all patents, 2000–2012
ID GR JP PT NO SK AT CA CZ HU PL RU AU LU ES FR CL MX ZA KR SE IT NZ BE EE FI US CN IN CH IE SI TR IL IS Green taxation, 2010 R & D Expenditure IL FI KR SE JP US AT FR AU SI BE CA CN NO IE EE PT CZ LU ES IT HU RU TR PL SK RO CL SG TW MX US CL CA NZ CN JP ES FR AU PL SK CH BEDEIS ZA LU NO IE PT ATUKIT GR SE FI KR CZ HU EE SI IL BRNLTR DK UK NL DE DK DK DE UK NL Renewable energy, 2010 Recycling of domestic waste, 2009
Energy use per capita, 2010
Netherlands
CL IL SK GR PL EE HU SI CZ IS IE PT ES US IT FI UK FR JP DE KR LU NO AT BE DK SE CH
Netherlands
NL
SA KRRU LU JPUK BE IE IL AUUS CZ PL ARHUGR SK FRMX IT ZA TR CN ES SI EE CA CH CL PT FI IN AT SE ID NONZ BR IS
Netherlands
NL DE DK
IS LU CA US FI NOSAAU BE SE KR RU CZ FR NZ EE AT JP SI CH SK IE IL IT ES ZA PL HUGR PT AR CN CL MXTR BR ID IN
Netherlands
NL DE DK UK
European innovation index, 2012
BG TR RO LV MK PL LT MT HR HU SK GR RS CZ PT ES IT NO EE CY SI FR IE ATUKIS BE LUNL FIDK DESE CH
Netherlands
Netherlands
Netherlands
pbl.nl
22
transition to a green economy will not take place by itself. As this report shows, there is a very clear role for government in this.
What this role could be, was PBL’s quest in this trends report, using a highly spe-cific approach. The report focuses on opportunities for the Netherlands in a world that needs to be greener. It, therefore, does not provide a comprehensive answer to many greening-related questions. Whether taking advantage of the opportun-ities will be enough to meet the global ecological challenge has not been specifically addressed. This trends report does not profess to be a comprehensive study. The aim rather has been to collate a number of signs and trends that chal-lenge us to think further about policy. This certainly applies to innovation policy and how it could be focused more explicitly on greening and on strengthening Dutch competitive power.
23
2 Competitiveness and
green innovation in the
Netherlands
Is the Netherlands prepared for the emerging green economy? The answer is that this depends on the economic structure and innovative power. Although the Netherlands generally scores well in competitiveness and innovation, it would not seem to be ready for a green future in every respect.
Which countries to look at?
At first glance, the Netherlands would seem to be in a good position. It ranks high on international lists that compare competitiveness (see Figure 2).1 The Netherlands
also is innovative, compared to other countries. This is no surprise, as innova-tion is important for competitiveness, productivity and economic growth (e.g. see Aghion and Howitt, 1999; 2007).
However, the ranking does not tell the whole story, as some of the countries that top the rankings are active on different markets. This, for example, applies to the Nordic countries, such as Finland. As Dutch companies have less involvement with companies from these countries, it makes more sense to consider the location of the true competitors of Dutch companies – those fishing in the same (economic) pond. This leads to the conclusion that the main competitors are German and UK companies (see Figure 3).
24
Figure 2 Other European countries Competitiveness score Innovation scoreSource: European Union (Innovation Union Scoreboard), 2013;
IMD World Competitiveness Center (World Competitiveness Index), 2012
pb
l.n
l
Netherlands Reference countries
Innovation and competition, 2012
Strong Weak Strong Weak NL DE UK FR BE IT ES IE PO SE DK AU FI CZ GR HU PT LU SK SI LT EE NO CH RO BG
The Netherlands is one of the most competitive and innovative economies in Europe. Figure 3 Germany Denmark United Kingdom France Belgium Italy Spain Ireland Poland Rest of Europe United States Asia Rest of the world
0 5 10 15 20 25 30
% of market overlap Source: PBL, 2013
pbl.nl
Competition for Dutch exports, 2010
25
It is therefore relevant to compare the Netherlands with Germany and the United Kingdom, as these are our main competitors. Although Denmark is also interest-ing, because, just as the Netherlands, it has an innovative, small, open economy. Furthermore, Denmark would seem to be better at making use of opportunities to capitalise on green growth.2 Moreover, Germany, the United Kingdom and
Denmark are all ‘in the same boat’ as the Netherlands; at the moment, all four are competitive and innovative, but whether they will be able to maintain this in an economy going through a green transition is very much the question.
Figure 4
pb
l.n
l
Production, export positions and specialisations of Dutch sectors, 2000 – 2010
Competitiveness score Specialisation score Source: PBL, 2013 Strong Weak Strong Weak 1 2 3 4 5 6 7 8 9 10 11 12 13 14 15 16 17 18 19 Large Small Production size EU average
Sectors, ordered according to production size Non-profit 1 Business services 2 Construction 3 Financial services 4
Food, alcohol and tobacco
5
Chemicals, rubber and plastics
6
Minerals (including oil processing industry)
7
Transport
8
Postal and telecommunication services
9
Agriculture
10
Timber, paper and printed media
11
Metal
12
Electronic and measuring equipment
13
Means of transportation
14
Machines and appliances
15
Trade and maintenance of cars and motorcycles
16
Glass, pottery, cement, lime and plaster products
17
Furniture and other industry
18
Clothing and leather goods
19
26
What are our main sectors?
What are is the Netherlands good at? What is the status of Dutch production and export, and what are the specialisations? Production volumes, export positions and specialisation ‘scores’ for Dutch sectors are given in Figure 4, compared with those of other European countries.
Business services and non-profit sectors are important in the Netherlands, in terms of production volume. As far as exports and level of specialisation are con-cerned, the country is also strong in the chemicals, agricultural, food and beverage, and alcohol and tobacco industries – all large industrial sectors. In add-ition to the last three industries, the Netherlands’ competitive posadd-ition is also to a large degree based on the mineral industry, postal and telecommunication ser-vices, business and financial serser-vices, and transport. Compared with other countries, the Dutch construction sector hardly operates on an international level. It is also clear that the Netherlands has very few comparative advantages as a high-tech country: compared with other countries it produces relatively small amounts of transport equipment, machinery, and electronic and measuring equipment.
High energy and material use in the Netherlands
Compared with Germany, Denmark and the United Kingdom, the Netherlands uses large quantities of raw materials, such as energy, metals, other minerals and biotic resources (e.g. wood, fish and agricultural products). Dutch export is par-ticularly resource-intensive (see Figure 5). This is because large energy consumers, such as the chemicals industry, are important in the Netherlands. This is of course related to the geographical position of the Netherlands, as well as its gas reserves. Energy-intensive sectors, such as horticulture, also have a large share in exports. The high resource-dependency of the Netherlands makes it vulnerable to price increases of natural resources or supply uncertainties. The Netherlands is at a par-ticular disadvantage where other countries are less sensitive to price increases. Although industrial sectors, such as the chemicals sector, are still doing well in the Netherlands, there is a risk of losing this advantage. In many of the Dutch sectors, improvements in energy intensity lag behind developments in other OECD coun-tries (Mulder and De Groot, 2010). Compared with the world top, Dutch industry has become less energy-efficient. In 1999, Dutch industry, on average, was doing 3.7% better than that of the world top5; in 2012 it was doing 0.7% worse.6 The
rea-son for this is still rather speculative; for example, it may have been easier for countries that started from a position that was worse than that of the Netherlands to improve their efficiency. Furthermore, regulation in other countries is often compulsory, whereas in the Netherlands agreements (covenants) are non- obligatory (CE, 2010). Compliance with agreements is therefore also a very important factor.7
27
Green production sector still small
How large is the green economy in the Netherlands? This is a difficult question to answer, because the green economy includes more than the obvious sustainable energy, water treatment and waste processing sectors. In the case of greening, it is not about having certain new sectors alongside the more conventional ones, but of greening within existing sectors. Even in the metal or chemicals sector, produc-tion processes can be made greener by using fewer raw materials and reducing the environmental burden.
Although it is possible to measure the contribution of typically green activities to the economy, making an international comparison is rather complicated (see Text Box: International comparison of greening difficult).
It is possible to distinguish a green production sector (see Figure 6) within the green economy. This sector includes all the companies and organisations that focus on providing green products and services. The value added of the green pro-duction sector was 13 billion euros in the Netherlands in 2010 and represented 2% of the economy (CE, 2013).
Cleantech is part of the green production sector (Figure 6) and covers an even more narrowly defined collection of activities. This sector focuses on the provi-sion of clean technological solutions,8 such as energy, water, and resource- and
water-saving technologies and activities throughout the value chain (R&D,
Figure 5
Whole economy Exports 0 4 8 12 16 20 % Source: WIOD, 2007 pb l.n l Netherlands Germany Denmark United Kingdom
Resource share, including energy, in total production costs, 2007
28
Figure 6
Green economy and clean technology in the Netherlands, 2010
Source: PBL, based on CE, 2013 0.9% of GDP and 61,000 full-time jobs 2.2% of GDP and 127,000 full-time jobs Total economy Green economy Green production sector Clean technology pbl. nl
The green economy includes more than just the clean-technology sector.
International comparison of greening diffi cult
There is no international standard defi ning ‘greentech’ and ‘cleantech’. Studies into greentech in Germany (BMU, 2012) and environmental goods and services in the United Kingdom (BIS, 2012) are diffi cult to apply to the Netherlands, due to varying defi nitions and data availability. For example, the development phase of the value chain and the production phase of electricity from combined heat and power are included in the greentech defi nition in Germany and the United Kingdom, but not in the Dutch approach, so that the share of GDP is likely to be higher in other countries (CE, 2013). A comparison of the contribution by the environmental sector to the GDP of various countries shows the Netherlands somewhere in the middle, with a contribution similar to Germany (EGSS9, Eurostat). Therefore, it would
seem that it does not diff er too greatly from other European countries, but comparisons are diffi cult to make; Sweden and Austria, for example, score relatively high because they also include forestry.
A comparison between the Netherlands and other countries highlights the small contri bution made by renewable energy in the Netherlands. However, as stated earlier, a green economy and green production sector is about more than just energy. In the Netherlands, waste, waste water and water management are fairly large sectors. However, Danish re search shows that the share of green products in Dutch export is very low compared to that of other European countries. The Netherlands, therefore, exports a relatively large amount of ‘polluting’ products (DEA, 2012a).
29
engineering, construction and installation, consultancy). Cleantech companies in the Netherlands represent about 5 billion euros of value added, or almost 1% of GDP. The growth in production value was about 6%, annually, between 1996 and 2010 (CE, 2013).
With almost one per cent of the economy, the Dutch cleantech sector seems to be fairly average in size, in European terms. However, as explained above, inter-national comparison is difficult. What can be seen, however, is that a significant proportion of the value added is earned through consultancy; in the case of water management and resource efficiency, this is even more than 50% (CE, 2013).10
The size of the sustainable energy sector is about one third of that of the cleantech sector. In Germany, this is more than half (Roland Berger, 2012). Energy saving is
Solar PV innovation moving from panels to foil.
30
one of the larger segments of the sustainable energy sector and, in general, is locally oriented, due to the focus on the built environment and the installation sector. However, sustainable energy also includes the production of LED lighting, insulation materials and high-efficiency boilers, which is much more export-focused. Certainly when compared with Germany, the size of the Dutch sustainable energy sector is relatively small.
Dutch innovation not very green
New and better-applied knowledge could help strong sectors in the Netherlands to improve or maintain their competitiveness. Specific green innovation could enable these sectors to maintain their competitive position in the green economy of the future. Figure 7 Denmark Japan Norway Germany Austria Canada Russian Federation Australia Spain France South Korea Sweden Italy Netherlands United Kingdom Belgium Finland United States China India Switzerland Israel 0 20 40 60 80 100 120 140 160
Index (OECD average = 100)
Source: OECD, 2013 pbl.nl
Share of green patents in all patents in OECD countries with over 30 eco-patents per year Netherlands
Reference countries Other countries
Green-innovation index for OECD countries, 2000 – 2010
31
Few eco-patents
A common measure of green innovation is the share of eco-patents per sector.11
A comparison with the main OECD countries shows the Netherlands at the bot-tom end of the list as far as green innovation is concerned (see Figure 7). At the top of the list are Denmark, Japan, Norway and Germany. The share of eco-pa-tents is almost twice as large in Denmark and, in absolute terms, 10 times larger in Germany than in the Netherlands.
Product and process innovation lagging behind
Although patents are an important indicator of the knowledge infrastructure of a country or sector, they do not tell the whole story. For example, the relationship between patents and the successful introduction of new products needs not be very strong. After all, many new products are unpatented. Also, a patent does not always result in a product that can be successfully introduced. In addition, pa tents are strongly related to technological innovation, and less to service- oriented innovation. Furthermore, skills are often based on established and already impli-cit knowledge. Finally, companies can also innovate through process innovations and reorganisation.
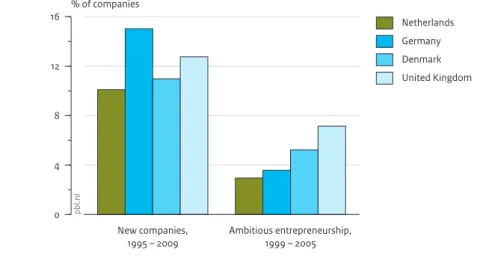
As far as the number of actual product and process innovations in companies is concerned, the Netherlands lags behind Germany and Denmark (see Figure 8).13
For example, the proportion of companies introducing new products on the mar-ket is much higher in Germany than in the Netherlands; 20% compared to 12%.
Figure 8
Product innovation Process innovatie 0 4 8 12 16 20 % of companies
Source: Eco Innovation Scoreboard, 2012
pb l.n l Netherlands Germany Denmark EU27
Product and process innovations, 2004 – 2008
32
Greening not a priority among entrepreneurs and the general public
There seems to be a lack of urgency among Dutch companies, as far as greening and eco-innovations are concerned. For example, compared to those in Denmark and Germany, Dutch companies see reduced energy and material use as less important drivers of innovation (see Figure 9). This is a worrying fact, because Dutch com-panies are relatively energy-intensive.
The Dutch appear to be rather negative about the potential of green growth (see Figure 10). The Eurobarometer, a poll of public opinion in EU Member States, shows that the general public in the Netherlands does not attach much import-ance to green themes, such as the environment, climate and energy.14 For example,
just 7% of the population thought that the environment was an important theme in 2012, compared with 11% in Germany and Denmark (EU Eurobarometer, 2012). In addition, there has also been a conspicuous decline in the sense of urgency in the Netherlands, over recent years.
A strengths and weaknesses analysis of Dutch industry
The opportunities that economic sectors have to benefit from greening are largely determined by the speed with which they are able to make the switch to green products and production processes. Green innovation is an indicator, in this respect. Another important factor is the extent to which sectors are able to obtain or hold on to a market share. A measure of this is the existing export position (comparative advantage). The larger the sector, the more favourable its position. Figure 11 plots comparative advantage (on the horizontal axis) and green innova-tion (on the vertical axis) for the 15 largest manufacturing sectors.15 The production
volume per sector (indicated by the size of the bubble) is a measure of the share in industrial output in the Netherlands. A higher score (to the right and above the dashed line) indicates a performance that is above average: the green competitive-ness of a sector increases the more a sector is placed towards the top right of the figure.
Excerpt from an interview with PlantLab:
‘We prefer not to work with patents. First of all, because they are expensive, and secondly also because patents reveal a great deal. And thirdly, in addition to obtaining the patent, you then need to be able to protect it should infringement take place. In fact, a patent is only as strong as the financial capabilities of the owner. We do own a few patents, although these mainly serve to provide a solid basis. Our clients are often large companies that are used to doing business on the basis of underlying patents. This is why we have made sure that some of our technologies are properly patented, but others are simply trade secrets – just our way of working. And we never divulge those trade secrets – although they include many aspects that we find very logical, for something to work, you need to get everything right at the right time, and that is an art in itself.’
33
Figure 9
Reduction in the use of materials is no innovation priority
Reduction in the use of energy is no innovation priority 0 10 20 30 40
50 % of companies that consider barriers to be very serious
Source: Eco Innovation Scoreboard, 2012
pb l.n l Netherlands Germany Denmark United Kingdom EU27
Main barriers to eco-innovations, 2011
Reducing material and energy use is no priority for many Dutch companies. Figure 10
Nether-lands
Germany Denmark United Kingdom EU27 0 20 40 60 80 100 % of respondents Source: Eurobarometer, 2012 pb l.n l
Do you agree with the statement: 'Higher energy efficiency and combating climate change may lead to economic growth and more jobs within the EU'?
Don't know No Yes
Attitude towards greening the economy, 2011
34
Food production and processing industries are able to combine a strong export position with a strong position in terms of green innovation. These sectors there-fore seem to be ready for the green race. The sectors on the bottom right of the figure are at risk – this applies, for example, to the chemicals industry as a whole. Although these sectors currently have a comparative advantage, they are not lead-ing the way in green innovation. Therefore, they risk misslead-ing the boat when the time comes. There are of course companies in the chemicals sector that are doing very well (see Chapter 4). Some parts of the high-tech and materials industry are green, but have as yet no international comparative advantage (top left of the fig-ure). Some sectors that are important to the Netherlands in terms of production value are going to need to take large steps in greening and internationalisation if they are to remain important in the future. Examples are the paper and machinery industry (bottom right). Generally speaking, there is a weak relationship between green innovation and export position.
Figure 11
Competitiveness score Green innovation score
pb l.n l Strong Weak Strong Weak Weak-nesses Oppor-tunities Strengths Threats Source: LSE, 2013
Food, alcohol and tobacco industry Timber, paper and printed media industry Oil and coal processing industry Chemical industry Metal industry Machines and appliances industry Transport industry 241 231 151 242 291 292 281 289 152 221 153 154 341 252 210 Large Small Production size
Green competitiveness of the 15 largest industrial sectors in the Netherlands, 2005 – 2010 Average for 15 countries relevant to the Netherlands Sector categorisation according to the International Standard Industrial Classification of All Economic Activities (ISIC) No.
35
3 Innovation and
opportunity
The Netherlands is lagging behind in green innovation (Chapter 2). However, this general conclusion deserves some specification. After all, there are a number of niches in which it does excel, such as biotechnology and lighting systems. If a sec-tor is small and the market share limited – and thus lacking in critical mass – even a high level of innovation in that particular field is not going to achieve very much. Fact is also that sectors that are doing well on an international level are not at the forefront of green innovation. These sectors, therefore, run the risk of being left behind as they will be too slow in making the transition to clean and efficient products and processes.
Linking innovative power to existing critical mass will create opportunities. By making use of these opportunities, important sectors in our economy will be able to make the greening transition and enable the Netherlands to remain competi-tive.
This report identifies and discusses three broad themes that provide companies and sectors with greening opportunities:
• the bio-based economy;
• the sustainable built environment; • the circular economy.
36
These broad themes are particularly promising. Within these themes, clean and efficient technologies may be developed that result in new products and more effi-cient processes. Of course, opportunities vary per theme. The bio-based economy, for example, seems to be an open goal; in other themes it would be better – stick-ing to football terminology – to look for smart combinations and improve ball skills. Opportunities will not seize themselves, but require active government intervention (see Chapter 6).
Figure 12
Biotechnology
Red (health care) White (industry) Green (agri-food)
Agri-food (no biotechnology)
Selective breeding (plants) Horticulture
Chemistry (no biotechnology)
Food chemistry Polymers Micro- and nanotechnology Base chemistry Chemical engineering industry
0 100 200 300 400 500 600 700
Index (EU27 = 100)
Source: REGPAT OECD, 2013 pbl.nl
Netherlands Germany Denmark United Kingdom
Dutch specialisations in the bio-based economy, 1999 – 2009
The Netherlands excels in knowledge related to green biotechnology, plant breeding, horticulture and food chemistry.
37
Green resources for a bio-based economy.
Opportunities for a bio-based economy
A bio-based economy is an economy in which most raw materials are obtained from nature (biomass, or ‘green resources’) as part of a green or sustainable econ-omy. These mainly renewable resources are used in materials, chemical products, fuels and food products.
The bio-based economy brings the agricultural and chemical sectors together. Agriculture is very important in the bio-based economy, and crops can also be used for non-food purposes. Examples of such other purposes are potatoes, the starch of which is used to make plastic, and sugar beet that is used for making ethanol and raw materials for chemicals and biofuels. Horticulture – as a supplier of high quality plant materials – could also become an important partner for the chemicals industry. Plant breeding and cultivation under controlled conditions can provide the complex molecules that could serve as the buildings blocks for the production of pharmaceuticals, food ingredients such as vitamins, flavourings and aromas, and ingredients for cosmetics and high quality animal feed. Any waste material left can be fermented to generate bio-energy.
The Netherlands has an excellent knowledge base in areas that are important in the bio-based economy. In a recent study, the Dutch city of Wageningen was shown to be the second centre in the world for biotechnology, after Cambridge in the United States (Heimeriks and Boschma, 2013)1. An analysis of patents showed
38
breeding, horticulture and food chemistry (see Figure 12).2 Knowledge on green
biotechnology may be used, for example, to optimise yields in the agri-food sector or to reduce environmental impacts. The same applies to food chemistry. Because of its highly developed agricultural, food (agri-food) and chemicals sec-tors, the Netherlands is in a good position to play an important role in the bio-based growth market (SER, 2010). Given the right amount of innovation, the agri-food and chemicals sectors could successfully make the greening transition. The challenge is to create strong links between the agri-food sector – which is already innovative and competitive – and the chemicals sector, which although strong is not a leader in green innovation (see Chapter 2).
There is much money to be made in the bio-based economy; the unused potential in the European market for bio-based products is estimated at 80 to 120 billion euros (WUR, 2008).
Although the switch to a bio-based economy presents good opportunities for the Netherlands, its potential should not be overestimated. Much is possible, but in practice not always easy to achieve (P+, 2012). For example, it is certain to be an other 10 to 20 years before it will be profitable for companies to produce bio-plastics from waste. Although it is fairly easy to convert clean raw materials, agricultural waste flows are more difficult to process. These waste flows are not clean, which makes the fermentation processes in reactors 10 to 100 times more susceptible to problems. Also, farmers, wholesalers, factories and supermarkets all need to adjust to the new green agri-chemical sector. The transition to a bio-based economy, therefore, involves more than just new technology; it requires completely new processes and cooperation between various actors who first need to learn to speak each other’s ‘language’.
39
The price of fossil fuels will also influence the success of the bio-based economy. As long as it remains relatively low, it will be difficult for bio-based solutions to compete. A recent EU study, for example, shows that bio-based succinic acid, a chemical with a broad range of applications – from plasticisers to perfume – has a market potential of 14 billion euros. However, succinic acid made from petro-chemical sources is still 10% to 20% cheaper than that produced by fermenting carbohydrates (bio-based).
Opportunities for a sustainable built environment
Opportunities for a ‘sustainable built environment’ apply to the whole field of sus-tainable area development and ‘green buildings’, and to the application of various technologies for the sustainable development of urban areas.
Examples are new energy-neutral buildings and the renovation of offices and homes (‘green buildings’). It is not just about insulation, but also about residual heat, energy saving in public lighting, geothermal energy generation and the use of solar panels. A broader interpretation of a sustainable built environment could even include the integration of sustainable transport, housing and work.
With respect to the various niches within green innovation, the Netherlands is seen to be highly specialised in ‘energy and lighting technology for the built environment’.
Figure 13 shows that the proportion of Dutch eco-patents in this field is three times the average for the European Union, and much higher than in the three ref-erence countries of Germany, Denmark and the United Kingdom. However, these reference countries of course each have their own specialisations. Denmark, for example, is strong in renewable energy and for Germany this is innovation in sus-tainable transport. Innovation in energy and lighting technology for the built
Excerpt from an interview with PlantLab:
‘There is much specialist knowledge available that is barely used. If you can be smart about combining such knowledge, the opportunities for new markets are huge. For example, knowledge related to the nu-tritional value of sports food is so advanced in some sports that making that knowledge available to normal people could make a world of difference to their health. (…) Although the knowledge is available, it is often not applied, and if you would like to apply this knowledge, the question is whether you would be able find existing food products that contain those ‘right’ nutrients. If not, you would need to cultivate ‘to order’. It will of course be a huge challenge over the coming 30 years to link all the fields that currently seem to have nothing to do with each other. The commercial horticulture sector is not really interested in nutritional values. We therefore need to bring these fields together, and as far as opportunities for the Netherlands are concerned, they are huge.’
40
environment in the Netherlands is not only strong compared with that in other countries – with one third of all the eco-patents in the Netherlands being related to this field, it also constitutes a large segment within the Netherlands. Philips, with its LED technology, is particularly strong.
Many activities that take place in the environmental sector in the Netherlands are related to the sustainable built environment (see Chapter 2), similar to certain seg-ments in Energy systems and energy savings (the sustainable energy sector). This, therefore, would provide a good basis to build on. The sustainable energy sector accounts for almost one third of the total environmental sector in the Netherlands, representing an added value of about 1.6 billion euros, annually, or 20,000 full-time jobs. Energy saving, in particular through insulation, takes a prominent position in the sector (see Figure 14). Heat and geothermal energy as well as solar
Figure 13 Energy and lighting technology built environment Carbon capture and storage Efficient combustion technologies Renewable energy General environmental services Climate mitigation technologies Sustainable transport 0 100 200 300 400 500 600 Index (EU27 = 100) Source: OECD, 2013 pbl.nl Netherlands Germany Denmark United Kingdom
Green-innovation index per type of eco-patent, 1999 – 2009