Wetted surface area of
recreational boats
RIVM Report 2017-0116
Wetted surface area of recreational boats
Colophon
© RIVM 2017
Parts of this publication may be reproduced, provided acknowledgement is given to: National Institute for Public Health and the Environment, along with the title and year of publication.
DOI 10.21945/RIVM-2017-0116
J. Bakker (author), RIVM
P.L.A. van Vlaardingen (author), RIVM Contact:
Joost Bakker
Centrum voor Veiligheid van Stoffen en Producten Centre for Safety of Substances and Products joost.bakker@rivm.nl
This investigation was conducted by order and for the account of
Ministry of Infrastructure and Water Management, within the framework of the project Policy Advice and Methodology for Biocides and Plant Protection Products
This is a publication of:
National Institute for Public Health and the Environment
P.O. Box 1 | 3720 BA Bilthoven The Netherlands
Synopsis
Wetted surface area of recreational craft
The wetted surface area of recreational craft is often treated with special paint that prevents growth of algae and other organisms. The active substances in this paint (antifouling) are also emitted into the water. The extent of this emission is among others determined by the treated surface area.
The RIVM has developed a method to calculate the wetted surface area of recreational craft based on boat length. This is essential to assess the environmental effects associated with these emissions. The final result of this study is a weighted average value for the wetted surface area of recreational craft in Dutch marinas, including separate values for salt water, transitional waters, and fresh surface water.
Paints sold with this purpose are known as biocides. The safety of biocides for both humans and the environment is assessed during the authorisation phase of biocidal products. The active substance in
antifouling paint may also be toxic to organisms other than those on the ship's hull.
Keywords: recreational boats, pleasure craft, antifouling, wetted surface area, underwater area, hull, form coefficient, design ratios, biocide
Publiekssamenvatting
Het onderwateroppervlak van pleziervaartuigen
Het onderwateroppervlak van pleziervaartuigen wordt vaak met speciale verf behandeld die voorkomt dat er algen en andere organismen op gaan groeien. De werkzame stoffen in deze verf (antifouling) komen in het water terecht. Hoeveel dat is wordt mede bepaald door de grootte van het behandelde oppervlak.
Het RIVM heeft een methode ontwikkeld om het onderwateroppervlak van recreatievaartuigen te berekenen op basis van de bootlengte. Een goede schatting van de grootte van dit oppervlak is essentieel voor de milieubeoordeling. Het eindresultaat is een gewogen gemiddelde voor het onderwateroppervlak van recreatievaartuigen in Nederlandse jachthavens en een uitsplitsing daarvan naar zeewater, binnenwateren en overgangswateren.
Verven die verkocht worden met dit doel zijn biociden. Bij de toelating van biociden wordt de veiligheid van het product voor mens en milieu beoordeeld. De werkzame stof in de aangroeiwerende verf is mogelijk niet alleen giftig voor organismen die onder water aangroeien op de boot, maar ook voor de overige organismen in het water.
Kernwoorden: pleziervaartuigen, recreatievaart, antifouling, aangroeiwerende verf, nat oppervlak, onderwateroppervlak, romp, coëfficiënten, verhoudingen, biocide
Contents
Summary — 9 1 Introduction — 11
1.1 Authorisation of antifouling paints — 11 1.2 Wetted surface area as critical factor — 11 1.3 Aim of this report — 12
2 Wetted surface area estimation — 13
2.1 Introduction — 13 2.2 Empirical formulas — 13 2.3 Measurements — 14
2.4 Hull design plans and reported data — 15 2.5 Discussion — 15
3 Ship hull shape parameters — 17
3.1 Hull form coefficients — 17 3.2 Boat statistics — 17
3.3 Design ratios — 18
3.4 Stepwise procedure for estimating the wetted surface area — 19 3.5 Ship hull parameters for motor yachts — 20
3.5.1 Hull form coefficients — 20 3.5.2 Hull design ratios — 21
3.5.3 Discussion, values selected — 23
3.5.4 Lateral area of the rudder and skeg — 24
3.6 Traditional ships (flat and round bottomed) — 25 3.6.1 Hull form coefficients — 25
3.6.2 Hull design ratios — 27
3.6.3 Selected values for hull form coefficients and hull design ratios — 29 3.6.4 Lateral area of the rudder, skeg and ‘loefbijter’ — 30
4 Calculated wetted surface areas of recreational boats — 33
4.1 Sailing yachts — 33
4.2 Motor yachts and traditional craft — 34 4.3 Overall results — 37
4.3.1 Freshwater, brackish water and saltwater combined — 37 4.3.2 Freshwater, brackish water and saltwater separated — 37
5 Discussion and conclusion — 39 References — 43
Abbreviations — 47
Annex I – Contours of wetted surface coefficient — 48 Annex II - Sailing yachts hull form coefficients and design ratios — 49
Annex IV - Hull characteristics for traditional craft from Rond- en
Platbodem Klassenorganisatie (2016) — 58
Annex V - Hull characteristics from OCR certificates for sailing yachts — 59
Annex VI. Length class distribution of Dutch recreational craft – split data of 2005 survey — 61
Summary
The underwater area or wetted surface area of recreational craft is often treated with an antifouling coating. Paint applied on the ship's underwater hull contains (an) active substance(s) that help(s) to prevent fouling on ship hulls. In Europe, the Biocidal Product Regulation regulates market authorisation of these paints. As part of the market authorisation process, an environmental risk assessment is performed to ensure safe use of antifouling products. The assessment covers the life cycle stages of application of new paint, removal of old paint, and service life. The estimation of the environmental emission discerns between commercial ships and recreational ships, and between marine and fresh surface water environments. Harbour and marina environments are modelled in order to predict the concentrations of the active substance in e.g. surface water. One of the critical parameters determining the model outcome is the wetted surface area of the boats moored in marinas. This area equals the painted area of boats that is in direct contact with water and is directly proportional to the predicted environmental concentration.
This report focuses on the wetted surface area of recreational craft. The emission model uses a single, average value for this parameter by default. In 2012, a new default value was proposed in a Dutch study; this was nearly 2 times lower than the existing value. As both values were not well underpinned, it remained unclear which value was most realistic. This prompted us to derive a new scientifically valid and traceable default value.
We present a number of models and methods used to calculate the wetted surface area of motor boats, traditional sailing boats and sailing yachts. The final procedure returns the wetted surface area as a function of the overall length of the boat.
Data on the length class distribution of recreational craft in a sample of 40 marinas in the Netherlands were available. These data distinguished between motor boats, traditional sailing boats, and sailing yachts. Furthermore, the data were split into marine, transitional (brackish) and fresh (inland) water environments. With these data and the selected model, a weighted average value for the wetted surface area was calculated for each boat type and for the three environments. This was further aggregated to an overall value for recreational craft. The resulting value is proposed as a new default value for use in the environmental risk assessment, and is considered valid for the Netherlands.
In other European Member States, the length class distribution and relative share of various boat types in pleasure craft marinas is likely to be different. Using our methodology, the weighted average values for the wetted surface area for marinas in other Member States can be calculated.
1
Introduction
1.1 Authorisation of antifouling paints
Regulation (EU) No 528/2012 (EU, 2012), as amended, concerns the making available on the market and use of biocidal products. This
legislation covers antifouling paints, meaning that a product authorisation is required before these types of paints can be placed on the EU market. The authorisation procedure includes an assessment of possible negative environmental effects. Emission scenarios have been developed for this purpose. In these scenarios, a (standard) environment is described that receives the active ingredient from a specific application of a biocidal product.
In the past, various emission scenarios for biocidal antifouling paints have been developed for different situations, environments and types of ships. A comprehensive overview is provided by Van de Plassche and Van der Aa (2004). The release of the active substance does not only occur when ships are in service, but also during construction, maintenance and repair, i.e. when actually coating, removing the old paint layer and recoating the hull of the ship with antifouling paint at shipyards, boatyards and
marinas. Therefore, a number of scenarios have been developed not only for use during construction, maintenance and repair but also for ships moving in shipping lanes and open seas, and for ships at berth in commercial harbours and estuarine, coastal and freshwater marinas. Deltares and the Vrije Universiteit Amsterdam developed the 'Marine antifoulant model to predict environmental concentrations’ (MAMPEC ) (Van Hattum et al., 2016). Using MAMPEC, environmental concentrations of active substances released from antifouling paints can be calculated for different default environments and situations. The model takes important factors into account including hydrodynamic exchange, expected
emissions in relation to number and size of the boats, dimensions of the harbour and water, and substance characteristics affecting partitioning and degradation (or speciation in the case of metals) of active substance. Many of the emission scenarios developed take the MAMPEC model as a basis, providing default values for the MAMPEC model parameters (Van de Plassche and Van der Aa, 2004).
1.2 Wetted surface area as critical factor
Van der Meulen et al. (2012) performed a review of existing Dutch inland marinas and proposed representative settings for the environmental and emission definitions in MAMPEC to allow an exposure assessment for small freshwater marinas in the Netherlands. This was done in response to the finding, resulting from discussions with Dutch regulatory agencies for the approval of new antifouling paints, that the existing OECD-EU scenarios in MAMPEC were not representative of the exposure conditions in small inland freshwater marinas in the Netherlands.
One of the critical factors in the assessment is the underwater surface area (also indicated as wetted surface area WSA) of ships at berth. Van de Plassche and van der Aa (2004) provide an overview of reported WSA
values for recreational boats at berth in freshwater marinas taken from different studies. Values for the average under water surface area vary from 5 m2 to 30.7 m2. These values result from surveys, expert
estimates or different equations, rules of thumb, or on statistical
analysis of hull forms used for calculating the WSA, in order to estimate the resistance of ships in the water in ship design. Most of these
equations require the dimensions of the ship such as length, breadth (beam) and draught as input. More advance equations also require information on the hull form expressed by hull form coefficients. Detailed calculations can only be performed if information on average boat characteristics for the different types of boats (the length and corresponding width and depth) and the distribution of the number of boats within the length classes for each type of boat are available. This kind of information on the types of boats and dimensions is generally based on surveys, measurements or experience.
In the above-mentioned review, Van der Meulen et al. (2012) proposed a new value for the WSA of pleasure craft at berth in inland marinas. Together with the number of ships at berth and the leaching rate, this parameter determines the emission of the mass of active antifouling ingredient into the aquatic environment. The authors concluded that the typical yacht sizes for small inland marinas are considerably smaller than those defined in the OECD scenario (OECD, 2005), therefore they recalculate the WSA for this category. The proposed value was 17.8 m2
for an average boat length of 8.9 m, which is considerably less than the value defined in the OECD scenario: 30.7 m2 for an average boat length
of 9.2 m. The fact that fairly similar boat lengths resulted in such a large difference in the WSA, raised the question of which value would be appropriate.
1.3 Aim of this report
From the above, it is clear that there is a need for a well-substantiated typical value for the WSA of ships for small inland freshwater marinas in the Netherlands. It is important to note that the size of recreational craft might differ from country to country, and may also depend on the type of water where the marina is situated. Variation may also be caused by differences in the share of different types of boats such as sailing yachts, motor yachts, and traditional craft. This leads to the need for a generic procedure to calculate the WSA of recreational boats for other countries as well as for estuarine and coastal marinas. The focus of this report is to provide data which will enable the calculation of the WSA for pleasure craft, and to provide a typical average value for recreational boats at freshwater marinas in the Netherlands.
2
Wetted surface area estimation
2.1 Introduction
A number of methods can be used to estimate the WSA of ships, including empirical formulas, measurement, computer aided design systems, or hull form design plans. Each of these methods (except for computer aided design systems) will be briefly explained in the following sections.
2.2 Empirical formulas
There are a number of empirical formulas for WSA calculation. These are mainly based on statistical relationships between various selected hull characteristics and the known WSA from ships’ records or ship model experiments. The applicability domain of these formulas can be either very specific for a certain ship type, while others may be very general. Some equations are generally applicable with respect to the type of ship, though only applicable within certain constraints or ranges of hull
dimension ratios or ranges of form coefficients. Many formulas are based on the displacement volume in combination with the length, draughta or beam of the ship. For estimating the wetted area, the length
and the beam on the waterline should be used. The draught is the depth measured from the baseline to the load waterline, being the depth of the canoe hull excluding the skeg and keel.
The Holtrop-Mennen equation (Holtrop and Mennen, 1982) is one of the most recently developed formulas, and is applicable to a wide range of forms. This formula (Equation 1) is extensive with regards to data requirements. It requires the length, beam, draught as well as the block coefficient, midship coefficient, and water plane coefficient to calculate the WSA. A final term in this equation does not contribute in case of a hull without a bulbous bow. Since bulbous bows are rarely used on small recreational craft, this term is not included here.
Other formulas require less information and are often based on the displacement volume. Some formulas use specific coefficients that can be derived either from an equation or from a graph which, especially in the latter case, makes them more difficult to apply. In addition to the Holtrop-Mennen equation, some other well-known and popular formulas are provided below. An overview can be found in Molland et al. (2011). Holtrop-Mennen (1982), Equation 1:
𝑊𝑊𝑊𝑊𝑊𝑊 = 𝐿𝐿 ∙ (𝐵𝐵 + 2 ∙ 𝑇𝑇) ∙ �𝐶𝐶M∙ �0.453 + 0.4425 ∙ 𝐶𝐶B− 0.2862 ∙ 𝐶𝐶M− 0.003467 ∙𝐵𝐵𝑇𝑇 + 0.3696 ∙ 𝐶𝐶W� (1) The Holtrop formula without the water plane area coefficient (Holtrop, 1977), Equation 2:
𝑊𝑊𝑊𝑊𝑊𝑊 = 𝐿𝐿 ∙ (𝐵𝐵 + 2 ∙ 𝑇𝑇) ∙ �𝐶𝐶M∙ �0.530 + 0.632 ∙ 𝐶𝐶B− 0.360 ∙ (𝐶𝐶M− 0.5) − 0.00135 ∙𝑇𝑇�𝐿𝐿 (2)
a Usually understood to be the depth of water needed to float a ship, thus including appendages like the skeg and keel.
Taylor (1893), Equation 3
𝑊𝑊𝑊𝑊𝑊𝑊 = 𝐶𝐶S∙ √𝐿𝐿 ∙ ∇ (3)
CS is the wetted surface coefficient and has to be read from a graph and
depends on the BWL/T-ratio and the midship area coefficient, see
Annex I. Froude, Equation 4: 𝑊𝑊𝑊𝑊𝑊𝑊 = ∇2/3∙ �3.4 + 𝐿𝐿 2 ∙ ∇1/3� (4) Denny-Mumford (1), Equation 5: 𝑊𝑊𝑊𝑊𝑊𝑊 = 𝐿𝐿 ∙ (1.7 ∙ 𝑇𝑇 + 𝐵𝐵 ∙ 𝐶𝐶B) (5) Denny-Mumford (2), Equation (6):
Replacing CB by ∇ 𝐿𝐿 ∙ 𝐵𝐵 ∙ 𝑇𝑇⁄ the Denny-Mumford equation turns into
𝑊𝑊𝑊𝑊𝑊𝑊 = 1.7 ∙ 𝐿𝐿 ∙ 𝑇𝑇 +𝑇𝑇∇ (6)
Variations on the Denny-Mumford formula are listed below. Muragin, Equation 7:
𝑊𝑊𝑊𝑊𝑊𝑊 = 𝐿𝐿 ∙ (1.36 ∙ 𝑇𝑇 + 1.13 ∙ 𝐵𝐵 ∙ 𝐶𝐶B) (7) Kirk, Equation 8:
𝑊𝑊𝑊𝑊𝑊𝑊 = 𝐿𝐿 ∙ (2 ∙ 𝑇𝑇 + 𝐵𝐵 ∙ 𝐶𝐶B) (8)
Specifically for sailing yachts, the empirical relationship based on Delft series of hull forms can be used to estimate the wetted area of the canoe body (Molland et al., 2011 and Larsson and Eliasson, 2000), Equation 9: 𝑊𝑊𝑊𝑊𝑊𝑊 = �1.97 + 0.171 ∙𝐵𝐵WL 𝑇𝑇C � ∙ �∇C∙ 𝐿𝐿WL∙ � 0.65 𝐶𝐶M � 1/3 (9) In which:
WSA wetted surface area (m2).
T = TC draught of the canoe body of the ship excluding fin, rudder or
keel (m), also TC.
L = LWL length of the ship on the waterline (m).
B = BWL beam of the ship on the waterline (m).
∇ displacement volume (m3).
CM midship area coefficient of the underwater hull.
CB block coefficient of the underwater hull on the basis of length
on the waterline.
CW water plane area coefficient based on length on the waterline.
CS wetted surface coefficient.
2.3 Measurements
To be able to fairly compare different sailing yacht types in any range of wind conditions and course types, hull shape characteristics such as length on the waterline while sailing, displacement volume, and WSA have to be known. For this purpose, a hull measurement is performed to create an offset (OFF) file describing the body plan of the hull together
with appendages. This can be done, for instance, by using a hull measurement machine approved by the Offshore Racing Council (ORC, 2017). The recorded measurement data are included in certificates.
2.4 Hull design plans and reported data
The WSA and other hull characteristics can also be estimated from the lines plan of the hull for the three different views, i.e. the profile plan (side view), half breadth plan (shape of the hull from the top view) and the body plan (front to back view). A common and simple numerical method for estimating areas under a curve is Simpson’s rule. By
applying Simpson’s rule, the WSA, the displacement volume, the water plane area, the hull section area and other parameters can be estimated as explained by Larsson and Eliasson (2000). In their report, lines plans are (mainly) applied to estimate the water plane area and the lateral area of the skeg (sternward extension at the centre line of the keel of boats) for traditional Dutch sailing boats.
Some boat designers report the WSA and other design parameters on their website or in brochures. This is usually only available for a few of their models, and the information provided is quite limited. Very unusually, Dudley Dix Yacht Design (2017) reports extensive data on their (sailing) boat designs on their website.
2.5 Discussion
Measured WSAs and areas derived from hull design plans are considered the most accurate. However, measured data are only available for sailing yachts taking part in sailing competitions. For sailing yachts, the measured WSAs from the ORC certificates and the WSAs reported by Dudley Dix Yacht Design (2017) are available to derive an average value.
Because the WSA is usually not measured for traditional craft and motor yachts, it has to be estimated using empirical formulae. This requires the dimensions, hull form coefficients and design ratios. This information is presented in Chapter 3. The data collected for sailing yachts is
included in Annex II for completeness. Design plans are generally not readily available. In addition, it is a complex task to derive the WSA from hull plans, and it would take a large number of different types and sizes of boats to derive a representative figure. However, it is relatively easy to use hull plans to determine other characteristics such as hull form coefficients and typical ratios compared to the WSA. We only used hull plans in this study to complete essential missing data. For
traditional boats, hull plans are, for instance, available from the archives of maritime museums. For sailing yachts and motor boats, lines plans are available at boat design studios or boat builders, but these are usually not publically available.
3
Ship hull shape parameters
3.1 Hull form coefficients
The form of the hull can be characterised by different coefficients. The most common coefficients needed to estimate the WSA from empirical relations are the block coefficient, midship area and water plane coefficient as listed in section 2.2.
The block coefficient CB indicates how full-bodied the underwater volume
of the ship is, and is calculated as the displacement volume divided by the circumscribed block:
𝐶𝐶B=𝐿𝐿 ∙ 𝐵𝐵 ∙ 𝑇𝑇∇
The midship area coefficient CM expresses how full-bodied the main arch
(largest underwater section) of the ship is, and is calculated as the cross-sectional area at midship divided by the area of a rectangle of the same overall width and depth as the underwater section of the hull. The main arch is not necessarily located midship. The coefficient is calculated as:
𝐶𝐶M=𝐵𝐵∙𝑇𝑇
A
MThe prismatic coefficient CP is the ratio of the displacement volume and
the maximum section area multiplied by the waterline length:
𝐶𝐶P=𝑊𝑊∇ M∙𝐿𝐿
The prismatic coefficient can also be presented as the ratio of the block coefficient and the midship area coefficient:
𝐶𝐶P=𝐶𝐶𝐶𝐶B M
The water plane area coefficient (CW) is the water plane area of a ship to
a rectangle of the same length and width. The water plane coefficient expresses the fullness of the water plane:
𝐶𝐶W=𝐿𝐿 ∙ 𝐵𝐵𝑊𝑊W
Finally, the lateral area coefficient is the actual area of the underwater lateral plane of the hull as a fraction of the rectangle of the same overall length and depth based on the waterline of the hull:
𝐶𝐶LP=𝐿𝐿 ∙ 𝑇𝑇𝑊𝑊LP
In which:
ALP area of underwater lateral plane (m2).
AM cross-sectional area at midship (m2).
AW water plane area (m2).
3.2 Boat statistics
To calculate the WSA by applying empirical equations such as the Holtrop-Mennen equation, in addition to the hull form coefficients, the length on the waterline (LWL), the beam on the waterline (BWL) and the draught of
calculation of the average WSA for recreational craft can only be performed if, in addition to this information, statistics on (the average) boat dimensions are available, e.g., the distribution by type of boat such as motor boats and sailing boats (traditional craft and sailing yachts), and the distribution of the number of boats within the length classes.
From a survey conducted on recreational boats present in 40 Dutch inland marinas, the length, the average beam and draught is available for different length classes for six types of boats e.g., sailing yachts (open and cabin), motor yachts (open and cabin), traditional craft, and others (Waterrecreatie Advies, 2005). These data combined with the hull characteristics provide the basis for the calculation of the average WSA for recreational boats in the Netherlands.
Although not explicitly mentioned, it is assumed that the figures presented by Waterrecreatie Advies (2005) refer to the overallb length
and overall beamc and the maximum draught. This is partly based on the
fact that the beam and draught are based on information taken from yacht brokers’ websites. These websites usually only provide overall dimensions. Furthermore, the data were generated by sending surveys to harbour masters who were asked to register the measurements of the boats at berth. There were no specific guidelines provided to measure the boats. Considering that it is much easier to estimate the length of a ship at berth compared to its beam and draught, it can be concluded that the average length of each length class is the most reliable measure. The reported beam and draught are considered as rough estimates; this is also indicated by Waterrecreatie Advies. Therefore, we decided to base the dimensions of each boat type on the reported overall length.
3.3 Design ratios
To be able to compare and characterise ships with different proportions a useful starting point in boat design is, besides the hull form
coefficients, to use dimensionless numbers or ratios (Larsson and Eliasson, 2000, Miller and Kirkman, 1990, Henry and Miller, 1963). The following dimensionless numbers or ratios can be applied to derive the dimensions on the waterline and that of displacement volume of the hull, with the overall length of the hull as the only known parameter. A further explanation of the procedure is provided in the next section. Relevant parameters are:
BOA maximum breadth or beam or overall beam (m).
BWL beam on the waterline (m).
LOA overall hull length (m).
LWL hull length on the waterline (m).
∇ displacement volume (m3)
T draught of the canoe body of the ship, also TC (m).
The ratio between the overall length (of the hull) and the length on the waterline is known as the overhang ratio, i.e. LOA/LWL.
b Overall length means the length measured from bow to stern at deck level of the boat as opposed to waterline length, which means length measured from bow to stern at the water level. Length at the waterline for a boat is smaller than overall length.
The ’beaminess’ of a boat can be quantified by the length to beam ratio. This ratio increases with the length. Often the ratio of length overall and the maximum beam (LOA/BOA) is used. If the waterline length and the
beam (LWL/BWL) are used, this produces different values. In this study,
we used the ratio based on the hull waterline.
To be able to calculate the draught, either the load waterline length to canoe body draught ratio (LWL/T) or the waterline beam to draught ratio
(BWL/T) can be used. As for the length-beam ratio, typical values were
taken from literature or derived from actual data on ship dimensions. Some of the equations use the displacement volume (∇) to calculate the WSA. Because the displacement volume is not provided in the statistics from the Waterrecreatie Advies report (2005), the displacement volume also needs to be estimated from the available data on typical ratios for the different types of boats. For this purpose, the length-displacement volume ratio is used which is a measure of the slenderness of the hull, expressed as:
𝐿𝐿𝐿𝐿𝐿𝐿=∇1/3𝐿𝐿
This number can be plotted against the length to beam ratio (LWL/BWL).
The length to beam ratio is derived from its relation with the waterline length.
The relationships between design ratios and their typical values are either taken from the literature or are derived from real data on ship dimensions. Typical values of the above-mentioned ratios will be provided for each shipping type: motor yachts, traditional sailing ships, and sailing yachts.
3.4 Stepwise procedure for estimating the wetted surface area
The dimensions of the ship hull on the waterline are needed as input parameters for WSA calculations. From the boat statistics provided by Waterrecreatie Advies (2005), only the overall length of the hull is known, as noted in section 3.2. Therefore, we needed a procedure to estimate the dimensions on the waterline from the overall length of the ship. The first step was to calculate the length on the waterline by applying the
overhang ratio; the ratio between the overall length and the length on the waterline (LOA/LWL). The next step was to determine the beam on the
waterline from the waterline length to beam ratio (Lwl/BWL). This ratio can
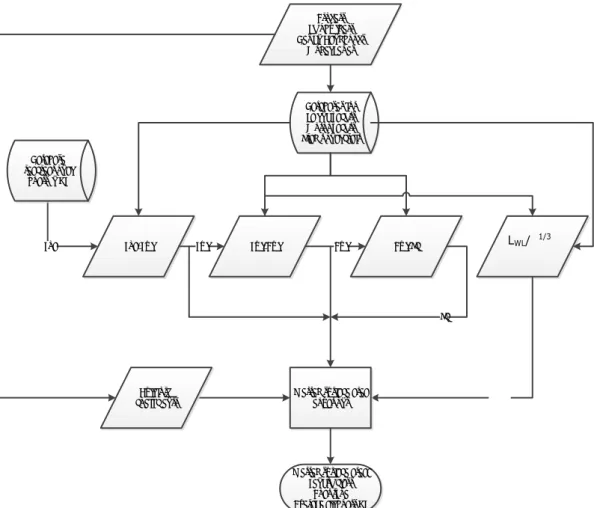
be presented as a function of the waterline length. Finally, the draught of the hull had to be calculated; here we applied the commonly used beam to draught ratio. The displacement volume can be derived from the waterline length to displacement volume ratio, which increases with the waterline length to beam ratio. The linear relationship between these two ratios is used to calculate the displacement volume using the waterline length to beam ratio as input. Figure 1 shows a graphical representation of the procedure followed.
Figure 1. Overall data flow and overview of the procedure to determine the WSA from reported overall length of the hull.
The design ratios are based on actual hull dimension data from ships within each ship category and reported typical values from literature. The data came from public reports and handbooks or, if needed, additional information was collected from databases such as the ORC database, brokers’ websites, and manufacturers’ websites. The collected data on hull dimensions for the different types of boats is presented in Annex III and Annex IV. Finally, with the estimated hull dimensions on the waterline and the displacement volume of the canoe body, the WSA can be derived using the various equations listed (section 2.2) including the information collected on hull form coefficients.
3.5 Ship hull parameters for motor yachts
3.5.1 Hull form coefficients
Typical values for the block coefficient CB are, amongst others, reported
by Colombo (1908), Dewan (2015), Gaillarde et al. (2004) and Van Oossanen and Van Oossanen (2006). These are summarised in Table 1. Gaillarde et al. report a wide range of CB values for motor yachts and
state that block coefficients around 0.45 to 0.50 appear to be common. The values presented by Dewan are for frigates and are considered representative for large motor yachts. These values are in line with those reported by Gaillarde et al. The data presented by Gaillarde et al., shows no dependency between the block coefficient and the length.
Databases for Sailing yachts Motor yachts Traditional craft Brokers Shipbuilders Design Handbooks Model Series Loa/Lwl Lwl Lwl/Bwl Bwl Bwl/Tc LWL/∇1/3 Tc ∇ Loa
Wetted surface area equations Hull form
coefficients
Wetted surface area: Length class
Boat type Average all boats NL Database
reacreational boats in NL
Van Oossanen and Van Oossanen (2006) report values for the midship coefficient CM for four different model hull types, see Table 1. Values for
the midship coefficients reported by Dewan are in line with this, but somewhat on the higher side. The values for CM from Colombo tend to
be on the lower side of the range, and are probably valid for a more specific type of motor boat.
Savitsky and Brown (1976) report extensive data covering the
geometric characteristics of 118 models, based on published results of resistance tests carried out for seven methodical series of transom-stern craft (planing hulls). Except for one series (Series 62), which was a hard chine hull form, all other series were round bilge hulls. The minimum value and maximum value for the block coefficient are 0.35 and 0.64 respectively, with an average value of 0.45. The values for the midship coefficient are calculated from the reported block coefficient and the prismatic coefficient; values range from 0.55-0.87 with an average value of 0.67. For the water plane coefficient (CW), values range from
0.73 up to 0.83 with an average of 0.77. The water plane coefficient for a hard chine hull fishing boat and a cruising tug (single chine hull) designed by Dix Yacht Design (2017) are 0.77 and 0.76 respectively. In addition to this information, the water plane area coefficient reported by Van Oossanen and Van Oossanen (2006) for the four model ships vary very little and are somewhat higher, see Table 1.
Table 1. Hull coefficients for motor yachts as reported in the literature CB =
block coefficient, CM = midship area coefficient, CW = water plane area
coefficient.
Reference Hull coefficients
CB CM CW
Dewan (2015) 0.45-0.48 0.75-0.78 Gaillarde et al. (2004) 0.22-0.59
Colombo (1908) 0.35-0.55 0.60-0.75 Van Oossanen and Van
Oossanen (2006) 0.35-0.55 0.57;0.65; 0.83;0.74 0.87;0.84; 0.84;0.80 Savitsky and Brown
(1976) 0.35-0.64 0.55-0.87 0.73-0.83
Dix Yacht Design (2017) 0.32;0.38 0.48;0.59 0.77;0.76 3.5.2 Hull design ratios
LOA/LWL
The overhang ratio is used to derive the length on the waterline. The ratio between the overall length and the length on the waterline (LOA/LWL) for
the four model ships presented in Van Oossanen and Van Oossanen (2006) ranges from 1.10 to 1.16. In addition, design data for 57 motor boats and yachts were collected in the current study. The overhang ratio ranged from 1.02 to 1.3, with an average value of 1.12. The data for the 57 boats are presented in Annex III.
LWL/BWL
The waterline length to beam ratio (LWL/BWL) as a function of the waterline
length is presented in Figure 3 in Van Oossanen and Van Oossanen (2006). These data were used to derive a logarithmic trend line, see Equation 10 and Figure 2.
𝐿𝐿WL
𝐵𝐵WL= 0.8827 × ln(𝐿𝐿WL) + 0.7941 (10)
Figure 2. Waterline length to beam ratio as a function of the length on the waterline. Data from Van Oossanen and Van Oossanen (2006).
BWL/T
Based on the design data of 27 motor boats in our database (Annex III), the values for the waterline beam to draught ratio (BWL/T) vary from 1.5
to 8.4. These data include three extreme values (1.54; 7.51; 8.4) which if left out, would lead to an average value of the waterline beam to draught ratio of 3.7. When including the extremes, the average value becomes 3.9. Based on these data, there seems to be no clear trend in relation to the length. The data presented by Gaillarde et al. (2004) show values in the range of 1.8-6.5 with the length ranging from 20-120 m. The authors state that for super or mega-yachts, the beam to draught ratio is around three. Van Oossanen and Van Oossanen (2006) report values in the range of 4.0-6.0 for the designs included in their database (n=19). From the collected information on the different model series, the beam to draught ratio also appears to vary substantially, ranging from 1.7 to 9.8: most commonly, values lie between 3 and 4 (Savitsky and Brown, 1976). A value of 4.0 was chosen. This choice was also based on the range for mainly Dutch made boats provided by Van Oossanen and Van Oossanen (2006), that indicates a slightly higher value and narrower range of the BWL/T –ratio compared to the data in our database.
y = 0,8827ln(x) + 0,7941 2,0 2,2 2,4 2,6 2,8 3,0 3,2 3,4 3,6 5 7 9 11 13 15 LWL /BWL LWL (m)
LWL/∇1/3
The length to displacement volume ratio increases with the waterline length to beam ratio as shown in Figure 4 in Van Oossanen and Van Oossanen (2006). The data in the figure were used to derive the relationship presented in Equation (11 and Figure 3. The average value of the length to displacement volume ratio is 4.5, which according to Van Oossanen and Van Oossanen can be considered low.
𝐿𝐿WL
∇13 = 2.12 ∙ ln 𝐿𝐿WL
𝐵𝐵WL+ 2.24 (11)
Figure 3. Length-displacement ratio as a function of length-beam ratio. 3.5.3 Discussion, values selected
The selected values for the design ratios and hull form coefficients are presented in Table 2. In addition to these data, Equation 10 and 11 are also needed to calculate the WSA. The reported values for the block coefficients CB are reasonably comparable, and there seems to be little or
no variation with length or the length to beam ratio. A value of 0.45 seems to be representative value based on the mid-range value of the range (0.35-0.55) presented by Van Oossanen and Van Oossanen (2006). Midship coefficients CM range from 0.55-0.87, with a mid-range value of
0.71 based on data for a large number of model ship hulls presented in Savitsky and Brown (1976). For the water plane coefficient CW a value of
0.77 seems typical based on the values provided by Savitsky and Brown. A somewhat higher value of 0.80 can be used based on more recent data on motor yacht characteristics provided by Van Oossanen and Van
Oossanen (2006), and on the higher range values provided by Savitsky and Brown (1976). For the overhang ratio, we used an average value of 1.12. The beam on the waterline was estimated using Equation 10. The draught was calculated from the fixed beam to draught ratio using an average value of 4.0 for this ratio. The displacement volume was determined by applying Equation 11 A typical value for the length to displacement volume ratio is 4.5. Finally, the value for the wetted surface
y = 2,1202ln(x) + 2,2422 3,6 3,8 4,0 4,2 4,4 4,6 4,8 5,0 5,2 2,0 2,2 2,4 2,6 2,8 3,0 3,2 3,4 3,6 LWL /∇ 1/ 3 LWL /BWL
coefficient (CS) was set at 2.8. Based on the typical values for CM and
B/T-ratio, the value for CS can be read from Annex I.
Table 2. Summary of selected values for the design ratios and form coefficients for motor yachts.
Variable Value CB 0.45 CM 0.71 CW 0.80 LOA/LWL 1.12 BWL/T 4.0 LWL/∇1/3 4.5 CS 2.8
3.5.4 Lateral area of the rudder and skeg
The WSA calculated from the selected relationships and dimensionless numbers refers to the canoe body only, thus excluding appendages such as the rudder and skeg. For motor boats, the rudder area can be
determined as a fraction of the lateral area of the hull. Molland and Turnock (2007) indicate that this should be about 3-4% for semi-displacement and planing craft, based on the actual lateral area of the immersed hull. Van Oossanen and Van Oossanen (2006) indicate that the rudder area should be about 5% of the lateral hull area, probably referring to the actual immersed lateral area of the hull instead of LWL·T.
In addition, Lewandowski (1993) refers to a recommended rudder area of 4% of the projected side area of the hull, which corresponds roughly with 3% of the more easily computed reference lateral area LWL·Td,
corresponding to a CLP of 0.75. The average lateral plane area coefficient
of the hull for six modern tug boats (Argyriadis, 1957) provides the same value of 0.75.
Another more convenient way to derive the rudder area is based on the relationship with the waterline length. Based on Figure 5.109 in Molland and Turnock (2007), this relationship can be expressed by Equation 12.
Rudder area =7.00 × 10⁻⁵∙ (𝐿𝐿WL)3− 2.20 × 10⁻³∙ (𝐿𝐿WL)2+ 5.23 × 10⁻²∙ 𝐿𝐿WL− 0.1673 (12) Alternatively, the rudder area can be related to the midship area AM,
which is calculated as AM = CM·BWL·TC. The rudder area should be at least
12% of AM (Schneekluth and Bertram, 1998). The rudder area can thus
be determined from the midship area, coefficient CM:
Rudder area = 0.12·CM·BWL·Tc.
The rudder areas derived by this method lie somewhere between the results obtained by the methods suggested by Lewandowski (1993) and Molland and Turnock (2007) and are therefore judged as a reasonable approximation.
d Lewandowski refers to the transom draught to compute the reference lateral area. It is assumed that the transom draught equals the draught of the canoe body of the hull, which is probably only true for planing boats.
Besides the lateral area of the rudder, the lateral area of centre line skeg also contributes to the total wetted surface area. The lateral area of the skeg has been determined from the lines plans of the four model motor yacht hulls provided by Van Oossanen and Van Oossanen (2006). The results are presented in Table 3.
Table 3. Lateral area of centre line skeg of the model motor yachts presented by Van Oossanen and Van Oossanen (2006).
Hull type Lateral area skeg Draught, T Percentage of reference lateral hull area Ratio to midship area Percentage of water plane area (m2) (%) (%) Hard chine 1.8 0.79 23 1.29 5.7 Hard chine, fast planing 0.5 0.75 7 0.32 1.6 Multi chine 2.0 0.51 39 1.27 6.3 Round chine 1.9 0.80 24 0.99 7
Following the approach suggested by Lewandowski, the lateral area of the skeg is expressed as a fraction of reference lateral area (LWL·T). All four
designs have a length on the waterline of 10 meters; the values for the draught are presented in Table 3. For the fast planing hard chine hull, the value for the lateral area of the skeg is much smaller than for the other hull types. A value of about 20-30 percent of reference lateral area seems reasonable for the lateral area of the skeg. Similar to suggestions for the rudder area made by Schneekluth and Bertram (1998), the skeg area is related to the midship area AM; results are presented in Table 3. A ratio of
1 (skeg area = midship area) seems to be a minimum for hull types other than hard chine fast planing hulls. There seems to be less variation when comparing the lateral skeg area to the water plane area. The calculated lateral area of the skeg based on the midship area and the reference lateral area of the hull provide similar results. The midship area is used as a representative value for the lateral skeg area.
3.6 Traditional ships (flat and round bottomed)
3.6.1 Hull form coefficients
The block coefficients for traditional flat bottom ships are calculated from the data from the certificates used for rating different types of traditional boats in sailboat racing. The data are available from the Dutch association ‘Rond- en Platbodem Klassenorganisatie’ (2016). Values for the block coefficient (based on the waterline) vary from 0.60 to 0.70 with an average value of 0.64 based on the data of 17 ships from 12 different types (Annex IV). There were no certificates available for very bulky ships like the tjalk, praam and poon. The block coefficient for a tjalk for instance is 0.80 (Jorissen, 1986). Block coefficients
reported by Moeyes and Kooijman (1975) are on the lower side of the range of values based on the certificate data. A notebook of the Universita degli studi di Trieste by Prof. Zotti (Zotti, 2000) mentions a typical value of 0.66 for the block coefficient CB of traditional ships. The
Table 4.
Typical midship sections and corresponding midship coefficients are provided by Ventura (2017), see Figure 4. Based on the hull plans provided by Moeyes and Kooijman (1975) some of which are shown in Figure 5, many traditional ships have a hull form corresponding with midship coefficient values in the range of 0.80-0.98 when comparing them to the forms presented in Figure 4.
Figure 4. Typical midship sections and corresponding CM value (Ventura, 2017).
tjalk Lemsteraak poon boeier
bol hoogaars grundel hengst Figure 5. Hull plans for traditional craft from Moeyes and Kooijman (1975).
Table 4. Hull form coefficients for traditional craft.
Reference Hull coefficients
CB CM
Zotti (2000) 0.66
Rond- en Platbodem Klassenorganisatie
(2016) 0.60-0.70
Moeyes and Kooijman (1975) 0.48-0.60 0.83*
Cotteleer (2016) > 0.90
Ventura (2017) & Moeyes and Kooijman
(1975) 0.80-0.98
Jorissen (1986) 0.80
*Calculated from the average block coefficient and prismatic coefficient (0.58-0.72) for flat bottom ships in Table I of Moeyes and Kooijman (1975).
Water plane area coefficients of some Dutch traditional craft are presented in Table 5. The water plane coefficient for the tjalk is from Jorissen (1986). The other values were derived from lines plans and by applying Simpson’s rule for estimating the surface area under a curve. The average of these values (0.83) is taken as a typical value for Dutch traditional craft.
Table 5. Water plane area coefficients for traditional craft from hull lines drawing.
Ship type Hull coefficient, CW
tjalk 0.94
visaak 0.83
boeier 0.81/0.81/0-87
schokker 0.78
Lemsteraak 0.76/0.75
3.6.2 Hull design ratios
LOA/LWL
The overhang ratio for traditional craft is based on the certificates of the 17 traditional craft considered (Annex IV). The average value is 1.3. Overhang ratios vary from 1.12 up to a value of 1.52.
Figure 6. Waterline length to beam ratio as a function of the length on the waterline for Dutch traditional ships.
LWL/BWL
The waterline length to beam ratios (LWL/BWL) as a function of the
waterline length presented in Figure 6, are also based on the data taken from the certificates of 17 Dutch traditional ships (Annex IV). There appears to be no clear trend or relationship with the length on the waterline, although it tends to be somewhat lower with smaller lengths. The average value of the waterline length to beam ratio for the 17 ships considered is 2.4. Moeyes and Kooijman (1975) provide a range from 2.2–4.5 for the waterline length to beam ratios. Although there is no clear trend, a power function was fitted to the data, resulting in Equation 13. 𝐿𝐿𝑊𝑊𝑊𝑊
𝐵𝐵𝑊𝑊𝑊𝑊= 2.08 ∙ 𝐿𝐿𝑊𝑊𝑊𝑊0.075 (13)
BWL/T
The beam to draught ratio (BWL/T) for the traditional craft in the
database varies from 4.7-10.1, with an average value of 7.1. Moeyes and Kooijman give a range of 4.5-6.5, from which the upper range value was chosen for the calculations in order to exclude the effect of the extremes on the average to some extent.
LWL/∇1/3
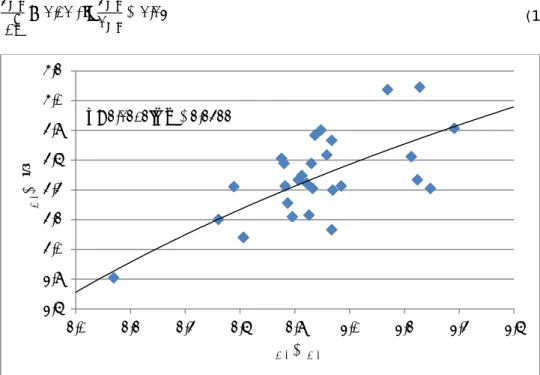
The slenderness or length to displacement volume ratios show little variation, ranging from 3.6 up to 5.3 with an average value of 4.0 based on the data of 17 traditional craft (Annex IV). The length to displacement volume ratio increases with the length to beam ratio as shown in Figure 7. A linear relationship was derived from the data excluding two outliers see
y = 2,0817x0,0747 1,5 1,7 1,9 2,1 2,3 2,5 2,7 2,9 0 2 4 6 8 10 12 LWL /BWL LWL (m)
Annex IV, resulting in Equation 14. This equation is used to calculate the displacement volume in order to finally determine the WSA.
𝐿𝐿WL
∇13 = 0.40 ∙ 𝐿𝐿WL
𝐵𝐵WL+ 2.91 (14)
Figure 7. Length to displacement volume ratio as a function of length to beam ratio for traditional craft.
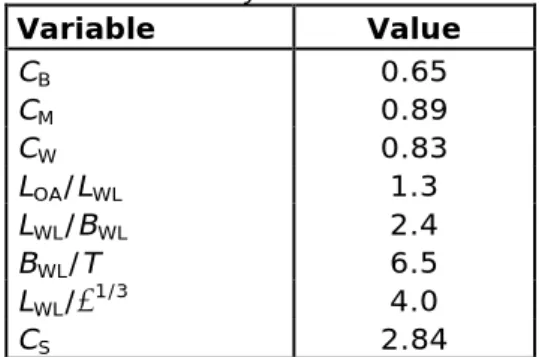
3.6.3 Selected values for hull form coefficients and hull design ratios
The selected values for the hull form coefficients and design ratios are presented in Table 6. For the block coefficient, a value of 0.65 seems appropriate and for the midship area coefficient, a value of 0.89 (midrangee value of range 0.80-0.98). For the water plane area
coefficient, the average of the values presented in Table 5 (0.83) is taken as a typical value for Dutch traditional craft. The typical value for the length to displacement volume ratio and the waterline length to beam ratio are presented in Table 6 for completeness. In order to estimate the WSA, Equation (13) and (14) were used instead of the fixed values. Furthermore, we used the average value of 1.3 for the overhang ratio. Finally, it is difficult to read the value for CS from the
contour plot in Annex I, based on the typical values for CM and B/T-ratio.
The value for the wetted surface coefficient (CS) was set at 2.84.
e The midrange value is calculated as the arithmetic mean of the lowest and highest value of a range or a data set. We use the midrange value when a data set is too small to calculate a well based average value.
y = 0,4003x + 2,9102 3,5 3,6 3,7 3,8 3,9 4,0 4,1 4,2 4,3 4,4 4,5 2,0 2,2 2,4 2,6 2,8 3,0 LWL /∇ 1/ 3 LWL/BWL
Table 6. Summary of the selected values for traditional craft. Variable Value CB 0.65 CM 0.89 CW 0.83 LOA/LWL 1.3 LWL/BWL 2.4 BWL/T 6.5 LWL/∇1/3 4.0 CS 2.84
3.6.4 Lateral area of the rudder, skeg and ‘loefbijter’
As for motor yachts, the WSA calculated from the selected relationships and dimensionless numbers refers to the canoe body only, thus
excluding appendages such as the rudder, centre line skeg, front skeg (‘loefbijter’ in Dutch) and leeboards. Traditional craft are commonly equipped with a centre line skeg and loefbijter, and these contribute significantly to the total WSA. Therefore, the rudder area has to be determined as well as the area of the skeg and loefbijter. Leeboards are assumed not to be treated with antifouling paint as they are infrequently submerged into the water.
Rudder
Rudder area as a fraction of the sail area
For sailing ships, the rudder (planform) area is usually estimated as a fraction of the effective sail area down-wind. The sail area can be estimated from the sail area-displacement ratio, which equates to
√𝑊𝑊𝑊𝑊 ∇
⁄
1/3.In which:
SA sail area in m2.
∇ displacement volume in m3.
For flat-bottomed craft, Moeyes and Kooijman (1975) provide values for this ratio in the range of 2.5-3.5. In the current study, we used a sail area-displacement ratio with a value of 3.2 based on statistics for the boats tested by Moeyes and Kooijman. Based on Larsson and Eliasson (2000), the average value of rudder area to sail area on modern cruiser/racers is 1.4%, with an upper limit of 2%.
Rudder area as a fraction of the lateral area
Molland and Turnock (2007) indicate the rudder area as fraction of the lateral area for sailing yachts, being 7-11%. In this case, the lateral area should include the area of appendages such as the keel and skeg From some arbitrarily chosen drawings in Moeyes and Kooijman, e.g. Figures 3 and 7, the rudder area was estimated and related to the reference lateral area (LWL x T) of the hull under the waterline.
Arudder/ALP,ref
Boeier 0.6 / (7.8·0.52) = 15% Lemsteraak 1.5 / (14.2·1.03) = 10% In which:
Arudder rudder area (m2).
ALP,ref reference lateral area of the hull under the water line (m2).
The upper value of the range provided by Molland and Turnock (2007) is reasonably in line with the results obtained for the boeier and
Lemsteraak. When including the lateral area of the skeg and loefbijter, for many traditional craft the lateral area coefficient is probably 0.95 or even higher. As a best guess, 12.5% of the reference lateral area is used for the calculation of the rudder planform or lateral area.
The results for the calculated rudder area based on the estimated sail area and the reference lateral area are quite similar, although in
general, the method based on the sail area results in about 25% higher values. The sail area is calculated from the sail area to displacement ratio, applying an average value of 1.4% for the rudder area, based on Larsson and Eliasson (2000). The values based on the estimated sail area were used..
Lateral area of skeg and ‘loefbijter’
No information or general rules were found to be able to determine the lateral area of skeg and loefbijter.
The lateral area coefficient, CLP of the hull of a Lemsteraak is about 0.65,
estimated from a hull plan. The lateral area of the skeg including the loefbijter is about 71% of the lateral area of the hull under the waterline (ALP,skeg/ALP,hull = 3.2/4.5 = 0.71).
Taking the reference lateral area of the hull (LWL·TC) as a basis, the
fraction of the lateral area of the skeg including the loefbijter is about 0.46:
ALP,skeg / (LWL·TC) = 3.2/6.9 = 0.46.
The reference lateral plane area of the hull for the Lemsteraak is 6.9 m: LWL·TC = 9.33 * 0.74 = 6.9 m2.
In which:
ALP,skeg lateral area of skeg+loefbijter.
ALP,hull lateral area of the hull under the water line.
LWL·TC reference lateral area of the hull.
The lateral area coefficient of the hull of a schokker determined from the lines plan of the ship is 0.79. The lateral area of the centre line skeg and loefbijter were also estimated from the lines plan. The lateral area of the skeg including the loefbijter was about 46% percent of the lateral area of the hull under the waterline (ALP,skeg/ALP,hull = 0.46). Taking the
A value of 40% of the reference lateral area (LWL·TC) was used to
estimate the lateral area of the centre line skeg and loefbijter for traditional craft.
4
Calculated wetted surface areas of recreational boats
4.1 Sailing yachts
In this section, we present the data and methodology for sailing yachts. The methodology differs from that applied to motor yachts and
traditional craft; instead of calculating the WSA using hull form
coefficients and design ratios, measured WSAs are used. For the sake of completeness, the collected information on form coefficients and design ratios for sailing yachts is presented in Annex II.
The 'Offshore Racing Council' (ORC) rating system calculates corrected racing times for sailing yachts in order to rate different boat types fairly against each other in any range of wind conditions and course types. The rating system is based on specific measured boat characteristics. The measurement data are registered on the ORC certificates which contain, amongst others, the length on the waterline while sailing, the displacement volume, and the WSA of the hull. A hull measurement is performed to create an offset (OFF) file describing the body plan of the hull together with appendages, by using an ORC-approved hull
measurement machine or any available measurement instrument. The certificates are stored in the ORC database available at
http://www.orc.org/index.asp.
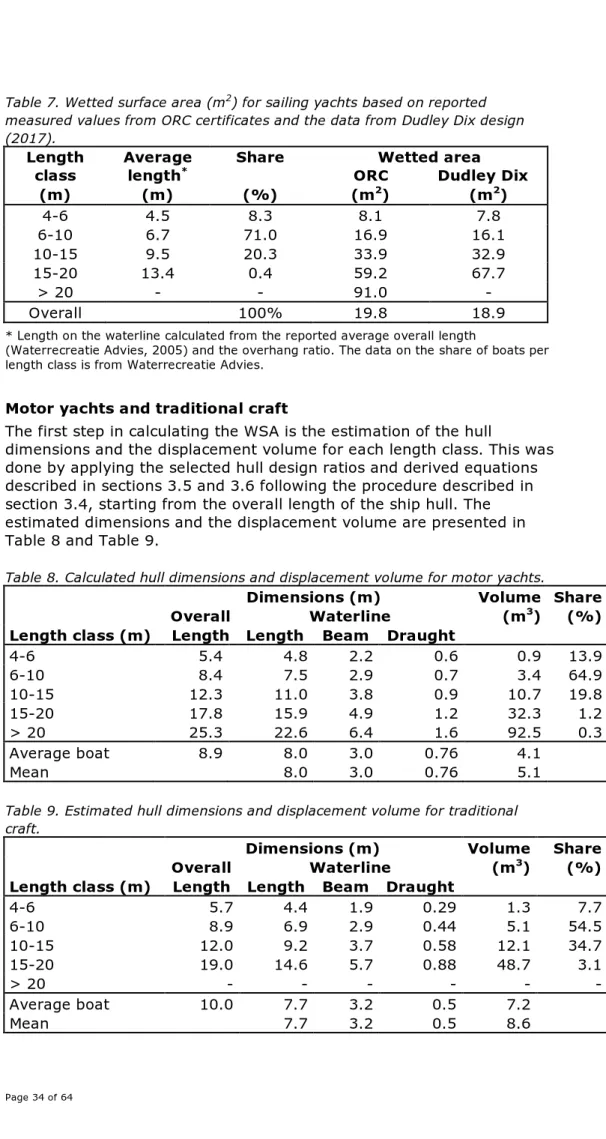
For the different length classes presented by Waterrecreatie Advies (2005), the WSA was determined based on the measured values recorded on the ORC certificates. For each length class, six different brands and types of sailing yachts were randomly selected from the ORC database, covering the whole range (two each on the lower and upper side of the range of the length class, and two in the middle). For each length class the average WSA was calculated based on these six values. It is important to note that the measured WSA of the hull according to ORC includes appendages like rudder and keel. Other appendages are measured separately and are not included on the ORC certificates. Table 7 shows the resulting average WSA per length class and the weighted average WSA over all boats based on the share of each length class in the total number of sailing yachts. The data for each length class are presented in Annex V.
In addition to the ORC certificate information, Dudley Dix yacht design provides the WSA for 39 of its models. These were grouped in the aggregated length classes and per class, the average WSA area was calculated. There is no information for ships in the length class above 20 meters. The calculated values are comparable with those based on the ORC certificates. The values based on Dudley Dix are less than 5% lower, except for the length class 15-20 meter, where Dudley Dix
outcomes are higher. This indicates that the values obtained through the ORC certificates are likely to be representative.
Table 7. Wetted surface area (m2) for sailing yachts based on reported
measured values from ORC certificates and the data from Dudley Dix design (2017).
Length
class Average length* Share ORC Wetted area Dudley Dix
(m) (m) (%) (m2) (m2) 4-6 4.5 8.3 8.1 7.8 6-10 6.7 71.0 16.9 16.1 10-15 9.5 20.3 33.9 32.9 15-20 13.4 0.4 59.2 67.7 > 20 - - 91.0 - Overall 100% 19.8 18.9
* Length on the waterline calculated from the reported average overall length
(Waterrecreatie Advies, 2005) and the overhang ratio. The data on the share of boats per length class is from Waterrecreatie Advies.
4.2 Motor yachts and traditional craft
The first step in calculating the WSA is the estimation of the hull
dimensions and the displacement volume for each length class. This was done by applying the selected hull design ratios and derived equations described in sections 3.5 and 3.6 following the procedure described in section 3.4, starting from the overall length of the ship hull. The estimated dimensions and the displacement volume are presented in Table 8 and Table 9.
Table 8. Calculated hull dimensions and displacement volume for motor yachts.
Dimensions (m) Volume Share
Overall Waterline (m3) (%)
Length class (m) Length Length Beam Draught
4-6 5.4 4.8 2.2 0.6 0.9 13.9 6-10 8.4 7.5 2.9 0.7 3.4 64.9 10-15 12.3 11.0 3.8 0.9 10.7 19.8 15-20 17.8 15.9 4.9 1.2 32.3 1.2 > 20 25.3 22.6 6.4 1.6 92.5 0.3 Average boat 8.9 8.0 3.0 0.76 4.1 Mean 8.0 3.0 0.76 5.1
Table 9. Estimated hull dimensions and displacement volume for traditional craft.
Dimensions (m) Volume Share
Overall Waterline (m3) (%)
Length class (m) Length Length Beam Draught
4-6 5.7 4.4 1.9 0.29 1.3 7.7 6-10 8.9 6.9 2.9 0.44 5.1 54.5 10-15 12.0 9.2 3.7 0.58 12.1 34.7 15-20 19.0 14.6 5.7 0.88 48.7 3.1 > 20 - - - - Average boat 10.0 7.7 3.2 0.5 7.2 Mean 7.7 3.2 0.5 8.6
From the information provided in Table 8 and Table 9, and the selected hull form coefficients, the WSA for motor yachts and traditional craft was calculated using the Holtrop-equations and the formulas provided by Taylor, Froude and the different Denny-Mumford equations (section 2.2). The resulting WSAs are presented in Table 10 andTable 11. The total WSA includes the rudder and skeg area for motor yachts and the rudder, skeg and ‘loefbijter’ area for traditional craft.
Table 10 andTable 11 contain the WSA results per length class.
Furthermore, results are presented for the average sized boat as well as the weighted average for each method. The weighted average values were calculated for each type of boat using the share of the number of boats in each length class in the total number of boats, taken from the marina survey for the Netherlands published by Waterrecreatie Advies (2005).
The WSAs per length class, based on the different formulas are comparable. Somewhat lower values are obtained by the calculations based on displacement volume. As discussed in Chapter 2, the results obtained by the Holtrop-Mennen equation that include the water plane area, are considered to provide the best estimate.
The difference between the WSA based on the (weighted) average boat dimensions and the weighted average of the WSA from each length class, is probably related to the non-linear characteristics of the applied equations used for the WSA estimation. The values based on the
weighted average of the wetted surface per length class are considered to be more realistic, as these better reflect the summed areas of all individual boats (the 'true' WSA value), while the other values are based on the average-sized boat as input.
Table 10. Calculated wetted surface area for motor yachts (m2), including the rudder and skeg area.
Formulas based on hull form coefficients Formulas based on displacement Length class
(m) Holtrop-Mennen Holtrop Mumford 1 Denny- Muragin Kirk Taylor Froude Mumford 2
Denny-4-6 11.8 11.7 11.3 11.0 12.1 10.4 10.2 9.9 6-10 23.7 23.5 22.7 22.1 24.3 21.5 20.8 20.4 10-15 43.9 43.6 42.0 40.9 45.1 41.1 39.3 38.7 15-20 81.5 80.7 78.0 75.9 83.8 78.4 74.8 73.7 > 20 148.7 146.8 142.1 138.3 152.9 147.0 139.6 138.0 Average boat 26.0 25.7 24.8 24.1 26.6 23.7 22.8 22.4 Weighted average 27.1 26.9 25.9 25.2 27.8 24.9 24.0 23.5
Table 11. Calculated wetted surface area for traditional craft (m2), including the rudder, skeg and loefbijter area.
Formulas based on hull form coefficients Formulas based on displacement Length class
(m) Holtrop-Mennen Holtrop Mumford 1 Denny- Muragin Kirk Taylor Froude Mumford 2
Denny-4-6 9.3 9.4 9.0 9.3 9.4 8.8 8.5 9.0 6-10 21.9 22.2 21.2 21.8 22.1 20.5 19.9 20.9 10-15 38.5 38.9 37.2 38.3 38.8 36.6 35.6 37.6 15-20 93.9 94.8 90.9 93.6 94.7 92.0 89.4 95.8 > 20 - - - - Average boat 27.5 27.8 26.6 27.4 27.7 25.9 25.2 26.5 Weighted average 28.9 29.2 28.0 28.8 29.2 27.4 26.6 28.1
4.3 Overall results
4.3.1 Freshwater, brackish water and saltwater combined
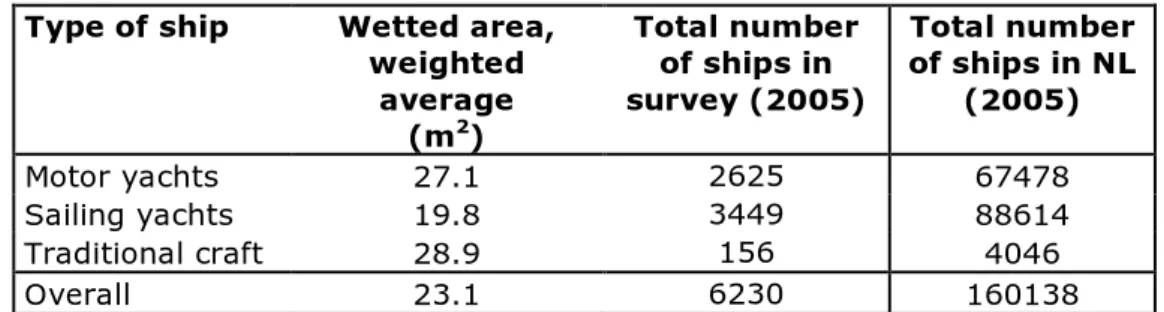
The average WSA for recreational boats at berth in the Netherlands is based on the share of the total number of boats for each boat type (sailing yachts, motor yachts and traditional sailing boats) and the calculated weighted average WSA for each type of boat. Results are presented in Table 12. The total number of boats in the Netherlands for the three types as estimated by Waterrecreatie Advies (2005) is also presented (last column).
Table 12. Wetted surface area and number of ships per type of recreational craft and overall values.
Type of ship Wetted area, weighted average (m2) Total number of ships in survey (2005) Total number of ships in NL (2005) Motor yachts 27.1 2625 67478 Sailing yachts 19.8 3449 88614 Traditional craft 28.9 156 4046 Overall 23.1 6230 160138
The overall weighted mean WSA value of 23.1 m2 corresponds to a
weighted mean overall boat length (LOA) of 8.9 m.
4.3.2 Freshwater, brackish water and saltwater separated
On our request, the original dataset on pleasure craft length distribution for the 40 Dutch marinas (Waterrecreatie Advies, 2005) was divided into marinas located in three water types by Waterrecreatie Advies
(Waterrecreatie Advies, 2017). The resulting data are presented in Annex VI (Table A.VI.1-3). Three marinas are located in salt water (sea): Jachthaven De Leeuwenbrug (Harlingen), Marina IJmuiden (IJmuiden) and Marina Den Oever (Den Oever). Three marinas are located in transitional or brackish water: WSV Haringvliet (Hellevoetsluis), Jachthaven Oostwatering (Veere) and WSV Yerseke (Yerseke). The 34 remaining marinas are considered freshwater or inland marinas. The same WSA calculations which led to the results in Table 12 can be applied to this split data set. This results in average, weighted values for the WSA of pleasure craft in marinas in the three different water types. The results are presented in Annex VI (Table A.VI.4) and summarised in Table 13. This split of data and recalculation of the WSA answers the question whether, based on the data sample available, a difference in boat size can be observed between e.g. boats moored in saltwater marinas compared to boats moored in freshwater marinas.
Table 13. Wetted surface area (m2) per boat type and per marina type and
mean weighted WSA values (m2) per marina type. Data based on Waterrecreatie
Advies, 2017.
Marina type
Boat type Saltwater Transitional water Freshwater
Motor yachts 33.8 23.0 27.2
Sailing yachts 27.3 19.8 18.5
Traditional craft 35.9 26.8 27.6
Overall (weighted) 28.9 21.0 22.7
Further data are presented in Table 14, which gives the overall boat length per water type as well as the relative share of motor yachts and sailing yachts (sailing yachts plus traditional craft) per water type. Table 14. Mean boat length per marina type and proportion of motor boats and sailing yachts (sum of sailing yachts and traditional craft) per marina type. Data based on Waterrecreatie Advies, 2017.
Marina type mean boat length (m) % motor yachts % sailing yachts
Salt water 10.6 21 79
Transitional water 9.1 35 65
Freshwater 8.7 46 54
5
Discussion and conclusion
Ship hull designs can vary significantly, but design parameters lie within certain constraints for different types of boats. For most of the
parameters of the formulas used to calculate the WSA average or typical values were used. Many equations are available for calculating the WSA. The highest values result from the most recently derived equations (Holtrop and Mennen 1982; Holtrop 1977). The results from the two equations are similar. The equations based on the displacement volume tend to be on the low side of the estimates. Several well-known
equations were used for a quantitative comparison. However, a statistical analysis and comparison with real, known data falls outside the scope of this study. The equation derived by Holtrop and Mennen (1982) is the most recent, has a wide applicability domain, and was therefore considered to provide the best estimate.
The equations used in this report only estimate the underwater area of the hull, excluding appendages such as the rudder and skeg (canoe body). The rudder and skeg contribute significantly to the area treated with antifouling paint and therefore they also have to be assessed. Our methodology also included the calculation of these areas.
Alternatively, for sailing yachts, measured data for the WSA is available, for example on the ORC certificates and from a yacht designer. These data show that within a length class, the WSA can vary by up to a factor of two. Although measured data are used, this approach is still an approximation based on a random selection of yachts from the ORC database. In the current study, we assumed that the selected sailing yachts are a representative sample of those present in Dutch marinas. Furthermore, there may be a tendency to an overrepresentation of racing yachts in the ORC-database. On the other hand, all kinds of sailing yachts of various designs, types and construction can partake in races. As the Dix Design information, which includes various designs of sailing yachts such as traditional yachts, racers and charters, provides quite similar results, we concluded that the sample of the ORC based surface areas is representative.
Based on collected information on ship lengths for different types of pleasure craft in the Netherlands, an average WSA for a recreational boat was estimated from typical ship hull form coefficients and design ratios. The methodology for calculating the WSA only requires the overall length of the ship hull as input variable and is applicable to three different types of boats: motor boats, sailing yachts and traditional (sailing) craft. Based on the average length per length class and the share of the number of boats within each length class in the total number of boats for the three types of boats, the overall weighted average WSA was calculated. The calculated value for the overall weighted average WSA is 23.1 m2. As this is based on the length class
distribution for different boat types in the Netherlands, this value can be used in the risk assessment for the national authorisation of antifouling products for recreational craft.