New method for the derivation of risk
limits for secondary poisoning
RIVM Letter report 2014-0097 E.M.J. Verbruggen
Page 2 of 47
Colophon
This investigation has been performed by order and for the account of Ministry for Infrastructure and the Environment, Safety and Risk Division
© RIVM 2014
Parts of this publication may be reproduced, provided acknowledgement is given to the 'National Institute for Public Health and the Environment', along with the title and year of publication.
This is a publication of:
National Institute for Public Health and the Environment
P.O. Box 1│3720 BA Bilthoven The Netherlands
www.rivm.nl/en E.M.J. Verbruggen
Contact:
Eric Verbruggen
Centre Safety of Substances and Products (VSP) eric.verbruggen@rivm.nl
Synopsis
New method for the derivation of risk limits for secondary poisoning
Chemicals can enter plants or animals through soil or water. This can be directly harmful to the organism, but also indirectly for the animals that eat this
organism. RIVM proposes a new method by which the effect of this 'secondary poisoning' for birds and mammals in the food chain can be accurately
determined. This is important to set more realistic risk limits for substances. The new method differs on some points from the methods already included in the current European directives. Firstly, the concentration to which the animal is exposed is calculated in a different way. With this method, it can be more accurately identified to which extent chemicals are toxic by accumulating in the food chain. It also reflects how sensitive "higher" organisms in the food chain, such as birds and mammals, are to a substance.
The difference is that the limits do no longer rely on the concentration of a substance in the food, but instead on the amount of the substance per unit of energy that an animal needs per day and consumes via the food. The premise is that some types of food are richer in energy than others. This fact has an influence on the amount of food that animals consume on a daily basis and thus on the extent to which a chemical substance in the food is taken up. By
involving this "uptake rate" of the food in the assessment, specific risk limits can be determined for different types of food.
In addition, a step is added to the food chain for soil to improve the protection of predators eating birds and mammals; this category of animals is lacking in the current guidelines. Finally, RIVM provides guidance how to calculate a concentration in water or soil from the risk limits for a substance in animals and plants (biota). The latter aspect responds to a demand from amongst other water managers.
Keywords:
secondary poisoning, environmental risk limits, dose, diet, caloric content, daily energy expenditure
Publiekssamenvatting
Nieuwe methode voor de afleiding van risicogrenzen voor doorvergiftiging
Chemische stoffen kunnen via bodem, lucht of water in planten of dieren terechtkomen. Dit kan direct schadelijk zijn voor het organisme, maar indirect ook voor de dieren die deze organismen eten. Het RIVM stelt een nieuwe methode voor om het effect van deze ‘doorvergiftiging’ op vogels en zoogdieren in de voedselketen nauwkeuriger te bepalen. Dit is van belang voor een betere onderbouwing van de risicogrenzen voor stoffen.
De nieuwe methode verschilt op een aantal punten van de methoden die
hiervoor in de huidige Europese richtlijnen zijn opgenomen. Ten eerste wordt de concentratie waar het dier aan blootstaat op een andere manier berekend. Met deze methode kan nauwkeuriger in kaart worden gebracht in welke mate chemische stoffen giftig zijn doordat ze in de voedselketen ophopen. Ook geeft het weer in welke mate ‘hogere’ organismen in die keten, zoals vogels en zoogdieren, gevoelig zijn voor een stof.
Het verschil is dat niet meer wordt uitgegaan van de concentratie van een stof in het voedsel, maar van de hoeveelheid van de stof per hoeveelheid energie die een dier per dag nodig heeft en via voedsel tot zich krijgt. Het uitgangspunt daarvan is dat sommige soorten voedsel energierijker zijn dan andere. Dat gegeven heeft invloed op de hoeveelheid die dieren dagelijks consumeren en dus ook op de mate waarin een chemische stof die in het voedsel zit wordt opgenomen. Door deze ‘opnamesnelheid’ van het voedsel in de beoordeling te betrekken, kunnen voor verschillende soorten voedsel specifieke risicogrenzen worden bepaald.
Daarnaast is aan de voedselketen voor bodem een stap toegevoegd om roofdieren die vogels en zoogdieren eten beter te beschermen; deze categorie dieren ontbreekt in de huidige richtlijnen. Ten slotte presenteert het RIVM een leidraad om uit de risicogrenzen van een stof in planten en dieren (biota), een concentratie in water of bodem te berekenen. Dit laatste aspect voorziet in een behoefte van onder meer waterbeheerders.
Trefwoorden:
doorvergiftiging, milieurisicogrenzen, dosis, dieet, calorische waarde, dagelijkse energiebehoefte
Contents
List of abbreviations—9
Summary—11
1
Introduction—13
2
Metric for expression of avian and mammalian toxicity studies—15
2.1
Concentration based approach—15
2.2
Dose based approach—15
2.3
Allometry—15
2.4
Body residues and importance of elimination rate—17
2.5
Influence of caloric content—20
2.6
Other sources of variation—20
2.7
Data treatment—21
2.8
Conversion of endpoints to concentrations in target food—23
3
Extrapolation of avian and mammalian data to chronic toxicity—25
4
Extrapolation to the protection level for a quality standard for secondary poisoning—27
5
Expression as a biota standard or an equivalent water or soil standard— 29
5.1
Description of relevant food chains—29
5.2
Characteristics of different food items—30
5.3
Selection of the critical food item—31
5.4
Derivation of biota standards—34
5.5
Conversion of biota standards into concentrations in water or soil—34
6
Example of the new method—39
7
Concluding remarks—43
List of abbreviations
BW Body Weight
DEE Daily Energy Expenditure
DFI Daily Food Intake
EC European Commission
ECHA European Chemicals Agency
EFSA European Food Safety Authority
ERL Environmental Risk Limit
EQS Environmental Quality Standard
HC5 Hazardous Concentration to 5% of the species, i.e. 5th percentile of
the SSD
HC50 Hazardous Concentration to 50% of the species, i.e. 50th percentile
of the SSD
MPC Maximum Permissible Concentration (Dutch, similar protection level as PNEC and long-term EQS)
PNECoral Predicted No Effect Concentration in food that should be protective
to mammalian and avian species
QSbiota, secpois Quality Standard expressed as the concentration in prey tissue,
which should protect predators from secondary poisoning SRC Serious Risk Concentration (Dutch, equal to median toxicity, i.e.
HC50)
SSD Species Sensitivity Distribution
TGD Technical Guidance Document
Summary
This report describes a new method for the derivation of environmental risk limits (ERLs), such as quality standards and predicted no effect concentrations, for the protection goal of secondary poisoning after prolonged exposure to substances. The presented method relates to the interpretation of avian and mammalian toxicity studies. The method is different from the current methods for secondary poisoning that follow either a diet based approach or a dose based approach. This new method uses the body weight of a species to estimate its daily energy expenditure under field conditions, based on well-established relationships for birds and mammals (allometric relationships).
The daily dose that is administered to the bird or mammal in a toxicity study is related to this daily energy expenditure. This results in a concentration of a toxicant in food that is normalized to the energy content of food, which can be easily applied to different food items by taking the tabulated energy contents of these food items. This makes the method suitable to apply to various types of food items from different types of food webs, making a differentiation between these different food items, which is considered an improvement in comparison with current European guidance documents.
Further, attention is paid on the extrapolation from subacute and subchronic exposure times to real chronic exposure. Subsequently the derivation of environmental risk limits from these chronic toxicity data is discussed, both on basis of assessment factors and statistical extrapolation. Also the protection levels in relation to different purposes of the environmental risk limits are discussed (e.g. generic environmental quality standard versus triggers for soil clean-up). The last step deals with the expression of the environmental risk limits as a biota standard or a standard expressed as soil or water concentration.
1
Introduction
In this report a new method for the derivation of the environmental risk limits for secondary poisoning is described. These risk limits should protect birds and mammals from poisoning due to foraging on prey items in the aquatic or
terrestrial food chain. The work was performed, because in the current guidance documents two methods co-exists and it is not clear which method should be preferred to derive long-term quality standards or predicted no-effect
concentrations (EC, 2011, ECHA, 2010, EFSA, 2009). This study therefore aims to provide guidance for deriving future environmental risk limits in regulatory frameworks such as quality standard setting and risk assessment. To make this derivation process transparent, it is divided in several steps, including data treatment of the toxicity studies and the extrapolation to risk limits in abiotic environmental compartments. In each of these steps described above the assessment factors for that specific topic are given. The overall assessment factor is the product of the assessment factors for the concentration basis, the study duration and the protection level, as described below.
In the first part, the choice for the metric how to express the avian and mammalian toxicity data is described. This part is most extensively described here, because it deviates from the methods that are used in the European regulatory frameworks (EC, 2011, ECHA, 2010, EFSA, 2009). In the European guidance document for derivation of EQS under the Water Framework Directive (WFD) (EC, 2011) two options are presented based on either diet concentration, which is used under REACH (ECHA, 2008), or on applied doses per mass of body weight, which is used for the evaluation of plant protection products (EFSA, 2009). In this guidance document none of these methods is proposed as best method. Both methods have their drawbacks, as will be shown below on the hand of body weight, body residues after exposure in relation to kinetics of uptake and elimination, energy expenditure, and energy content of diet.
Therefore, a new method is presented here that circumvents most of the issues observed for the other two methods. It distinguishes between different types of food items (e.g. fish, mussels, earthworms, plants, vertebrates) and as such, it is better equipped to apply for different compartments (e.g. soil and water) and different trophic levels (e.g. small bird or raptor). It is proposed that this method will be used in future derivation of environmental quality standards (EQS) for secondary poisoning as a result of long-term exposure and possibly for the derivation of predicted no effect concentrations (PNEC) in risk assessment. In the second part, the extrapolation from acute, subacute, and subchronic toxicity data for birds and mammals to a chronic no effect level is described. The correction for the limited duration of exposure in a toxicity study is already part of the assessment factors as incorporated in the current European guidance documents (EC, 2003, EC, 2011). Here, exposure duration is explicitly separated from the other factors that are accounted for in the assessment factors that are used for the derivation of the risk limits for secondary poisoning, because these factors are not applicable to the new method presented in this report. Further, some additional guidance on specific types of toxicity studies is presented. In the third part, the actual derivation of the risk limits from the selected data is presented. This incorporates the selection of data and the application of the proper assessment factor and, if relevant, statistical analysis. Further guidance
Page 14 of 47
is given on the application of statistical extrapolation by means of Species Sensitivity Distributions (SSD) and on the derivation of the protection level used in the context of soil clean-up, the Serious Risk Concentration (SRC) for the route of secondary poisoning.
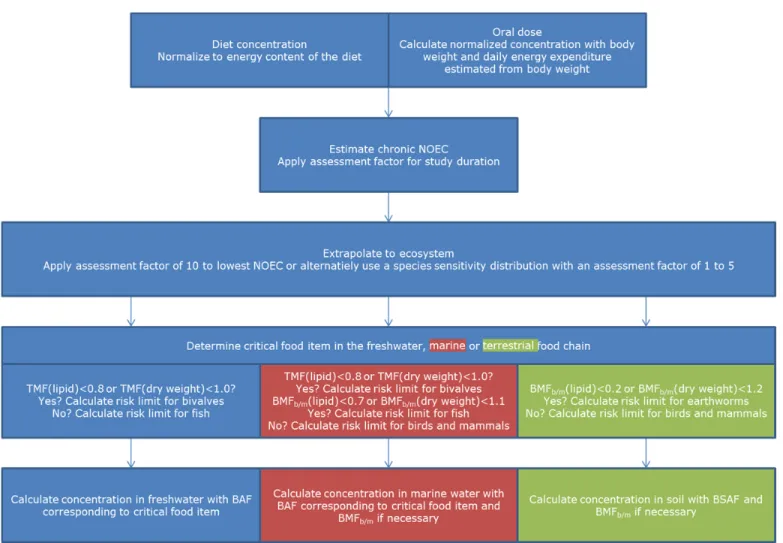
In the fourth part, the most relevant food item for each compartment is
selected. In accordance with the existing guidance documents this will usually be fish for the aquatic compartment, but for substances that are not biomagnified, other aquatic organisms, such as mussels and crustaceans may be more relevant. For the marine environment, another step in the food chain is
considered. This step considers the accumulation in marine mammals and birds that serve as prey for the marine top predators. For soil, only earthworms are considered in the existing guidance document, but it might also be appropriate to consider small terrestrial birds and mammals as prey. Guidance is presented for deriving the biota standards after selection of a suitable species or group of species. For risk limits expressed as water and soil concentrations, reliable data on bioaccumulation are necessary. The options for expressing the risk limits as biota standard or as equivalent standard in water or soil are presented.
2
Metric for expression of avian and mammalian toxicity
studies
2.1 Concentration based approach
The currently applied method for assessment of secondary poisoning of birds and mammals in the derivation of environmental risk limits is based on the technical guidance document (TGD) on risk assessment (EC, 2003). This method is based on the concentration of a substance in the diet of a bird or mammal. As such the diet concentration is a measure for the concentration in prey species in the field. The new European guidance document for derivation of EQS under the WFD (EC, 2011) presents an alternative approach for the assessment of
secondary poisoning to birds and mammals, based on the EFSA guidance document on birds and mammals (EFSA, 2009). This approach is proposed in order to avoid bias due to different food intake rates between lab and field (EC, 2002, EC, 2011).
Indeed, such differences exist and this is the rationale for the assessment factor of 30 that is applied in the diet based approach, instead of using only a factor of 10 for interspecies variation (EC, 2003). The additional factor of 3 corrects for the differences in caloric content between standard laboratory food on the one hand and prey species in the field on the other hand (EC, 2003), but makes no difference between various food items such as for example fish, mussels or earthworms. Besides that, the factor of 3 in itself is only an approximation and further justification for this value is not provided in the TGD. Although it might be in the right order of magnitude for the assessment of fish-eating predators if standard laboratory food is applied in the toxicity tests, this factor is superfluous if the laboratory animals themselves would be fed with fish.
2.2 Dose based approach
In the approach of the EFSA guidance document on birds and mammals (EFSA, 2009), toxicity is not expressed as concentration in the diet, but as a daily dose of the substance. The dose is expressed as the daily intake of a substance per mass of body weight. Of course the dose-based approach is more relevant if several toxicity studies for the same species are considered, because either the application route or the provided diet may differ between studies. Different diets result in a different daily food intake as the underlying assumptions are that an organism should meet its daily energy expenditure and the energy content varies from diet to diet. This makes the dose-based approach more reliable than the diet-based approach if different studies for the same species are considered. Since the daily energy expenditure is inversely correlated with the body weight of species, the daily dose will be lower for bigger animals at a given residue in the same food, due to the lower daily food intake (DEFRA, 2007, Crocker et al., 2002). This means that smaller species accumulate toxic substances faster with food leading to the highest acute effects, e.g. of birds after eating poisoned grains from a treated field. This is the reason why the smallest of the
representative mammals and birds are assumed to be the most vulnerable to a certain concentration in the diet, and they are therefore chosen as key indicator species in the dose-based approach (EFSA, 2009).
2.3 Allometry
Allometry correlates several biological parameters (Y) to the body weight (BW) of an organism.
Page 16 of 47 b BW a Y BW b a Y log log or log
The exponent b in these relationships can be described by different theories, following either the value 2/3 from the ‘surface law’ or 3/4 from Kleiber’s Law. In the risk assessment of secondary poisoning for birds and mammals,
allometric relationships play an important role, e.g. the ratio between daily food intake (DFI) and body weight. Some of these aspects that are important in the context of this study are addressed here.
2.3.1 Daily energy expenditure
For both birds and mammals there appears to be very strong correlation
between the daily energy expenditure (DEE) under field conditions and the body weight of the species. This allometric relationship is described by the following formula (DEFRA, 2007, Crocker et al., 2002):
b BW a DEE BW b a
DEE [kJ/d]log log [g]or log
For all bird species combined, the intercept of the linear regression log a is 1.019 and the slope b 0.6705. Data are also given for the subsets of desert birds, hummingbirds, terrestrial non-passerine birds, terrestrial passerine birds and seabirds. For all 115 mammalian species, the intercept log a is 0.7037 and the slope b 0.7188. Data are also given for the subsets of non-eutherians, all eutherians, desert eutherians, marine eutherians and other eutherians. It is recommended to use the equations for passerine birds and other (non-desert, non-marine) eutherians (DEFRA, 2007). Of course, this should only be done if the species belongs to one of these two groups.
The meaning of these correlations is that the dietary energy consumption relative to the body weight is higher for smaller species. Although such a trend between body weight and daily energy expenditure would be plausible between individuals within the same species, such a trend is not as straightforward as between different species (DEFRA, 2007, Crocker et al., 2002), and is sometimes not observed at all (DEFRA, 2007).
2.3.2 Xenobiotic Clearance
Not only the food uptake but also the clearance is dependent on the body weight. In general, bigger mammals and birds have lower elimination rates (e.g. Hendriks et al., 2001, Hu et al., 2001). In a study considering data for 115 substances with data for at least three species (total data set includes 16 mammalian and 2 bird species), the clearance rate appeared to be dependent of the body weight in the following manner (Hu et al., 2001):
b BW a C BW b a
CL[ml/min ]log log [kg] or L log
For 24 substances the relationship was insignificant, often due to the limited number of data. Mean and standard deviation for b values of the remaining 91 substances were 0.74 ± 0.16, with a broad range varying from 0.29 to 1.2. Statistics showed that the majority of the individual b values was not significantly different from either 0.75 or 0.67. Monte Carlo simulation demonstrated that the observed range of b values could still be the result of modest amounts of random error (20% or 30% coefficient of variation), thus supporting the theory of a general value for b. When all data were normalized to the same value for a, the individual 460 values for these 91 substances resulted in a b value of 0.74, with a 99% confidence interval of 0.71 to 0.76. The b
values for subgroups were 0.78 for proteins, 0.65 for xenobiotics that were eliminated mainly by renal excretion, 0.75 for xenobiotics that were eliminated mainly by extensive metabolism and 0.76 for xenobiotics that were eliminated by both renal excretion and nonrenal metabolism (Hu et al., 2001). Besides that it is interesting to note that the substances that were analysed cover a wide range of polarity from very hydrophilic to very hydrophobic. This did not seem to have any influence on the allometric relationship.
Essentially the same value of -0.25 (0.75 if not normalised for the mass of the species) has been used to account for differences in species weight in a modelling approach for bioaccumulation Hendriks (Hendriks et al., 2001). In essence, the effect of a higher xenobiotic uptake due to a higher food intake rate is thus cancelled out by a higher xenobiotic clearance.
2.3.3 Toxicity
The correlation between acute toxic dose and body weight is addressed in the guidance documents for risk assessment for birds and mammals (EFSA, 2009). It appears that there is a dependence of the acute toxic dose with weight for birds only, small birds being more susceptible than large birds.
b BW a LD BW b a LD50[mg/kg ]log log [kg] or 50 log BW
This effect was observed for birds with a scaling factor b of 1.15 (Mineau et al., 1996), 1.19 (Sample et al., 1999), or 1.24 (Mineau et al., 2001), but not for mammals for which the scaling factor was 0.94 (Sample et al., 1999). Only 11% of the 136 substances tested with birds had a scaling factor that was
significantly higher than 1, while 2.1% of the substances had a scaling factor significantly lower than 1. For mammals, 7.4% of the 90 substances had a b value significantly higher than 1 and 14% significantly lower than 1 (Sample et al., 1999). In a more recent study 8.5% of the 130 substances had a scaling factor significantly above 1, and 2.3% significantly below 1. Acetylcholine esterase inhibitors are strongly overrepresented, but this trend of a scaling factor higher than 1 is observed for both acetylcholine esterase inhibitors and other substances (Mineau et al., 2001). However, all the data sets only comprise acute toxicity data. It is suggested that small birds are more sensitive to the stress of acute testing, especially the reduced food intake, but this effect would not necessarily translate to chronic effects. Another possible explanation is the genetic differences between small birds and large birds, the small birds being mainly passerines (Luttik et al., 2005, Mineau et al., 2001). In this study, relationships between acute toxicity and body weight are considered not relevant for the long-term chronic toxicity for these reasons.
2.4 Body residues and importance of elimination rate
In toxicology, the internal concentration in an organisms’ body is often
considered as a very suitable metric for dose-response relationships. Previously the internal concentration was referred to as body residue, now the approach of using internal concentration is usually called target residue approach (Meador et al., 2011). Although in ecotoxicology much research on this topic has been focussed on the aquatic environment, the approach is equally applicable to mammals and other organisms, with internal effect concentrations often in the same order of magnitude as for aquatic species (McElroy et al., 2011, McCarty et al., 2011). Toxic effects are a result of the organisms’ internal concentration, through a combination of toxicokinetics and toxicodynamics. Toxicokinetics form the link between exposure and the internal concentration through a combination
Page 18 of 47
of adsorption, distribution, metabolism, and elimination (ADME) (McCarty et al., 2011).
Upon acute exposure, the role of elimination will be limited and differences between species will be caused by a faster food intake rate (see 2.3.1), leading to faster rise of the substance concentration in the organism’s body of smaller species (body residue, see Figure 1). Thus, for acute poisoning the dose based approach to select small indicator species on basis of the highest food intake rate seems most suitable, moreover because small bird species not only have the highest food intake rates but also the lowest acute toxic doses (see section 2.3.3).
Figure 1: Difference in relative accumulation in two hypothetical species with different sizes between short-term exposure (e.g. up to 5 days) and long-term exposure (e.g. more than 90% of steady-state concentration attained), as represented by the two boxes. Upon short-term exposure the smaller species will accumulate more due to the higher daily food intake. In bigger species the steady-state concentration could be higher due to biomagnification.
However, for long-term exposure, which is relevant for generic environmental risk limits, the use of the dose as metric might be less appropriate. The
assumption that the smallest species are the most vulnerable is counter intuitive with the observation from field studies on accumulation of biomagnifying
substances that the highest concentrations are often reached in species at the top of the food chain, which are generally the bigger species, (e.g. Kelly et al., 2007). The highest body burdens are thus certainly not necessarily attained in the smallest species. The dose-based approach needs reconsideration for the purpose of long-term toxicity assessments, by examining how the body residue is affected by the processes that are described by the allometric relationships discussed above. Besides lower food intake rates, in general, bigger mammals and birds have lower elimination rates as well (compare section 2.3.2 with 2.3.1), which could explain the equal or even higher body residues in bigger species, even despite the fact that the ingested dose is lower (Figure 1). When a lower daily food intake per mass of body weight is cancelled out by an equally lower elimination rate, accumulation will predominantly be driven by partitioning. In such a case, body burdens that are appropriately normalized, usually to lipid content, are similar over the entire food chain, from very small to bigger organisms, provided that no obvious differences in metabolism of the substance occur between different groups of species. As a consequence, the
In
te
rnal c
o
n
cen
tr
at
ion
(b
od
y
r
e
s
id
u
e
)
ratio of the concentrations in prey and predator will be constant, as will be observed for many substances (e.g. Kelly et al., 2007).
A constant ratio of the concentration in prey and predator will also be observed if biomagnification occurs and is a constant factor over all trophic levels, usually referred to as trophic magnification factor (e.g. Borgå et al., 2012).
Biomagnification will occur for substances that are eliminated slowly and are not metabolized. For substances with a high octanol-water partition coefficient for water respiring organisms or a high octanol-air partition coefficient for air breathing organisms, such as birds and mammals, overall elimination processes become relatively low compared to dietary uptake (e.g. Kelly et al., 2007). Because homeotherms such as mammals and birds have higher energy requirements and resulting food intake rates than poikilotherms such as fish, mammals and birds are likely to have higher biomagnification factors, if they are not able to metabolize the substance (e.g. Borgå et al., 2012). Such an effect can only occur, because the elimination rates for birds and mammals are comparable to that for aquatic organisms of similar size (Fisk et al., 2001). A possible explanation for equal or possibly even lower elimination rates for birds and mammals despite the higher metabolism compared to aquatic organisms, is the direct respiratory exchange with seawater for fish and other aquatic
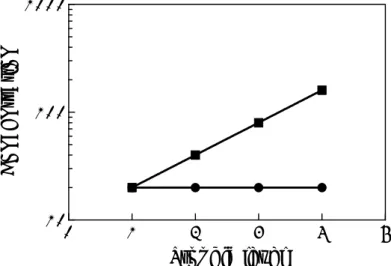
organisms, while this is absent for birds and mammals (Hop et al., 2002). Graphically, both cases of presence and absence of biomagnification are presented in Figure 2, in a way as it is usually done in trophic magnification studies, i.e. by a linear regression between the logarithm of the concentration and the trophic level (e.g. Borgå et al., 2012).
Figure 2: Trophic magnification of two imaginary substances. For the
biomagnifying substance, the ratio of prey and predator concentration is 2 for all trophic levels of the food chain, for the substance that will not biomagnify, the concentrations are equal. Thus in both cases the ratio between prey and predator is constant over the entire trophic chain.
For acute toxicity, which is often addressed in the risk assessment of pesticides, the dose might indeed be a suitable metric for toxicity: it can be assumed that a single or a few doses in a short period of time cause an immediate increase in the organisms’ concentration (body residue) of the substance proportional to the dose administered. However, for long-term exposure this proportionality might break down because of other processes such as elimination. In the standard dose based approach according to EFSA, differences in elimination rate between
Trophic level
Co
n
ce
n
tr
a
tio
n
0
1
2
3
4
5
10
100
1000
Page 20 of 47
species are not covered. More likely, the ratio between a species and its food is constant over the entire food chain, which would favour the dietary approach.
2.5 Influence of caloric content
From the above, it can be concluded that the concentration rather than the dose will determine the final body burden in organisms after long-term exposure, a phenomenon that is commonly observed in steady-state situations. In standard assessments (those based on standard laboratory organisms fed with common fodder), the dietary concentration based approach might therefore be preferred over the dose-based approach to derive environmental risk limits for chronic exposure.
However, the most prominent weakness of the concentration based approach is the fact it does not take into account the differences in caloric content of the food provided, which may not only vary between different test species receiving different diets, but also between different diets, given to the same species in different studies. This is especially the case if the studies are performed with other species than standard laboratory animals (such as quail, chicken, rat, mouse or rabbit). Such situations will exist for older well-studied historic substances for which toxicity data for more than 10 species of both birds and mammals might be available, accompanied with an equal diversity in diets. In such cases, a value expressed in mg/kg diet is not very informative, if it is not exactly stated what diet is meant. Diet concentrations expressed on a mass food basis are a source of variability and therefore less useful. The standard factor of 3 that is used in the method presented in the TGD (EC, 2003) does not take such variation into consideration. Besides that, the factor of 3 is a reasonable approximation from laboratory fodder to fish, because the difference in caloric content between laboratory fodder and fish is approximately a factor 2.8 (Smit, 2005, EFSA, 2009). However, this does not hold true for mussels or earthworms for which this factor of 3 is used as well in the TGD (EC, 2003), because these prey items have lower caloric contents (Smit, 2005, EFSA, 2009).
Further, it can be reasoned that if food digestion is effective, as is the case for birds and mammals, the uptake efficiency of the substance will be high. The amount taken up will be almost entirely be determined by the mass of substance contained in the food consumed and is independent of the fugacity and thus of lipid the content of the food (supporting information to Kelly et al., 2007). Lipid content of the food will thus not have a major influence on the bird or mammal directly, except from the fact that it determines the caloric content of the food together with for example the lipid content, proteins and carbohydrates.
2.6 Other sources of variation
In the report on secondary poisoning by Jongbloed et al. (1994), a correction for caloric content is made, but also other factors are described that should be taken into account as well. First, there is the difference in metabolic rate between caged laboratory animals and birds and mammals in the field. The metabolic rate of field organisms is a factor of 2.5 higher as compared to caged animals. For more extreme energy demanding periods, the sustainable
metabolic rate in field animals is even a factor of 4 higher. Due to the higher energy demand, animals will eat more and consequently, are exposed to higher doses.
However, rates of biotransformation and excretion may also be accelerated by increases in metabolic rate. This may counteract the higher uptake. If body residues are indeed assumed to be driven by partitioning, an enhanced metabolic rate in the field (i.e. due to faster kinetics) will influence the time to reach steady-state, but not the final body residue. It should be noted that in the
new approach described in this report the daily energy expenditure is used, which is already based on field metabolic rates (Crocker et al., 2002) and therefore this correction for the field situation is not applicable to the new approach.
A second correction, made by Jongbloed et al. (1994), is for the differences in the assimilation efficiency of different food sources between the laboratory and the field. A lower assimilation efficiency of food in the field would again require a higher amount of food to be consumed for an organism to meet its daily energy expenditure. This would result in a higher intake rate of chemical substances, and possibly higher steady-state concentrations, provided that the uptake of these substances from the different food sources is the same. Jongbloed et al. have also looked at the differences between the assimilation efficiency of substances, but concluded that there were too few data to draw conclusions. Hendriks et al. (2001) constructed a model in which assimilation efficiencies for substances do not exceed those for food and fat. They state that this is usually confirmed empirically, and can be explained from the fact that substances cannot move from lipids enclosed in non-digestible food particles to the intestinal wall during their residence time in the gut. A lower assimilation efficiency of food is thus accompanied by an at least equally lower assimilation efficiency of substances from food. Because these two processes cancel out each other, a higher food intake rate due to the reduced assimilation efficiency of food in the field situation will not result in a higher uptake of substances. A correction factor for assimilation efficiency thus seems superfluous as well. Besides that it should be noted that the daily energy expenditure in free-living animals is usually measured with the Doubly-Labelled Water (DLW) method, which is performed by injecting the animal with isotopically labelled water, thus independent of the assimilation efficiency (Crocker et al., 2002).
2.7 Data treatment
From the above, it follows that the only necessary correction is for differences in caloric content between the dietary items in the field and the diets provided in the laboratory studies. It is therefore most appropriate to express the endpoints of dietary toxicity tests on the basis of caloric content of the food instead of its fresh weight.
If the endpoint of a toxicity test is expressed as a daily dose, this could be expressed as a diet concentration normalized to caloric content. For both birds and mammals, the daily energy expenditure (DEE; kJ/d) under field conditions is strongly correlated with the body weight (BW; kg) (Crocker et al., 2002). For animals in a toxicity study, the body weight is mostly known and the daily energy expenditure for birds and mammals (under field conditions) can be estimated accordingly on the basis of these weight data (Crocker et al., 2002). The diet concentration on an energy basis (mg/kJ) can then be calculated as:
DEE
BW
dose
[mg/kJ]
normalized energy
C
The dose in this equation is a toxicological endpoint such as the NOAEL, LOAEL, LD50 or similar, expressed as daily dose in mg/kgbw/d. The DEE can be
considered as the energy a bird or mammal must extract from the food under field conditions. With low assimilation efficiency the amount of food consumed will be higher, but this will also lower the effective dose of the chemical taken up by the organism.
Page 22 of 47
If only diet concentrations are given and no information on food consumption is available, a dose cannot be calculated. In such a case, dietary concentrations could be normalized to the energy and moisture content of the specific diet from the study, if known:
dw diet, dw diet diet dw diet, fw diet normalized energy
content
energy
]
[mg/kg
)
content
moisture
(1
content
energy
]
[mg/kg
[mg/kJ]
C
C
C
The diet concentration (Cdiet) here is a toxicological endpoint, such as the
NOAEC, LOAEC, LC50 or similar, expressed in mg/kgfw/dw. The energy content is
expressed in kJ/kgdw, the moisture content is the amount of water as fraction of
the total diet fresh weight. Energy content values for different types of diets are tabulated in literature, including fodder that is often used in laboratory studies (Smit, 2005, EFSA, 2009). Of course, if a specific diet with known caloric content is provided, this value should be used instead of the default values.
Which calculation should be carried out is dependent on the information available. If a very complex or undefined diet is used, the energy content and moisture content might be unknown. In such a case, the method to use the dose and daily energy expenditure may be more useful. If only diet concentrations are given and no information on food consumption is available, a dose cannot be calculated, and the method to normalize the diet to energy content could be used then.
The recalculation of the dose into a caloric based diet concentration uses the daily energy expenditure under field conditions instead of the metabolic rate under laboratory conditions. The metabolic rate under laboratory conditions might be lower due to a limited activity of caged laboratory animals. If higher metabolic rate in the field would only act on the food intake and not on the body burden (see section 2.6), this effect would overestimate the toxicity in the field situation: the dose is divided by a daily energy expenditure which is too high for laboratory animals, leading to low energy normalized diet concentrations. This estimation using body weight and daily energy expenditure should thus be regarded as a conservative estimate.
If a higher metabolic rate in the field situation would also lead to higher body burdens of the contaminant due to higher food intake compared to the laboratory, omitting a correction for metabolic rate would underestimate the toxicity in the field situation estimated from diet concentrations: equal diet concentrations would lead to higher body residues in the field compared to the laboratory situation. Therefore, the use of normalized diet concentrations might not be regarded as a conservative estimate.
A preliminary comparison shows that the two ways of calculating a concentration on the basis of energy content, yield similar results (see also section 0). This suggests that animals in the laboratory studies are provided with an amount of diet that matches with the estimated daily energy expenditure under field conditions rather well (see also section 2.6), and further that indeed the higher metabolic rate does not immediately lead to higher body residues.
If data for both methods of calculations are available, it might be considered to perform both and use the most conservative result until more knowledge is available (see also section 0).
2.8 Conversion of endpoints to concentrations in target food
Risk limits for secondary poisoning can be expressed as concentrations in water or soil that should protect birds or mammals when eating fish, mussels,
earthworms etc. Depending on the environmental compartment and route considered, the energy normalized endpoints of the ecotoxicity tests should be converted into safe concentrations in that particular prey, which in turn can be converted to concentrations in water or soil. In doing so, it should be
investigated which of the food items is most critical for the compartment of interest (see section 5.5). With the energy content of a specific type of food (fish, mussels, earthworms, etc.) the concentration in that food can be calculated from the energy normalised diet concentration (in mg/kJ):
fw item, food normalized energy item food dw item, food normalized energy ww item food content energy [mg/kJ] ) content moisture (1 content energy [mg/kJ] ] [mg/kg C C C
With this equation specific limit values for each type of food can be calculated. Consequently, this method provides a very flexible way of selecting the most critical route. If for example, aquatic vegetation appears to have much higher BAFs than fish or mussels, the energy content and moisture content for aquatic vegetation can be used instead of those for fish and mussels. In that manner, critical values can be derived for many types of diet that might be consumed by birds and mammals. Further, in the former assessment of secondary poisoning (EC, 2003, EC, 2011) default species specific values for daily food intake per mass of body weight were needed to convert dose based values into diet based values. These factors do not need to be applied anymore, because they are incorporated in the estimation of the daily energy expenditure, which yields more robust results due to the strong linear correlation.
Another advantage of the method is that the additional assessment factor of 3 that is used in the diet based approach (see section 2.1) is now superfluous, because differences in caloric content between the laboratory tests and the field are accounted for via the energy content of the food. With the tabulated values on caloric content for commercial fodder, fish, mussels and earthworms (Smit, 2005, EFSA, 2009), this default factor of 3 is reasonable for fish (factor 2.8) but not protective for earthworms (factor 5.2) and bivalves (factor 9.8), which a have a much lower caloric content based on fresh weight.
In the European guidance document (EC, 2011) both the diet-based approach as well as the dose-based approach are described. These methods are not further discussed in this report, and it is proposed that the approach described here based on caloric content of the food items should replace the approaches in the TGD on EQS derivation (EC, 2011). As discussed above, the approach based on diet concentrations uses a default factor of 3 to take account of the differences in caloric content between laboratory fodder and field diets (Table 1). In the energy normalized diet-approach described in this report as well as the dose-based approach this is implicitly covered and an additional assessment factor is not necessary.
Page 24 of 47
Table 1: Assessment factors to be applied to account for differences in caloric content between laboratory and field situations.
Reason for assessment factor
Method used Assessment
factor
Applicable to
Differences in food intake between laboratory and field
Caloric content based diet concentration
1 Dose and
diet
Dose based 1 Dose
3
Extrapolation of avian and mammalian data to chronic
toxicity
Many studies performed with birds or mammals are not full chronic studies. To be able to use all mammalian and avian toxicity data, assessment factors are used for subchronic, subacute, and acute toxicity studies in regulatory frameworks. As such, no clear distinction is made between acute and chronic toxicity data as in the case of direct toxicity for aquatic, benthic and terrestrial species. As stated in the European guidance (EC, 2011), the use of acute toxicity studies is however not encouraged. The assessment factors that should be applied to a mammalian or avian NOEC or NOEL to account for a limited exposure time instead of a full chronic study are presented in Table 2. The presented factors are those that are used in current European guidance documents (EC, 2011, ECHA, 2010) on top of the factor of 3 that is used to account for the differences in caloric content (section 2.5).
Table 2: Assessment factors to be applied to account for limited exposure time in the toxicity studies compared to assumed life-time exposure in the field. Reason for
assessment factor
Specific case Assessment factor Applicable to
Study duration Chronic study 1 Bird, mammal
Subchronic study 3 90-d study,
mammal
Subacute study 10 28-d study,
mammal
Acute study 100 LC50/LD50, bird
A type of study that is not covered in the table are studies in which mammals, (e.g. rats, mice or rabbits) are exposed during ten days or more in the gestation period. Although involving short-term exposure, an assessment factor of 3 is used because the compound is administered during a critical phase in embryonic development.
In the selection of the final assessment factor, consideration must be given to all available data for the same species to reflect all endpoints and test durations of the available studies (see also section 4).
4
Extrapolation to the protection level for a quality standard
for secondary poisoning
For the derivation of the environmental risk limits one value is selected per species. This selection is made after the application of the assessment factor for the study duration in the former step (see section 3). There may be more than one chronic study for the same species. Under these circumstances, the assessor should select the more sensitive study. Data from two different toxicological studies should only be merged if they have been conducted according to a similar guideline, used the same species and test conditions and reported the same key endpoints. It may be that a test with shorter exposure duration reports a more sensitive endpoint than the test with longest exposure duration. In such a case, the assessment factor corresponding to the longest exposure time might be applied to the most sensitive endpoint.
If the environmental risk limits are derived by means of an assessment factor, the lowest value for the set of species is selected for the derivation of the QSbiota, secpois, PNECoral and the Dutch maximum permissible concentration (MPC),
which has an equivalent protection level to the former two. This means that first the true chronic no-effect levels are calculated for each species, after which the lowest value of all species is selected as basis for these risk limits. The same data set with entries for all tested species is also used to calculate the geometric mean of selected values, which forms the basis for the serious risk concentration (SRC). This SRC value is a protection level used for Intervention Values in soil policy, which is equivalent to the HC50 in a species sensitivity distribution (SSD). The same data for all different species is also used if the HC5 of the SSD is used as basis for the EQSbiota, secpois, PNECoral or MPC.
If there are not many species available, the MPC will be derived by applying an assessment factor of 10 to the lowest value selected (Table 3). It is noteworthy that even with data for only one bird or mammal, QSbiota, secpois, PNECoral and MPC
are derived from this single study with an assessment factor of only 10. For comparison, the assessment factor to be applied for direct ecotoxicity to aquatic, terrestrial or benthic species is 100 if there is only one chronic NOEC available. In those cases, at least three species are necessary to lower the assessment factor to 10.
To apply the SSD, data should be available for a minimum of 10 species, including both birds and mammals with wildlife-relevant predatory species of both birds and mammals. An assessment factor of 1 to 5 should then be applied to account for remaining uncertainty.
Table 3: Assessment factors to extrapolate from laboratory toxicity studies to different protection levels.
Reason for assessment factor
Specific case Assessment
factor
Applicable to
Protection level SRC level 1 Geometric mean
MPC level
(QSbiota, secpois, PNECoral)
10 Lowest value
5
Expression as a biota standard or an equivalent water or soil
standard
5.1 Description of relevant food chains
5.1.1 Freshwater food chain
The routes for secondary poisoning that are included in the guidance document for EQS derivation (EC, 2011) are those originating from the TGD (EC, 2003) and these are also included in the REACH guidance (ECHA, 2010).
The food chain in freshwater ecosystems is defined as water → aquatic organisms → fish → fish-eating predator.
The predators are mostly birds or mammals, although feeding studies for large predatory fish may be used if these are available (EC, 2011). If the aquatic organisms are considered to be the base of the food chain, which is formed by the primary produces, the fish in the simplified food chain are only primary consumers, fish that only eat plant material and occupy trophic level 2. These are usually not the fish that serve as food for avian and mammalian predators or humans, which rather belong to trophic level 3.5 to 4, which is visualized in the following example food chain:
water → algae → daphnids → small fish → predatory fish → fish-eating predator As a reasonable estimate for substances that accumulate (biomagnify)
throughout the food chain, fish that occupy trophic level 4 are selected as basis for the biota standard. This approach was followed for hexachlorobenzene (Moermond et al., 2013). At least for human fish consumption
However, there may be several reasons to look at the bioaccumulation potential of other species than fish (for example mussels or crustaceans). If metabolism is more efficient at higher trophic levels, such as for polycyclic hydrocarbons in fish, aquatic organisms from lower trophic accumulate the substance to a higher concentration than fish. This process is called biodilution (e.g. Wan et al., 2007). Also for substances that do not biomagnify but have other mechanisms of accumulation, such as metals, species in lower trophic level of the food chain may have higher bioaccumulation potential. For example, a recent analysis showed that uranium accumulates in comparable amount in aquatic plants as in bivalves or in fish. In these cases accumulation in other aquatic organisms seem to be most relevant.
water → aquatic organisms → predator
Which food item will determine the final value for the risk limits in biota is not only dependent on the energy contents of the food items, but also on the bioaccumulation of the substance through the food chain (which will be discussed in section 0).
5.1.2 Marine food chain
For marine ecosystems, the same routes are identified. In addition to the food chain described for the freshwater environment, a further trophic level has been defined for the marine ecosystem, which is the level of the top predators that
Page 30 of 47
feed on the marine fish-eating predators. The marine food chain thus becomes (EC, 2003):
water → aquatic organisms → fish → fish-eating predator → top predator Although this additional step is also described in the guidance document for deriving quality standards under the Water Framework Directive (EC, 2011), no such difference has been made if the quality standard has been set for biota in the new European Directive 2013/39/EU.
In the case that other aquatic organisms are more relevant, these aquatic organisms are used instead of predatory fish.
water → aquatic organisms → predator → top predator
The fish-eating predator is just as in the case of the freshwater compartment mostly a bird or mammal. Similarly to the freshwater compartment it should be investigated, which of the food items is critical for the risk limits in biota. In this case, next to aquatic organisms, the concentrations in predators of these (e.g. seals) have to be analysed as well (section 0).
5.1.3 Terrestrial food chain
The food-chain for the terrestrial ecosystems that is used in the TGD (EC, 2003) and REACH guidance (ECHA, 2010) is defined as:
soil → earthworm → worm-eating birds or mammals
It can be reasoned that this food chain is short in comparison with the aquatic food chain, which also includes accumulation in higher trophic levels. In the terrestrial food chain, this step in the food chain may exist as well, where small birds and mammals serve as prey for terrestrial predators, such as raptors and mustelids (Jongbloed et al., 1994, Armitage et al., 2007). Therefore, it is
proposed to take this additional step in the terrestrial food chain into account, in a similar manner as for the aquatic route. This would lead to a terrestrial food chain that is defined as:
soil → earthworm → worm-eating birds or mammals → predator
In the guidance documents, earthworms are the default food item for the terrestrial compartment. Similar to the aquatic compartment, another food item should be selected if the accumulation in this food item appears to be higher than in earthworms. For the birds and mammals in the terrestrial environment terrestrial plants and seeds are important food items as well, for which
bioaccumulation data are often available. Similarly to the aquatic food chains, which of the food items is critical for the risk limits in biota should further investigated (section 0)
5.2 Characteristics of different food items
For the selection of the food item in a food chain that is most relevant for secondary poisoning both the energy content and bioaccumulation parameters should be available for several food items. If bioaccumulation parameters are normalized to lipid content, as is usually done for hydrophobic substances, the lipid content should also be known. If bioaccumulation parameters are expressed on a dry weight basis, as is usually done for most metals, dry weight content should be known instead.
For earthworms a generic lipid content of 1% has been defined (Jager, 1998, EC, 2003), for fish a generic lipid content of 5% has been defined (OECD, 2012, ECHA, 2008). A reasonable value for small birds and mammals seems 10%. For example, this value has been used for modelling the diet of carnivores and granivores (Hendriks et al., 2001, Hendriks et al., 2005).
With the standard energy contents for lipids, carbohydrates, and proteins of respectively 37, 17, and 17 kJ/g (90/496/EEC), energy contents of different food items can be calculated, if the lipid and dry weight content are known, assuming the rest of the dry weight to be either carbohydrates or proteins. With the generic dry weight content of 31.6% (Smit, 2005, EFSA, 2009) and lipid weight content of 10% (Hendriks et al., 2001, Hendriks et al., 2005) for birds and mammals, an energy content is calculated that is within 1% of the generic value reported for terrestrial vertebrates (Smit, 2005, EFSA, 2009).
Similar, a generic dry weight for fish of 26.3% (Smit, 2005, EFSA, 2009) and lipid weight content of 5% (OECD, 2012, ECHA, 2008), yields an energy content within one percent of the generic value reported for fish (Smit, 2005, EFSA, 2009). For earthworms a generic dry weight content of 15.7% (Smit, 2005, EFSA, 2009) and a lipid weight content of 1% (Jager, 1998, EC, 2003) yields an energy content that is only 6% higher than the generic value reported for earthworms (Smit, 2005, EFSA, 2009). Although the precision of these values is probably rather accidentally, it can be concluded that the generic values for lipid content of 1% for earthworms, 5% for fish and 10% for birds and mammals are consistent with the generic values for dry weight content and energy content. There is no standard value for bivalves, another important food item in both the freshwater and marine ecosystems. The lipid content can be estimated by applying the same calculation as above. A generic dry weight content of 8.3% and an energy content of 19.3 kJ/gdw (Jager, 1998, EC, 2003) would lead to a
lipid content of 1% for bivalves. This seems to be a rather reasonable value for freshwater and marine mussel species (Bruner et al., 1994, Lazzara et al., 2012, Pleissner et al., 2012).
Data for bivalves, fish, mammalian and avian vertebrates and earthworms are summarised in Table 4. Information on lipid content for other food items or information on protein content is not yet readily available and hasn’t been further evaluated for the purpose of this study. Some default data for protein content were used for food web modelling, which were 10% for invertebrates, 18% for fish and 21% for birds and mammals (Hendriks et al., 2005). These data could be used if bioaccumulation parameters are protein normalized.
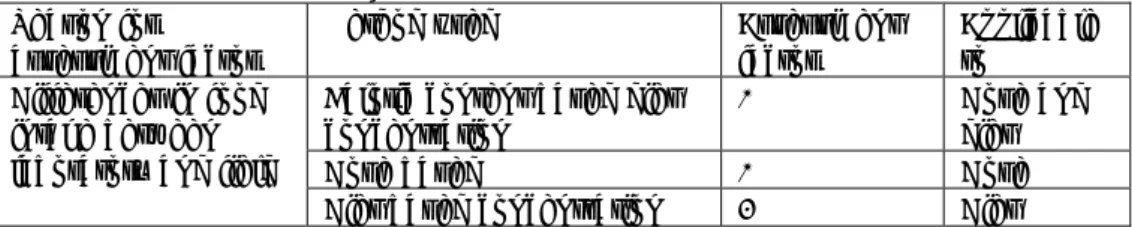
Table 4: Energy content, moisture content and lipid content for food items addressed in risk assessment schemes for aquatic and terrestrial food webs Food item Energy content [kJ/gdw] Moisture content
[%] Lipid content [%] Bivalves 19.3 91.7 1 Fish 21.0 73.7 5 Vertebrates 23.2 68.4 10 Earthworms 19.4 84.3 1
5.3 Selection of the critical food item
5.3.1 Freshwater food chain
The food item that is critical in the food chain needs to be identified first. This will be the food item that contains the highest energy normalized concentration at a certain concentration in the environment (e.g. water or soil). The birds or mammals that feed on this food item are exposed to the highest concentration in their diet. Which food item is critical is dependent on the relative ratio of the
Page 32 of 47
concentration of a substance in different food items, and thus on the bioaccumulation characteristics of a substance throughout the food chain. The concentration ratios in different food items are described by the
bioaccumulation parameters such as the biomagnification factor (BMF), which is the concentration ratio between an organism and its food, or the trophic
magnification factor (TMF), which is the average increase in concentration per trophic level, determined by regression over several trophic levels (e.g. Burkhard et al., 2013). Bioaccumulation parameters such as BMF and TMF are mostly normalized to lipid content for hydrophobic substances, dry weight for metals or sometimes protein content for perfluorinated compounds.
Primary consumers, defining trophic level 2, are often considered as reference level in trophic magnification (e.g. Borgå et al., 2012). For the freshwater and marine aquatic food web, mussels belong to this trophic level. The energy normalized concentration for mussels is.
mussel
mussel dw, mussel mussel , normalizedenergy [mg/kJ] energy content 1moisture content
C C
Fish at trophic level 4 differ by two trophic levels from mussels and other invertebrates feeding on algae and plants. Therefore, normalized concentrations in fish are higher than in mussels by the trophic magnification factor to the power of 2. At a certain concentration in mussels, the concentration in fish belonging to trophic level 4 from the same food web then becomes for hydrophobic substances:
mussel fish fish fish dw, 2 mussel fish , normalizedenergy
lipid
content
content
lipid
content
moisture
1
content
energy
[mg/kJ]
C
TMF
C
If the TMF is used for the pelagic food chain (i.e. up to fish), it must include only data for aquatic species, in which birds and mammals are excluded. For
substances that are not normalized to lipid content but to dry weight content (1-moisture content), this equation becomes simpler:
mussel
fish dw, 2 mussel fish , normalizedenergy
[mg/kJ]
energy
content
1
moisture
content
C
TMF
C
With the data presented in Table 4, it follows that at equal water concentrations mussels have higher energy normalized concentrations than fish at trophic level 4 if TMF is smaller than 0.8 (√0.69) for hydrophobic substances partitioning into lipids, and if TMF is smaller than 1.0 (√1.09) for substances that are better normalized to dry weight content, such as metals. This is in accordance with the general perception that if biodilution occurs (i.e. TMF significantly lower than one, or BAF for invertebrates is higher than BAF for fish), invertebrates are the most critical food item (e.g. for PAHs).
From these equation and the values from Table 4, it can also be deduced that for lipophilic substances fish at an equal trophic level as bivalves, i.e. solely herbivorous fish, and possibly even some fish at intermediate trophic levels, have higher energy normalized concentration than bivalves, because of the low ratio of lipid to dry weight content for bivalves. This calculation assumes that concentrations normalized to lipid content follow the correlation of the trophic magnification factor perfectly. However, for biodiluting substances there will generally be a difference in metabolic capacity between fish and invertebrates,
leading to lower concentration in fish compared to invertebrates, even when they occupy the same trophic level. The differences in metabolism that are dependent on the taxonomy of species might result in a bioaccumulation trend that is not continuous over the food chain, contrary to biomagnification due to hydrophobic partitioning. This has indeed been observed for PAHs, for which strong biodilution occurs, if trophic accumulation over the whole ecosystem, including invertebrates and fish, is considered (Nfon et al., 2008, Takeuchi et al., 2009, Wan et al., 2007). To the contrary, in a recent food web study with PAHs (Wang et al., 2012), no biodilution was observed in 24 species of fish from a lake, which spanned 2.4 trophic levels. If any effect was observed in this study with fish species only, it was a slight biomagnification, although none of the slopes was significant. It can be concluded that although there is a sharp decrease in concentration from invertebrates to fish, there is no such decline between different fish species occupying different trophic levels. Therefore, capability for metabolism because of different taxonomy is more important than trophic level. This leads to the conclusion that invertebrates are indeed the critical food item for substances that are subject to biodilution.
5.3.2 Marine food chain
For the marine environment another step in the food chain should be
considered, in which the marine top predators consume fish-eating mammalian and avian species. The concentration in these birds and mammals could be calculated by the concentration in fish by an extra biomagnification factor (BMFb/m):
mussel b/m b/m b/m dw, / 2 mussel b/m , normalizedenergy lipidcontent
content lipid content moisture 1 content energy [mg/kJ] C TMF BMFb m C
mussel
b/m dw, / 2 mussel b/m , normalizedenergy [mg/kJ] energycontent 1moisture content
C TMF BMFb m
C
BMFb/m thus describes the accumulation from fish, or other aquatic organisms, to
birds or mammals. Such a factor has to be determined experimentally from field studies in which homeotherms are included. If the trophic magnification factor is merely based on birds and mammals as predator (i.e. TMF is not merely
reflecting the accumulation in the aquatic food chain up to fish), this TMF can be used as a measure of BMFb/m. If experimental data are lacking, modelling of the
biomagnification potential (e.g. as done in Kelly et al., 2007) might be an alternative.
At a BMFb/m higher than 0.7, the mammalian and avian vertebrates will be the
food item leading to the highest concentration for lipophilic substances. This means that for lipophilic substances that are not easily metabolized by birds and mammals in comparison with fish, the extra step in the food chain will most likely determine the final quality standard in biota. For other substances that are normalized to dry weight content, a BMFb/m higher than 1.1 will cause the
mammalian and avian vertebrates to contain the highest energy normalized concentration.
5.3.3 Terrestrial food chain
For the terrestrial compartment a similar exercise can be performed. The
Page 34 of 47
are earthworms. The energy normalized concentration in earthworms can be described as:
earthworm
earthworm dw, earthworm earthworm , normalizedenergy [mg/kJ] energy content 1moisture content
C C
The birds and mammals (b/m) that feed upon earthworms have concentrations that are elevated by the biomagnification factor (BMFb/m). At a certain
concentration in earthworms, the concentration in these birds and mammals then becomes for hydrophobic substances:
earthworm b/m b/m b/m dw, / earthworm b/m , normalizedenergy lipidcontent
content lipid content moisture 1 content energy [mg/kJ] C BMFb m C
Also for biomagnification in the terrestrial food chain, modelling of the biomagnification potential (Armitage et al., 2007) might be an alternative if experimental data are lacking. For substances that are not normalized to lipid content but to dry weight content (1-moisture content), this equation becomes:
earthworm
b/m dw, / earthworm b/m , normalizedenergy
[mg/kJ]
energy
content
1
moisture
content
C
BMF
b mC
Because of the relatively low lipid content of earthworms, at equal lipid
normalized concentrations the concentrations normalized to energy content are much higher in birds and mammals. This means that the predator that feeds on worm-eating birds and mammals receives a higher energy normalized diet concentration than the worm-eating bird or mammals themselves with a lipid normalized biomagnification factor of only 0.2. This again stresses the importance of this extra trophic level for the terrestrial ecosystem for
hydrophobic substances that predominantly partition into the lipid phase. If the biomagnification is expressed on dry weight instead, the biomagnification factor must exceed 1.2 for the predator to receive a higher energy normalized diet concentration than the worm-eating bird or mammal.
5.4 Derivation of biota standards
The final environmental risk limit for secondary poisoning will be derived from the outcome of the steps described in the former sections. The concentrations based on energy content of the food are expressed as concentrations in the food item that is most critical for the compartment of concern (section 5.3). This is done by multiplying these energy-based concentrations by the specific energy of the food item, as reported for several food items together with their moisture content (Smit, 2005, EFSA, 2009):
food
food normalized
energy fw
food[mg/kg ] C [mg/kJ]energycontent 1moisture content
C
For fish, bivalves, earthworms and vertebrates, these energy contents and moisture contents are shown in Table 4.
5.5 Conversion of biota standards into concentrations in water or soil
In a next step, a translation to the trophic level of the group of species that will be monitored is necessary. If quality standards in non-biotic compartments are


![Table 4: Energy content, moisture content and lipid content for food items addressed in risk assessment schemes for aquatic and terrestrial food webs Food item Energy content [kJ/g dw ] Moisture content](https://thumb-eu.123doks.com/thumbv2/5doknet/3035221.7891/33.892.165.735.920.1035/energy-content-moisture-content-addressed-assessment-terrestrial-moisture.webp)