Method for derivation of probit
functions for acute inhalation toxicity
Colophon
© RIVM 2015
Parts of this publication may be reproduced, provided acknowledgement is given to the 'National Institute for Public Health and the Environment', along with the title and year of publication.
Dutch Expert Panel on Probit Functions M.M.W.M. Ruijten J.H.E. Arts P.J. Boogaard P.M.J. Bos, RIVM H. Muijser A. Wijbenga
This investigation has been performed by order and for the account of the Ministry of Infrastructure and the Environment, within the
framework of the project 'Rekenmethode inrichtingen'
This is a publication of:
National Institute for Public Health and the Environment
P.O. Box 1 | 3720 BA Bilthoven The Netherlands
Synopsis
Method for the derivation of probit functions to predict acute lethality following inhalation of toxic substances
A method is in place to assess the risks attached to the use, transport and storage of dangerous substances, the so-called quantitative risk analysis (QRA). Part of the QRA method comprises the prediction of the percentage of people that will die after inhaling substances that are acutely toxic. These predictions are calculated using ‘probit functions’. A probit function describes the relationship between the concentration of a substance, the duration of exposure and the part of the exposed
population that demonstrates a certain effect.
To derive a probit function, animal data are translated to humans. This report describes the methodology used to perform this derivation. The method has been developed by the Dutch Expert Panel on probit
functions, by order of the Netherlands’ Ministry of Infrastructure and the Environment, and replaces the previous version of the method from 2001. The method has been thoroughly revised and subsequently reviewed internationally.
Keywords: probit function, inhalation toxicity, quantitative risk analysis, QRA, third party risk
Publiekssamenvatting
Methode voor de afleiding van probitrelaties om acute sterfte te voorspellen na inhalatie van giftige stoffen
Er bestaat een methode om risico’s van het gebruik, vervoer en de opslag van gevaarlijke stoffen inzichtelijk te maken, de zogeheten kwantitatieve risicoanalyse (QRA). Als onderdeel hiervan wordt voorspeld welk percentage mensen overlijdt na het inademen van stoffen die acuut giftig zijn. Deze voorspellingen worden berekend met behulp van ‘probitrelaties’. Een probitrelatie geeft het verband weer tussen de concentratie van een stof, de duur van de blootstelling en het deel van de blootgestelde personen dat een bepaald effect vertoont. Om de probitrelaties te kunnen afleiden worden onderzoeksgegevens van dieren vertaald naar de mens. In dit rapport staat beschreven hoe deze afleiding moet worden uitgevoerd. De methodiek is in opdracht van het ministerie van Infrastructuur en Milieu opgesteld door de Toetsgroep probitrelaties en vervangt de vorige versie van de methodiek uit 2001. De methodiek is grondig herzien en vervolgens internationaal
gereviewd.
Kernwoorden: probitrelatie, inhalatietoxiciteit, kwantitatieve risicoanalyse, QRA, omgevingsveiligheid
Contents
Part 1 Scientific justification of the probit derivation methodology — 11
1 Introduction — 13
1.1 Relevant issues outside the scope of this document — 15
2 Philosophy for the derivation of a probit function — 17 2.1 Modelling the response to acute inhalation exposure — 17 2.2 Vulnerability models — 17
2.3 Quality assessment of animal toxicity data — 18 2.3.1 Data completeness requirements — 18
2.3.2 Study quality requirements — 19
2.3.3 Classification of overall study quality — 20
2.4 Acute toxicity data: characteristics and sources — 21 2.4.1 Literature search and selection of experimental data — 21
3 Evaluation of animal data to derive a probit function — 23 3.1 Data adjustment, quality assessment and primary data selection — 24 3.1.1 Overview of available data — 24
3.1.2 Adjustment of data with short exposure duration — 25 3.1.3 Datasets with only 0% and 100% response — 26
3.1.4 Test atmosphere generation and characterization of the concentration — 28 3.1.5 Quality evaluation of each available study — 31
3.2 Stepwise approach to evaluate the animal data — 32 3.2.1 Probit calculation for individual eligible studies — 32 3.2.2 Exploring the analysis of pooled data — 34
3.2.3 Derivation of a point of departure for the human probit function — 35 3.3 Interspecies extrapolation — 36
3.4 Assessment of sensory irritation in animals — 40
3.5 Assessment and adjustment for overall quality of the study — 43 3.6 Intra-species extrapolation — 43
3.7 Verification with primate data — 45
4 Discussion and conclusions — 47
Part 2 Completion of the probit TSD format — 49
5 Stepwise explanation of the probit TSD format — 51 5.1 Title page — 51
5.2 Substance identification and physical-chemical characteristics — 51 5.3 Mechanism of action in humans — 51
5.4 Human toxicity data — 52 5.5 Literature search strategy — 52 5.5.1 Sensory irritation — 53
5.6 Probit functions derived from individual studies — 53 5.7 Evaluation — 54
6 Description and interpretation of studies in the probit TSD — 57 6.1 Study identification — 57
6.3 Presentation of the data — 58 6.4 Probit function — 58
6.5 Calculation of LC-values with the model — 58 6.6 Plot of underlying data — 58
6.7 References — 58
7 Annexes — 59
7.1 Annex to head/nose only versus whole body exposure — 59 7.1.1 Selection of an inhalation chamber — 59
7.1.2 Nose-Only Exposure Technique — 61 7.1.3 Whole-Body Exposure Technique — 61 7.2 Annex to interspecies extrapolation — 62 7.3 Annex to intraspecies extrapolation — 62
References — 65
List of abbreviations — 69
Summary
A probit function for the acute inhalation toxicity of a chemical describes the lethality rate in an exposed population as a function of any
combination of the exposure concentration and exposure duration. Probit functions are used in Quantitative Risk Analysis (QRA) to estimate the proportion of fatalities following exposure to toxic chemicals.
This document describes the methodology used for the derivation of probit functions. The methodology, that was formerly described in the ‘Green Book’ (part 4 of PGS1), has been updated and thoroughly revised. This revised version of the methodology is a product of the Netherlands’ Expert Panel on probit functions, that operates under authority of the National Institute of Public Health and the Environment (RIVM).
After introducing the basic philosophy of deriving a probit function, the methodology describes in detail the interpretation and use of animal data and the derivation of the probit function. Stepwise guidance is provided for drafting a probit technical support document.
Major revisions to the methodology compared with the previous version include the following:
The revised procedure puts higher demands on the quality of inhalation toxicological data.
Many datasets do not meet the quality criteria set by the Expert Panel on probit functions. The Panel has defined quality criteria for the inclusion or exclusion of studies in the probit derivation. The derivation of probit functions based on ‘life threatening
values’ (LBW) is no longer allowed.
The derivation of probit functions via LC50 values and the old flow
chart based on allometric scaling is not allowed.
The procedure to raise the LC50 value as a point of departure
when data from two or more animal species is available is no longer considered to be valid.
Part 1
Scientific justification of the probit derivation
methodology
1
Introduction
A probit function for acute inhalation toxicity of a chemical describes the lethality rate in an exposed population as a function of any combination of the exposure concentration and exposure duration. Probit functions for the acute toxicity of chemicals are important instruments in the Netherlands’ external safety policy. They are used in Quantitative Risk Assessments (QRAs) to estimate the proportion of fatalities following (accidental) exposure to toxic chemicals. The primarily responsible ministry, the Ministry of Infrastructure and the Environment, has initiated the unification of methods, procedures and information for external safety QRAs. As a part of this unification process, the probit functions and the scientific and administrative procedures used to derive probit functions have been reviewed and revised.
This methodology describes the current, standing technical operating procedure used to develop a probit function for human lethality due to an acute airborne (mainly inhalation) exposure. This procedure, that was formerly described in Chapter 4 of PGS1 or the ‘Green Book’ (VROM 2005), has been approved by the Dutch Expert Panel on probit
functions. The revised procedure places high demands on the quality of inhalation toxicological data before acceptance as a Point of Departure (PoD). This is a major shift away from the previous situation, in which an LC50 value from RTECS was considered to be an acceptable PoD.
Even if an LC50 value for a single exposure duration is used as a PoD,
the revised procedure requires a review of the primary report and data, and a verification of the calculated value. Other significant
methodological changes include:
The derivation of probit functions based on LBW values is no longer allowed.
The derivation of probit functions via LC50 values and the old flow
chart based on allometric scaling is not allowed.
The procedure whereby the LC50 value as a PoD is multiplied by a
factor 2 when data from two or more animal species is available is no longer considered to be valid.
The objective of this document is to outline what information and
scientific risk assessment procedures are required to prepare a Technical Support Document (TSD), including the development of a draft
(procedural status: proposed) probit function for human lethality following an acute airborne exposure to a hazardous substance. A number of general assumptions and basic principles underlie the development and application of probit functions:
1. For the Dutch implementation of the Seveso III directive, a choice has been made to include only lethality as an endpoint for external safety assessment. The endpoint for all probit functions, therefore, is lethality. Non-lethal health effects are not
considered in the external safety assessment. Guidelines and models for an external safety assessment of transport of dangerous goods follow the same philosophy.
2. Probit functions are designed to predict the lethality following acute inhalation exposure. The probits are explicitly not designed to guarantee the prevention of all levels of toxicity. For this reason, probit functions have been developed without the safety factors usually applied for protective exposure guidelines (such as air quality guidelines).
3. The probit functions assume an ‘average’ population, including susceptible subjects. Depending on the demographic
characteristics of the population actually exposed, the calculated risk zones may be a more or less accurate reflection of the site and scenario specific, expected human lethality.
4. The probit functions assume that the exposed persons are not protected by personal protective equipment or shelter in place, nor that they receive medical treatment following exposure. 5. Possible lethality from delayed effects, as in the case of
carcinogenicity or reproductive toxicity, is not taken into account. 6. Possible lethality following secondary exposure is not taken into
account.
7. Possible secondary lethality from causes other than acute toxicity (e.g. from mechanical trauma due to falling caused by toxic incapacitation) is not taken into account.
In March 2009, the then Ministry of Housing, Spatial Planning and the Environment appointed the members of the Dutch Expert Panel on probit functions (the Panel). The mission of the Panel is:
1. To advise the Ministry’s director of risk policy about the toxic properties of chemicals and, particularly, to provide the best possible support for a probit function based on current scientific understanding.
2. To develop, maintain and publish the robust protocols and criteria necessary to produce the advice mentioned under 1 in a
transparent and reproducible manner.
Since 2014, the Panel operates under authority of RIVM.
Secretarial support for the Panel is provided by RIVM. The membership register of the expert Panel can be found on the RIVM website
(www.rivm.nl, cf ‘internet resources’). The guidelines and procedures
contained in this document have been developed and approved by the Panel. The current version of this document can be found on the RIVM website. While reviewing draft probit TSD documents, the Panel may identify toxicological or procedural issues that require an update of the standing operating procedures. Changes in the toxicological risk
assessment approach will result in an update of this document, which will be posted on the RIVM website. Therefore the actual guidelines to develop probit functions consist of:
the most recent version of this document;
the procedural guidelines posted on the RIVM website. Both documents indicated above can be found on the RIVM website. All guidelines presented in this document are preferred standard
procedures. The Panel recognizes that the availability and quality of the data may sometimes seriously limit the ability to strictly follow these guidelines. The preferred procedures outlined in this document do not exclude the TSD author’s or Panel’s option to take case-by-case
decisions based on expert judgment of specific information for a given substance. Such decisions should be justified in the TSDs.
After the derivation of about 40 probit functions, it was deemed appropriate to organize a peer review of the methodology and the derived probits. As a result, an international invitational expert meeting was convened in September 2013 with the objective of improving the scientific basis, validity, appropriateness and acceptance of the methodology used (at that time) to derive probit functions for acute lethality in a normal human population following a single airborne exposure. This objective was met by bringing together renowned international experts in the field of risk assessment for acute airborne exposures in order to discuss its strengths, weaknesses and
opportunities to improve the methodology.
The participants of the workshop were invited to recommend improvements to the methodology. The probit Panel asked that the recommendations should ideally be:
practical and feasible with reasonable data requirements (minimizing the need to generate new data);
a clear improvement over the existing methodology, both from a scientific and societal point of view;
philosophically and practically compatible with other risk
assessment methodologies (so far as these are applicable to the risk assessment of incident scenarios) as far as possible,
particularly those generally applied in Europe.
The current version of this document incorporates the recommendations made by this meeting (Ter Burg et al., 2013).
Even after the expert meeting, this document is considered to be a living document and the presented procedures are subject to periodic review and revision. The Panel will evaluate new scientific insights that are relevant for the derivation of human concentration-time-lethality functions for acute inhalation exposure and the procedures will be
adjusted accordingly, if necessary. In addition, all interested parties with suggestions for changes of the methodology are invited to submit
sufficiently justified and supported recommendations to the Panel’s secretariat (via the website).
1.1 Relevant issues outside the scope of this document
This document serves as a technical guideline for the development of probit functions. The following relevant and related information will not be described, and can be found on the RIVM website:
A list of substances scheduled for the development or revision of a probit function. The selection of substances for the derivation of probits is the responsibility of the Ministry of Infrastructure and the Environment. Among other things, the selection is based on the inclusion of substances in external safety reports submitted to the RIVM.
All proposed, interim and final probits TSDs; the documents database can be searched by name or CAS number on the RIVM website. The site also provides access to the regularly updated ‘Reference Manual Bevi Risk Assessments’, which includes a list of existing probit functions.
The administrative procedure and guidelines for drafting and submitting a probit Technical Support Document (TSD) to the Panel, as well as a format of the probit TSD.
TNO publication (Arts and Muijser 1999) on quality criteria for animal inhalation experiments (see Section 2.3.2).
Due to size limitations, this document is not intended as an exhaustive scientific justification of the applied approach. The document is designed as a ‘how-to’ guidance with an explanation of the assumptions,
principles and justification of the often pragmatic choices that need to be made.
2
Philosophy for the derivation of a probit function
This chapter provides the basic philosophy for modelling the lethal response to acute inhalation exposure, the data demands to meet the modelling needs and the identification of data sources.
2.1 Modelling the response to acute inhalation exposure
The toxic response of a human or animal population to a chemical exposure is determined by:
the chemical substance;
the exposure route (inhalation, dermal, oral or parenteral);
the exposure concentration of the chemical in the contact medium (air, water, food, etc.);
the duration of exposure;
the species (test animals or human);
physiological characteristics of the individuals in the exposed population.
This document deals with the lethality, immediately or shortly after the exposure, of a single (up to eight hours) airborne exposure in an average population. Risk evaluations for chemical exposures by other routes, contact media and exposure durations require different data, procedures and assessments from those presented in this document. The procedures described here may not be suitable for those situations and scenarios.
For obvious reasons, experimental test data on humans resulting in lethality are not available. In some cases, information is available from accidental poisoning, but in such cases the levels of exposure are usually poorly characterized. Therefore almost all information for the derivation of probit functions originates from the results of animal experiments. Any data on health effects in humans or other primates can provide supportive evidence (cf. Section 3.7).
2.2 Vulnerability models
The modelling for external safety requires that the percentage of
lethality in the exposed population can be assessed for each combination of exposure concentration and duration. The concentration-time-lethality relationship can be described using a number of statistical models
including (log) probit, (log) logit and Weibull models. All mentioned models make assumptions about the underlying statistical distribution of the concentration-time-response (C×t) data, and usually describe the C×t relationship of acute lethality data about equally well in the actual experimental exposure range (interpolation and limited extrapolation); for risk assessments that require predictions of toxicity well outside the actual experimental exposure range, the models may produce widely different health outcomes for identical exposure-response scenarios. The log probit model has been selected as the most simple and
straightforward model to describe the human vulnerability distribution for use in modelling acute lethality for external safety.
The probit model for concentration-time-lethality data is described as:
Equation 1 Standard bivariate probit model. C is concentration in
mg/m3 and t is exposure duration in minutes.
A frequently used alternative presentation is:
Equation 2 Alternative bivariate probit model; b = b2 and n = b1/b2.
The dose metric (Cn×t) is often referred to as ‘toxic load’.
In some cases, the probit function can be extended with the use of a covariate for e.g. sex. In that case, the basic version of the probit model is described as:
Equation 3 Probit model with interaction term. X is the covariate
(log-transformed, if appropriate, or 0/1 in case of sex)
In some cases, the model fit of the data can be improved by adding cross-terms for interactive effects between the model parameters (usually concentration and time) or a threshold response level
(concentration or time). Before the probit model is complicated by such an addition, strong biological and statistical rationales are required (Section 3.1).
2.3 Quality assessment of animal toxicity data
The Panel evaluates the quality of data from animal experiments on the basis of two criteria:
1. The ability to derive a probit function from the dataset (data completeness requirements).
2. The technical conduct of the study and the quality of the report (study quality requirements).
These two quality aspects will be discussed below, followed by the Panel’s rules for the classification of studies.
2.3.1 Data completeness requirements
A dataset will enable the assessment of all parameters of a probit function as a basis for a human probit function if the following information is available and verifiable from the literature source:
1. A sufficient number of exposure concentration-time
combinations, with at least three exposure durations and three concentrations per exposure duration. Studies with two qualifying exposure durations are considered unfit to assess the n-value for the particular chemical without supporting data.
2. The number of animals and the number of fatalities per
concentration-time combination. Preferably also the time of death is provided.
3. The dataset must produce a model outcome with the DoseResp or BMDS software packages. In practice, the statistical models require a number of exposure conditions with a partial response to produce a model output. Studies carried out according to the OECD guideline 403 C×t protocol (OECD, 2009) only produce responses of 0%, 50% or 100% (and sometimes 25% and 75%, when 2 animals per sex per concentration-time combination are exposed). These studies are eligible because many concentration-time combinations for longer and shorter durations and lower and higher concentrations are available. A C×t dataset can produce estimates of the relevant parameters LC50 and ‘n’ in itself, as
opposed to single duration LC50 studies.
For studies with 1 exposure duration, at least one partial response is required (in practice, at least two) to produce a model output. The assumptions that need to be made to derive a probit function will be discussed in Section 3.1.
4. In addition to the animal experimental data described above, every effort should be made to collect data on the response in humans and other primates, even if such data only concern non-lethal effects. Experience indicates that such data can be crucial to supporting the validation of animal data for human risk assessment.
2.3.2 Study quality requirements
The first quality aspect concerns compliance with international testing guidelines, particularly OECD TG 403 and GLP. Studies that are used as a point of departure for the derivation of a probit function should be performed according to OECD guideline 403 or equivalent (first version introduced in 1981). For the present purpose, the C×t protocol of the OECD guideline 403 (2009 revision) is the preferred study protocol. The C×t protocol is therefore recommended when new or additional acute inhalation toxicity studies are needed. Studies performed according to good laboratory practice (GLP) and OECD guidelines are preferred (EPA GLP introduced in 1976, OECD GLP introduced in 1981). Non-GLP studies will be evaluated for their reliability and suitability for probit derivation.
Acute inhalation toxicity studies are technically a relatively complex undertaking. Arts and Muijser (1999) described in detail which aspects of inhalation toxicity studies need to be reviewed to assess a study’s technical quality (in Dutch). The following critical study characteristics should be described adequately and these quality requirements should be met to be eligible to qualify for ‘A’ status of the study:
Purity and stability of the test substance. Head/nose only or whole body exposure.
Dynamic test atmosphere and airflow (for head/nose only) or air exchange rate (for whole body).
Use of vehicle, if other than air.
Pressure distribution in the test system.
Homogeneity of the test atmosphere in the test system. Actual concentration measurement (frequency, location,
analytical procedure).
Presence of aerosol. Measurement of aerodynamic particle size distribution if aerosol was or may have been present.
Exposure duration, equilibration time of the chamber/test system.
Test species, strain, sex and age.
Number of animals per concentration, exposure duration or concentration-time combination.
Post-exposure observation period and criteria for sacrifice of moribund animals.
Calculated LC50 value for the exposure duration(s).
The appropriate use of suitable restraining tubes.
For most of the characteristics mentioned, detailed information needs to be provided in the probit TSD (Chapter 6). Arts and Muijser (1999) provide a list of additional, less critical characteristics contributing to study quality.
Most of the modern acute inhalation toxicity studies are conducted with a head/nose-only exposure setup. OECD GD 39 provides an extensive justification for the preference of head/nose only studies over whole-body studies in general, if technically well performed (cf. Annex 7.1). The main caveats mentioned in OECD GD 39 that may disqualify nose-only lethality studies include the restraining tube design, pressure distribution in the inhalation chamber and the airflow. All these factors are therefore carefully assessed to ensure that the study qualifies for probit development. Most of the more recent acute mortality studies used by the Panel are designed to adequately control most of the critical factors.
2.3.3 Classification of overall study quality
The Panel distinguishes three quality levels of animal data based on the quality of the study and the ability to derive a probit function from the data:
‘A’ quality studies
‘A’ quality studies provide sufficient data to assess all the parameters of a probit function: a, b (=b2) and n. While the n-value can be estimated mathematically from a study with two exposure durations, the Panel will accept n-values derived from at least 3 eligible exposure durations. Another data applicability criterion requires that the response rates, as determined in the study, cover the whole response range. In practice, at least two partial responses should be available.
In addition, the study should sufficiently meet the ‘study requirements’ listed above.
Finally, all study quality requirements listed above must be met for a study to qualify as an ‘A’ quality study. ‘A’ quality studies can be used to derive a PoD for probits without restriction.
‘B’ quality studies
Studies are qualified as ‘B’ quality in two cases:
1. Not all the parameters of the concentration-time-lethality
function can be assessed, but the quality of the study is adequate and an LC50 or LT50 value can be estimated from the data using
DoseResp or BMDS software (B1 studies);
2. All parameters of the concentration-time-lethality function can be assessed, but the study fails on quality issues such as test
atmosphere generation, concentration assessment, etc. (B2 studies).
‘B’ quality studies can be used, with restrictions, to derive a PoD for probits when no ‘A’ quality studies are available. When the pooling of data is appropriate, B1 studies can be included in the pooled data. B2 studies can be used, with restrictions, if there are no suitable A or B1 studies.
‘C’ quality studies
Studies should not be used for development of a probit function (‘C’ quality status) if the criteria for classification as an ‘A’ quality or ‘B’ quality study have not been sufficiently met. ‘C’ quality studies cannot be used to derive a PoD for a probit, but can serve as supporting evidence.
2.4 Acute toxicity data: characteristics and sources
The derivation of a probit function for lethality requires much more information than the derivation of a threshold value for lethality. The derivation of a threshold only requires that the lower end of the
exposure-response curve can be estimated from the data and, in some cases, a high non-lethal exposure can serve as a PoD. For the derivation of a probit function, information must be available over the full
concentration-time-response range from a single study. In some cases, data from different studies can be combined to cover the concentration-time-response range, but such a procedure requires a detailed
explanation and rationale and is not preferred by the Panel.
For many substances, these high data demands cannot be met. In such cases, the absolute minimum data requirement for the derivation of a probit function is a high quality animal LC50 value from a primary
literature source for an exposure duration of between 10 and
240 minutes. With these data and some default assumptions outlined and justified in Section 3.2, a probit function can be derived. The Panel does not accept LC50 values from secondary sources as a point of
departure for a probit.
2.4.1 Literature search and selection of experimental data
The nature of the probit derivation places very high demands on the quality and completeness of the data. Primary literature has the highest likelihood that the information as specified above is available and has a lower likelihood of containing copying and interpretation errors. This is why primary literature is always preferred over secondary literature. Primary sources include, in order of preference:
1. Original toxicity study reports.
Reports of toxicological experiments containing all the raw data offer the most complete and reliable information to assess the chemical’s toxicity and the study’s validity, even though these reports do not undergo formal peer review outside the test laboratory. This situation requires that the TSD author perform the peer review, which requires a thorough understanding of inhalation toxicology.
Publications in peer-reviewed journals often provide much less detailed information than the original study reports. The cautious approach, therefore, is to request the original study report. This may be problematic if the study is old or proprietary. The advantage of this type of publication is the peer review, if well conducted.
3. Non-peer reviewed journals.
Even though a peer review was not performed, the quality and usefulness of such publications can be adequate. The absence of peer review makes great demands with respect to the knowledge and experience of the TSD author.
Secondary literature sources include:
1. AEGL, EU RAR, ERPG, REACH and SMAC documentation or other documents of risk assessments from authoritative agencies (US EPA, ATSDR, occupational guidelines, etc.). These sources contain summaries of the relevant data and are essentially unsuitable as a surrogate for data from primary references. These documents can be a valuable source to identify available data.
2. Databases such as RTECS, IUCLID, HSDB and others contain summarized information on the acute inhalation toxicity of chemicals. The citations are known to contain errors and should, under no circumstances, be used as a PoD to derive a probit. These databases can be a valuable source to identify available data.
In addition to the aforementioned databases containing summaries of relevant data, other databases without such information can be used to identify primary data. Examples are ESIS, HPV, ToxNet, Medline and NTIS. This will be explained further under search strategy in Chapter 5. A list of Internet resources for literature research is provided in the appendix ‘Internet literature resources’.
3
Evaluation of animal data to derive a probit function
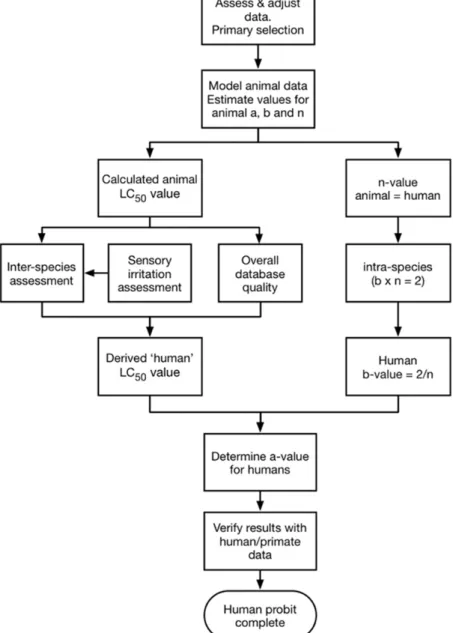
Chapter 2 described data requirements and data sources for probit function development. This chapter justifies the approach prescribed by the Panel and describes a number of critical, underlying methodological (extrapolation) issues that play a role in the process of probit derivation from the available data. Figure 1 outlines the methodological process used to derive probit functions and outlines the relationship between the methodological steps.
Figure 1 Flowchart for developing a human probit function from animal lethality data.
The derivation of a probit function that is believed to be valid for a heterogeneous human population requires an LC50 value and an n-value
from lethality data in animals as a starting point. The derivation of a valid animal LC50 and n-value, therefore, are the first step in the process
of human probit derivation. The following brief outline of the necessary steps to derive a human probit function from animal data (assuming an ideal C×t dataset) is provided to promote an understanding of the issues and the prescribed risk assessment approach:
1. Determine which information from which studies should be included in de modelling of animal data, adjusting for data from short exposure durations, test atmosphere characterization and datasets with only 0% and 100% responses.
2. The selected (and if necessary: adjusted) animal data are used to model values for the parameters a, b and n for the test species. 3. From the animal probit function, an animal LC50 value (preferably
for 30 minutes) and an n-value are calculated.
4. The animal n-value is assumed to be valid for humans as well. 5. The value of (b×n) as a metric for variability within a human
population is usually assumed to be 2 (see Section 3.6). The b-value is usually calculated as 2/n.
6. To derive a human LC50 value, AFs for inter-species extrapolation
and overall study quality are applied.
7. The a-value is calculated with the derived human LC50 value,
b-value and n-b-value.
Each of the assessment steps is described and justified below.
3.1 Data adjustment, quality assessment and primary data selection
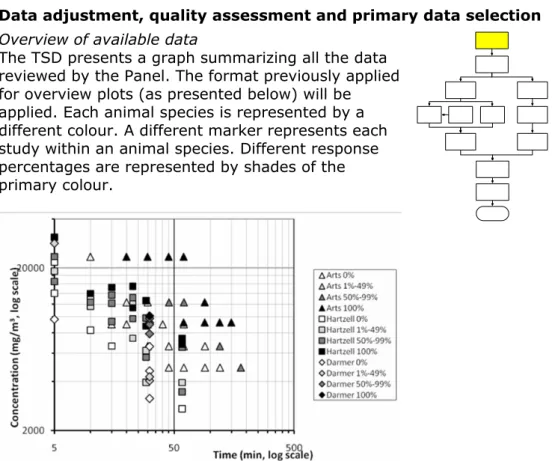
3.1.1 Overview of available data
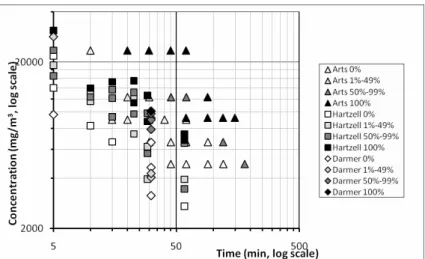
The TSD presents a graph summarizing all the data reviewed by the Panel. The format previously applied for overview plots (as presented below) will be applied. Each animal species is represented by a different colour. A different marker represents each study within an animal species. Different response percentages are represented by shades of the primary colour.
3.1.2 Adjustment of data with short exposure duration In an inhalation experiment, the exposure of the test animals should not be initiated before the build-up of the exposure concentration is complete. In this case, concentrations reported throughout the exposure phase accurately reflect the average, actual exposure concentration.
When the exposure of the test animals is initiated before the concentration build-up has been
completed, (part of) the build-up period is included in the reported exposure period. In this case, the
interpretation of data is biased because the chamber concentration may not have equilibrated sufficiently, so that the actual exposure
concentration is overestimated (and the risk underestimated). OECD Guideline Document 39 provides the following estimate for t95, the time it takes until 95% of the equilibrium concentration in an inhalation test system has been reached (for whole body exposure and head/nose only exposure whereby animals are placed in the exposure chamber prior to start of the test atmosphere generation):
3
Equation 4 Relation between chamber volume, chamber flow and
equilibration time.
For head/nose-only exposures, the volume of the inhalation system core is chosen.
Chamber equilibration may take several minutes. For very short exposure durations, it makes sense to adjust for the lower exposure concentration during the equilibration. With such an adjustment, short-term exposure data can be used in the probit derivation.
The following procedure is followed to assess the validity of including toxicity data for short exposure periods in the derivation of a probit function.
1. Determine the equilibration time as provided by the authors, if such information is available. Alternatively, the equilibration time for the inhalation system can be calculated using Equation 4. For each of the reviewed studies, the equilibration time should be mentioned in the study quality table.
2. Determine whether or not the animals were exposed before the concentration in chamber was completely equilibrated.
Information about the start of the exposure relative to the equilibration time should be included in each study’s quality table.
3. If animals were exposed after complete equilibration of the chamber, the analytically determined concentration over the exposure period can be applied in the probit derivation. This requires that at least one air sample was drawn during the
other analytically valid information about the actual exposure concentration is available.
4. If animals are placed in the system prior to equilibration, an adjusted exposure concentration is calculated as follows:
a. The adjusted concentration is calculated as the average concentration <C> of the test atmosphere as follows: <C> = Cequilibrium × (1 – t95/3t) × (1 – EXP(-3t/t95)) with
t95 = equilibration time (in min), t = exposure duration (in min) and Cequilibrium = the equilibrium concentration.
A new tab has been added to the probit worksheet to make this calculation.
b. The probit Panel has the option of performing probit calculations with the adjusted exposure concentration. 5. For all data points for which the animals were placed in the
system after equilibration and for data points for which the concentration was adjusted as proposed above, the goodness of fit of the short term data in the overall dataset is evaluated as follows:
a. Visual inspection of the data and/or the LC50 values for all
time periods.
b. Calculation of the probit function with and without the short-term data and an assessment of the 30-minute LC50 from
both calculations.
c. Statistical goodness-of-fit tests with and without the short-term data.
Any substantial differences in the model outcome or statistics may indicate issues with the assumption that the short-term data are part of the same statistical distribution as the longer duration data, or that the response of the animal species to the exposure follows an a-typical pattern. The issues
underlying the deviation may include a different response mechanism or the inability of the probit model to describe short exposures.
6. Expert judgment is exercised to determine whether or not data from animals that were placed in the inhalation chamber after equilibration and data for which the concentration was adjusted as proposed above can be combined in one statistical model (if applicable). In either case, the judgement provides a clear reason for the choice made.
7. Based on the evaluation of the data, an expert judgment is made as to which of the data should be included in the probit
calculation.
8. In cases in which the only option to calculate a probit function from the data is to include questionable data, the option of
reverting to the default model parameters remains open. This can be an option particularly in cases in which the default parameters produce a more conservative probit.
3.1.3 Datasets with only 0% and 100% response
The statistical models used by the Panel to calculate probit functions require that the datasets include response rates different from 0% and 100%. Sometimes, the steepness of the dose-response curve appears relatively small with respect to the spacing of exposure durations and/or
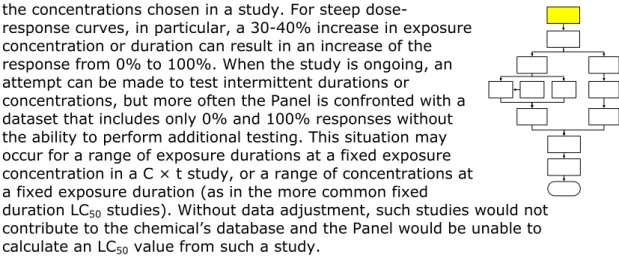
the concentrations chosen in a study. For steep
dose-response curves, in particular, a 30-40% increase in exposure concentration or duration can result in an increase of the response from 0% to 100%. When the study is ongoing, an attempt can be made to test intermittent durations or
concentrations, but more often the Panel is confronted with a dataset that includes only 0% and 100% responses without the ability to perform additional testing. This situation may occur for a range of exposure durations at a fixed exposure concentration in a C × t study, or a range of concentrations at a fixed exposure duration (as in the more common fixed
duration LC50 studies). Without data adjustment, such studies would not
contribute to the chemical’s database and the Panel would be unable to calculate an LC50 value from such a study.
The following data adjustment will be used to overcome a situation in which the plotted data suggest a well-fitting probit relation that the software is unable to calculate. Half of the animals tested at the highest 0% level and half of the animals tested at the lowest 100% level are assigned to a new fictitious exposure duration which equals the assumed LT50 value (estimated as the GM of the two durations).
The same procedure would work for exposure concentrations in studies in which the exposure duration is fixed, which applies to many classical OECD 403 tests. In this case, the GM exposure concentration is
calculated and some of the observations are assigned to that GM concentration.
The procedure is explained using the example below for a fictitious chemical with a dataset of lethal responses following an exposure to a fixed concentration for 5 different exposure durations as part of a C × t study in which a number concentrations were tested. The spacing of the exposure durations is by a factor of SQRT(2). For each concentration/ duration combination, 2 males and 2 females were tested.
Table 1 Hypothetical C × t data with only 0% and 100% response at a fixed concentration level.
Actual exposure duration (min)
30 42 60 85 120
Mortality males s s s s † † † † †
Mortality females s s s s † † † † † †
s: survived, †: fatal
The observed data will be adjusted as follows:
1. Addition of an exposure duration that was not actually tested (50: the GM of 42 and 60);
2. Assign half of the animals from the 42 and 60 minute groups to the 50 min group;
3. Assume 50% lethality in the 50-minute group.
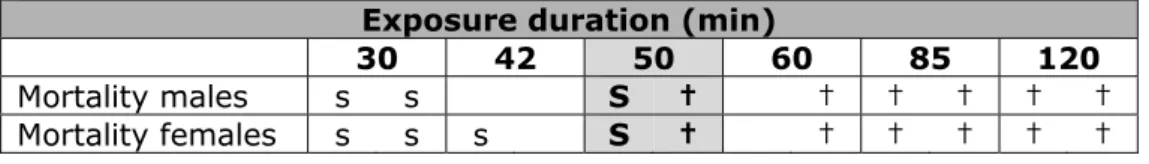
This adjustment would produce the following adjusted exposure-response data table:
Table 2 Hypothetical C × t data with only 0% and 100% response at a fixed concentration level, after data adjustment for analysis
Exposure duration (min)
30 42 50 60 85 120
Mortality males s s S † † † † † †
Mortality females s s s S † † † † † †
s: survived, †: fatal
The shaded area represents the adjusted (imputed) data.
This adjusted table will add one useful set of data to the total dataset. Once the concentration-time-lethality dataset contains a sufficient number of data points with partial lethality, LC50 values can be
calculated for any concentration in the tested concentration range. The basic assumption underlying the adjustment is that the geometric mean of the highest 0% exposure duration and the lowest 100% exposure duration is the best estimate of the LC50 value. This
assumption is only reasonable if the ratio between lowest 100% and highest 0% exposure durations is small, in this case defined as less than a 2-fold difference1.
If the dataset containing only 0% and 100% responses is part of a C × t study, in which additional concentration-time combinations have been tested, the influence of the assumption underlying this adjustment should be limited if data of only 1 of the (usually 4-5) concentration groups needs to be adjusted (2 concentration groups with partial lethality usually suffice to obtain a model output). If data from half or more of the concentration groups need such adjustment, an expert judgment should be made to support or reject the use of such adjusted data.
3.1.4 Test atmosphere generation and characterization of the concentration The method used to derive a probit function assumes
that concentrations in the animal study have been determined analytically, whereby a sufficient number of samples have been taken in the animals’
breathing zone and have been analysed appropriately. The Panel recognizes that the
available data do not always meet these demands; some studies report concentrations as:
Nominal concentrations, determined by dividing the weight difference of the test material before and after the exposure by the
total airflow through the test chamber. This exposure
characterization does not account for uneven mixing in the test chamber and potential loss of test substance in the test
atmosphere generator, exposure chamber and the connecting tubing, among other things. Depending on the physical-chemical characteristics, actual-to-nominal ratios can range from less than 0.1 to up to 1.0.
1 If there is a more than 2-fold difference between the lowest 100% and highest 0% durations and the dataset
is crucial for the probit calculation, the LC50 value will be assessed as the lowest 100% response duration ×
Target concentrations, the concentrations that the investigator plans to produce and for which all instrument settings are chosen. There is no verification of the extent to which this concentration has been actually achieved in the test system. This section provides guidance to conclude whether studies only reporting nominal concentrations could still be used for evaluation and inclusion in setting probit relationships. Note: target concentrations, i.e. intended concentrations, can never be used for this purpose unless solid evidence is available that the target concentrations are likely to reflect the actual concentrations accurately.
Gases
For gases, the efficiency for dynamic test atmosphere generation is expected to be near 100%, hence in cases in which only nominal concentrations have been reported in a study, it is assumed that the actual concentrations will be close to the nominal concentrations reported if the gas and the dilution airflow have been measured correctly.
Dusts
In cases of dry aerosols, the generation efficiency can vary to a large extent, depending on the method used, the nature of the substance and the size of the particles in the substance to be tested. Because
efficiencies can be very low (<5%), the Panel will not accept the use of a dust generation study for evaluation in cases in which only the
nominal concentration has been reported.
Vapours
A vapour test atmosphere can be generated in two ways, viz. by: 1. Evaporation of the liquid, e.g. by passing (heated) air through
the liquid substance,
2. Aerosolizing the liquid (nebulization), e.g. small droplets are being generated that will (partly) evaporate on their way to the test animals.
With regard to the evaporation method, the nominal concentration will be close to the actual concentration unless condensation has occurred. This can happen if the vaporization was performed at a higher than ambient temperature and the concentration generated was close to the saturation concentration at the temperature in the exposure chamber. This could result in loss of material.
With regard to liquid aerosolization, depending on the vapour pressure and the concentration tested, it can be estimated whether the test atmosphere would consist mainly of vapour or mist. In case of vapour, the nominal concentration is expected to be close to the actual
concentration; in case of mist, the actual concentration can be much lower than the nominal concentration.
Differentiation between vapour and mist is therefore made on the basis of the saturated vapour concentration (SVC) for a volatile substance, and can be calculated as follows:
Equation 5 Calculation of the Saturated Vapour Concentration (SVC) in
mg/L. MW = molecular weight in Dalton, Vapour pressure in kPa.
A substance generated at a concentration well below the SVC will mainly consist of vapour, whereas a substance generated at a concentration close to or above the SVC will consist of a mixture of vapour and mist. Suppose we have a substance with a molecular weight of 96 and a vapour pressure of 1 kPa; this would mean a saturated vapour concentration of: 0.412 x 96 x 1 = 40 mg/L.
If the concentration tested is 10 mg/L, it could reasonably be assumed that most of the test atmosphere would consist of vapour and, as such, the nominal concentration would be close to the actual concentration. Although in principle a vapour concentration close to 40 mg/L for the substance mentioned above could be generated, this requires a well-designed dynamic generation system that avoids any condensation. In addition, vapour generation at the saturation concentration may not be feasible for all substances, particularly for those having a low rate of vaporization. Therefore, such studies must be evaluated with care and the actual concentration cannot be considered to be close to the nominal concentration without detailed information on the method of generation. For volatility, the scheme in Table 3 is used (COSHH essentials):
Table 3 COSHH scheme to assess volatility based on vapour pressure. Vapour pressure kPa
Very/extremely high > 13.3
Moderate 2.7-13.3
Slightly 0.13-2.7
Very low < 0.13
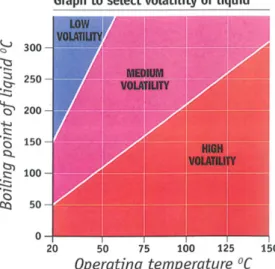
If only boiling temperatures are available, the graph in Figure 3 is used:
Figure 3 Assessment of volatility of liquids by boiling point and operating temperature.
This means that, at room temperature, substances with a boiling point below 50ºC are considered highly volatile, between 50ºC and 150ºC moderately volatile, and above 150ºC slightly volatile. As an indication, the vapour pressure data in Table 3 can be used (13.3 kPa, 2.7 kPa, or 0.13 kPa, respectively).
The scheme in Table 4 is proposed for adjusting nominal concentrations prior to inclusion of the data in the probit calculation:
Table 4 Adjustment scheme for nominal concentrations.
Tested conc. / SVC AF for vaporization AF for nebulization
< 0.25 1 1
0.25 – 0.50 1 2
0.50 – 1.0 1* - 2 2
> 1.0 1 for the part < 1 4 for the part > 1 2 for the part < 1 4 for the part > 1
* If sufficient detail on the generation method is available to conclude that condensation could reasonably not have occurred.
For highly reactive gases and vapours such as hydrogen peroxide, an additional factor (up to 2) may be used to take the decomposition into account.
Finally, if it is possible that the reactivity of the test material and/or the inhalation exposure system may have had a significant influence on the nominal-to-analytical ratio, the study may be rejected for the derivation of probit functions.
3.1.5 Quality evaluation of each available study
Each study’s quality table, as presented in the TSD, has been completed. If appropriate, the
concentration levels for studies (or data points in a study) with an exposure duration of less than 3 × t95
can be adjusted as outlined in Section 3.1.2. On the basis of the criteria outlined in Section 2.3, the study is classified as A, B1, B2 or C. Studies can be
included in the analysis of animal data on the basis of quality criteria as follows:
1. ‘A’ and ‘B1’quality levels can be used for the next step without restriction.
2. ‘B2’ quality studies will only be used, with appropriate additional assessment factors applied to the animal probit function, if ‘B1’ quality studies alone are insufficient to calculate a probit function. 3. If the bias of a study can be assessed from the study design and
conduct with a high degree of certainty, B2 studies with a bias towards a conservative dose-response estimate can be used without a correction for the bias (thereby overestimating the chemical’s toxicity). This assessment is left to expert judgment. 4. In principle, ‘C’ quality studies will not be used to derive a PoD. 5. In exceptional cases, when no A or B studies are available, the
inclusion of a particular C study is left to the expert judgment of the Panel. A clear rationale should be provided for any decision to include or exclude such data in the final calculations.
In some cases, therefore, particularly for data-poor chemicals,
B2 studies may be included in the data selection for further analysis. For chemicals with a larger database of studies meeting A or B1 criteria, B2 studies will usually not be considered in the further analysis. The presence or absence of an OECD/GLP certificate for a particular study is not a reason in itself to include or exclude a study from further consideration. The Panel will always make its own quality assessment based on the available information.
The studies selected to carry over to the next step in the procedure are selected on the basis of the criteria outlined above and the inclusion or exclusion from further analysis is clearly justified in the study
description.
3.2 Stepwise approach to evaluate the animal data
The following procedure is applied to select the data for the final analysis of the animal concentration-time-lethality curve, which will preferably produce 30-minute LC50 values and an n-value as a POD for
the human probit function.
3.2.1 Probit calculation for individual eligible studies For each of the studies that passed the steps outlined in Section 3.1, the concentration-time-response (C×t) data in the animal experiment are analysed with a multivariate probit model. Single exposure studies with exposure durations between 10 and 240 minutes are preferred. Concentration and exposure duration are transformed
logarithmically (based on the natural logarithm). Deviations from this principle must be motivated. Studies with a range of exposure concentrations and durations can be designed as:
1. A series of LC50 experiments, in which the concentration-lethality
curve was assessed for a number of exposure durations. 2. (One or) a number of fixed concentration levels with varying
exposure durations (old LT50 studies or recent C×t studies
respectively).
Both types of datasets can be analysed identically. For exposure durations of less than 3 times t95, the calculations are performed with
the adjusted exposure concentrations.
If only concentration-response data (for one exposure duration) or time-response data (for one exposure concentration) are available, these can be analysed following the same strategy and using the same software. Obviously, if the exposure duration is not equal to 30 minutes, the LC50
and comparison of sex differences must be calculated for the tested exposure duration.
Sometimes information on a covariate (such as sex) is available for analysis. Depending on the circumstances, the covariate can be included in the analysis. The analysis of sex differences in the response is
1. An analysis with male and female data and sex as a (dummy) covariate. This approach enables easy testing of the statistical significance of any sex difference. Based on this analysis, an LC50
for each of the sexes can be calculated.
2. An analysis of the data of each sex separately and the calculation of an LC50 for each sex.
Sex differences are disregarded and data are pooled, unless the following conditions are met:
The 30 minute LC50 differs more than a factor 2 between the
sexes;
The sex difference is statistically significant.
If a sex difference is found and there is no clear explanation for gender-related differences, then data from the most susceptible sex are used to derive the human probit function. No gender-specific probit functions are derived.
Sometimes the inclusion of cross-terms to assess statistical interaction between parameters or a threshold response level (concentration or time) can improve overall model fit. The Panel only accepts the results of such complex models with a very strong, mechanistically based rationale (i.e. it should not be used merely for model fit improvement). Software programs available for calculating the model parameters of the presented multidimensional probit function are Doseresp (Ten Berge, 2015) and the Benchmark Dose Software BMDS (US EPA, 2015). These software packages can be downloaded and installed on a local computer, and produce almost identical parameter estimates. These software packages are the preferred statistical modelling tools to derive probit functions. Besides the software mentioned above, these probit models can be built using most statistical software packages.
The objective of modelling the concentration-time-response function is to assess the values of the parameters a, b and n. Using the derived substance-specific model, the animal LC50 value is determined. Such a
calculation must be made for all ‘A’ and ‘B’ quality studies (see Section 2.3).
If applicable, separate probit functions are calculated for different sexes and animal species. In a study with multiple species, this step treats the data from each species as a separate study. Each study description in the TSD will present:
1. A table with study characteristics to aid in deciding about the study quality and a clear rationale for the assigned study quality. 2. A table presenting the raw data, specified by observed (and
adjusted, if applicable) exposure concentration and duration, the group size and number of fatalities, and the animals’ sex and species.
3. The probit function per sex, with all data pooled (using a dummy to identify the groups and an indication of the statistical
significance of the dummy variable). 4. A graph including:
b. the Maximum Likelihood Estimate (MLE) of the LC50 curve
over the tested time range, if possible.
5. LC50 values for 10, 30 and 60 minutes for each of the sexes and
for the sexes or species combined.
6. An evaluation of the significance of sex differences and a rationale for combined or separate analysis of the data. 3.2.2 Exploring the analysis of pooled data
Sometimes acute inhalation exposure data are available from more than one study or more than one animal species. In such cases, the
procedure below describes whether or not multiple studies can be pooled in the analysis.
As a next step to evaluate the total body of data, lethality data from single species are presented as follows per species:
For each species, a single table listing the probit functions and the LC50 values for 10, 30 and 60 minutes in a way that allows
identification of individual studies.
For each species, a single figure with data points and an assessment of the LC50 values over time in a way that allows
identification of individual studies.
If data from two or more species are available, the species-specific tables and figures mentioned above are then combined into a single table and figure to represent all data that passed the quality criteria from step 2. Since allometric scaling between species is believed to be implicitly included when comparing exposure concentrations of
inhalation studies with different species, no further adjustment is needed.
Analysis of pooled data
Based on the numerical and visual information, an expert-based assessment is made to determine whether the body of data is likely to converge. Convergence is believed to be likely if all available LC50 values
for the same exposure duration fall within one order of magnitude from each other and the slopes of the LC50-time curves are roughly parallel.
Three situations may occur:
1. Data from different studies and different species (including species other than rodents) show convergence. In this case, the differences between species are probably limited and animal data are generally thought to reflect the LC50 value and n-value in
humans well. In these cases, the LC50 values and n-values of all
qualifying studies are used to assess a PoD for the human probit calculations.
2. Clear differences are apparent in susceptibility or C x t
relationships between species. In this case, discussion should focus on which species and/or data are the most relevant for derivation of the human probit function. The study selection criteria may include anatomical or physiological resemblance and (dis)similarities in metabolism of the animal species in relation to humans, the number of animals in the study or other aspects of study robustness, relevant exposure duration, etc. In general, the response levels themselves (e.g. LC50 values) do not qualify
3. If the assessment above does not produce a logical species or study that should be used for human probit derivation, no information is available to define which data are the most relevant for the derivation of a human probit function. In this case, the most susceptible species is used for deriving a probit for humans as a default method. A sufficiently justified deviation from this procedure is possible and will be made on the basis of expert judgment.
For all three possible outcomes, one or more studies may qualify to serve as a PoD for the human probit calculations. If two or more studies qualify equally, the LC50 value and n-value can be estimated as a
weighted average of the eligible LC50 values and n-values. The weight is
inversely proportional to the confidence interval of the LC50 value or the
n-value from the study, as outlined in the probit excel worksheet. The data selected to calculate the LC50 values and n-values as a PoD for
human probit assessment are selected on the basis of the criteria outlined above and the inclusion or exclusion from further analysis is clearly justified.
3.2.3 Derivation of a point of departure for the human probit function
A human probit function will be derived with 2 points of departure (PoD): an LC50 value for a specified
exposure period and an n-value. The studies and data that were selected in Section 3.2.2 are used to derive these parameters. Data from rat studies are used frequently because of the large database and because rats are the preferred species in the OECD 403 test guideline. The TSD format provides
standard text for the identification of the key study (studies), the LC50 value and a rationale for this
choice. The DoseResp worksheet template (available from the RIVM website) can be used to calculate the (weighted) LC50 value.
LC50 values from secondary sources or databases without raw
exposure-time-lethality data are not acceptable as a PoD for probit derivation. In the absence of inhalation toxicity data, probit derivation from oral toxicity data will only be considered if:
Human data establish that the mode of action from inhalation exposure is driven by systemic toxicity;
It can reasonably be excluded that serious respiratory system toxicity precedes death in humans;
A validated PBPK (or PK) model is available to support the route-to-route extrapolation.
The n-value calculated from the animal data is assumed to be a chemical-specific characteristic of the exposure-time-response
relationship and is assumed to be valid for humans, in part because the lack of a credible alternative. All of the data selected for the final
analysis using the criteria outlined in Section 3.2.2 are used in the final calculation of the probit parameters n and b.
1. If more than one eligible C×t or other studies are selected using the criteria outlined in Section 3.2.2, a justified choice is made to either derive the n-value from a single study or as a weighted average n-value of multiple studies. The weight is inversely proportional to the 95% confidence interval of the n-values. A calculation tool is included in the calculation template that is available from the RIVM website.
2. If only one eligible C×t study is available (i.e. with ≥3 exposure durations and ≥ 3 exposure concentrations/duration and sufficient variation in lethal responses), the n-value is selected from this C × t study.
3. If no C×t study or set of other eligible studies is available to derive a probit function, an n-value derived for a structurally similar and, mechanistically, similarly acting chemical can be used. Substitution of the n-value with an n-value of another compound will only be accepted if the substitute n-value itself is robust and if the validity of the substitution is sufficiently justified.
If none of the three conditions above apply, an n-value of 2 is assumed for humans over the whole range of exposure durations (10 minutes to 8 hours).
Based on the assumption that (b×n) = 2, the value of b can be calculated as 2/n. See also the explanation given in Section 3.6 about the product (b×n) = 2 based on assumed intra-species variability. For each of the available acute toxicity studies, an LC50 value is
calculated, being statistically the most reliable response estimate (preferably for a 30 minute exposure). If the studies are not equally suitable, the LC50 value of the most appropriate study is used. 3.3 Interspecies extrapolation
For obvious reasons, human probit functions will generally be based on lethality data in animal species. Species will vary in susceptibility and therefore show differences in response. If no substance-specific data are available on differences in susceptibility between experimental animals and humans, which is usually the case, the application of an interspecies extrapolation factor is required. The point of departure (PoD) for the derivation of a human probit function will be an experimental animal LC50 value. To this value, an interspecies
extrapolation (assessment) factor will be applied to derive an estimated human LC50 value.
Differences between species can be subdivided into two different aspects: differences in body size and differences in biokinetics and biodynamics. Experience reveals that equal doses of a chemical (expressed as mg/kg of body weight) generally result in more severe toxic effects in larger animals, an observation that cannot be explained by only assuming a greater susceptibility. It appears that a biological response following exposure to a xenobiotic substance depends on the
rate of physiological processes, e.g. the metabolic rate (US EPA, 1992; Kalberlah and Schneider, 1998). The rate of these processes is inversely related to body size. Differences in body size can be accounted for by allometric scaling, which refers to the empirical observation that several anatomical body compartments and physiological processes scale according to the allometric equation:
Equation 6 Allometric equation
in which y is some biological response (here the LC50), a is a constant of
proportionality, BW is body weight and p is the allometric scaling power (Adolph, 1949). A certain dose in animals can be extrapolated to a (toxicologically) equivalent dose in humans by dividing this dose by the allometric scaling factor (ASF) that can be calculated by:
Equation 7 Determination of the Allometric Scaling Factor
The allometric scaling factor should not be regarded as a ‘safety factor’ and an additional factor may be needed to account for interspecies differences in biokinetics and dynamics.
Several studies on interspecies differences in response following oral exposure have been published, in which NOAELs for a chemical observed in different animal species were compared (Dourson et al., 1992;
Rennen et al., 2001; Schneider et al., 2004; Travis and White, 1988; Vermeire et al., 1999; Watanabe et al., 1992). These studies show that, after application of an ASF, the animal species were on average equally susceptible.
Rhomberg and Wolff (1998) have a different point of view, suggesting that single and repeated dosing regimens may have different scaling properties for severe toxic effects. They reported a stronger support for cross-species extrapolation on a body weight basis (p=1) for single exposures. But they compared LD50 values obtained from the RTECS
database that – as also acknowledged by Rhomberg and Wolff – only reports the lowest reported LD50 in literature for any species. Schneider et al. (2004) showed that this bias results in a shift towards a higher value for p (closer to 1). Using geometric mean LD50 values, they
concluded that cross-species extrapolation in single exposure regimens is also in line with allometric scaling (p=0.75).
A study in which rats and mice were compared for differences in susceptibility based on benchmark dose (BMD) values confirmed these findings (Bokkers and Slob, 2007). In addition, a study on a comparison of different kinetic parameters in different animal species (e.g. Cmax, t½) showed similar results (Kalberlah and Schneider, 1998). Overall, the evidence leads to the conclusion that, after application of an allometric