Report 630053001/2010 E.E.M.M. van Kempen et al.
Exchanging car trips by cycling in
the Netherlands
RIVM Report 630053001/2010
Exchanging car trips by cycling in the Netherlands
A first estimation of the health benefits
E.E.M.M. van Kempen, RIVM, National Institute for Public Health and the Environment
W.Swart, RIVM, National Institute for Public Health and the Environment
G.C.W. Wendel-Vos, RIVM, National Institute for Public Health and the Environment P.E. Steinberger, RIVM, National Institute for Public Health and the Environment A.B. Knol, RIVM, National Institute for Public Health and the Environment H.L. Stipdonk, SWOV, Institute for Road Safety Research
M.C.B. Reurings, SWOV, Institute for Road Safety Research
Contact:
Elise van Kempen
Centre for Environmental Health Research (MGO) Elise.van.Kempen@rivm.nl
This investigation has been performed by order and for the account of the Ministry of Housing and Spatial Planning and the Environment, within the framework of 'Effecten Duurzaam Verkeer' (M/630053)
© RIVM 2010
Parts of this publication may be reproduced, provided acknowledgement is given to the 'National Institute for Public Health and the Environment', along with the title and year of publication.
Abstract
Exchanging car trips by cycling in the Netherlands A first estimation of the health benefits
As commissioned by the Dutch Ministry of Housing, Spatial Planning and the Environment, we assessed the possible health benefits of the substitution of short-distance car trips with short-distance cycling trips. To this end we used existing methods for Health Impact Assessment and evaluated the availability and quality of data, models and tools that were needed.
In our assessment not only the classic environmental pollutants noise and air pollution were taken into account, but also the effects on road safety and physical activity. Application shows that the disease burden related to physical activity reduces at a maximum of 1.3% after one year. As expected, the health benefits due to reduction in road traffic noise levels and traffic-related air pollution are relatively small. Furthermore, it appears that an exchange of short-distance car trips by cycling is only beneficial for young male drivers.
Since a lot of information was unavailable and/or unknown and because a lot of choices and assumptions were made, the results have to be seen as a first estimate of what can be expected of interventions that cause an exchange between short-distance car trips with cycling. This study is a follow-up on earlier exemplary assessments of transport interventions.
The reliability of our assessment can be improved if we can obtain better information on population exposure distributions of noise and air pollution; it is also important to validate the modelled decrease in traffic noise, air pollution and changes in behaviour by means of measurements.
Trefwoorden / Key words:
Health Impact Assessment, cycling, traffic-related air pollution, road traffic noise, transport, road safety, physical activity
Rapport in het kort
Het vervangen van korte autoritten door fietsritten Een eerste schatting van de gezondheidsbaten in Nederland
In opdracht van het ministerie van VROM is onderzocht hoe de mogelijke gezondheidsbaten van het vervangen van korte autoritten door fietsritten geschat kunnen worden. Hiervoor zijn bestaande methoden voor Health Impact Assessment gebruikt en is bekeken of de benodigde data, modellen en instrumenten aanwezig en van voldoende kwaliteit zijn.
In de studie worden niet alleen de klassieke milieufactoren als geluid en luchtverontreiniging meegenomen, maar ook verkeersveiligheid en bewegen. Toepassing laat zien dat de ziektelast door lichamelijke inactiviteit na 1 jaar met maximaal 1,3% wordt gereduceerd als volwassenen meer fietsen. Zoals verwacht, zijn de gezondheidsbaten ten gevolge van een afname van de niveaus door geluid van wegverkeer en verkeersgerelateerde luchtverontreiniging relatief klein; verder bleek het vervangen van korte autoritten door fietsritten alleen voordelig te zijn voor jonge mannen.
Gezien het grote aantal aannames en onzekerheden, moeten de resultaten worden gezien als een eerste inschatting van wat mogelijk kan worden verwacht van interventies die ervoor zorgen dat mensen de fiets nemen in plaats van de auto. Deze voorbeeldstudie is een vervolg op eerdere studies waarin de effecten van snelheidsreductie en de aanleg van een nieuwe snelweg werden geëvalueerd.
Uit de studie blijkt dat de betrouwbaarheid van de berekeningen kan worden verbeterd wanneer er betere informatie is over de verdeling van verkeersgerelateerde luchtvervuiling en geluid over de populatie. Ook is het belangrijk om de gemodelleerde vermindering van verkeersgeluid en luchtvervuiling en de gedragsveranderingen te valideren door middel van metingen.
Trefwoorden / Key words:
gezondheidseffectschatting, fietsen, verkeersgerelateerde luchtverontreiniging, geluid van wegverkeer, bewegen, verkeersveiligheid, transport
Acknowledgement
The authors gratefully acknowledge the comments and suggestions of Paul Fischer (MGO), Jantine Schuit (PZO), Nancy Hoeymans (VTV) and Rudolf Hoogenveen (EMI).
Contents
Summary 11 Samenvatting 13
1 Introduction 15
1.1 Aim 16
2 Cycling and health 19
2.1 Some facts about cycling in the Netherlands 19
2.2 Car mobility in the Netherlands 21
2.3 The potential health benefits of cycling 22
2.3.1 Traffic-related air pollution 22
2.3.2 Road traffic noise 23
2.3.3 Physical activity 23
2.3.4 Road safety 23
3 Methods 25
3.1 Selection of health endpoints 26
3.2 Assessment of population exposure 27
3.2.1 Population at risk 27
3.2.2 Population exposure in the reference situation 28
3.2.3 Change in exposure 29
3.3 Identification of exposure-effect relations 32
3.4 Estimation of the attributable number of cases and the
disease burden 34
3.4.1 The attributable number of cases 34
3.4.2 The disease burden 35
3.5 Uncertainty analysis 36
4 Results 37
4.1 The possible health benefits of cycling 37
4.2 Sensitivity analysis 39
5 Discussion 43
5.1 Traffic-related disease burden and health benefits attributable
to cycling 43
5.1.1 Traffic-related air pollution 43
5.1.2 Road traffic noise 45
5.1.3 Physical activity 46
5.1.4 Road safety 48
6 Conclusions and recommendations 51
6.1 Conclusions 51
References 53 Appendix I. The effect of an exchange of short-distance car trips on
road safety: basic backgrounds 61 Appendix II. The second National Survey in General Practice and
change in activity patterns 63 Appendix III. Calculation of the disease burden 65
Appendix IV. The Chronic Diseases Model 67
Appendix V. Gaps and uncertainties 69
Summary
Background
As a follow-up to earlier exemplary assessments of transport interventions, the Dutch Ministry of Housing, Environmental and Spatial Planning (VROM) commissioned the National Institute for Public Health and the Environment (RIVM) to evaluate the health benefits of bicycle interventions. For the purposes of this study, we estimated the health benefits of a substitution of a fraction of car trips by bicycle trips in the Netherlands. Thereby, we only included short car trips: trips with a distance up to 7.5 km.
Objectives
The main objectives of the present study were:
to assess the possible health benefits of the substitution of distance car trips with short-distance cycling trips in the Netherlands; and
to evaluate the availability and quality of data, models and tools that were necessary to estimate the health benefits of this transport scenario.
Method
In order to estimate the health benefits of substituting short-distance car trips by short-distance cycling trips, we compared the disease burden resulting from the following two scenarios:
1. Reference situation: the disease burden at the moment that none of the short distance-car trips was substituted by cycling: which is in fact the current situation.
2. Alternative scenario: the disease burden at the moment that a specific fraction of the short distance-car trips is substituted by cycling trips. Different sub-scenarios with alternative fractions were evaluated.
In both scenarios, we evaluated the impact of the change in traffic-related air pollution, road traffic noise, road safety and physical activity on the disease burden expressed in Disability-Adjusted Life Years (DALYs). The methodology used to assess the effects of both scenarios was based on common procedures for environmental health risk assessment.
For estimating the burden of disease due to road traffic noise, transport-related air pollution, physical activity and road safety, several types of data were needed such as population exposure distributions, exposure-response relations and morbidity and mortality data for the different transport-related health endpoints. For the calculation of the number of years lived with disease (YLD), data were needed on the duration of the disease and disability weights expressing the severity of the different health endpoints.
Results and conclusions
Substitution of short-distance car trips with cycling can improve public health: it is estimated that the disease burden related to physical (in)activity reduces at a maximum of 1.3% after one year, this is a large effect compared to the effects of achieving the aims of the Dutch National Action Plan for Sports and Physical Activity. As expected, the health benefits due to reduction in road traffic noise levels and traffic-related air pollution are relatively small. A possible health deficit could come from a higher risk of accidents; it appears that an exchange of short-distance car trips by cycling is only beneficial for young male drivers. Since a lot of information was unavailable and/or unknown, the results have to be seen as a first estimate of what can be expected of interventions that cause an exchange between short-distance car trips with cycling.
The integrated approach used in the present study links up with Dutch policy documents such as ‘The National Action Plan on Environment and Health’, and ‘Opting for a healthy life’ in which the Dutch government presents a number of targets that can contribute to the promotion of public health and the prevention of public health problems in the Netherlands.
The reliability of our assessment can be improved if we obtain better information on population exposure distributions of noise and air pollution; it is also important to validate the modelled decrease in traffic noise, air pollution and changes in behaviour by means of measurements.
Samenvatting
Achtergrond
In opdracht van het ministerie van VROM is onderzocht hoe de mogelijke gezondheidsbaten van het vervangen van korte autoritten door fietsritten geschat kunnen worden. Dit is een vervolg op eerdere studies waarin de effecten van snelheidsreductie en de aanleg van een nieuwe snelweg werden geëvalueerd.
Doel
De belangrijkste doelstellingen van deze studie waren:
het schatten van de gezondheidsbaten die in Nederland optreden ten gevolge van het vervangen van korte autoritten door fietsritten;
beoordelen in hoeverre de benodigde data, modellen en instrumenten aanwezig zijn en van voldoende kwaliteit zijn
Om een schatting te maken van de gezondheidsbaten die optreden ten gevolge van het vervangen van korte autoritten door fietsritten, is de ziektelast van de twee onderstaande scenario’s met elkaar vergeleken:
1. Referentie situatie: de ziektelast op het moment dat nog geen van de korte autoritten is vervangen door fietsritten.
2. Alternatief scenario: de ziektelast op het moment dat een fractie van de korte autoritten is vervangen door fietsritten.
Omdat het moeilijk is te bepalen welk deel van de korte autoritjes nu door fietsritjes kan worden vervangen zijn verschillende fracties bekeken. Om een schatting van de ziektelast (uitgedrukt in Disability-adjusted Life Years) te maken zijn bestaande methoden voor Health Impact Assessment gebruikt. In de studie worden niet alleen de klassieke milieufactoren als geluid en luchtverontreiniging meegenomen, maar ook verkeersveiligheid en bewegen. Voor de berekening van de
transportgerelateerde ziektelast zijn verschillende soorten gegevens nodig: populatie
blootstellingverdelingen, blootstellingrespons relaties, en morbiditeits- en mortaliteitsgegevens van de verschillende transportgerelateerde gezondheids eindpunten. Voor de berekening van het aantal jaren doorgebracht in verminderde gezondheid, waren behalve wegingsfactoren die de ernst van de verschillende gezondheidstoestanden uitdrukten, ook gegevens nodig over de duur van deze gezondheidstoestanden
Resultaten en conclusies
Toepassing laat zien dat de ziektelast door lichamelijke inactiviteit na 1 jaar met maximaal 1,3% wordt gereduceerd als volwassenen meer fietsen. In vergelijking met de effecten van het ’Nationaal Actieplan Sport en Bewegen’ is dit een groot effect. Zoals verwacht zijn de gezondheidsbaten ten gevolge van een afname van de niveaus door geluid van wegverkeer en verkeersgerelateerde luchtverontreiniging relatief klein; verder bleek het vervangen van korte autoritten door fietsritten alleen voordelig te zijn voor jonge mannen. Gezien het grote aantal aannames en onzekerheden, moeten de resultaten worden
gezien als een eerste inschatting van wat mogelijk kan worden verwacht van interventies die ervoor zorgen dat mensen de fiets nemen in plaats van de auto.
De integrale aanpak in deze studie sluit goed aan bij het ‘Nationale Aanpak Milieu en Gezondheid, 2008-2012’ en de ‘Preventienota Kiezen voor Gezond Leven’ waarin het kabinet een aantal speerpunten presenteert ter verbetering van de volksgezondheid en ter preventie van volksgezondheidsproblemen in Nederland.
Uit de studie blijkt dat de betrouwbaarheid van de berekeningen kan worden verbeterd wanneer er betere informatie is over de verdeling van verkeersgerelateerde luchtvervuiling en geluid over de populatie. Ook is het belangrijk om de gemodelleerde vermindering van verkeersgeluid en luchtvervuiling en de gedragsveranderingen te valideren door middel van metingen.
1
Introduction
As a continuation of the fourth Ministerial Conference on Environment and Health [1], the Dutch Ministry of Housing, Environmental and Spatial Planning (VROM) commissioned the National Institute for Public Health and the Environment (RIVM) to start a project on ‘Sustainable traffic’, which aims to assess and integrate the potential health aspects of transport interventions for air pollution, noise, physical activity and road safety in order to identify measures that most effectively reduce the traffic-related disease burden in the Netherlands.
The qualification and quantification of transport-related health aspects can be carried out by means of a Health Impact Assessment (HIA), which is a ‘combination of procedures, methods and tools by which a policy, programme or project may be judged as to its potential effects on the health of a population, and the distribution of those effects within the population’ [2, 3].
Although it has been widely agreed upon that HIA can be a useful tool for evaluating and comparing transport policies and interventions, studies quantifying the transport-related disease burden [4, 5] and/or the health benefits of transport interventions [6-10] are scarce. In most cases only the effects of the more classical environmental exposures such as air pollution are included or studies are looking more at lifestyle aspects such as physical activity.
Despite the fact that several reviews have been published describing adverse and beneficial health effects of motorised transport – ranging from loss of life expectancy by air pollution to social effects related to mobility [11-13], it is difficult to compare the different health effects resulting from specific policy options. In addition, it becomes more and more clear that physical and social aspects are interwoven and as such strongly affect our living environment. Think of, for example, the possibilities for cycling and walking, the opening up of a neighbourhood and the conjugated traffic-related emissions.
Following Figure 1, health behaviour, such as cycling and walking, is determined by an interrelated set of personal and environmental factors. The model is based on Fishbein and Ajzen’s model of reasoned behaviour and Bandura’s concept of self-efficacy [14]. In this theoretical model, attitudes, social norms and self-efficacy predict the intention to behave in a certain way, which in turn predicts the behaviour. Personal characteristics (for example gender, age and educational level) influence these determinants of behaviour. Barriers and skills determine if, when or why the intention is turned into behaviour [14]. An important set of barriers lies within the environment or moreover, in the interaction between
individuals and their environment. Both the actual environmental factors and the perception of these factors are of importance [15].
Personal characteristics
Attitude
Self-efficacy
Social norms Intention Behaviour
Barriers
Skills Figure 1: The determinants of behaviour model [14].
The underlying report is a follow-up study on an earlier exemplary assessment of a transport
intervention carried out in 2005: an estimation of the possible health benefits of speed limit reduction at nine highway sections in urban areas [16]. At the same time, the effects of traffic re-allocation from a densely to a less densely populated area by the introduction of a new highway section were evaluated [17]. One of the recommendations in these earlier assessments was to evaluate the health benefits of another transport (policy) intervention in the Netherlands: the health benefits of bicycle interventions. This was considered meaningful because it was expected that this intervention not only affects levels of traffic-related noise and/or air pollution, but also road safety. One of the important benefits from cycling comes from its contribution to overall levels of physical activity [18]. As such, the importance of cycling as a means to achieve greater sustainability of public health is more and more recognised [11 in: 18].
1.1
Aim
The primary objective of the present study was to assess the possible health benefits of the substitution of short-distance car trips with short-distance cycling trips in the Netherlands. We estimated the impact on traffic-related air pollution, road traffic noise, road safety and physical activity in several theoretical scenarios. By doing so, we furthermore evaluated the availability and quality of data, models and tools that are necessary to estimate the health benefits of these transport scenarios.
The outcome of this report can be helpful since there is a need to promote healthy and sustainable transport alternatives as a way to prevent the negative impacts of transport systems on human health. One important way to do this is to ensure that health issues are clearly on the agenda when transport decisions are being made and policies formulated [87]. Furthermore, the integrated approach used for our assessment links up with Dutch policy documents such as ‘The National Action Plan on
Environment and Health’ (‘Nationale Aanpak Milieu en Gezondheid 2008-2012’ in Dutch) [19], and ‘Opting for a healthy life’ (‘Preventienota Kiezen voor Gezond leven’ in Dutch) [20] in which the Dutch government presents a number of target areas that can contribute to the promotion of public health and the prevention of public health problems in the Netherlands. Important spearhead areas that are mentioned in these policy documents are: healthy design and layout of the living environment, healthy mobility and obesity (physical activity and nutrition). One of the ways to contribute to these
spearheads is the improvement and extension of existing instruments such as health impact assessment (HIA). In addition, the Dutch Government wishes to promote ‘the healthy choice’ by arranging society in such a way that the healthy choice indeed becomes the easy one. This means, for example, that our living environment should invite people to be more physical active.
As one of the inputs for our assessment, we commissioned SWOV Institute for Road Safety Research to estimate the effect of a mobility shift from the car and the bicycle on road safety. The main results are presented in this report. More details on the traffic safety-related part of this assessment can be found elsewhere [21].
Before we present the different steps of our assessment (chapter 3), we give an overview of the potential health benefits of cycling in relation to the environment (chapter 2). Results are presented and discussed in chapters 4 and 5. Finally, recommendations are given for future assessments and the continuation of this project.
2
Cycling and health
2.1
Some facts about cycling in the Netherlands
In the Netherlands, cycling is one of the most important means of transportation. In 2005, on average, the Dutch population chose to use their bicycle for 27% of their journeys. Women cycle somewhat more often than men; on average, men cycle longer distances. After the age of 18 years, the use of the bike decreases (see also Figure 2). A possible reason might be the fact that the driving licence comes within reach. Until the age of 70, the use of the bicycle is rather stable; only among middle-aged people there is a small pick up. Among people of 70 years and older, the use of the bike decreases drastically [22]. 0 1 2 3 4 5 18 to 20 yrs 20 to 25 yrs 25 t o 30 yrs 30 to 4 0 yr s 40 to 50 yrs 50 to 60 yrs 60 to 65 yrs 65 to 7 5 yr s 75 yr s an d o lder Age category A v e rage di st a n c e b y bi k e pe r pers on per da y Men Women
Figure 2: The average distance travelled per person per day by bike in the Netherlands in 2005 (derived from MON 2005 [23]).
Together with Denmark and Germany, which have a bicycle share of 19% and 10% respectively, the Netherlands has the highest bicycle use in Europe. In countries such as France and the United Kingdom, the bicycle share is approximately 5% and 2%, respectively [24].
Although cycling is a very popular activity in the Netherlands, it is not equally prevalent all over the country. In cities with the highest bicycle usage rates (e.g. Groningen and Zwolle), inhabitants chose the bicycle for 35-40% of their journeys; in cities with the lowest bicycle use rates (e.g. Rotterdam and Heerlen) inhabitants chose the bicycle for 15-20% of their journeys [24].
For short distances, the contribution of the bicycle is high: In 2005, 35% of all trips up to 7.5 km were made by bicycle (see also Figure 3).
0 10 20 30 40 50 60 70 80 90 100 0 - 7.5 km 7.5 - 15 km > 15 km Distance % Other Bicycle Public transport Car
Figure 3: Journeys according to transportation means and distance category in the Netherlands in 2005 (Source: MON, 2005 in: [24]).
Most short distance bike trips are made by persons aged 35-49 years. Among persons of 65 years and older, the number of short-distance bike trips decreases drastically.
0 200000 400000 600000 800000 1000000 1200000 18-19 yrs 20-24 yrs 25-29 yr s 30-34 yr s 35-39 yr s 40-44 yrs 45-49 yr s 50-54 yr s 55-5 9 yr s 60-64 yr s 65-69 yrs 70-74 yr s 75-79 yr s 80 y rs an d o lder N u m b e r of short -d ist a nc e bike trips
Figure 4: The number of short-distance bike trips (0-7.5 km) in the Netherlands in 2005 in relation to age (derived from MON 2005 [23]).
2.2
Car mobility in the Netherlands
People in the Netherlands use their cars more and more: in 2005 car drivers travelled almost
95 milliard kilometres on Dutch roads; this is almost 6 milliard kilometres more than in 2000 [25]. In 2005, the Dutch car driver travelled 16 kilometres per day [25]. Figure 5 shows the distance travelled per day by car drivers for men and women separately. After the age of 18 years, the use of the car increases; between the ages of 30 and 50, people’s car use is highest.
0 5 10 15 20 25 30 35 40 45 18 to 20 y rs 20 to 25 y rs 25 to 30 yrs 30 to 40 y rs 40 to 50 y rs 50 to 60 y rs 60 to 65 y rs 65 to 75 y rs 75 yr s an d ol der Age category A v e ra g e di s ta n c e by c a r pe r pe rs on pe r da y Men Women
Figure 5: The average distance travelled by car per person per day for men and women in the Netherlands in 2005 (derived from MON 2005 [23]).
A relatively large proportion of car trips have a distance shorter than 7.5 km. Figure 3 shows that in 2005, almost 35% of all trips up to 7.5 km were made by car. Between 1986 and 2006 the number of short-distance car trips has hardly changed: on average, a person makes about 220 short-distance trips per year [22]. The number of short distance car trips is still higher among men compared to women. However, since more women have a driving license, this difference is becoming smaller [22].
As far as age is concerned, most short-distance car trips are made by persons aged 30-49 years (see also Figure 6). Among persons of 65 years and older car use decreases drastically. At the same time, Figure 6 also demonstrates that during the last 20 years the number of short-distance car trips has been increased extensively among people of 65 years and older. This increase is partly associated with the increase in the number of elderly people and with the fact that elderly drive more kilometres per day
[25]. A striking observation is the fact that the number of short-distance car trips increases among people aged 40-49 years, while this decreases among people aged 30-39 years.
0 50 100 150 200 250 300 350 18 - 19 yr 20 - 29 yr 30 - 39 yr 40 - 49 yr 50 - 64 yr 65 yr and older Age category Num b e r o f short-d is tance car t ri p s p e r p e rson per y ear 1986 1996 2006
Figure 6: The number of short-distance car trips per person per year for the different age categories in 1986-2006 (Source: Olde Kalter, 2007 [22]).
2.3
The potential health benefits of cycling
The main health benefits of cycling come from its contribution to overall levels of physical activity. However, the benefits of cycling do not stop at improving physical and mental health but also extend to benefits to the wider public health, by reducing the adverse impacts associated with motor traffic [18], e.g., health effects related to air pollution and noise or road crashes.
2.3.1
Traffic-related air pollution
Pollution from motorised traffic is an important health hazard: it is responsible for the release of hundreds of chemical compounds that can affect health into the atmosphere. From a health perspective, important pollutants stemming from traffic are particulate matter, nitrogen dioxide, carbon monoxide, polycyclic aromatic hydrocarbons, benzene and metals emissions.
Transport-related air pollution is associated with a number of health outcomes [26]: it increases the risk of both morbidity and mortality, particularly from cardiopulmonary causes; furthermore, transport-related air pollution has been associated with several other adverse health outcomes, including cancer and birth outcomes.
The replacement of short-distance car trips can have a greater impact on air pollution than would be expected at first sight, as in the first kilometres travelled after starting a cold engine, more pollutants are emitted than at the equivalent distance driving with a warm engine [22].
2.3.2
Road traffic noise
Most types of motorised transport generate noise. As such, road transport is one of the most important sources of community noise. With regard to noise emitted by motorised vehicles, noise arises from 3 sources: propulsion noise (engine, power train, exhaust and intake systems), tyre/road contact noise (rolling noise) and aerodynamic noise. The first is dependent on the operation and speed of the engine and includes noise related to the combustion process, gas flow and mechanical noise. The second refers to the speed of the vehicle and is mainly related to the noise generated by the tyre/road interaction. Propulsion noise is the dominant source at lower speeds (under 30 km/hr for passenger cars), and under conditions of acceleration when engine speeds tend to be relatively high. Tyre/road surface interaction noise tends to dominate at moderate and high road speeds; aerodynamic noise becomes louder as a function of the vehicle’s speed [27].
Noise is considered an environmental stressor that is purported to have adverse effects on health and well being. These include not only community responses such as annoyance and sleep disturbance, but also physiological effects resulting in, for example, cardiovascular disease [28].
2.3.3
Physical activity
There is international consensus on the value of regular, moderate-to-vigorous intense physical activity [29-31]. Cycling is an example of an activity with such intensity. Therefore, cycling is considered to be the ideal way to meet the necessary levels of activity, as it is one of the few activities of sufficient intensity that may be incorporated into the activities of daily life [18, 32]. In the Netherlands, cycling is already the activity that contributes most to the total time spent on moderate-to-vigorous physical activity [33].
Many benefits could theoretically be expected from, for example, the realisation of amenities at walking and cycling distance, the construction of sufficient safe footpaths and cycle tracks in the neighbourhood, making it more attractive to travel (part of) the distance between home and work by bike or on foot. It appears that in an environment with a lot of cycle tracks, short cycling distances and low hills, people cycle more [34]. Studies investigating people’s travel behaviour show that an infrastructure where the distance between shops and other amenities and people’s homes is short, people are more willing to visit these amenities by walking and/or cycling [35]. Since there is a substantial increase in car dependency for travelling short distances, there is considerable capacity to increase physical activity through substituting short car journeys with cycling and/or walking [1].
2.3.4
Road safety
Determining the effect on road safety of a mobility exchange between car and bicycle may not be all that straightforward. Firstly, many properties of short distance car and bicycle trips that predict the risk on injury and/or fatality are unknown: which type of roads are used by cars and/or bicycles (e.g., 50 km/hr, 30 km/hr roads, cycling lanes), what time of day and what kind of people engage in short-distance car and/or cycling trips. Secondly, a given car trip will probably not be replaced by a bicycle trip along exactly the same route. Thirdly, it may be expected that the substitution of short-distance car trips with short-distance bicycle trips will be more successful in regions where there (already) is a good bicycle infrastructure (Stipdonk et al., in prep). In addition, there are people who think that increasing cycling can improve safety among cyclists because it is assumed that cycling becomes safer when it becomes more common [18].
3
Methods
For the purposes of this study, we estimated the health benefits of a substitution of a fraction of car trips by bicycle trips in the Netherlands. Thereby, we only included short car trips: trips with a distance of up to 7.5 km. In order to estimate the health benefits of substituting such short-distance car trips by short-distance cycling trips, we compared the disease burden resulting from the following two scenarios:
1. Reference situation: the disease burden at the moment that none of the short distance-car trips was substituted by cycling: which is in fact the current situation.
2. Alternative scenario: a specific fraction of the short distance-car trips is substituted by cycling trips. Different sub-scenarios with alternative fractions are evaluated.
The outcomes of the alternative scenario were compared with the reference situation. In all scenarios, we evaluated the impact of the change in traffic-related air pollution, road traffic noise, road safety and physical activity on the disease burden.
Figure 7: Scheme of data used, calculations made and steps taken in order to assess the disease burden due to the substitution of short-distance car trips by cycling trips (adapted from [36] and [16]). The numbers indicate the section in this report that describes the step briefly.
Selection of health endpoints section 3.1 Assessment of population exposure section 3.2 Identification of exposure-effect relations section 3.3 Estimation of the number of cases section 3.4.1 Calculation of the disease burden section 3.4.2 Population density, modeled or measured exposure levels, population at risk Meta-analysis, pooled analysis epidemiological studies Prevalence, incidence data, demographics Severity weights duration Change in air pollution concentrations and noise levels and change in activity behaviour
INPUT
HIA-PROCESS
EFFECT OF POLICY
Change in risk on road crashesFigure 7 summarises the methodology and data which was used to assess the effects of both scenarios. It is based on common procedures for environmental health risk assessment [36] and adapted for transport-related health impact assessment [16]. We identified five steps in our assessment, which are described briefly below; more details can be found in Appendices I, II, III and IV. Steps 2 to 5 were performed twice, to estimate the disease burden before and after the substitution of short-distance car trips by cycling trips.
3.1
Selection of health endpoints
As indicated earlier, we evaluated the effects of traffic-related air-pollution, road traffic noise, road safety and physical activity. However, the benefits of cycling extend beyond that. Examples are the benefits caused by the reduction of the adverse impacts associated with climate change and the most associated psychological and social impacts [13]. However, changes in these elements are difficult to quantify and were therefore not included in this assessment. For our assessment we included health endpoints
1. of which the World Health Organisation and the Dutch Health Council concluded that there is sufficient evidence for a relationship with traffic-related air pollution, road traffic noise or physical activity [26, 28, 29, 30, 37, 38]; and
2. that impair people’s daily functioning. Table 1. Overview of the selected health endpoints
Traffic-related exposure/risk factor Selected health endpoint Traffic-related air pollution‡ Mortality (ICD-10 < V01)**
Wheezing in children
Road traffic noise‡ Severe annoyance
Severe sleep disturbance
Ischemic heart disease (ICD-10: I20-I25)
Road safety Mortality*
Injury†
Physical activity Mortality and morbidity from
Coronary heart disease (ICD-20: I20-25) Stroke (ICD-10: I60-69, G45)
Type II Diabetes (ICD-10: E11) Colon cancer (ICD-10: C18)
Breast cancer (women) (ICD-10: C50)
*) Fatalities: deceased within 30 days after a road crash;
†) Hospitalised severely injured: taken to a hospital for treatment and at least a one night stay, after a road crash; ‡) Referring to long-term exposure;
**) this includes all natural causes.
Since the relation between transport activities and deaths and injuries has been clearly and unambiguously identified, we decided to include outcomes of crashes that are commonly used: the number of killed and injured. In accordance with the criteria mentioned above, elevated blood pressure
by road traffic noise exposure, for example, was excluded because it does not necessarily impair daily functioning. On the other hand, we did include severe annoyance and severe sleep disturbance because they affect well-being, which is included in the WHO’s definition of health.1
As an indicator for all traffic-related air pollutions we used NO2, which is widely accepted [26]. In epidemiological studies, PM10 has also been used as an indicator but is less specific for traffic-related air pollution [26]. Since the scenarios deal with long-term rather than short-term changes, health effects of short-term increases in air pollution, such as myocardial infarction, were not included.
3.2
Assessment of population exposure
3.2.1
Population at risk
Traffic-related air pollution and road traffic noise
With regard to traffic-related air pollution and road traffic noise, we estimated health effects for the whole Dutch population (all ages), regardless of where they live in relation to roads and/or how they participate in traffic (by car or bike). We realise that this is rather crude, since the highest traffic-related air pollution exposures, for example, are usually found within the first
100 m from roadways and exposures often fall to background levels by 300 m distance or more from a road [26]. Only a small part of the Dutch population lives close to a major road. To give an indication: in the Dutch cohort of Hoek et al. (2002), 5% of the population lived close to a major road [40]. Although several studies have investigated the exposure of cyclists and car drivers to traffic-related air pollutants and noise [41-46], the results of these studies cannot be used to assess the exposure to traffic-related air pollution and/or road traffic noise of groups of cyclists or car drivers in the Netherlands.
Physical activity
In relation to physical activity, we estimated the health effects for all persons in the Netherlands of 18 years and older. However, since physical activity guidelines imply the most health gain is achieved by persuading the least active groups in the population to become moderately active [29], the population at risk of being affected by a health effect are those who are the least active. Health gain can be expected by increasing the proportion of the population that cycle and/or by increasing the time spent cycling among those who cycle.
Road safety
For our assessment, only the trips of drivers aged 18 years and older were replaced, since car trips always relate to drivers aged 18 years and older; the consequences of replacing trips of passengers of the drivers, were left out of the assessment. Health effects were estimated for road users aged 18 years and older, involved in crashes where either a car or a bicycle is involved. Since we assume that the number of crashes where neither a car nor a bicycle is involved is not influenced by a change in car and
1 WHO definition of health: ‘Health is a state of complete physical, mental and social well-being and not merely the absence of
bicycle mobility, these were not included in our assessment. Detailed backgrounds to the calculations for road safety can be found in Appendix I.
3.2.2
Population exposure in the reference situation
Traffic-related air pollution and road traffic noise
We assessed population exposure to traffic-related air pollution (NO2) and road traffic in the reference situation by linking data on the place of residence of the population to modelled
NO2 concentrations and road traffic noise levels (expressed in Lden).
Data on the place of residence (postal code level) were obtained from Statistics Netherlands (CBS). Modelled NO2 concentrations (μg/m3) in the Netherlands were calculated by means of the Luvotool module from the EMPARA2 model. The resolution of the resulting maps with total
NO2 concentrations was 25*25 m [47].
For the calculation of road traffic-noise exposure levels, the module Noisetool [48] of the EMPARA model was used. The resolution of the resulting maps with road traffic-noise levels was 25*25 m [47]. From the Lden, the other noise indicators (LAeq, 16hr and the Lnight) were derived using the distribution of road traffic on the roads over 24 hours provided by the Netherlands Environmental Assessment Agency (PBL) [49].
Physical activity
To estimate the physical activity pattern at the moment that none of the short-distance car trips were substituted by cycling, we needed to know the physical activity pattern of the Dutch population at that moment. To this end, the fraction of the population that meets the Dutch guideline for physical activity (the so-called Nederlandse Norm Gezond Bewegen (NNGB)) was estimated.3 This was done on the basis of data from Statistics Netherlands (CBS). Participants were categorised as ‘inactive’, ‘semi-active’ or ‘‘semi-active’. Those who were categorised as ‘in‘semi-active’ spent 30 minutes of moderately intense physical activity on none of the days of the week. ‘Active’ participants spent 30 minutes of moderately intense physical activity on 5-7 days of the week. ‘Semi-active’ participants spent 30 minutes of moderately intense physical activity on 1-4 days of the week.
Road safety
For road safety, the distance travelled by car or by bike (indicated as mobility) was the exposure metric. Mobility data were obtained from Statistics Netherlands (see also section 3.2.3 and Appendix II).
2 EMPARA (Environmental Model for Population Annoyance and Risk Analysis) is a compilation of modules that are being
used by the Netherlands Environmental Assessment Agency to assess the magnitude of the effects of local air quality due to road traffic and noise levels due to industry and road, rail and air traffic on a national scale.
3 The NNGB prescribes a minimum of 30 minutes of at least moderately intense physical activity at 5–7 days a week. In
addition, the definition of ‘at least moderately intense’ differs between adults up to 55 years of age (≥ 4.0 Metabolic equivalents) and adults aged 55 years or over (≥ 3 Metabolic equivalents) [50].
3.2.3
Change in exposure
Traffic-related air pollution and road-traffic noise
To estimate the reduction in the concentration of traffic-related air pollution we used the estimate of Vermeulen and Den Boer (2005) who have estimated the change in traffic-related air pollution levels due to a substitution of a fraction of short-distance car trips for the Rijnmond region [51]: a substitution of 10% of the short distance car trips was estimated to decrease the NO2 concentration by maximal 1-2 μg/m3. For the purposes of this report, we have applied the estimate of Vermeulen and Den Boer (2005) on all dwellings in the Netherlands, assuming an equal decrease in exposure for every inhabitant. We realise that this it is a rather crude assumption, since only a part of the Dutch population lives close to a major road. To put it into perspective: suppose that the estimation of Hoek et al. (2002) [40] is true for the Dutch population, indicating that 5% of the Dutch population lives close to a major road. If we suppose that the reduction in traffic-related air pollution due to an exchange of short-distance car trips with cycling is 4 μg/m3 for those 5% and
1 μg/m3 for the other 95% of the people, this would mean an average reduction 1.2 μg/m3 for the whole population. A reduction of 10 μg/m3 for the people living close to a major road and 1 μg/m3 for the other part of the population would imply an average reduction of 1.5 μg/m3; and a reduction of 20 μg/m3 for the people living close to a major road and 1 μg/m3 for the other part of the population would imply an average reduction of almost 2 μg/m3.
To estimate the reduction in road traffic-noise due to a reduction in the number of cars, we modelled the change in road traffic-noise levels by means of the standard Reken- en Meetvoorschrift
Wegverkeerslawaai [52] assuming that a reduction of the number of car movements causes a reduction in noise levels. The estimated reductions in noise levels are presented in Table 2 and were processed in EMPARA, assuming that all short-distance car trips took place on the municipal roads and not on other roads: the estimated reductions in road traffic-noise level were applied to all dwellings exposed to municipal roads. Subsequently, this was generically applied to the general noise load for road traffic, not taking into account any differences in traffic composition.
Table 2. Change in road traffic-noise levels due to the reduction of the number of cars estimated by means of Reken- en Meetvoorschrift Wegverkeerslawaai [52]
Reduction of the number of cars (%) Reduction in noise level (in dB(A)) 10 0.5 20 1.0 30 1.5
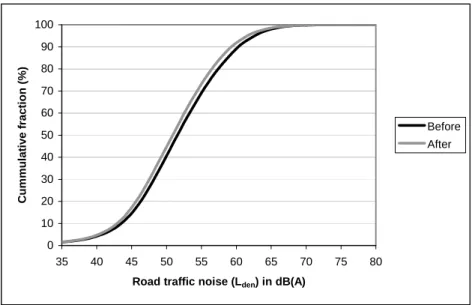
Figure 8 shows how the exposure distribution for the Dutch population for exposure to road traffic noise could be affected due to the substitution of short-distance car trips by bike trips in the
Netherlands. The exposure distributions for cumulative road traffic noise changed little: when 30% of the short car trips is substituted by bike trips, the percentage of the Dutch population that is exposed to cumulative road traffic noise levels over 55 dB(A) (Lden) decreased from 36% to 32%.
0 10 20 30 40 50 60 70 80 90 100 35 40 45 50 55 60 65 70 75 80
Road traffic noise (Lden) in dB(A)
Cu m m u la ti ve fr a c ti o n ( % ) Before After
Figure 8: Exposure distribution of cumulative road traffic noise (Lden) levels before (reference situation) and
after the substitution of 30% of the short car trips by bike trips. Included was the whole Dutch population of 2004.
Physical activity
As already indicated in section 3.2.1, health gain with regard to physical activity can be expected by increasing the proportion of the population that cycles and/or by increasing the time spent cycling among those who cycle. As a consequence, the physical activity pattern of the population will change: the proportion of ‘inactive’ is expected to decrease while the proportion of ‘active’ is expected to increase.
Because the duration of short-distance bike trips varies, we assumed that the whole adult population (in theory the population that drives cars) would increase their cycle behaviour by one day more and respectively 5, 10, 15, 20, 25 and 30 minutes longer in the alternative scenario. The 5-minute intervals represent the various sub-scenarios. Changes in the distribution over the physical activity categories ‘inactive’, semi-active’ and ‘active’ among these sub-scenarios and the reference scenario were calculated based on data from the second ‘National Survey in General Practice’ (DNSGP-2) [53]. The resulting activity patterns of the population are presented in Appendix III. It appears that the largest effect can be found in the group aged 18-55 years: when everybody cycles one day more and 30 minutes longer, the percentage of inactives and semi-actives decreases by 2.5% and 7.0%, respectively; at the same time, the percentage of actives increases by 9.5%.
Road safety
The change in car mobility was estimated using National Travel Survey data [54-56]4. These data were gathered for two periods of two years (1999-2000 and 2005-2006), 6 years apart [21].5 Since the
4 This is an ongoing study that aims to describe the mobility patterns of the Dutch population. By means of the study,
information was collected on trip origins and destinations, time of day, mode of transport, purpose, distance and time travelled.
fraction of short trips will not be equal for men and women and for driver age (see also Figures 2, 4, 5 and 6), the National Travel Survey data were stratified by age and gender.
Figure 9 demonstrates the reduction in car mobility in case 10% of the short-distance car trips are replaced by short-distance bicycle trips. Figure 5 already demonstrated that the distance travelled by car decreases from the age of 30-40 years, for both males and females. For women, this effect is larger than for men. Because the total amount of mobility related to short-distance car trips is a small fraction of total car mobility (10-20%), an exchange of 10% of the short-distance car trips to cycling trips reduces car mobility by just 1 or 2%.
reduction of car mobility, 10% of short trips is replaced by bicycle trips
0% 1% 2% 3% 18-19 20-24 25-29 30-34 35-39 40-44 45-49 50-54 55-59 60-64 65-69 70-74 75-79 80-99 18-19 20-24 25-29 30-34 35-39 40-44 45-49 50-54 55-59 60-64 65-69 70-74 75-79 80-99 male female age gender red u ced mobilit y 1999-2000 2005-2006 Mean
Figure 9: The reduction of total car mobility (in %) by age and gender, when 10% of the short passenger car trips (< 7.5 km trip length) are exchanged for bicycle trips. The data are gathered for two periods of 2 years, 6 years apart. The mean of the two is shown as a solid line [21].
This is different for the amount by which bicycle mobility is enhanced by this exchange. When comparing Figures 9 and 10, it appears that the relative increase in bicycle mobility (maximal 16%) is much larger than the relative decrease in car mobility (maximal 2%). Figure 2 already demonstrated that bicycle mobility is highest for young people and lowest for people aged
65 years and older; people between 30-50 years old make the most short-distance trips by bike (see also Figure 4). As a consequence, the relative increase in bicycle mobility is highest for 30 to 40-year old men and women, and lowest for young drivers (18-20 years) and elderly drivers.
increased bicycle mobility when 10% of short car trips is changed into bicycle trips 0% 2% 4% 6% 8% 10% 12% 14% 16% 18% 18-19 20-24 25-29 30-34 35-39 40-44 45-49 50-54 55-59 60-64 65-69 70-74 75-79 80-99 18-19 20-24 25-29 30-34 35-39 40-44 45-49 50-54 55-59 60-64 65-69 70-74 75-79 80-99 male female age gender increase in b icycle mobility 1999-2000 2005-2006 mean
Figure 10: The increase (in %) of total bicycle mobility by age and gender, when 10% of the short passenger car trips (< 7.5 km trip length) are exchanged for bicycle trips. The data are gathered for two periods of 2 years, 6 years apart. The mean of the two is shown as a solid line [21].
3.3
Identification of exposure-effect relations
For the selected health endpoints in relation to traffic-related air pollution, road traffic noise and physical activity (see also Table 1) we identified exposure-effect relations that are known up to today, using data published in the epidemiological literature. We were interested in relationships that were derived either from a quantitative summary of published data (pooled analysis or meta-analysis) or, if not available, from single epidemiological studies, preferably recently performed in the Netherlands. Table 3 shows which exposure-effect relations we have used in our assessment for traffic-related air pollution and road traffic noise.
Table 3. Selected exposure-effect relations for traffic-related air pollution, road traffic noise and road safety.
Exposure Health outcome Exposure-effect relation Source
Mortality (ICD-10 < V01)
RR = 1.08 (95%CI: 1.00-1.16) per 30 μg/m3 [56]†
Traffic-related air pollution
Wheezing in children RR = 1.74 (95%CI: 0.99 – 3.05) per 17.6 μg/m3 [57]
Severe annoyance %SA = 9,868x10-4 (L
den– 42)3 – 1,436x10-2(Lden– 42)2 + 0,5118(Lden – 42) [58] Severe sleep disturbance %HSD = 20,8 – 1,05xLnight+ 0,01486xLnight2 [59]
Road traffic noise
Myocardial infarction RR5 dB(A) = 1.06 (95%CI: 1.01 – 1.11) * [49]
Road safety Fatalities Injured
‡ [21] *) For this relation the LAeq,16 hrs is used;
†) Since the study population that was used in this study was relatively old, we decided to extrapolate the results of this study only to older age groups;
‡) these age- and sex specific formulas describe the relation between the number of fatalities or hospitalised injuries and mobility as a function of the risk of being involved in a crash; they are presented in section 3 of Stipdonk and Reurings [21].
Abbreviations: RR = Relative risk; 95%CI = 95% confidence intervals; SA = Severe annoyed; HSD = Highly sleep disturbed; Lden = Day-evening-night level; Lnight = Equivalent sound level averaged for the period from 23 to
7 hours;
Except for road safety, the relations that were presented in Table 3 were extrapolated to other age ranges than the ones covered in the underlying epidemiological study: for the effect of traffic-related air pollution on mortality, the age range was extended from people aged 60-67 years to people aged 60 years or older. Since the study population that was used in Beelen et al., (2008) [56] was relatively old, we decided to extrapolate the results of this study only to older age groups. For the effect of traffic-related air pollution on wheezing in children, the age range was extended to people aged 0 to 18 years. The relation describing the association between road traffic-noise exposure and severe annoyance and severe sleep disturbance and myocardial infarction was applied to people of 18 years and older. Table 4 shows the relative risk (RR) per category of physical activity (active persons are the reference). Depending on whether someone is ‘semi-active’ or ‘inactive’, a person has a certain (additional) chance to become ill or die. For example, a relative risk of 1.09 means that the chance to die prematurely is 9% higher for a ‘semi-active’ person compared to an ‘active’ person [29]. Unfortunately, no 95%
Table 4. Selected exposure-effect relations for physical activity (‘active’ is reference category)
Semi-active Inactive
< 60 years 60 years < 60 years 60 years
Men Women Men Women Men Women Men Women
Total mortality 1.09 1.09 1.09 1.09 1.40 1.40 1.40 1.40 Coronary heart disease 1.16 1.16 1.21 1.21 1.80 1.80 2.00 2.00 CVA 1.21 1.21 1.25 1.25 2.00 2.00 2.20 2.20 Type II Diabetes 1.14 1.18 1.14 1.18 1.53 1.36 1.53 1.36 Colon cancer 1.14 1.14 1.14 1.14 1.70 1.70 1.70 1.70 Breast cancer - 1.06 - 1.06 - 1.25 - 1.25
3.4
Estimation of the attributable number of cases and the disease burden
3.4.1
The attributable number of cases
Traffic-related air pollution and road traffic noise
In this step, the attributable burden, i.e., the number of cases that can be related to exposure to traffic-related-air pollution or road traffic noise, was calculated. In short, the attributable burden is a function of the exposure-effect relations (relative risks), baseline prevalence or incidence rates of the health endpoints under study and the number of people exposed [60], for more details see Knol and Staatsen (2005) [61]. Baseline prevalence rates and incidence rates of the health endpoints and mortality rates were obtained through the National Public Health Compass of RIVM and Statistics Netherlands (see Table 5).
Because a linear relation is assumed between traffic-related air pollution and wheezing and mortality (ICD-10 < V01), we have calculated the disease burden attributable to traffic-related air pollution without a threshold value for NO2. However, we realise that health effects can occur at all levels of exposure and that a zero exposure level is neither realistic nor feasible to achieve.
With regard to the effects of road traffic-noise exposure on myocardial infarction, the value of a ‘no effect level’ is uncertain and still under debate. For our assessment, the theoretical minimum level for road traffic noise was set at 60 dB(A) (Lden).
Since no baseline prevalences were required, the numbers of people severely annoyed and severely disturbed in their sleep were calculated directly by using the exposure-effect relations and the estimated population exposure distribution, see also [61] for more details.
Physical activity
The number of cases resulting from changes in physical activity was modelled using the RIVM Chronic Diseases Model (CDM). The RIVM-CDM is a dynamic Markov-type multi-state transition model in which the population is categorised according to diseases and risk factors
Table 5. Base prevalence data used for the calculation of the attributable number of cases
Stressor Health outcome Prevalence (per 1,000)
Traffic-related air pollution (NO2) Mortality (ICD10 < V01) Wheezing
36.9* 50-200†
Road traffic noise Severe annoyance
Severe sleep disturbance Myocardial infarction
‡ ‡ 1.73$
Physical activity Total mortality
Coronary heart disease CVA
Type II Diabetes Colon cancer Breast cancer
§
Road safety Fatalities
Hospitalised, serious injuries
**
* = CBS Doodsoorzakenstatistiek, Mortality 2005;
† = Smit et al., 2006 [64]; $ = this is the incidence of acute myocardial infarction for the Netherlands in 2003 [65]; ‡ = No baseline prevalences were required; § = The base prevalences that were included in the RIVM Chronic Diseases Model were used;
** Data on fatalities in 8 years (1999-2006) stratified by age and gender were based on police reports [66]; data on hospitalised serious injuries in 8 years (1999-2006) stratified by age and gender were based on police reports [66], and hospital data [67].
Road safety
The number of fatalities and hospitalised injuries at the moment none of the short-distance car trips was substituted by short-distance bike trips (reference situation) was assessed directly by taking the mean of the number of fatalities and hospitalised injuries per year for the period
1999-2006. For most of the conflict types that were addressed in section 3.2.1, the numbers of fatalities and hospitalised injuries were obtained from police records data. However, for hospitalised cyclists in crashes with no motor vehicle involved, these numbers are grossly underestimated by police
registration, possible because they are often not reported to the police in the first place. They were, however, derived from hospital data (LMR, Prismant).
When the actual car mobility to be exchanged (stratified by age and gender) was known, we calculated the expected number of fatalities and hospitalised injuries related to crashes with cars by means of the formulas presented in Stipdonk and Reurings [21]. The expected number of bicycle casualties was calculated similarly.
3.4.2
The disease burden
For each health endpoint, the disease burden was calculated by multiplying the attributive number of cases with a severity weight and an estimate of the duration of the disease, or years of life lost for mortality [61]. For details of these calculations, see also Appendix III.
3.5
Uncertainty analysis
Since this is a first-order estimation with the main focus on the method instead of the exact outcome and because it was not always possible to estimate confidence intervals, our results are presented without confidence intervals. Instead we have tabulated for every step of our assessment the
uncertainties and/or assumptions and how these might have possibly affected our results (see also Table V-1 of Appendix V).
As sections 3.1 to 3.4 have shown, our assessment involves many different input variables and assumptions. To give an indication of the relative importance of some of the input variables and/or assumptions, we investigated the sensitivity of the results by changing one input variable or assumption at a time, ceteris paribus. Examined were the sensitivity of our results a) in case we used the exposure-effect relation between road traffic noise and myocardial infarction derived by Babisch (2006) [68] instead of the relation derived by Van Kempen and Houthuijs (2008) [49];
b) in case we assessed the effects attributable to traffic-related air pollution using a minimum level of 22.7 μg/m3 (background concentration in 2003 in the Netherlands) instead of 0 μg/m3; c) in case we used a minimum level of 55 dB(A) when assessing the number of incident cases of myocardial infarction attributable to road traffic noise exposure instead of 60 dB(A).
Finally, we estimated the average loss of life expectancy due to exposure to traffic-related air pollution instead of attributable numbers of deaths. This is more appropriate, since we assume that traffic-related air pollution does not cause death but accelerates it [69, 70]. Therefore, for mortality attributable to traffic-related air pollution, we also estimated the population average ‘years of life lost’ [17]. Average loss or gain of life expectancy can best be calculated by using life tables, which take population dynamics into account. At the moment, this method is in progress and considered outside the scope of this report. Therefore, it was only included as a kind of sensitivity analysis.
4
Results
4.1
The possible health benefits of cycling
Figure 13 presents the disease burden (DALYs) for the Dutch population due to exposure to traffic-related air pollution (NO2), road traffic noise, and traffic injuries in the Netherlands at the moment that none of the short-distance car trips was substituted by cycling (reference situation) and the disease burden after the substitution of short-distance car trips by cycling. In addition, the figure presents the disease burden due to the physical activity pattern of the Dutch population aged 18 years and older at the moment that none of the short-distance car trips was substituted by cycling (reference situation) and at the moment that everybody cycles one day more and
30 minutes longer. 0 100000 200000 300000 Traffic-related air pollution
Road traffic noise Road traffic injury Physical inactivity
D isease b u rd e n ( D A L Y s , ab so lu te ) Reference situation
10% reduction short-distance car trips
20% reduction short-distance car trips
30% reduction short-distance car trips
Everybody cycles one day more and 30 minutes longer
Figure 11: The estimated changes in burden of disease, expressed in Disability-Adjusted Life Years (DALYs), grouped by exposure.
Firstly, Figure 11 shows the balance in disease burden of the different traffic-related impacts at the moment that none of the short-distance car trips was exchanged. However, the figure is not representative of the actual traffic-related disease burden in the Netherlands, since the picture is incomplete: the estimated disease burden due to road safety is an underestimation and is mainly driven by male drivers aged 18-39 years, who died or were severely injured in a crash where at least one car was involved but no bicycles; emergency-room admissions, e.g., were not included. The estimations for road traffic noise mainly consisted in the number of people with severe annoyance and sleep
Secondly, Figure 11 shows that the health benefits of an exchange between short-distance car trips by cycling appear to be modest: we estimated that a reduction of the traffic-related air pollution
concentration of 26.5 to 25.5 μg/m3 (assumed to be equivalent to a reduction of 10% of the short-distance car trips) results in a reduction of almost 4% of the disease burden. The effect in terms of average loss of life expectancy was estimated to be negligible.
It was estimated that the disease burden attributable to road traffic noise in the Netherlands decreased by about 5% in case 10% of the car trips on municipal roads is substituted by cycling; in case 30% of the car trips on municipal roads is substituted, the disease burden is estimated to decrease by more than 10%. -2 -1 0 1 2 3 4 5 6 7 18 - 19 20 - 2 4 25 - 29 30 - 3 4 35 - 3940 - 4 4 45 - 4950 - 54 55 - 59 60 64 65 - 69 70 - 74 75 - 79 80+ Age category (years)
% in cr ease /d ecr ease i n d is ease b u rd en ( D A L Y s ) Men Women
Figure 12: The relative (%) increase and/or decrease in disease burden (DALYs) attributable to traffic injury due the exchange between short-distance car trips and short distance bicycle trips.
The disease burden due to road crashes caused by road traffic is estimated to increase by 0.7% due to the exchange between short-distance car trips and short-distance bicycle trips. Figure 12 however, shows a more complete picture: it appears that an exchange between short-distance car trips and cycling is only beneficial for young (especially male) drivers. Since due to an increase in bicycle mobility, relatively more males and females die and/or were admitted to a hospital than due the decrease in car mobility, the disease burden among drivers of 35 years and older increases due to an exchange between short-distance car trips and cycling.
For physical activity, the disease burden decreases almost 1.5% in case everybody cycles one day more and 30 minutes longer. This increase in cycling is estimated to correspond with a reduction in the inactive persons by 2.5% in the group of people of 18-55 years old; at the same time, the amount of inactives decreases by 0.6% among people older than 55 years (see also Appendix III). The strongest decrease in disease burden can be expected in case everybody cycles one day more and at least 20
minutes a day longer. Figure 15 shows the corresponding change in activity patterns for the other scenarios that were run for physical inactivity.
0 1 2 3 4 5 5 10 15 20 25 30
Everybody cycles one day more and 5-30 minutes longer
Re la ti ve ( % ) d e cre ase i n di s e a se b u rden (DAL Y )
Figure 13: The relative change (%) in disease burden (DALYs) after one year when everybody cycles one day more and 5-30 minutes longer.
4.2
Sensitivity analysis
In our calculations with regard to traffic-related air pollution, we estimated the disease burden due to an average reduction of 1 μg/m3 for the whole population. This is rather a crude method, since only a part of the Dutch population lives close to a major road. According to Hoek et al. (2002) [40] 5% of the Dutch population is estimated to live close to a major road. If we suppose that the exchange of short-distance car trips causes a reduction of 10 μg/m3 for those 5% and 1 μg/m3 for the other 95% of the population, this would mean an average reduction of almost 1.5 μg/m3. This would result in a reduction of the disease burden attributable to traffic-related air pollution of around 5%; in case we suppose that the exchange of short-distance car trips causes a reduction of 20 μg/m3 for the people that live close to a major road (implying an average reduction of almost
0 20000 40000 60000 80000 100000 Ref level = 0 microgr/m3 Ref level = 22.7 microgr/m3 Ref level = 60 dB(A) (1) Ref level = 55 dB(A) (1) Ref level = 60 dB(A) (2) Disea se burde n (DALYs, a b solute) Reference situation
10% reduction short-distance car trips
Figure 14: The estimated change in disease burden (DALY) due to exposure to traffic-related air pollution (NO2)
and road traffic noise using different reference levels; and for the change in disease burden due to road traffic noise the effect of the application the exposure-effect relation derived by Van Kempen and Houthuijs (1) and Babisch (2) [49, 68].
Figure 14 shows how the reference levels used for traffic-related air pollution and road traffic noise affect the disease burden before and after exchange of short-distance car trips. The number of estimated incident cases of myocardial infarction using the relation derived by Van Kempen and Houthuijs (2008) [49] differed from the number of incident cases estimated using the relation derived by Babisch (2006) [68]; since the disease burden attributable to road traffic noise is mainly driven by the number of severely annoyed and severely sleep disturbed, this did not really affected the absolute (difference) in the disease burden attributable to road traffic-noise exposure.
The presented burden of disease of traffic-related air pollution consisted of wheezing and
cardiovascular mortality. However, since we assume that traffic-related air pollution does not cause death but accelerates it, we realise that it is more appropriate to calculate the average loss of life expectancy due to exposure to traffic-related air pollution instead of attributable numbers of cardiovascular deaths. Analogous to Schram-Bijkerk et al. (2009) we have estimated that instead of postponing 275 deaths (results not shown but included in Figure 11), the reduction in air pollution would result in a life gain of approximately 7 hours for the total population at risk (about 3.1 million people). Presented this way, the air pollution-related health effects of our simulations seem negligible because they are spread out over the entire population, but this estimate is based on the same data as the numbers used for Figure 11, though put into a more appropriate form. Average loss or gain of life
Traffic-related air pollution
Road traffic noise
expectancy can best be calculated by using life tables, which take population dynamics into account [109, 110], which facilitates the simulation of effects of aging and latency time of effects. However, this advanced method was considered outside the scope of this report.
![Figure 1: The determinants of behaviour model [14].](https://thumb-eu.123doks.com/thumbv2/5doknet/3051452.8490/17.918.172.784.203.375/figure-determinants-behaviour-model.webp)
![Figure 2: The average distance travelled per person per day by bike in the Netherlands in 2005 (derived from MON 2005 [23])](https://thumb-eu.123doks.com/thumbv2/5doknet/3051452.8490/20.918.184.646.453.711/figure-average-distance-travelled-person-bike-netherlands-derived.webp)
![Figure 3: Journeys according to transportation means and distance category in the Netherlands in 2005 (Source: MON, 2005 in: [24])](https://thumb-eu.123doks.com/thumbv2/5doknet/3051452.8490/21.918.186.687.165.463/figure-journeys-according-transportation-distance-category-netherlands-source.webp)
![Figure 5: The average distance travelled by car per person per day for men and women in the Netherlands in 2005 (derived from MON 2005 [23])](https://thumb-eu.123doks.com/thumbv2/5doknet/3051452.8490/22.918.187.762.402.767/figure-average-distance-travelled-person-women-netherlands-derived.webp)
![Figure 6: The number of short-distance car trips per person per year for the different age categories in 1986- 1986-2006 (Source: Olde Kalter, 2007 [22])](https://thumb-eu.123doks.com/thumbv2/5doknet/3051452.8490/23.918.186.726.221.560/figure-number-distance-person-different-categories-source-kalter.webp)
![Figure 7: Scheme of data used, calculations made and steps taken in order to assess the disease burden due to the substitution of short-distance car trips by cycling trips (adapted from [36] and [16])](https://thumb-eu.123doks.com/thumbv2/5doknet/3051452.8490/26.918.177.674.499.962/figure-scheme-calculations-disease-substitution-distance-cycling-adapted.webp)

![Table 2. Change in road traffic-noise levels due to the reduction of the number of cars estimated by means of Reken- en Meetvoorschrift Wegverkeerslawaai [52]](https://thumb-eu.123doks.com/thumbv2/5doknet/3051452.8490/30.918.172.636.782.871/table-change-traffic-levels-reduction-estimated-meetvoorschrift-wegverkeerslawaai.webp)