Regional population and household projections, 2011–2040:
Marked regional differences
Andries de Jong1 and Coen van Duin2
The regional population and household projections for 2011 to 2040 presents future developments in the population and number of households per municipality in the Netherlands. This article discusses five important future developments. First of all, the population of the Netherlands will continue to grow over the next 15 years. Growth will be particularly strong in the Randstad (meaning the urban conurbation of Amsterdam, Rotterdam, The Hague and Utrecht), but on the periphery of the country the population is expected to decline. Secondly, the number of
households is also expected to continue to grow strongly throughout the Netherlands – only in north-east Groningen and Zeeuws-Vlaanderen will growth level off or even turn to decline. Thirdly, although the size of the potential labour force has increased continuously over the last few
decades, it is expected to decline significantly in the near future. Decrease in the potential labour force, already a fact in many regions, will spread to almost all regions. Only in a strip that runs from The Hague Agglomeration, through Utrecht, Greater Amsterdam and Flevoland to north Overijssel will the potential labour force continue to grow over the coming 15 years. Fourthly, ageing of the population will accelerate in the coming decades as the post-war baby-boomers enter the over-65 age group. Although the number of people aged 65 and older will increase throughout the Netherlands, the increase will be stronger on the periphery of the country (where the
strongest population decline is also expected) than in more urbanised areas, such as the
Randstad. Fifthly, the number of immigrants will increase significantly. Most immigrants currently live in the Randstad and this is not expected to change.
1. Introduction
The PBL Netherlands Environmental Assessment Agency and Statistics Netherlands (CBS)
published the fourth regional population and household projections in October 2011. The regional projections are published every two years and presents future developments in the Dutch population in each municipality, according to age, gender, ethnic group and household type. The new regional projections cover the period from 2011 to 2040. The projections aim to present the most likely future developments. Actual future developments may differ from these to a greater or lesser extent. The regional population and household projections for 2011 to 2040 can be found online at
www.pbl.nl, www.cbs.nl and www.regionalebevolkingsprognose.nl. The methodology used in the projections is described for example in De Jong et al. (2005; 2007).
2. Background to the regional projections 2011–2040
The projections for 2011 to 2040 provide an update of the 2009 PBL and CBS regional projections and are based on the most recent national CBS population and household projections of 2010/2011. CBS predicts stronger population growth for the country as a whole than was estimated in the previous national projections – an increase up to 17.8 million in 2040 compared with the previously predicted 17.5 million. As a result, the growth figures provided in the previous regional projections will change for some municipalities. The most recent regional developments in birth and death rates and internal and international migration were included in the new projections. Assumptions new housing construction were also updated, based on the most recent data. This resulted in additional changes compared with the previous regional projections.
or cancelled their housing development plans. For example, the city of Amsterdam will carry out construction of the IJburg II residential area in phases (Amsterdam, 2011) and the municipality of The Hague has postponed its housing development plans within the Kijkduin Master Development Plan (The Hague, 2011). Postponing or cancelling development plans, considering the increase in population growth expected in the new CBS projections, may lead to increased pressure on the future housing market. This is potentially a particular problem in the Randstad, where the increase in the number of households may exceed the increase in the official housing stock. The regional projections assume that this may result in an increase in new forms of housing, such as containers made suitable for living purposes, in particular for students.
It is as yet unclear what the long-term effects of the credit crisis will be on the housing market and what impact they will have on spatial planning. Haffner and V an Dam (2011) expect the results of the crisis to remain apparent for some time, although with great variation between regions. The long-term effects of the global crisis will be less apparent in growth regions than in shrinkage regions.
3. Strong population growth versus considerable population decline
The population of the Netherlands increased by over 1 million between 1995 and 2010 (see Figure 1). However, growth was not stable during this period: it levelled off in 2003 but began to
increase again 5 years later. Population growth is expected to continue over the coming 15 years, resulting in a population of 17.5 million in 2025.
million 18 17 16 15 1995 2000 2005 2010 2015 2020 2025
Figure 1. Population, between 1995 and 2025 Source: population projections 2010–2060 (CBS)
The population of the Netherlands has been increasing for several decades. However, on a regional level growth is no longer self-evident, and in some regions on the periphery of the country the population is now in decline. This is the case in east Groningen, the Delfzijl region and south Limburg. A slight decline is also seen in a number of other areas on the periphery of the
Netherlands, such as the Achterhoek region, Zeeuws-Vlaanderen and north Friesland. Population decline is also seen in the Randstad, especially in the areas to the south-east of Rotterdam – in the eastern and south-eastern parts of South-Holland. The population also decreased in the Delft en Westland region between 2000 and 2005, but this has since once again turned into growth. In contrast to the regions that experience decline, there are also regions with above-average growth. These are mostly in the Randstad – in the large and medium-sized cities and surrounding municipalities.
Continued population growth is expected for the Netherlands as a whole up to 2025. However, this national trend no longer applies to all the Dutch COROP (Coordination Commission Regional Research Programme) regions. Three types of regional growth can be seen; regions with strong population growth, regions with considerable population decline and regions where growth is close to zero – and for which it is not possible to predict whether the result will be growth or decline.
Map 1 shows the population growth between 2010 and 2025 based on the current regional projections for the 40 COROP regions. There are four regions with a population decline of more than 2.5%: east Groningen, Delfzijl region, Achterhoek region and Zeeuws-Vlaanderen. The decline in these regions totals about 25,000 people. Decline is also expected in south-east
Drenthe and the three Limburg regions, but this is expected to remain below about 2% up to 2025. Adding these regions to the previously mentioned decline regions brings the total decline to about 50,000 people.
The population decline predicted for the Achterhoek region, north Limburg, the middle of Limburg and south-east Drenthe is expected within a few years. It is predicted to continue throughout the projection period in these regions as well as in the regions already experiencing population decline. According to De Klerk (2010) and Latten and Kooiman (2011), regional differences in perceived attractiveness as places to settle play an important role in the growth or decline of particular regions. This attractiveness is low in regions on the periphery of the country, leading to a decline in population over all age groups. The projections show that both young people and families will move away from these regions and that few immigrants will take their place. The population decline is also due to natural population decline. For example, the birth rate in south Limburg has been low for some time, and far below the population replacement level. Furthermore, the death rate is high in these regions due to the ageing of the population. All these trends result in population decline; few families and therefore few children, many old people and therefore high death rates, and the migration of young people and families away from the regions with almost no replacement by immigrants. This also results in lower pressure on the housing market in these regions, and therefore generally leads to lower house prices compared with other regions (see Van Dam, 2010).
In contrast to this decline, strong population growth will also take place; particularly in the west of the Netherlands. Strong growth regions are found in both the northern and southern wings of the Randstad. The northern wing includes Greater Amsterdam and the surrounding Zaanstreek and Flevoland. The Utrecht region is also expected to achieve growth of almost 10% up to 2025. The southern wing of the Randstad includes the The Hague Agglomeration and the adjacent Delft and Westland regions. Clear growth is also expected in the regions surrounding the city of Rotterdam (Greater Rijnmond, and the eastern and south-eastern parts of South Holland). However, strong population growth will not only be limited to the Randstad. Powerful centres of growth are also expected in the intermediary zone (the area between the Randstad and the periphery of the Netherlands), such as north Overijssel (centred on Zwolle), Arnhem/Nijmegen and the centre and east of the province of North Brabant. In the north of the Netherlands, ‘Overig Groningen’ (the region centred on the municipality of Groningen) also shows strong growth. All in all, there are 24 COROP regions with an expected population growth of over 2.5%. The population growth in centres of growth in and around the Randstad is largely the result of the attractiveness of these regions as a place to live, both to national and international migrants (De Klerk, 2010; Latten and Kooiman, 2011). These are centres of technological innovation and leading businesses, and they attract students, single people and highly-educated people.
The population is expected to remain almost unchanged in about one third of the COROP regions (shown on the map as areas with growth between -2.5% and +2.5%). These regions are almost all outside the Randstad, with the exception of IJmond and the Gooi en Vechtstreek region. Latten and Kooiman (2011) found that young people in such regions often move to the centres of growth in and around the Randstad, but that their exit is compensated for by the arrival of families to the area. Another reason for the limited population growth in these regions is that they attract fewer foreign immigrants.
Map 1. Population development per COROP area, from 2010 to 2025.
The previously defined three types of regional population development (growth, relatively stable and decline) were further refined by considering population development per municipality (see Map 2). The strong population growth in the Randstad is concentrated partly in the large municipalities and partly in the surrounding municipalities. Almere takes first place, with an expected population growth of about 30%, followed by Utrecht with about 25%. These are followed by Amsterdam (15%), The Hague (10%) and Rotterdam (over 5%). A different picture is seen in terms of absolute population growth. For the 2010–2025 period, the population of Amsterdam is expected to increase by 110,000 and that of Utrecht by 80,000. For Almere, an increase of 60,000 is expected. This is more than the expected increases in The Hague and Rotterdam, at 55,000 and 45,000, respectively. The growth in these municipalities is the result of both internal and international migration and natural population growth (more births than deaths). According to the CBS national projections, international immigration will be responsible for an extra 300,000 people in the Netherlands, during the 2010–2025 period. Immigrants clearly prefer to live in the Randstad, as there are more employment opportunities and because many of their compatriots already live there. In addition, many young people move to the main cities to study or for their first jobs. Large new residential areas have recently been built around the large cities, such as IJburg, Leidsche Rijn, Ypenburg, Leidschenveen, Wateringse Veld and Nesselande. Mostly young families have moved to these areas, and this has resulted in a relatively high birth rate. In addition, relatively few elderly people live in the large municipalities, which therefore also leads to a relatively low death rate.
Strong population growth is also expected in some of the smaller municipalities that surround the larger ones. Examples are Haarlemmermeer, Westland, Haarlem, Delft, Zaanstad, Lansingerland, Zuidplas, Pijnacker-Nootdorp, Katwijk, Lelystad and Amstelveen. In all these municipalities, the population is expected to grow by between 10,000 and 20,000 in the 2010–2025 period, with the exception of Haarlemmermeer, where an increase of over 25,000 is expected. These smaller municipalities surrounding the larger cities often grow due to young couples moving from the city to new residential areas where there are plenty of single family homes and where there is more space for the children.
There are also municipalities outside the Randstad in which the population will probably increase significantly in the coming 15 years. These are towns and cities that provide supra-regional services, such as higher education facilities. According to the regional projections, the population is expected to increase by between 10,000 and 25,000 in the municipalities of Groningen, Zwolle, Amersfoort, Nijmegen, Eindhoven, Arnhem, Breda, Tilburg, ’s-Hertogenbosch and Leeuwarden.
Although no population decline is predicted for the coming 15 years on a national level, the situation is clearly different on municipal level. The large cities have experienced population decline in the past. This was mainly due to suburbanisation, largely the result of young couples moving to nearby growth cores in response to the tight housing market. There has been a decrease in suburbanisation, and this will continue in the future due to the construction of new housing around the large cities. Of the four largest municipalities, population decline was only seen in
Rotterdam in the first decade of this century, but even here there has been a return to strong growth in recent years. Although population decline is currently mainly seen in municipalities on the periphery of the Netherlands, such as in south Limburg and the Delfzijl region, some municipalities in the Randstad are also experiencing slight population decline due to people moving from rural municipalities to the large cities. However, population decline on the periphery is not seen in individual municipalities, but rather in larger shrinkage areas and this decline is expected to
continue in the future. The population will decrease by more than 2.5% up to 2025 in over one third of the Dutch municipalities; a total of almost 200,000 fewer inhabitants. The decline will hit hardest in the northern provinces, Limburg, the Achterhoek region and the south of Zeeland. The ageing of the population is the main reason for this decline, as more elderly people die than children are born. Furthermore, young people often leave these areas for more central parts of the
Netherlands, either to study or to work.
4. Continued strong increase in the number of households on regional levels
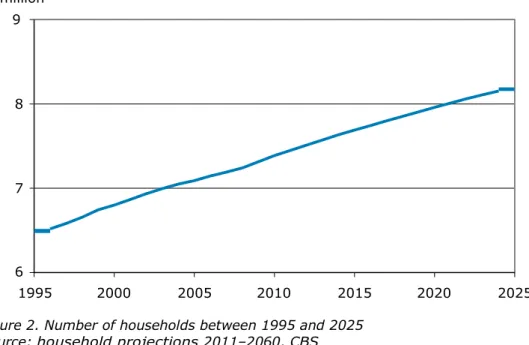
It is important to the housing sector to know which developments may be expected in the number of households. The number of households in the Netherlands increased significantly between 1995 and 2010, by almost one million, which put great pressure on the housing sector. The growth rate of the number of households was two times that of population growth (annually, on average 1% and 0.5%, respectively). According to the CBS national household projections for the 2011–2060 period (Van Duin and Stoeldraijer, 2011), an additional 800,000 households are expected for the coming 15 years (see Figure 2). It therefore seems imperative that more houses be built, even in these times of economic crisis.
million 9 8 7 6 1995 2000 2005 2010 2015 2020 2025
Figure 2. Number of households between 1995 and 2025 Source: household projections 2011–2060, CBS
There has been a strong increase in the number of households in the past, at both national and regional level. A reduction in the number of households is currently only seen in the COROP area Delfzijl region, and even there it is limited; the number of households decreased from 22,400 in 2003 to 21,700 in 2010. The number of households in the Netherlands is expected to show continued strong growth in the future, although this is expected to slow down after 2030. For population growth, it was found that the national situation is not clearly reflected in the regional patterns. Whether this also applies to the increase in the number of households is depicted in Map 3, which shows the increase in the number of households between 2010 and 2025 in the 40 COROP areas. This map shows that the national situation of showing a strong increase in the number of households is also largely seen in the regions; there is an increase of more than 2.5% in 37 of the 40 COROP areas, and in 16 of the 40 the increase is even more than the national level of 11%. As for population growth, the Randstad takes the lead. First place goes to Flevoland, with an expected relative increase of almost 30%. There is also a visible increase in both the northern and southern wings of the Randstad as well as in various municipalities in the intermediary zone. It should be noted that these developments could change should there be a change in spatial development policy, and this has not been taken into account in the regional projections.
During the 2010–2025 period, a decrease of more than 2.5% is only expected in the currently shrinking Delfzijl region. The expectation for the east Groningen and Zeeuws-Vlaanderen regions, currently experiencing population decline, is that the number of households in 2025 will be roughly 2% higher than in 2010. However, these regions are expected to experience a change in around 2020 from an increasing number of households to a decline.
Map 3. Development in the number of households per COROP area.
At regional level, the predominant trend is a considerable or strong increase in the number of households up to 2025. This can be refined by zooming in at municipal level. The increase in the number of households is concentrated in the Randstad. For Almere, a strong increase in the number of households of about 40% is expected between 2010 and 2025 (see Map 4). The growth rate is clearly lower in the four large municipalities; for Utrecht it is about 15% and for the other three large municipalities it is between 5% and 10%. The picture is somewhat different when considering the absolute number of households. For Almere, an increase of about 30,000 households is expected between 2010 and 2025. Amsterdam and Utrecht will see an increase of about 25,000 and 30,000 households, respectively. For The Hague and Rotterdam, an increase is expected of about 15,000 and 25,000, respectively. Outside the Randstad, it is mainly municipalities with a supra-regional function that are most likely to experience strong growth in the coming 15 years. Examples are Nijmegen, Tilburg, Breda, Groningen and Arnhem.
Although decline is a fairly common phenomenon in municipal population development, it plays a very small role as far as the number of households is concerned. A comparison between the map depicting the development in the number of households (Map 4) and the map depicting population development (Map 2) shows that, in many cases, population decline will not be accompanied by a decrease in the number of households. This means that the tendency towards smaller households will compensate for population decline to some extent. Population decline is mostly seen in municipalities with the oldest residents. However, although many people die in these areas, their partners continue to live in the same house, which then becomes categorised as a single-person household. In addition, divorce and separation also lead to additional households. This means that policy needs to take into account a different type of housing requirement (suitable for middle-aged and elderly single persons, possibly in poor health) rather than a significant decrease in the need for housing. According to the regional projections, a decrease or levelling off in the number of
Map 4: Development in the number of households per municipality
5. Strong decline in potential labour force
As with the total population, the potential labour force3 has also shown continued growth in recent
decades. The number of people in this population group grew by 0.5 million between 1995 and 2010, but this growth is expected to end very soon, with a decrease of about 150,000 people expected between 2012 and 2025 (see Figure 3). The decline in the potential labour force is a direct effect of the current age distribution; the current economically active baby-boomers born after the Second World War will gradually join the over-65 age group in the coming decades. Although this will be partially compensated for by foreign migrants (who are mostly younger than 40), this is not enough to stop the decline.
million 10.5
10
9.5
1995 2000 2005 2010 2015 2020 2025
Figure 3. Population in the 20 to 64 age group, 1995 to 2025 Source: population projections 2010–2060, CBS
3 Defined in this article as the population in the 20–64 year age group. The lower limit of 20 years is
common in demographic studies; in economic studies 15 years is often used. An increase in the retirement age may result in an expansion of the upper limit. However, it is still unclear how this would be implemented and the effect it will have on labour participation of those over 65.
As with the total population, in recent decades, the potential labour force has continued to increase on a national level. Regionally, however, the picture is quite different. At this level, decline is widespread, and the potential labour force has already decreased in more than half of the 40 COROP areas. Growth is concentrated in the Randstad and adjacent areas to the north, east and south, and in the regions around the municipalities of Groningen, Arnhem and Nijmegen. The potential labour force is expected to decline in many more regions. According to the regional projections, the potential labour force will only increase between 2010 and 2025 in a narrow area that runs from the The Hague Agglomeration and Delft and Westland regions, through Utrecht, Greater Amsterdam and Flevoland to north Overijssel (see Map 5). In most regions outside the Randstad, there will be a severe decline in the potential labour force, with the peripheral regions hit hardest. This applies in particular to Delfzijl region, with an expected decline of over 20%. In east Groningen, south-east Drenthe, Achterhoek region, Zeeuws-Vlaanderen, north Limburg and the middle of Limburg, a decline of 10% to 20% is expected. For south Limburg, the expected decline is just below 10% up to 2025.
Changes in the size of the potential labour force depend mainly on the age distribution of the population and migration. The decline in the number of young people means that fewer young people are entering the labour force in many regions, while many older people are leaving the labour force due to the ageing of the population. This applies in particular to the peripheral regions. The post-war baby-boom period continued until about 1965, after which the annual birth rate
decreased rapidly. In south Limburg, in particular, there was a significant decrease in birth rate. The birth rate remained stable in the Randstad, partly due to the influx of non-western immigrants. The large baby-boom birth cohort groups will leave the 20–65 age group in the coming decades and be replaced by smaller birth cohort groups. As a result, the potential labour force will decline, in particular in the peripheral regions, which already have strongly ageing populations.
National and international migration also work as a catalyst on the regional differences in growth in the potential labour force. Many young people, particularly those from the periphery, but also from the intermediary zone, will move to the Randstad for work or study. The regions centred on the municipalities of Groningen, Zwolle, Arnhem and Nijmegen will also be popular among young people due to the available study and employment opportunities. For these regions, this will slow down the decline in the potential labour force, but accelerate it in the regions from which they originated. International migration also reinforces the regional differences. Immigrants are usually children and middle-aged adults, so their arrival results in a larger potential labour force, both now (the adults) and later (the children). The work opportunities and existing social networks mean that non-western immigrants have a strong preference for settling in the larger municipalities in the Randstad. The intermediary zone and in particular the periphery are less popular, so that these areas miss out on this addition to the labour market.
Many regions suffering a severe decline in potential labour force are also suffering population decline. In addition, many young people are leaving these areas and there are very few immigrants replacing them. The situation is reversed in the Randstad, while the intermediary zone lies between the two extremes.
An overall relative decrease in potential labour force is predicted throughout the Netherlands, resulting in an overall increase in the ratio between the number of people who do not work and those who do. The proportion of the population in the 20–64 age group will decrease by about 4% for the Netherlands as a whole, between 2010 and 2025, from 61% to 57%. Even in those regions where there will be an absolute increase in the number of people aged 20–64, there will still be a decrease in the proportion of the population in this age group (see Map 6). The decrease in the proportion of the population that makes up the potential labour force will, on regional level, be of roughly the same order of magnitude as the national decrease, although it will be greater in the more peripheral COROP areas and less strong in and around the The Hague Agglomeration and the Greater Rijnmond area.
Map 5. Development in potential labour force per COROP area, between 2010 and 2025.
Map 6. Decrease in share of the population that makes up the potential labour force per COROP area, between 2010 and 2025.
6. Acceleration in the ageing of the population
The population of the Netherlands has been ageing for quite some time. From 2002 onwards, however, this ageing process accelerated when a relatively large group of the population reached the age of 65 in that year due to the increase in the number of births between 1937 and 1944 (Garssen, 2011). The acceleration will become even stronger in the coming 15 years as the post-war baby-boomers join the over-65 age group (Van Duin and Garssen, 2011). The number of people aged 65 and over is expected to increase from 2.6 million in 2011 to 3.8 million in 2025 (see Figure 4). In 2025, 22% of the population will be aged 65 or over, compared with 16% in 2011. The percentage of the population aged 65 and over in 2010 and 2025 in the 40 COROP areas is shown in Map 7.
million 4 3.5 3 2.5 2 1.5 1 0.5 0 1995 2000 2005 2010 2015 2020 2025
Figure 4. Population, aged 65 and over, between 1995 and 2025 Source: population projections 2010–2060, CBS
The regions of population decline are also some of the regions experiencing the most population ageing. This is not surprising, as ageing of the population is a strong driver of population decline. The previously mentioned factors (selective departure of young people and families, low influx of foreign migrants and a low birth rate) are responsible for the high level of population ageing in these regions. The percentage of people aged 65 and over in the regions with population decline in 2010 was a few per cent above the Dutch average, which is about 15%. This difference is expected to have increased by 2025, with a share of 22% for the Netherlands as a whole, compared with 27% to 29% in the population decline regions.
The proportion of people aged 65 and over was a few per cent lower than the national average in the more urbanised regions of the Netherlands in 2010, in particular in Greater Amsterdam and Utrecht. The region with the lowest proportion of people aged 65 and over was Flevoland. This is historical, as many young families moved to this area in the last decades of the twentieth century.
and over will be even further below the national average than at present. In these areas, people aged 65 and over will represent about 18% of the population, compared with a national average of 22%. A very high number of foreign migrants are expected to settle in Greater Amsterdam and The Hague Agglomeration, as well as many young people attracted to the more liberal labour market. As previously mentioned, the population decline regions will show even more ageing of the population than the national average.
In contrast to these diverging regional developments, a converging trend will be seen in
Flevoland. According to the projections, the ageing in this region will in fact move towards the national average. In 2010, the proportion of people aged 65 and over in Flevoland was still 6% below the national average. This is expected to decrease slightly over the next 15 years, to 5% below.
7. Increase in number of non-western immigrants to continue
The composition according to origin of the Dutch population has increased in diversity in recent decades due to the arrival of western and non-western immigrants, who have also had children here. There is however a clear difference in growth rate, with that of non-western immigrants being considerably higher. In 2010, there were 1.9 million non-western immigrants and 1.5 million western immigrants in the Netherlands (see Figure 5). Between 1995 and 2010, the number of non-western immigrants increased by over 700,000 while for western immigrants this was almost 200,000. An extra 0.5 million non-western immigrants are expected in the coming 15 years, compared with just over 250,000 western immigrants.
million 3 2.5 2 1.5 1 0.5 0 1995 2000 2005 2010 2015 2020 2025
non-western immigrants western immigrants Figure 5. Number of immigrants, between 1995 and 2025
Source: population projections 2010–2060, CBS
As far as the origin composition of the population is concerned, what is most striking is the large increase expected in the number of non-western immigrants. The proportion of these immigrants currently varies greatly per region, as is shown in Map 8, with a strong
concentration in the Randstad, in particular in the urban centres. In both Greater Amsterdam and the The Hague Agglomeration, the proportion of non-western immigrants is 26%. This is
somewhat lower in the Greater Rijnmond area, at 22%. With a national average of 11%, the proportion of non-western immigrants in these three COROP areas is therefore twice, or over twice, the national average. Near Greater Amsterdam, the regions Zaanstreek and Flevoland also score high, with 16% and 19%, respectively. The fourth large region in the Randstad, Utrecht, has a comparatively low proportion of non-western immigrants, at around the national average, as do the Haarlem Agglomeration, Delft and Westland regions and the south-east of South Holland. In the other regions, it is just under the national average; particularly in the peripheral regions of the Netherlands. In the northern regions, south Limburg and Zeeuws-Vlaanderen, the share is about 5%.
Map 8. Share of non-western immigrants per COROP area.
The share of non-western immigrants is expected to continue to increase, from 11% in 2010 to 14% in 2025. According to the regional projections, the spatial distribution of non-western
immigrants will spread to some extent in the coming 15 years, but the pattern of a high concentration in the Randstad and a low concentration on the periphery will be maintained. For the Greater Amsterdam and Greater Rijnmond regions and Flevoland, an increase in the share of non-western immigrants of between 1% and 2% is expected, which is slightly below the increase expected nationally. The share for the The Hague Agglomeration, Utrecht and Zaanstreek is expected to increase by 2% to 3%, in line with national developments. A higher than average increase is expected in most regions around Greater Amsterdam and the The Hague Agglomeration, due to non-western immigrants moving from the municipalities of Amsterdam and The Hague to surrounding municipalities. The share of non-western immigrants is expected to increase by a few per cent in the other regions, roughly in line with the national trend.
8. Strong regional uncertainties in the long term
The aim of the PBL and CBS regional population and household projections is to present the most likely future, based on current knowledge and understanding. However, as with the national projections, the regional projections are shrouded in uncertainty, something that increases even more as the projections look further into the future. The uncertainty at the regional level is also greater than at the national level, one of the reasons being that chance fluctuations in demographic events play a far greater role regionally.
Given the large uncertainty in the long term, it would be useful to analyse this uncertainty. This would provide an idea of the upper and lower limits of demographic growth as well as the most likely future. The bandwidth of population growth and increase in the number of households can be outlined using two different methods: stochastic prediction intervals and different scenarios. The CBS national population and household projections were based on the stochastic prediction intervals method. Assumptions were therefore made about the uncertainty in the predictions for immigration and emigration, birth rates, death rates and changes in household composition. These assumptions were based on mistakes made in earlier projections and past observed variations. Thousands of variants were calculated, each based on a different combination of predictions. From the outcomes, 67% and 95% prediction intervals were then derived.
The future of regions in the Netherlands was explored using two scenarios in the Spatial Outlook 2011 (Ruimtelijke Verkenning 2011) (PBL, 2011). Scenarios can be regarded as plausible, consistent future pathways. The aim is not to predict the future, but to gain an idea of the alternative futures that together form the bandwidth within which the actual future is expected to develop. The two scenarios in the Spatial Outlook were based on the two most extreme scenarios in the study Welfare, Prosperity and Quality of the Living Environment (WLO) (CPB, MNP and RPB, 2006). These are the Regional Communities scenario (RC, or low-growth scenario) and the Global Economy scenario (GE, or high-growth scenario). These two scenarios represent different future demographic and economic trends. The results of the Spatial Outlook are given at the level of
COROP areas (a few of them, such as Utrecht, were further subdivided), to allow assumptions about how national projections translate to regions to play an important role.
This section compares the regional projections with the two Spatial Outlook scenarios. The regional projections aim to present the most likely future vision, based on the knowledge currently available. This is what the Dutch Scientific Council for Government Policy (WRR, 2010) calls the ‘surprise-free future’. The most likely future vision, however, is not statistically supported, and this is why the projections are adjusted annually based on recent developments and new insights. As a result, projections are mainly suitable for the short and medium-to-long term. Scenarios sketch a playing field of possible futures for the longer term within which the most likely future is to be found. 8.1 Regional population growth up to 2040
The population of the Netherlands increased by over 1 million during the 15 year period from 1995 to 2010 (see Figure 6). The expectation for the coming 30 years is that the growth in population will steadily decrease. The population will therefore grow more slowly and increase by just 1.2 million. Uncertainties in the development of the factors of population growth (immigration and emigration, birth rate and life expectancy) can have a large influence on the development of the population. According to the upper limit of the 67% prediction interval, up to 18.8 million inhabitants can be expected for 2040. According to the lower limit, the population will increase up to 2030, to 17 million, then decrease to 16.8 million by 2040. The 95% prediction interval gives an expected population of between 16 million and 20 million for 2040. According to the CBS national population projections, the population of the Netherlands will be 17.8 million in 2040. Map 9 shows the long-term regional population growth; the growth predicted by the regional projections is shown compared with the low (RC) and high (GE) growth scenarios for the 2010–2040 period.
million 20 19 18 17 16 15 1995 2000 2005 2010 2015 2020 2025 2030 2035 2040 population 67% interval 95% interval Figure 6. Population, between 1995 and 2030, with prognosis intervals Source: population projections 2010–2060, CBS
Based on the most likely future vision according to the PBL/CBS regional projections, there will be 8 regions in 2040 with a population decline of more than 2.5%. As expected, these regions will be found mainly on the periphery of the Netherlands. The Delfzijl region and Zeeuws-Vlaanderen will experience the largest decline, at 10% or more. Decline is also expected in east Groningen, south-east Drenthe, Achterhoek region, north Limburg, middle of Limburg and south Limburg, although here it is predicted to be between 2.5% and 10%. Compared with this considerable decline, strong population growth is predicted in other areas, in particular in the west of the Netherlands. The population in both the northern and southern wings of the Randstad will grow by 10% or more. Outside the Randstad, there will also be strong population growth in north Overijssel (based on the core Zwolle) and the middle part of North Brabant. Most other regions in the intermediary zone will also show growth, though much less pronounced. To summarise, growth of 2.5% or more is expected in 27 of the 40 COROP areas.
In the low economic and population growth scenario, regions that show light population decline in the regional projections may move into the strong decline category. Based on this low-growth scenario, 14 regions will experience strong population decline in 2040 (of 10% or more), compared with just 2 regions in the regional projections. According to this scenario, three quarters of the regions will experience population decline (of more than 2.5%). The high-growth scenario shows the effects of high long-term economic and population growth. In this scenario, three quarters of the regions will experience strong population growth (of 10% or more), compared with just a quarter in the regional projections. Only on the periphery of the Netherlands will there be regions with either a stable population or slight decline in 2040.
Map 9. Population growth between 2010 and 2040, comparing the PBL/CBS regional projections with the Spatial Outlook 2011.
8.2 Regional increase in number of households up to 2040
There was a considerable increase in the number of households, between 1995 and 2010, of almost one million. According to the CBS national household projections for the 2011–2060 period (Van Duin and Stoeldraijer, 2011), close to another 1 million households are expected for the coming 20 years. The strong increase will start to level off in around 2030. This means that, by 2040, a total of 8.5 million households is predicted for the Netherlands, about 1.1 million more than at present (see Figure 7). This prediction is of course not completely certain: anything between 7.8 and 9.1 million households is also considered plausible. According to the 95% prediction interval, the number of households in 2040 will be between 7 million and 10 million. The national CBS household
projections predict there to be 8.5 million households by 2040. Map 10 shows the increase over the 2010–2040 period, according to the regional projections compared with the developments according to the two scenarios.
million 10 9 8 7 6 1995 2000 2005 2010 2015 2020 2025 2030 2035 2040 no. of households 67% interval 95% interval Figure 7. Number of households between 1995 and 2040, with projection intervals Source: household projections 2011–2060, CBS
The regional projections, which presents the most likely future, predict a decrease in the number of
households of more than 2.5% in only three regions between 2010 and 2040. These are the Delfzijl region, east Groningen and Zeeuws-Vlaanderen – regions already affected by population decline. The projections expect the number of households in south-east Drenthe and south Limburg to remain fairly stable, even though these regions will be affected by population decline. The number of households will increase in the other regions between 2010 and 2040, and by more than 10% in 27 of the 40 COROP areas. In the high-growth scenario, the expectation is even that the number of households will increase by more than 10% in every region. However, a long-term increase in the number of households for all regions is by no means certain, as the low-growth scenario clearly shows. According to this scenario, growth by more than 10% is only expected in 2 regions, and in only a quarter of the regions the expected growth is more than 2.5%. Half of the regions are even expected to experience a decrease in the number of households (of more than 2.5%) between 2010 and 2040. For these regions, it would be sensible to take this into account when drawing up new-housing plans, to avoid building houses that may remain unoccupied.
Map 10. Development in the number of households between 2010 and 2040; PBL/CBS regional projections compared with the Spatial Outlook 2011.
Summary
The PBL Netherlands Environmental Assessment Agency and Statistics Netherlands (CBS) published the fourth regional population and household projections in October 2011. The projections aim to present the most likely future developments in population and number of households for the 2011–2040 period.
It is important to the housing sector to know which developments can be expected in the number of households. There has been a strong increase in the number of households in the past, at both national and regional levels, and this is expected to continue. As for population growth, the Randstad will take the lead. For Almere, an increase of about 30,000 households is expected
between 2010 and 2025. Amsterdam and Utrecht will see an increase of about 25,000 and 30,000 households, respectively. For The Hague and Rotterdam, an increase is expected of about 15,000 and 25,000, respectively. Although decline is a fairly common phenomenon in municipal population growth, it plays a very small role in terms of number of households. According to the regional projections, a decrease or levelling off in the number of households will take place mainly on the periphery of the Netherlands.
The potential labour force (the number of people in the 20–65 age group) has continually grown in recent decades, but this is expected to turn to decline in the near future. According to the regional projections, the potential labour force will only increase between 2010 and 2025 in a narrow area that runs from the The Hague Agglomeration and the Delft and Westland regions, through Utrecht, Greater Amsterdam and Flevoland to north Overijssel. In most regions outside the Randstad there will be a severe decrease in the potential labour force, with the peripheral regions hit hardest. The population of the Netherlands has been ageing for some time, but this will accelerate in the coming 15 years. Ageing of the population will take place throughout the Netherlands and in particular in the more peripheral regions. Significant ageing of the population will even take place in Flevoland. There is currently less ageing here than in the rest of the Netherlands, but this will move towards the Dutch average in the coming years.
The origin composition of the Dutch population has increased in diversity in recent decades as a result of the arrival of western and non-western immigrants. The number of non-western
immigrants in particular will continue to increase. This population group currently lives primarily in the Randstad region, in the large urban municipalities. According to the regional projections, the spatial distribution of non-western immigrants will spread throughout the Netherlands to some extent in the coming 15 years, but the pattern of a high concentration in the Randstad and a low
concentration in the periphery will be maintained. The concentration in the more urbanised municipalities will be somewhat reduced due to suburbanisation from the large municipalities to surrounding municipalities.
The aim of the PBL and CBS regional population and household projections is to present the most likely future, based on current knowledge and understanding. However, the uncertainty for the long term, for example the 2025–2040 period, is much greater than for the 2010–2025 period. Using the two Spatial Outlook scenarios (PBL, 2011), it is possible to obtain an idea of the
bandwidth of future developments. Based on the most likely future vision according to the PBL/CBS regional projections, there will be 8 regions in 2040 with a population decline of more than 2.5%. These regions will be found mainly on the periphery of the Netherlands. According to the Spatial Outlook low-growth scenario, three quarters of the COROP areas will experience population decline (of more than 2.5%). In contrast to this decline, strong population growth will also take place, particularly in the west of the Netherlands. According to the Spatial Outlook high-growth scenario, three quarters of the COROP areas will be faced with strong population growth (of 10% or more), compared with just a quarter in the regional projections.
The regional projections predict a decrease of more than 2.5% in the number of households in 3 COROP areas between 2010 and 2040, a stable number of households in 2 areas and growth in all other areas. The Spatial Outlook high-growth scenario predicts that the number of households will increase by more than 10% in all COROP areas. However, the low-growth scenario predicts a decrease in the number of households (of more than 2.5%) between 2010 and 2040 in half of these areas.
References
CPB, MNP and RPB (2006). Welfare, Prosperity and Quality of the Living Environment [Welvaart en Leefomgeving]. Main report, The Hague/Bilthoven, CPB, MNP and RPB.
De Jong A, Alders M, Feijten P, Visser P, Deerenberg I, Van Huis M and Leering D. (2005). Achtergronden en veronderstellingen bij het model PEARL [Background and assumptions in the
PEARL model]. Rotterdam/The Hague, NAi Publishers/RPB and CBS.
De Jong A, Feijten P, De Groot C, Harmsen C, Van Huis M and Vernooij F. (2007). Regionale huishoudensdynamiek [Regional household dynamics]. Rotterdam/The Hague, NAi Publishers/RPB and CBS.
De Klerk LA. (2010). Verstedelijking 5.0: bespiegelingen over groei, stagnatie en contractie [Urbanisation 5.0: reflections on growth, stagnation and contraction]. Rooilijn 43(5), 316–329. Garssen J. (2011). Demografie van de vergrijzing [Demographics of an ageing population], Bevolkingstrends 59(2), 15–27.
Gemeente Amsterdam (2011). Besluiten voor IJburg en Zeeburgereiland [Decisions for IJburg and Zeeburgereiland]. City of Amsterdam (www.ijburg.nl).
Gemeente Den Haag (2011). Project Kijkduin. Badplaats voor de toekomst. [Project Kijkduin. Coastal city for the future, Municipality of The Hague] (www.denhaag.nl).
Haffner M and Van Dam F. (2011). Langetermijneffecten van de kredietcrisis op de regionale woningmarkt [Long-term effects of the credit crisis on the housing market]. The Hague, PBL Netherlands Environmental Assessment Agency.
Latten J and Kooiman N. (2011). Aantrekkingskracht van regio’s en demografische gevolgen. [Regional allure and demographic consequences]. Bevolkingstrends 59(2), 105–110.
PBL (2011). Nederland in 2040: een land van regio's. Ruimtelijke Verkenning 2011 [The Netherlands in 2040: A country of regions. Spatial Outlook 2011]. The Hague, PBL Netherlands Environmental Assessment Agency.
TNO (2010). Bouwprognoses 2010–2015 [Building prognoses 2010–2015]. Netherlands Organisation for Applied Scientific Research (TNO) Delft.
Van Dam F. (2010). Ruimtelijke gevolgen van demografische krimp [Spatial consequences of demographic decline], in: F. Verwest & F. van Dam (eds.): Van bestrijden naar begeleiden: demografische krimp in Nederland [From resisting to managing: demographic decline in the Netherlands], The Hague/Bilthoven, PBL Netherlands Environmental Assessment Agency, pp. 53– 62.
Van Duin C and Garssen J. (2011). Bevolkingsprognose 2010–2060: sterkere
vergrijzing, langere levensduur [Household prognosis 2011–2060: strong ageing, longer lifespan], Bevolkingstrends, 59(1), 16–23.
Van Duin C, De Jong G, Stoeldraijer L and Garssen J. (2011). Bevolkingsprognose 2010–2060: model en veronderstellingen betreffende de sterfte [Household prognosis 2011–2060: model