Painting:
Lucas
Verk
oren
Prof.dr Rob Alkemade
Inaugural lecture upon taking up the position of Special Professor of Global Biodiversity and Ecosystem Services Modelling at Wageningen University & Research on 12 September 2019
Increasing variety in
response to decreasing
biodiversity
Prof.dr Rob Alkemade
Inaugural lecture upon taking up the position of Special Professor of Global Biodiversity and Ecosystem Services Modelling at Wageningen University & Research on 12 September 2019
Increasing variety in response
to decreasing biodiversity
doi 10.18174/507645
Increasing variety in response
to decreasing biodiversity
Rector Magnificus, Family, friends, colleagues. ladies and gentlemen,
Biodiversity loss
At the beginning of the 20th century, biodiversity in the Netherlands looked very different from that of today. Butterflies were five times more abundant, countless salmon roamed our rivers, the Veluwe was a big extensive heathland, and the coastal dunes were not covered with pine trees.
My parents ran a flower bulb cultivation farm (together with two other families), on the edge of the coastal dunes, near Noordwijk. This land is called the Vinkeveld (literally ‘finches field’). In the Middle Ages and long after, large numbers of ‘finches’ were caught during the autumn and spring migration periods, to be sold on local markets for consumption. In the late 17th century, Vinkeveld became one of the
many estates on the eastern fringe of the coastal dunes. It included a manor house, a park, some small-scale agriculture and the business of catching birds continued. In the mid 19th century, the manor house was destroyed, and the estate was converted into tulip fields by levelling the shallow inner dunes. In the 1920s, companies started to also level the higher outer dunes to create more suitable land for bulb cultivation, also enlarging ‘Vinkeveld’. My grandparents acquired a piece of land within the enlarged ‘Vinkeveld’.
This painting, by the Leiden painter Lucas Verkoren, shows the levelling of the dunes exactly where my parents had their tulip farm (figure 1). It shows the machinery used for removing the sand. This sand was transported by rail and used as building material. Levelling the dunes stopped when influential early Dutch conservationists protested against this practice (de Noordwijker, 7 nov. 2017).
Bulb cultivation saw tremendous expansion and became more and more intensive through mechanisation, water drainage and the application of fertilizers and pesticides. In the late 1980s, part of Vinkeveld became a new district of the town of Noordwijk. This picture shows what Vinkeveld looks like, today (figure 2).
These changes to Vinkeveld had large consequences for the occurrence and populations of wild plants, birds and other species. Most finches are gone now, together with many other species who were living at the former estate. Some adaptive, opportunistic species remained, and some ‘new’ species appeared. During my childhood, in the 1960s, skylarks, partridges, lapwings and yellow wagtails were abundant. They are still around now, but their populations have declined and are still declining due to bulb-farm intensification and ongoing urbanisation. In short, the biodiversity, which is the variety of living organisms within a certain location, decreased strongly over the past centuries.
This decline in biodiversity is, in fact, happening everywhere — in both the
Netherlands and the rest of the world. All these local changes, together, have become a global-change problem.
The recent Global Biodiversity Assessment of the Intergovernmental Science-Policy Platform on Biodiversity and Ecosystem Services (IPBES) provides a very complete and comprehensive overview of the current state and future of global biodiversity (IPBES, 2019). It states, for example, that about one million species are at high risk of extinction; that average population sizes of all species have decreased by over 20%, since 1900; and that 75% of the land surface has been altered, significantly. This loss of biodiversity and natural ecosystems is jeopardising the capacity of ecosystems to provide the essential services that benefit human well-being. This problem includes reduced land productivity, reduced crop pollination, reduced coastal protection, and reductions in many other ecosystem services. Although, this is surely depressing, the IPBES assessment also provides options for addressing this decline. These options include enhanced protection of natural areas, sustainable use of land, water and sea, and nature-friendly climate change mitigation and adaptation. The report states that transformative changes are required across economic, social, political and
technological factors.
For most people in the audience, this is no news, but we should realise that, despite raising public awareness, increasing the extent of nature reserves, implementing other conservation policies and stimulating sustainability initiatives, the targets to halt biodiversity loss are not being achieved. Instead, biodiversity continues to decline and, without a change in policy, is expected to decline further, over the coming decades.
In this inaugural address, I will first summarise the causes of such biodiversity decline, followed by a brief discussion of the actions and global policy goals to address this decline. My main objective, today, is to convince you that global
biodiversity models are essential to support such policies. I will discuss how these models are constructed and which improvements are needed to broaden their applicability. Models are used to project how biodiversity and ecosystems are likely to develop in the future, to assess how combinations of pressures affect biodiversity, and to evaluate the effectiveness of policy options in achieving targets and reducing — or even reversing — biodiversity loss. Global biodiversity modelling is still an emerging field, the development of which I have been leading, over the past decades. I will conclude my lecture by explaining how my research will contribute to the slowing down and, if possible, halting the decline in biodiversity.
Figure 3: The direct causes of biodiversity loss.
I will now briefly introduce the causes of biodiversity decline. Pressures on biodiversity are the direct causes of this decline, and are the result of human actions (figure 3). These actions are determined by indirect causes, such as the human demand for food, water and other products related to economic development and demography. In my example from ‘Vinkeveld’, three major pressures (direct causes) on biodiversity act together. The first pressure was the exploitation of species — the hunting of the ‘finches’. The second consists of habitat loss due to land-use change — from a nearly natural dune landscape to intensive tulip fields and urban areas. The third is the intensification of bulb-cultivation practices causing pollution from nutrients and pesticides.
Other pressures, not explicitly mentioned in my example, include habitat
fragmentation, resulting from intensive land use and road construction; disturbances by roads; the introduction of invasive species and, very importantly, climate change. These seven pressures are generally recognised as the main causes of biodiversity loss and are currently having their impact in many places around the world (Sala et al., 2000; IPBES, 2019; Alkemade et al., 2009).
Figure 4: The relationship between biodiversity loss and ecosystem services, from Cardinale et al., 2012; Isbell et al., 2011; Vos et al., 2014, and others.
Biodiversity decline has major consequences for ecosystem functioning. Ecosystems consist of all living organisms and their environment within a particular unit of space, where many individuals of different species interact with each other. Ecosystems include tropical forests, coastal dunes and rivers, but also agricultural land and cities. Recent studies show that the decline and ultimately the
disappearance of species from ecosystems affect ecosystem functions — such as primary productivity, decomposition, carbon storage, pollination and water retention (Cardinale et al., 2012; Isbell et al., 2011; Vos et al., 2014, figure 4).
This reduces the resilience of ecosystems and may finally have a devastating effect, such as loss of productivity, land degradation or increased flood risk. Examples are the dust bowls in the United States, in the 1960s, and the increased flood risks from removing mangroves along tropical coasts (Egan, 2006).
In response to the declining biodiversity, policies to reverse this process were developed and implemented at various levels, such as the creation of national parks. The first of such parks are Yellowstone National Park in the United States of America and the Naardermeer in the Netherlands. The earliest laws about nature conservation in the Netherlands were already implemented in 1880. Increasingly, governments are realising that nature conservation also has an international component, such as in relation to migratory species and trade. In Europe, the EU Birds Directive was adopted in 1979 and, in 1992, the United Nations Convention on Biological Diversity (CBD) was established during the ‘Rio Earth Summit’.
The objectives of the CBD are to conserve biological diversity; promote the sustainable use
of its components; and the fair and equitable sharing of the benefits arising from the utilisation of genetic resources. The CBD’s first set of targets was established in 2000,
with the main goal to significantly reduce the loss of biodiversity by 2010. This goal was extended in the convention’s strategic plan for 2010–2020, including a long-term vision towards meeting the convention’s objectives by 2050 (CBD, 2010). In total, 196 governments have subscribed to these objectives, targets, and the long-term vision. Many of the current goals and targets in CBD’s strategic plan will not be achieved by 2020 (sCBD, 2014; IPBES, 2019). For example, habitat loss has not yet been halted; many species are still at high risk of extinction; and sustainable land use and fisheries have not yet been sufficiently applied. However, some targets are on the right track. For example, the total protected area has increased, as have public awareness and the willingness of companies to address biodiversity in their production. The time horizon of the long-term vision for 2050, is still far enough into the future to be attainable, but can only be achieved through transformative changes. Currently, the Parties to the Convention are discussing a new strategic plan, which must contain a new set of targets and indicators that help to comply with the long-term vision.
Models: A short history of GLOBIO
I will now address the role of models that provide information in support of these discussions.
In general, contemporary models play a prominent and successful role in policy and decision-making (Oppenheimer et al., 2019). Weather forecasts that span multiple days, for example, play a role in planning weekend activities. Climate-change policies are almost entirely based on information derived from climate models. Next week at the Day of the King’s Speech, in which the main features of government policy for the coming parliamentary session are announced, we will learn about the proposed policies of the Dutch Government. All these policy proposals have been evaluated by CPB Netherlands Bureau for Economic Policy Analysis (using economic models) and PBL Netherlands Environmental Assessment Agency (using
environmental models).
Over the past two decades, I have led the challenging process of building global biodiversity models at the Dutch National Institute for Public Health and the Environment (RIVM) and later at PBL, to support the discussions about international policies on biodiversity. Below, I describe the development of these models, in particular ‘GLOBIO’.
We started, at RIVM, to build a global biodiversity model to inform relevant Dutch, EU and UN policy-making. The development of this global model was requested by the Dutch Government and we started literally from scratch as such models did not exist. However, we were able to build on biodiversity models that we had previously developed during the 1990s, such as the ‘Nature Planner’ for the Netherlands and EuroMove for Europe (Latour et al., 1997; Bakkenes et al., 2002). We also used the global modelling experiences of RIVM’s IMAGE team, who successfully had developed and applied the global integrated assessment model, ‘IMAGE’ (Alcamo et al., 1994; Stehfest et al., 2014). We collaborated with UNEP’s World conservation Monitoring Centre (WCMC) and UNEP’s Global Resource Information Database (GRID). The latter suggested to use the strong acronym ‘GLOBIO’. After it was first released, the model immediately was used in supporting policy discussions of the Convention on Biological Diversity and other international bodies and programmes. In our development of the GLOBIO model, we faced four main challenges — which we subsequently were able to solve.
The first challenge was that of developing good descriptors or indicators for regional and global biodiversity, which is a multi-facetted entity that cannot be described in a single indicator. We decided to quantify ecosystem intactness by specifying the Mean Species Abundance. This indicator was initially proposed by my colleague Ben ten
Figure 6: Dose–response relationships for mammals (red) and plants (green) in GLOBIO (from Schipper et al., 2019) .
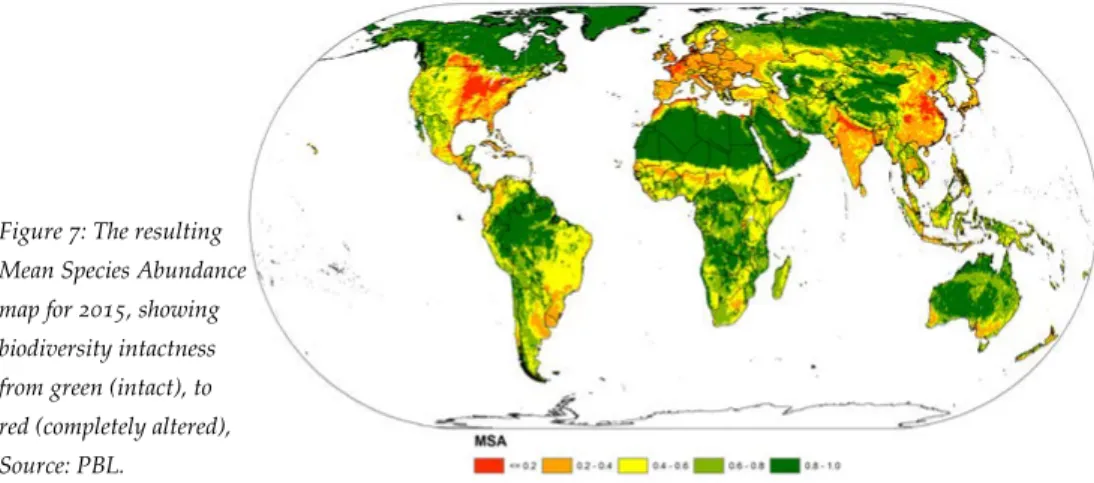
Figure 7: The resulting Mean Species Abundance map for 2015, showing biodiversity intactness from green (intact), to red (completely altered), Source: PBL.
Brink in the late 1990s, to inform national policymakers about the general trends in biodiversity. The Mean Species Abundance indicator makes explicit comparisons between species compositions in ecosystems that are influenced by various pressures and the assumed undisturbed natural ecosystem. The indicator can be calculated for any geographical entity, varying from individual plots, to landscapes, countries and the Earth as a whole, or for deserts, forests, rivers and oceans.
Mean Species Abundance (MSA) works like this (see Figure 5): Imagine a forest with trees, deer, frogs and an owl in it. This is considered the undisturbed, natural reference state, in the absence of human pressures. Now suppose a few trees are cut down. This reduces food availability for the deer, whose numbers consequently decrease, and provides less nesting space, so that the owl disappears. However, the number of frogs increases, and some mice become established, because of the lack of predator pressure. The typical ecosystem response to human pressures is, thus, a decrease in the abundance or extinction of some species and the increase in or emergence of others.
The corresponding MSA value of this disturbed ecosystem is then calculated according to the equation in Figure 5 — in the example, leaving 1 of the 2 deer, 0 owls ,1 of the 3 trees and 2 of the 2 frogs, resulting in a value of 0.46. Note that the increases are ignored to avoid the effect of compensation and exotic species are omitted as they do not belong to the undisturbed ecosystem.
The second challenge was to establish a straightforward relationship between the Mean Species Abundance and the seven pressures. The first version of GLOBIO, created by Christian Nellemann at UNEP GRID Arendal, used a general dose-response relationship based on the location’s distance to roads only (UNEP, 2001). We decided to construct general dose-response relationships between Mean Species Abundance and each pressure. We collected data from peer-reviewed field studies that compared species compositions of impacted ecosystems with undisturbed neighbouring ecosystems. The literature was extensively and systematically reviewed and by meta-analyses we established the dose-response relationships.
This resulted in relationships for land-use change, habitat fragmentation, road impacts, climate change, direct species exploitation and nitrogen pollution (de Baan et al, 2013; Alkemade et al., 2013; Benitez-Lopez, 2010; Nunez et al, 2019; Benitez- Lopez, 2017; Midolo et al., 2019) (figure 6). However, unfortunately, we still need to develop a relationship for invasive species. We linked these relationships with the corresponding global maps of all the different pressures and combined these maps into one overarching Mean Species Abundance map (figure 7).
We used the same approach for freshwater ecosystems (Janse et al, 2015). Currently, the relationships represent the results from over 500 published data sets, covering all world regions and global ecosystems (Schipper et al., 2019).
The third challenge was to project the future trends of pressures to apply the general GLOBIO relationships for future conditions.
We used PBL’s IMAGE scenarios that describe various plausible economic and demographic trends, and the corresponding future demands for food, energy and other products (Stehfest et al., 2014). An interrelated set of models use these demands to estimate future changes in land use, climate and pollution. We assumed
infrastructural developments consistent with each scenario and scaled down the land-use projections. Scaling down land-use projections required the development of a fine-resolution land-allocation model that uses specific decision rules to allocate the different land-use classes. The resulting detailed scenarios are input for the changes in pressures in GLOBIO.
The fourth challenge was that of including ecosystem services in GLOBIO. In 2005, the Millennium Ecosystem Assessment mainstreamed the concept of ecosystem services — which are the benefits people obtain from ecosystems — which is related to the sustainable use objective of the Convention on Biological Diversity. Ecosystem services include the provision of food, clean water, climate regulation, carbon storage, water regulation, pollination, and nature used for recreational purposes. Most of these services depend on the continued functioning of ecosystems, and therefore on biodiversity. Governments, including ours, rapidly became interested in these ecosystem services. Therefore, we developed an ecosystem-services module for GLOBIO (Schulp et al., 2012).
We decided to derive ecosystem services from land-use and production estimates from IMAGE, while proxies for other ecosystem services, such as pollination and pest control, were derived from detailed land-use maps. These are all recent
developments and, to date, only a limited set of ecosystem services has been included in GLOBIO, but we plan to expand on them in due course.
A first working version of the new GLOBIO model was released in 2007. This version supported policy processes by showing plausible futures for biodiversity,
highlighting the main pressures on biodiversity and evaluating policy options to effectively reduce or halt biodiversity loss. Since then, several improved versions have been released (figure 8).
We have used GLOBIO for many different global assessments, including UNEP’s Global Environment Outlooks, the OECD Environmental Outlook and the Global Biodiversity Outlooks, and recently in the regional and global assessments of the Intergovernmental Platform for Biodiversity and Ecosystem Services (IPBES) (UNEP, 2007; OECD, 2012; sCBD 2014; IPBES 2018; IPBES, 2019). These assessments help the Convention on Biological Diversity and other international bodies to formulate new policies.
GLOBIO was also used by other research groups and institutes in various countries and regions to support policy processes. These collaborations helped to further test and validate GLOBIO and expand its applicability and create a truly international user community. Currently, the French public bank Caise de Depots and the UN Food and Agriculture Organization are adapting GLOBIO in new tools to assess the impacts of companies on biodiversity (fao.org/tc/exact; cdc-biodiversity.fr). These tools enable the comparison of alternative investment plans for their impacts on biodiversity. GLOBIO-model results show that the expected trends with unchanged policies, a so-called business-as-usual scenario, mark a continuous decrease in Mean Species Abundance. The main pressures are related to land-use change, especially cropland, and in the future increasingly also climate change (figure 9).
We also analysed the effectivity of policy options for the fourth Global Biodiversity Outlook. First, we defined the options, with interdisciplinary teams that combined knowledge on technical possibilities, economic and policy realism, and
environmental trade-offs.
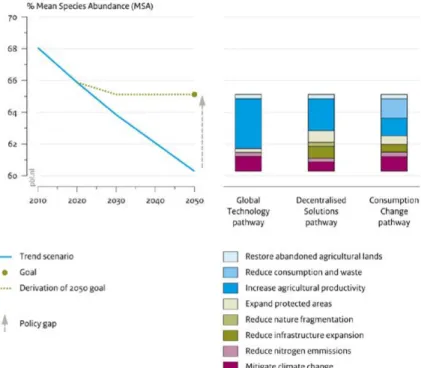
Figure 10: The effects of policy options to reduce biodiversity loss, according to three pathways, Source:PBL.
Figure 9: Changes in relative contribution of the pressures on biodiversity loss for a baseline scenario, Source: PBL.
These teams constructed three pathways: the Global Technology pathway, which emphasises the role of technology to increase productivity and spare land for biodiversity; the Decentralized Solutions pathway, which emphasises the role of ecosystem services and in which land is shared between human use and nature; and the Consumption Change pathway, which emphasises caring for sustainability by reducing consumption and waste, thus reducing land demand (figure 10). The combinations of options also contribute to achieving other sustainable development goals, such as avoiding dangerous climate change and eradicating hunger. Our analysis now serves as one of the pillars for discussing the new strategic plan of the Convention on Biological Diversity (sCBD, 2014; van Vuuren et al., 2015; Kok et al., 2018).
A conclusion from these studies is that reducing biodiversity loss and even achieving the long-term biodiversity goal of halting this loss seems to be attainable. Main options include 1) to increase the total area of protected land and water to conserve all species; 2) to increase food and bio-energy productivity, so less land will be needed; 3) to mitigate climate change, for instance by planting new forests to store carbon; and 4) consume less, especially in energy and meat. This all requires massive efforts in many different sectors, including agriculture, forestry and water
management.
Since a few years, several alternative biodiversity models have been developed by other research groups. Joint model evaluations of similar policy options point in the same direction.
New Challenges
Despite the projected potential of these options, these results need to be regarded in the light of three emerging major shortcomings of GLOBIO.
Firstly, these options all move towards separating land-use functions, where one piece of land is fully used to produce food or fiber, another to conserve nature conservation, and yet another to store carbon. This overlooks the importance of enhancing the variety in landscapes and the synergies of mixing land uses and natural elements in a single field or in a landscape, as is argued by many scholars (Perfecto and Vandermeer, 2010, Bomarcco et al., 2013; van Noordwijk and Brussaard, 2014; Vet, 2019). Mixed land-use systems include agro-ecological approaches, mixed farming, agroforestry and ecological water management. It also includes community-based conservation, where synergies are obtained between human use and biodiversity, and nature-based solutions, especially in metropolitan
areas. All these alternative options are characterized by high landscape diversity. Current models are able to evaluate options that highlight separation of functions, but they cannot evaluate the huge variety of options based on a mixture of land uses that combine a variety of functions.
Secondly, the models evaluate policy options with a very restricted set of biodiversity indicators. These indicators measure biodiversity only from an intrinsic value perspective (Nature for Nature), omitting the value of biodiversity for its contribution to human needs and well-being (Nature for Society), and its relational or cultural values (Nature as Culture) (see also Pascual et al., 2017). For example, management of the Dutch Oostervaarderplassen aims to mimic natural processes in order to increase biodiversity. Relational values — people’s attachment to large animals — are not included in these management decisions, which results in tensions between park managers and animal protection groups. Other examples arise from the perspective that humans cannot be separated from nature. This is a belief shared by many indigenous peoples. For example, entire ecosystems, such as rivers, can be regarded as living entities that have their own rights, and where people interact with. The lack of these values in models provides decision-makers with information that is
incomplete, potentially resulting in counterproductive decisions being made (Lundquist et al, 2017).
Thirdly, the models still lack certain relevant interactions, trade-offs and feedbacks, such as the lacking influence of changed local biodiversity on ecosystem services (e.g. ecosystem services, such as pollination or pest control, in reality depend on
biodiversity changes). In addition, the models ignore feedbacks from the ecosystem services to productivity (e.g. calculated changes in ecosystem services do not influence the models’ estimates of produced food, clean water or other products). Moreover, changes in ecosystem services that determine the suitability of land for certain functions, do not affect land allocation rules (e.g. places with few ecosystem services should be considered non-suitable for agriculture). This is currently not included in the model. These lacking interactions easily lead to overestimation of the impact of the various options.
If these three types of shortcomings are not addressed, the models will continue to confirm the options that divide functions, overlook the importance of multiple biodiversity values, and disregard potential trade-offs. These options are selected by decision-makers, which may lead to path dependency. The shortcomings also stimulate us to collect more data and assess more alternatives. Therefore, we will strengthen GLOBIO’s ability to evaluate new policy options, based on multifunctional land use and, thus, provide more comprehensive information for policymakers.
The next generation of the GLOBIO model will need to cope with these
shortcomings. My research will guide the development of that next generation by addressing 1) mixed multifunctional land-use systems; 2) multiple values; and 3) interactions, trade-offs and feedbacks.
My first line of research focuses on mixed multifunctional systems. In addition to the simple distinction between cropland, pasture, forest and other land uses, a variety of mixed forms of these general classes must be defined. Subsequently, relationships between these mixed land-use systems and biodiversity indicators will be
constructed, and ecosystem services associated with these systems will be quantified. Although the research on mixed land-use systems is limited (e.g. Tittonell, 2014), the scarce information in the literature will be collected. This information will be supplemented with expert and local knowledge and analysed using meta-analyses. This research is in line with the ongoing GLOBIO development project at PBL, which I am leading, jointly, with Aafke Schipper. It includes PhD research on the
metropolitan areas, which addresses the contribution of the variety of green and other open spaces to the livability of cities. And collaboration with the Radboud University and Vrije Universiteit. A new PhD project at the Environmental Systems Analyses group, funded by PBL, will start in the coming months and will focus on agricultural mixed systems and their associated ecosystem services. In addition, new MSc projects and internships are dedicated to adding relevant pieces to this puzzle. I will also seek co-operation with other research groups in Wageningen, including Farming Systems Ecology, Animal Production Systems and Resource Ecology. My second line of research focuses on multiple values. New indicators to better capture the intrinsic value and new indicators to value the contribution of
biodiversity to human needs will be explored. Addressing the relational and cultural value of biodiversity is a new emerging field. To describe qualitative indicators or establish quantitative ones for the relational and cultural values of biodiversity, requires input from various sources. This includes knowledge from experts and stakeholders from various backgrounds, information about what people consider valuable, and relevant indigenous knowledge, which requires a transdisciplinary approach.
The IPBES taskforce on scenarios and models (of which I lead the Technical Support Unit) and its Nature Futures project, offers the possibility to develop indicators for multiple values. In a starting co-operation I will work with Sylvia Karlsson-Vinckenhuizen and Esther Turnhout and others in Wageningen to contribute to the development of indicators for multiple values. Model teams, including the GLOBIO team, will be asked to establish relationships between pressure factors and these new
indicators. I will explore how experiences at the WUR-ESA group, in projects such as The Economics of Ecosystems and Biodiversity and the ecosystem-accounting framework may improve how the use ecosystem services values is included in GLOBIO.
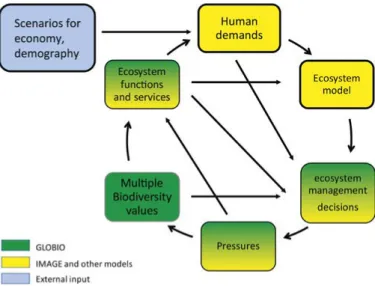
My third line of research addresses model feedbacks. With more interaction, trade-offs and feedback, the current linear approach from socio-economic changes to pressure factors and biodiversity indicators needs to be replaced with an interactive approach, where all elements act both as starting points and end points, representing these complex relationships. Including these interactions requires new developments in both ecosystem-services models and production models (figure 11).
Figure 11: Flow chart of the next generation of the IMAGE-GLOBIO model framework.
At PBL, feedback between the loss of various types of ecosystem services, such as carbon storage and nutrient cycling due to land degradation, are now being implemented in the IMAGE model. This is done in close co-operation with
Wageningen University and Research groups such as Soil Geography and Landscape. Other types of feedback between ecosystem services and agricultural productivity will be explored, together with the Wageningen groups, such as Farming Systems Ecology and others. PBL’s new PhD project will also provide a contribution. In addition, I started cooperating with biodiversity modelling groups at Stanford University, UNEP World Conservation and Monitoring Center in Cambridge and CSIRO in Australia.
With the next generation GLOBIO model, we will be able to evaluate alternative pathways to achieve the long-term biodiversity vision while simultaneously achieving other sustainable development goals. We will provide new pathways, based on a wider set op options and values to international policymakers, for the next round of discussions on the implementation of the new strategic plan of the Convention of Biological Diversity.
The IPBES taskforce on scenarios and models has initiated the Nature Futures project. I head the Technical Support Unit of this taskforce, and my role, with all other members of this unit, is to bring together experts, international policymakers and other stakeholders, from many different disciplines and backgrounds. These stakeholders are jointly formulating new pathways for biodiversity, recognising multiple values of biodiversity. The next generation of GLOBIO will belong to the major models that help develop these pathways. Results will be included in new IPBES assessments on biodiversity and ecosystem services and provide information to governments.
The next generation GLOBIO will add a much larger variety of options in response to decreasing biodiversity to the limited set currently debated by policymakers in many countries. Although it is easy to overestimate the role of models in polices, I hope our new model outcomes will finally lead to a much larger variety in landscapes and will increase biodiversity in many places on Earth. Promoting increased variety in
response to decreased biodiversity.
Let us quickly return to the Vinkeveld and see what the models tell us about the future. The dominant pathway towards a more sustainable future includes increased productivity, increase protection of nature, planting forests and reducing
consumption. Imagine Vinkeveld with far fewer tulip fields due to increased productivity and reduced consumption. Many of the tulip fields also may be converted into greenhouses. Imagine also an increase in tree cover, for example Pine trees planted at the edge of dunes to store carbon. An alternative pathway focuses on mixed systems and multi-functionality. Imagine a restored part of the inner dune landscape. Tulip fields are retained and are part of a system of strip-farming, including some zones of more natural vegetation across it, to provide services such as pest control and water retention. And there may even be a few nice houses scattered in the field. Not sure what the potential incentive for the responsible land managers could be to achieve this, but it is just an idea.
Beste mensen ik hoop dat ik jullie een inkijkje heb kunnen geven in de wereld van mondiale modellen1 en scenarios voor biodiversiteit en ecosystemen. Ik hoop ook dat ik wat inzicht heb gegeven over de richting waarin ik me de komende jaren wil bewegen. De leerstoel hier aan de Wageningen Universiteit geeft ruimschoots de gegelegenheid om die weg op te gaan. Graag wil ik de mensen bedanken die dit mogelijk hebben gemaakt. Dat zijn in de eerste plaats Keimpe Wieringa en Rik Leemans. Keimpe bedankt voor alle steun. Rik bedankt voor de intensieve discussies, en je adviezen. Zowel de vorige en de huidige directie van het Planbureau voor de Leefomgeving stimuleren de relaties met de Nederlandse universiteiten middels buitengewone hoogleraarschappen. Maarten Hajer, Reinier van den Berg, Hans Mommaas en Andre van Lammeren ik ben jullie zeer erkentelijk, dat ik daar een bijdrage aan mag geven. Verder wil ik de rector van Wagenin-gen Universiteit, Arthur Mol, bedanken voor het in mij gestelde vertrouwen.
Graag wil ik ook mijn promotor en co-promotor, Ton van der Wal en Marten Hemminga, bedanken voor hun grote stimulance in het begin van mijn wetenschappelijke carriere.
Collega’s en oud collega’s binnen het PBL en daarvoor het RIVM, wil ik graag bedanken voor alle samenwerking. Met sommigen zijn dat vele jaren van gedeelde ervaringen. Mijn collega’s van Milieu Systeem Analyse wil ik graag bedanken voor hun gastvrijheid. Ik heb me altijd thuis gevoeld op mijn rustige plekje, die ene dag in de week. Graag wil ik ook Alexander van Oudenhoven, Katalin Petz en Sarahí Nuñez, bedanken die ik heb mogen begeleiden in hun PhD traject. Ook dank aan de vele master studenten, die ik met hun scriptie heb mogen begeleiden.
I would also like to thank the many colleagues from the biodiversity modelling network and the IPBES community from all over the world. It has been and still is a privilege to work with Henrique Pereira, Carolyn Lundquist, Paul Leadley, Simon Ferrier, Jyothis Sathayapalan, TianXiang Yue, William Cheung, Carlo Rondinini, Neil Burgess, Isabel Rosa, Anne Larigauderie and many, many others.
Tot slot wil ik mijn vrienden en mijn familie bedanken. Fijn dat jullie er allemaal zijn. Ma ik ben ontzettend blij dat je hier vandaag in ons midden bent, ik hoop dat je genoten hebt. Pa zou dat zeker ook gedaan hebben. En Katrien, Joris en Wouter jullie bedank ik gewoon voor alles.
Dank voor jullie aandacht Ik heb gezegd
1 Een eerdere versie van de tekst is door Rik Leemans, Mark van Oorschot en Joris Alkemade kritisch bekeken, waarvoor dank.
References
Alcamo, J., Projectteam IMAGE. (1994) IMAGE 2.0: integrated modeling of global climate change. Kluwer Academic Publishers, pp 319.
Alkemade, R., van Oorschot, M., Miles, L., Nellemann, C., Bakkenes, M., ten Brink, B., (2009) GLOBIO3: a Framework to Investigate Options for Reducing Global Terrestrial Biodiversity Loss. Ecosystems 12, 374–390.
Alkemade, R., Reid, R.S., van den Berg, M., De Leeuw, J., Jeuken, M. (2013) Assessing the impact of livestock production on biodiversity in rangeland ecosystems. Proceedings of the National Academy of Science. 110, 20900–209005.
Bakkenes, M., Alkemade, J.R.M., Ihle, F., Leemans, R., Latour, J.B. (2002) Assessing effects of forecasted climate change on the diversity and distribution of European higher plants for 2050. Global Change Biology, 8, 390-407.
Benítez-López, A., Alkemade, R., Verweij, P.A. (2010) The impacts of roads and other
infrastructure on mammal and bird populations: a meta-analysis. Biological Conservation. 143, 1307–1316.
Benítez-López, A., Alkemade, R., Schipper, A.M., Ingram, D.J., Verweij, P.A., Eikelboom, J.A.J., Huijbregts, M.A.J. (2017) The impact of hunting on tropical mammal and bird populations. Science 356: 180-183.
Bommarco, R., Kleijn, D., Potts, S.G. (2013) Ecological intensification: harnessing ecosystem services for food security. Trends in Ecology and Evolution. 28, 230–238.
Cardinale, B.J, Duffy, J.E., Gonzalez, A., Hooper, D.U., Perrings, C., Venail, P., Narwani, A., Mace, G.M., Tilman, D., Wardle, D.A., Kinzig, A.P., Daily, G.C., Loreau, M., Grace, J.B., Larigauderie, A., Srivastava, D.S., Naeem, S. (2012) Biodiversity loss and its impact on humanity. Nature 486: 59-67..
CBD (2010) In: COP (Ed.), The Strategic Plan for Biodiversity 2011–2020 and the Aichi Biodiversity Targets. Decision X/2.
De Baan, L., Alkemade, R., Koellner, T. (2013). Land use impacts on biodiversity in LCA: a global approach. International Journal of Life Cycle Assessment. 18, 1216–1230.
Egan, T. (2006) The Worst Hard Time: The untold story of those who survived the Great American Dust Bowl. A Mariner Book, Houghton Mifflin Company, Boston, New York.
IPBES (2018): The IPBES regional assessment report on biodiversity and ecosystem services for Europe and Central Asia. Rounsevell, M., Fischer, M., Torre-Marin Rando, A. and Mader, A. (eds.). Secretariat of the Intergovernmental Science-Policy Platform on Biodiversity and Ecosystem Services, Bonn, Germany. 892 pages.
IPBES (2019) IPBES Global assessment report on biodiversity and ecosystem services. Brondizio, E.S., Settele, J., Díaz, S., Hien T. Ngo H.T. (eds.) Secretariat of the Intergovernmental Science-Policy Platform on Biodiversity and Ecosystem Services. Bonn, Germany.
Isbell, F., Calcagno, V., Hector, A., Connolly, A., Harpole, W.S., Reich, P.B., Scherer-Lorenzen, M., Schmid, B., Tilman, D., van Ruijven, J., Weigelt, A., Wilsey, B.J., Zavaleta, E.Z., Loreau, M. (2011) High plant diversity is needed to maintain ecosystem services. Nature 477: 199-203. Janse, J.H., Kuiper, J.J., Weijters, M.J., Westerbeek, E.P., Jeuken, M.H.J.L., Bakkenes, M., Alkemade, R., Mooij, W.M., Verhoeven, J.T.A. (2015) GLOBIO-Aquatic, a global model of human impact on the biodiversity of inland aquatic ecosystems. Environmental Science and Policy, 48, 99-114.
Kok, M. T. J., Alkemade, R., Bakkenes, M., van Eerdt, M., Janse, J., Mandryk, M., Kram, T., Lazarova, T., Meijer, J., van Oorschot, M., Westhoek, H., van der Zagt, R., van der Berg, M., van der Esch, S., Prins, A.G., van Vuuren, D. P. (2018). Pathways for agriculture and forestry to contribute to terrestrial biodiversity conservation: A global scenario-study. Biological Conservation, 221, 137–150.
Latour, J.B., Staritsky, I.G., Alkemade, J.R.M., Wiertz, J. (1997) De natuurplanner; Decision Support Systeem natuur en milieu. Versie 1.1. Rapportnummer 711901019, RIVM, Bilthoven, p69.
Lundquist, C.J., Pereira, H.M., Alkemade, R., den Belder, E., Carvalho Ribeiro, S., Davies, K., Greenaway, A., Karlsson-Vinkhuyzen, S.I.S.E., Kim, H., Lazarova, T., Pereira, L., Peterson, G., Ravera, F., van den Brink, T., Argumedo, A., Arida, C., Armenteras, D., Ausseil, A.-G., Baptiste, B., Belanger, J., Bingham, K., Bowden-Kerby, A., Cao, M., Nettleton-Carino, J., van Damme, P.A., Devivo, R., Dickson, F., Dushimumuremyi, J.P., Ferrier, S., Flores-Díaz, A., Foley, M., Garcia Marquez, J., Giraldo-Perez, P., Greenhalgh, S., Hamilton, D.J., Hardison, P., Hicks, G., Hughey, K., Kahui-McConnell, R., Wangechi Karuri-Sebina, G., de Kock, M., Leadley, P., Lemaitre, F., Maltseva, E., Mattos Scaramuzza, C.A.d., Metwaly, M., Nelson, W., Ngo, H., Neumann, C., Norrie, C., Perry, J., Quintana, R., Rodriguez Osuna, V.E., Röhrl, R., Seager, J., Sharpe, H., Shortland, T., Shulbaeva, P., Rashid Sumaila, U., Takahashi, Y., Titeux, T., Tiwari, S., Trisos, C., Ursache, A., Wheatley, A., Wilson, D., Wood, S., van Wyk, E., Yue, T.X., Zulfikar, D. (2017) Visions for nature and nature’s contributions to people for the 21st century. NIWA Science and Technology Series Report No. 83, NIWA, New Zealand. 123 pp.
Nunez, S., Arets, E., Alkemade, R., Verwer, C., & Leemans, R. (2019). Assessing the impacts of climate change on biodiversity: Is below 2°C enough? Climatic Change, 154, 351–365. Midolo, G., Alkemade, R., Schipper, A. M., Benitez-López, A., Perring, M. P., De Vries, W. (2019). Impacts of nitrogen addition on plant species richness and abundance: A global meta-analysis. Global Ecology and Biogeography, 28, 398–413.
OECD, 2012. OECD Environmental Outlook to 2050, the Consequences of Inaction. OECD Publishing, Paris.
Oppenheimer, M., Oreskes, N., Jamieson, D., Brysse, K., O’Reilly, J., Shindell. M. (2019) Discerning Experts: The Practices of Scientific Assessment for Environmental Policy. University of Chicago Press, Chicago.
Pascual, U., Balvanera, P., Díaz, S., Pataki, G., Roth, E., Stenseke, M., Watson, R.T., Başak Dessane, E., Islar, M., Kelemen, E., Maris, V., Quaas, M., Subramanian, S.M., Wittmer, H., Adlan, A., Ahn, S., Al-Hafedh, Y.S., Amankwah, E., Asah, S.T., Berry, P., Bilgin, A., Breslow, S.J., Bullock, C., Cáceres, D., Daly-Hassen, H., Figueroa, E., Golden, C.D., Gómez-Baggethun, E., González-Jiménez, D., Houdet, J., Keune, H., Kumar, R., Ma, K., May, P.H., Mead, A., O’Farrell, P., Pandit, R., Pengue, W., Pichis-Madruga, R., Popa, F., Preston, S., Pacheco-Balanza, D., Saarikoski, H., Strassburg, B.B., van den Belt, M., Verma, M., Wickson, F. Yagi, N. (2017) Valuing nature’s contributions to people: the IPBES approach. Current Opinion in Environmental Sustainability, 26-27, 7-16.
Perfecto, I., Vandermeer, J. (2010) The agroecological matrix as alternative to the and sparing/ agriculture intensification model. Proceedings of the National Academy of Science. 107, 5786–5791.
Sala, O.E., Chapin III, F.S., Armesto, J.J., Berlow, E., Bloomfield, J., Dirzo, R., Huber-Samwald, E., Huenneke, K.F., Jackson, R.B., Kinzig, A., Leemans, R., Lodge. D.M., Mooney, H.A., Oesterheld, M., Poff, N.L., Sykes, M.T., Walker, B.H., Walker, M., Wall, D.H. (2000) Global biodiversity scenarios for the year 2100. Science 287: 1770–1774.
sCBD, 2014. Global Biodiversity Outlook 4. Secretariat of the Convention on Biological Diversity, Montreal, pp. 155.
Schipper, A.M., Hilbers, J.P., Meijer, J.R., Antão, L.H., Benítez-López, A., de Jonge, M.M.J. Leemans, L.H., Scheper, E., Alkemade, R., Doelman, J.C., Mylius, S., Stehfest, E., van Vuuren, D.P., van Zeist, W-J., Huijbregts, M.A.J. (2019) Projecting terrestrial biodiversity intactness with GLOBIO 4. Global Change Biology (online).
Schulp, C.J.E., Alkemade, R., Klein Goldewijk, K., Petz, K. (2012) Mapping ecosystem functions and services in Eastern Europe using global-scale data sets. International Journal of Biodiversity Science, Ecosystem Services & Management, 8, 156-168.
Stehfest, E., van Vuuren, D., Kram, T., Bouwman, L., Alkemade, R., Bakkenes, M., Biemans, H., Bouwman, A., den Elzen, M., Janse, J., van Minnen, J., Muller, M., Prins, A.G., (2014) Integrated Assessment of Global Environmental Changes with IMAGE 3.0. Model Description and Policy Applications. PBL Netherlands Environmental Assessment Agency, The Hague.
Tittonell, P., 2014. Ecological intensification of agriculture—sustainable by nature. Current Opinions in Environmental Sustainability. 8, 53–61.
UNEP (2001) Nellemann, C., Kullerud, L., Vistnes, I., Forbes, B.C., Foresman, T., Husby, E., Kofinas, G.P., Kaltenborn, B.P., Rouaud, J., Magomedova, M., Bobiwash, R., Lambrechts, C., Schei, P.J., Tveital, S., Gron, O., Larsen, T.S., GLOBIO. Global methodology for mapping human impacts on the biosphere. UNEP/DEWA/TR.01-3.
UNEP (2007) Global environment outlook 4—environment for development. United Nations Environmental Programme, Nairobi
van Noordwijk, M., Brussaard, L. (2014) Minimizing the ecological footprint of food: closing yield and efficiency gaps simultaneously? Current Opinions in Environmental Sustainability. 8, 62–70.
van Vuuren, D.P., Kok, M., Lucas, P.L., Prins, A.G., Alkemade, R., van der Berg, M., Bouwman, L., van der Esch, S., Jeuken, M., Kram, T., Stehfest, E. (2015) Pathways to achieve a set of ambitious global sustainability objectives by 2050: explorations using the IMAGE integrated assessment model. Technological Forecasting and Social Change. 98, 303–323.
Vet, L., (2019) Duurzame troonrede 2019. https://www.duurzamedinsdag.nl/Nieuws/ Vos, C.C., Grashof-Bokdam, C.J., Opdam, P.F.M. (2014) Biodiversity and ecosystem services: does species diversity enhance effectiveness and reliability? Wettelijke Onderzoekstaken Natuur & Milieu, Wageningen.
'Current global biodiversity and ecosystem services models, despite large progress made in the past few years, have three main weaknesses: they only evaluate policy options that highlight separation of land-use
functions, overlook the importance of multiple biodiversity values, and disregard potential trade-offs. These options are selected by decision-makers, which may lead to path dependency. The next generation biodiversity models will need to cope with 1) mixed multifunctional land-use systems, providing more options to restore biodiversity; 2) multiple values, providing decision-makers with more comprehensive information; and 3) feedbacks, to avoid overestimation of the impact of the various policy options. The larger variety of options finally lead to increasing variety of landscapes and biodiversity.'