CHARACTERIZING THE EFFECT OF
INSTRUCTIONS ON DECISION MAKING
USING THE DRIFT DIFFUSION MODEL.
Word count: 7,246Arno Gekiere
Student number: 01408789Supervisor(s): Prof. Dr. Tom Verguts, Dr. Mehdi Senoussi
A dissertation submitted to Ghent University in partial fulfilment of the requirements for the degree of Master of Theoretical and Experimental Psychology
1 Preamble: Covid-19
To whom it may concern.
Covid-19 has required everyone to be flexible. In my case, for my thesis, it was no different. Originally, we had planned an EEG study where we would use machine learning to decode neural representations of expectation from brain signals. However, we could no longer guarantee the safety of participants and thus the original thesis as planned during my first-year master could no longer be executed.
Instead, we adapted and designed a new study, online. This required me to code an experiment from scratch using JavaScript, PHP, and HTML. Consequently, this allowed the experiment to be run in a browser and made it possible to collect data for a reaction time based task to be fitted to the drift diffusion model. In addition, all analyses scripts were completely built from scratch.
The research question and experimental task went through a lot finetuning over the past months. Unfortunately, the thesis deadline was not settled and changed in time for the ‘title deadline’. Therefore, the title may not seem completely suitable.
I would like to thank my supervisors for keeping my head in the game and consistently helping me plan out the next steps during numerous Skype calls.
Best wishes
2 Abstract
Expectations allow us to prepare a response in advance to a forthcoming sensory event, facilitating perceptual decision making. This means that expectation should act as a type of ‘top-down’ or cognitive control process that can influence perception, motor functions, and possibly overrule and overcome automatic responses. However, it remains unclear how behaviour is affected by these mechanisms at different processing stages in perceptual decision making. Thus, we leveraged the drift diffusion model (DDM) to disentangle distinct parameters related to the different processing stages. We considered two ways in which the DDM could account for the influence of expectation on perceptual decision making. First, a bias account, where expectation could shift the starting point of the evidence accumulation process by shifted the starting point towards an expect stimulus. Second, an accumulation account, in which expectations influence the rate of sensory evidence accumulation by increasing the sensitivity to evidence in favour of an expected stimulus. To achieve this, we used a priming task, in which we manipulate the proportion of congruent trials in separate blocks to induce expectation. Additionally, timescale is manipulated by including trials with both a short and long interval between cue and target. We found evidence for an accumulation account; evidence accumulation is stronger towards the expected stimulus. In contrast, the starting point was biased towards the cue (priming bias), but not expectation. Finally, our results indicate that - given enough time - expectation can overrule a priming bias.
3 Introduction
Expectation is a cognitive state during which we have relevant information about what is possible or probable prior to a forthcoming sensory event. Consequently, expectations allow us to prepare a response in advance to such a forthcoming event (Summerfield & Egner, 2009). This means that expectation should act as a type of ‘top-down’ or cognitive control process that can influence perception, motor functions, and possibly overrule and overcome automatic responses. Indeed, previous research has shown predictive cues can induce preparatory motor activity (de Lange, Rahnev, Donner, & Lau, 2013). Additionally, it has been shown that perception is influenced by forming a decodable template of the expected stimulus prior to stimulus presentation (Kok, Failing, & de Lange, 2014; Kok, Mostert, & de Lange, 2017).
However, it remains unclear how behaviour is affected by these mechanisms at different processing stages in perceptual decision making, from forming an expectation to preparing a response and actually producing a subsequent action. Most previous studies inducing expectation have only looked at reaction time (RT) and accuracy data or neural correlates. This makes it difficult to disentangle distinct parameters related to the different processing stages affecting behaviour in perceptual decisions. Furthermore, to the best of our knowledge, no studies have examined how prior expectation can overrule automatic responses across varying timescales. At the behavioural level we aim to use computational modelling to investigate in what way cognitive control in the form of instructed expectations affect behaviour at different processing stages (in time).
In essence, a perceptual decision can be conceptualized as a process of sensory evidence accumulation towards a decision bound. This process can be modelled using the drift diffusion model (DDM; Ratcliff & McKoon, 2008). The DDM assumes that in a two-choice task, an agent is sampling evidence (e.g. sensory information) at each time step for one of the two choices. Each choice option is represented as a separate boundary, one lower and one upper boundary. The evidence accumulation process starts at a starting point between these two boundaries (Figure 1). Consequently, when the accumulated evidence crosses one of these boundaries, a decision is made in favour of the choice associated with that threshold (Ratcliff & McKoon, 2008). The model has separate parameters that each explain different elements of the evidence accumulation process. First, (a) the drift rate parameter ‘v’ for the rate of evidence accumulation. When ‘v’ is positive the accumulation process tends to drift towards the upper bound, in contrast to when ‘v’ is negative, which is represented by a tendency to drift towards the lower bound. Secondly, (b) the decision bound parameter ‘a’ represents the amount of evidence that is required before a decision is made. And, (c) the starting point bias, which represents the point at which the evidence accumulation starts (parameter ‘z’ can start closer to either bound in a two-choice task; Figure 1).
4
Figure 1. Schematic of the standard drift diffusion model (DDM). Evidence accumulation is represented over time
and starts at starting point ‘z’ in between the two bounds (‘a’ vs ‘0’). Drift rate ‘v’ is the rate at which evidence is accumulated. Reaction time is reflected by how long it takes for the accumulation of evidence to reach one of the two bounds.
In the present study, we consider two ways in which the DDM could account for the influence of expectation on perceptual decision making. First, a bias account, where expectation could shift the starting point of the evidence accumulation process (Ratcliff, 1985; Mulder, Wagenmakers, Ratcliff, Boekel, & Forstmann, 2012), with evidence accumulation starting at a point closer to the boundary of the expected stimulus. This would mean that a top-down facilitation occurred during the anticipatory processing phase, before stimulus onset (Summerfield & Egner, 2009). Evidence for such a type of facilitation has been shown at both the motor and perceptual level, with predictive cues inducing preparatory motor activity (de Lange, Rahnev, Donner, & Lau, 2013) and even the reinstatement of stimulus templates in visual cortex prior to stimulus presentation (Kok, Failing, & de Lange, 2014; Kok, Mostert, & de Lange, 2017). Second, an accumulation account, in which expectation could influence the rate of sensory evidence accumulation, with agents being more sensitive for evidence in favour of the expected stimulus (Summerfield & Egner, 2009). This type of facilitation would occur at an early stage of processing after the expected stimulus was presented and would manifest as a steeper slope of evidence accumulation, modelled as a higher drift rate parameter ‘v’, toward the expected stimulus. Evidence for such top-down facilitation has been shown at the neural level, namely by frontal regions changing the sensitivity of relevant neurons in sensory cortex to an expected stimulus (Rahnev, Lau, & de Lange, 2011).
A Prior study by Mulder et al (2012), investigated expectation using a cued dot-motion task. In this task, dots are randomly moving on screen with a certain percentage of the dots showing coherent motion either to the left or to the right. Participants have to indicate which direction shows the coherent motion. To induce expectation, participants were cued (prior to stimulus onset) with a left or right arrow, indicating that dots were more likely to be coherent in the cued direction. They found that
5 the DDM could account for the influence of expectation on perceptual decision making by varying the starting point bias (evidence for the bias account). However, they used very long preparation times (3.4-5s) between the cue and the dot-motion task. Since the starting point bias reflects activity before stimulus onset (Summerfield & Egner, 2009), it follows that this parameter is more likely to be affected by longer preparation times. Furthermore, it does not take into account that the influence of expectation is also required to operate much faster, especially, given that even simply perceiving our sensory environment relies on a continuous stream of elementary judgments (O'Connel, Shadlen, Wong-Lin, & Kelly, 2018). Therefore, the present study considers much shorter timescales, and ascertains the effect of timescale by including two separate timescales.
Moreover, we utilize these varying timescales to study whether cognitive control induced by instructed expectation can overrule another bias or automatic response. To achieve this, we have to create a conflict where stimulus features favoured by an automatic response are in contrast with stimulus features favoured by an instructed expectation. Firstly, we know from priming research, that participants respond faster to a target when it was cued, with a stimulus with similar (or congruent) features (Dehaene, et al., 1998). Thus, seeing the cue in a priming task forms an automatic response bias towards a consecutively presented congruent stimulus (target). Consequently, to create a conflict we can instruct the participant to expect a target that is incongruent to the cue (i.e. with opposite features of the cue). Normally, the cue elicits a priming response (i.e. bias toward a congruent target). Therefore, we predict that when an incongruent stimulus is expected, it should create a conflict with the priming bias and a subsequent attempt to overrule that priming bias. We hypothesize that this should mainly affect the starting point bias of the DDM, as the conflict plays out before the target is presented. Additionally, we predict that shorter preparation times will be insufficient or only partially allow to overcome the priming bias, thus, shifting the starting point bias towards a congruent target. Longer preparation times should be sufficient and consequently shift the starting point bias towards an incongruent target. When the participant is instructed to expect mostly congruent trials, such a conflict would not exist, as the priming bias and expectation bias would both bias towards a congruent target. Therefore, we consider it unlikely for the starting point bias to be influenced in such an instructional block.
To achieve this, we adapted a simple priming task in which expectation is induced through blocked instructions. There are 3 instructional blocks. For the first block, the mostly incongruent block, a participant is told to expect mostly incongruent trials, to create a conflict between priming and expectation as discussed. In the second instructional block the participant is told to expect mostly congruent trials, only inducing an expectation and no conflict. Finally, there is a neutral block, where the instructions indicate that congruent and incongruent trials are equiprobable. The neutral block
6 serves as a control, as it only includes priming but no expectation and thus no conflict between priming and expectation.
For the present study we aim to use the DDM to study how expectation influences perceptual decision making, and how expectation might overrule a conflicting bias, at different timescales. Additionally, we will use a small-N design by including a small number of participants while collecting large amounts of data per participant. With the goal of finding the same DDM model as best fitting model for each participant and thus replication at the individual level (Smith & Little, 2018). A factorial model comparison will be used to compare the coherence of model fitness between participants (van den Berg, Awh, & Ma, 2014).
7 Method
The present study made use of a small-N design by having a small number of participants, but a large number of trials per participant. Using the hDDM package as implemented in Python (Wiecki, Sofer, & Frank, 2013), there is no improvement of parameter estimation above 500 trials per condition and high precision is reached at around 160 trials per condition (Lerche, Voss, & Nagler, 2016). Our task was piloted to estimate the number of trials per condition that would be feasible to collect in 1 hour. This revealed that the condition containing the least number of trials would only amount to 36 trials per participant, which would be insufficient and result in very noisy data per participant. Therefore, it was decided to focus on collecting more trials per participant to increase signal-to-noise, rather than having more participants. Furthermore, some of the earliest and most robust findings to date (even in the face of a replication crisis) in cognitive psychology have used small-N designs, with large amounts of data per participant (Smith & Little, 2018). In addition, it was also more feasible to recruit a small number of participants when considering the time constraints that were introduced due to a shift in the focus of this study due to Covid-19.
Participants
5 participants took part in this experiment (3 males, 2 females, mean age = 22.6, SD = 3.6). All participants were recruited through social media and each participant was paid € 60 after completing 6 sessions of the task.
Materials
The stimuli used as a cue and target in the main task were 2 sinusoidal gratings with either an orientation of
-
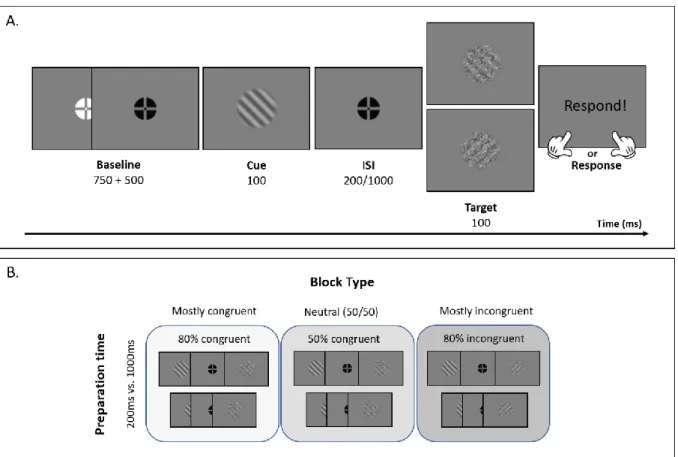
45° (left) or +45° (right) from the vertical. For each orientation, 120 different target gratings were created by applying a unique noise filter to each of them. In addition, all gratings were presented with a contrast of 50%. Finally, a white and black fixation cross were used during the tasks. Figure 1A depicts the time course of one trial, illustrating the materials including an example of two noisy target gratings.Procedure
All participants performed an RT-based task. The task was administered online, accessible through the internet browser of the participant by using their own personalized link. To achieve this we developed the task using PHP, HTML and JavaScript combined with the JsPsych package (De Leeuw, 2015). Data collection took place in six sessions for each participant. A session lasted one hour, thus in total we recorded 6 hours’ worth of data per participant. In each session, participants performed the same task and they were not allowed to do more than two sessions per day to prevent fatigue. All participants finished their 6 sessions within 7 days of starting their first session.
8 Task. On each trial (Figure 2A), participants had to respond to (target) sinusoidal gratings that could either be oriented left (-45°) or right (45°) from the vertical. Crucially, every target was preceded by another sinusoidal grating, the cue. The cue could either have the same or the opposite orientation compared to the target, respectively named congruent and incongruent trials. Additionally, we manipulated the time interval between cue and target, so that the target was either presented after a short (200ms) or long (1000ms) delay following the cue, giving participants varying preparation time. A grace period of 1250ms was given between trials. During this period, the colour of the fixation cross was white and turned to black to signal the beginning of a new trial.
Figure 2. (A) Visual depiction of the task. Each trial starts with the presentation of a fixation cross, referred to as
the baseline, and lasts for 1250ms. The fixation cross is white for the first 750ms of the baseline and turns black for the remainder of the baseline. After the baseline period, the cue (grating -45° or +45° oriented from the vertical) is presented for 100ms. The cue is followed by a 200 or 1000ms delay period (interstimulus interval or ISI) before the target is presented. The target (45° or -45° oriented grating) is presented for 100ms. At the offset of the target there is a response window, during which the participant has to report the orientation of the target grating, a right button press for a 45° orientation and a left button press for a -45° orientation. Once the response has been given, the baseline with a white crosshair follows indicating the start of a new trial. (B) A visual overview of the design. Expectation is manipulated by varying the proportion of congruent to incongruent trials within three different block types. Additionally, all trials can either have a short or long preparation time (200ms vs. 1000ms).
There were 3 different block types (mostly congruent, mostly incongruent and neutral; Figure 2B), each block type had a different proportion of congruent to incongruent trials. For the mostly incongruent blocks, the cue and target had an opposite orientation for 80% of the trials, and the same orientation for the remaining 20%. In the second and mostly congruent block type, 80% of the trials had a target
9 with the same orientation as the cue while 20% had an opposite orientation. For the neutral block type, the probability of incurring a congruent or incongruent trial was equal, 50% of the trials contained a cue and target with the same orientation while 50% had an opposite orientation.
Per session, participants performed 3 blocks, one for each of the block types. The order of the blocks was randomized at the start of each session. Additionally, before the start of each block, participants were instructed about which block type they would be performing (i.e. the proportion of congruent to incongruent trials). Furthermore, each block contained two breaks and reaffirmed the block type including instructions for the proportion of congruent to incongruent trials.
Finally, a practice run of 40 trials preceded the start of each block, to ensure that the participant was familiar with the proportion of congruent to incongruent trials when it changed between blocks. Additionally, participants received feedback during these practice trials (but not during regular trials). The feedback displayed “correct” in green text and “incorrect” in red text for 500ms, respectively for correct and incorrect responses.
Planned Design & Analyses
The experimental design contains (a) cue-target congruency (congruent vs. incongruent), (b) interstimulus interval between cue and target, referred to as preparation time (200ms vs. 1000ms), and (c) block instructions (20% vs. 50% vs. 80% congruent trials, respectively, mostly incongruent, neutral and mostly congruent) as its within-subject independent measures. To be clear, preparation time is manipulated trial-to-trial, every block contains an equal amount of trials with both preparation times. Cue-target congruency is also manipulated trial-by-trial, but the ratio of congruent to incongruent trials depends on the block instructions (e.g. mostly incongruent blocks contain 20% congruent trials and 80% incongruent trials). For the dependent variable we will measure RTs and accuracy of participants to the target gratings.
For the analysis, we use computational modelling of participant choices during the task and their RT distributions to investigate our hypotheses. To achieve this, we will fit hierarchical DDMs to estimate model parameters on the participant level using the hDDM package as implemented in Python (Wiecki, Sofer, & Frank, 2013). In a hierarchical DDM, model parameters for each individual subject and treated as random effects. Model parameters are drawn from group-level distributions and the parameters of those distributions are simultaneously estimated with the parameters for each individual participant. This constrains possible extreme values (due to noise in the data) for parameters to be less extreme (Ratcliff & Childers, 2015). More specifically, we will estimate the boundary, drift rate and starting point bias parameters. Drift rate and starting point bias are allowed to vary depending on the three independent factors (trial congruency, preparation time and block instructions). Furthermore, in line
10 with the ‘Small is Beautiful’-philosophy (Smith & Little, 2018) we do not wish to force every participant into the same model. At the same time, we want to check for similarities between participants. Therefore, we aim to run a factorial model comparison (van den Berg, Awh, & Ma, 2014). In this comparison, we consider all possible combinations in which drift rate and starting point bias can vary on one or more of the three experimental factors (49 combinations). This is done for each participant separately; all models are then compared to the null model fitted for that participant. For the null model, the estimated parameters are still included in the model, but are not allowed to vary across any condition. To quantify the factorial comparison, deviance information criterion (DIC) is used (Spiegelhalter, Best, Carlin, & van der Linde, 2002; Wiecki, Sofer, & Frank, 2013). DIC is based on the likelihood that the model would replicate a dataset which has the same structure as the observed dataset.
Once the appropriate model is selected, the posterior probability that the estimated parameters differ across the varying conditions will be computed using a Bayesian significance test as implemented in the hDDM package.
Hypothesized Results
We hypothesize different effects on drift rate and starting point bias for congruent and incongruent trials depending on the preparation time and block instructions. Each hypothesis is illustrated in figures Figure 3 and Figure 4. For each hypothesis, we consider the scenario where the target orientation was left-oriented, thus the correct response would be ‘left’ while the incorrect response would be ‘right’ (note that one could just as well choose the reverse scenario without affecting the hypotheses; target that is right-oriented with ‘right’ response as correct response).
Figure 3. Visual illustrations of stronger drift rate in line with the expectation of the participant. ‘LL’ stands for
11
(A) We predict a stronger drift rate when congruent trials are expected in mostly congruent blocks. (B) Here,
incongruent trials are expected due to the mostly congruent block and thus we predict a stronger drift rate for incongruent trials.
Drift rate will vary depending on expectation (accumulation account). For the drift rate, we hypothesize that evidence accumulation should be faster when the cue-target relationship follows the expectation of the participant. For the mostly congruent blocks, participants will expect congruent trials. Thus, there should be a stronger drift rate towards correct decisions for congruent trials (Figure 3A, full line) as opposed to incongruent trials (Figure 3A, dashed line). However, for the mostly incongruent block, incongruent trials become the expected outcome. Thus, we expect a reversal of these effects, with a stronger drift rate towards correct decisions for incongruent trials (Figure 3B, dashed line) when compared to congruent trials (Figure 3B, full line).
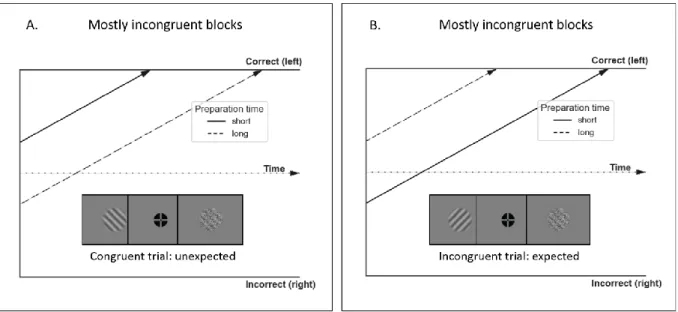
Figure 4. Visual illustration of our hypotheses on the effect of preparation time on starting point bias. (A) This
image depicts an unexpected congruent trial (left cue, left target) in mostly incongruent blocks. For short preparation times we predict the participant will be biased by the priming effect of the cue, which would correctly bias the starting point towards a left oriented target in this case (correct response bound). Whereas, an expectation bias during longer preparation times would incorrectly bias the starting point towards a right target (incorrect bound) (B) Example of an incongruent trial (right cue, left target), as expected in mostly incongruent blocks. For short preparation times we expect a regular priming bias, which would incorrectly bias towards a right oriented target (incorrect bound) in this case. Whereas, an expectation bias during longer preparation times would incorrectly bias towards a left oriented target (correct bound).
Expectation will overrule a priming bias, but only for longer preparation times. We maintain that the cue already elicits a priming response conform with its orientation (towards congruent trials). Consequently, as incongruent trials are expected in mostly incongruent blocks, the priming response should conflict with the expectation that the target will have the opposite orientation. We hypothesize that cognitive control will be required to overcome the conflicting priming bias. Furthermore, we hypothesize that only the long – but not the short preparation time – will be enough time to overcome the response evoked by the cue. Therefore, we predict that when there is only a short time to prepare,
12 the participant will be biased by the priming effect of the cue (priming bias) and not their expectation of what the target will be. In Figure 4B an incongruent trial (right oriented cue, left oriented target) during a mostly incongruent block is depicted. In this case, the priming bias would favour an incorrect response (right target). Therefore, if a long preparation time is sufficient to overcome the priming bias, the starting point should shift closer to the expected incongruent response (left target; correct bound). In contrast, if a short preparation time is insufficient to overcome the priming bias, the starting point should shift closer to an incorrect congruent trial (right target; incorrect bound). Figure 4A depicts an unexpected congruent trial (left cue, left target). In this case, the priming bias should correctly favour a left target. Therefore, if the priming bias was not overruled by top-down expectations when given a short preparation, the starting point should be shifted closer to the correct bound. In contrast, a longer preparation time, where the expectation of an incongruent trial would have overruled the priming bias, the starting point should be shifted towards an incorrect right target.
13 Results
Descriptive Statistics
Each of the 3 blocks contained 360 trials, thus a participant performed 1080 trials in total per session. Over six sessions this led to 6480 trials per participant. Trials with RTs slower than 1500ms are considered to be too slow for the drift diffusion model (Ratcliff & McKoon, 2008) and were therefore excluded from further analyses, this amounted to 0.2% of all trials.
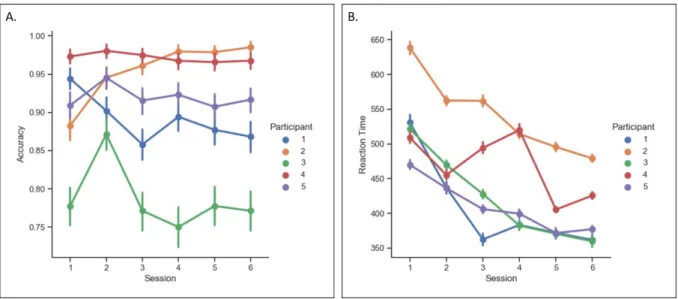
General. All participants became faster in responding to target gratings over time (Figure 5B) while their accuracy remained quite stable across sessions (Figure 5A).
Figure 5. (A) This graph shows the mean accuracy (and SD) per session, per participant. (B) The second graph
depicts the average RT (and SD) per session, per participant.
Reversal of congruency effect. As expected, the mostly congruent blocks show faster RTs for congruent trials than for incongruent trials. Additionally, when the expectation of participants was changed to expect incongruent trials (mostly incongruent block), we see a reversal of the congruency effect where incongruent trials are now responded to faster (Figure 6B). The same results were found for accuracy. The mostly congruent blocks show a higher accuracy for congruent trials than for incongruent trials with a reversal of this effect in the mostly incongruent block (Figure 6A).
14
Figure 6. (A) Aggregated accuracy data over participants for every condition. (B) Reaction times aggregated over
participants, for every condition.
Lack of priming. Surprisingly, there seems to be no evidence for priming in the RT data as on average participants were actually slightly faster for incongruent trials as opposed to congruent trials in the neutral instruction block (Figure 6B).
Computational Modelling: the drift diffusion model
Factorial Model Comparison. 50 separate drift diffusion models were fitted for every participant, each model included boundary, drift rate and starting point bias as parameters. However, only drift rate and starting point bias were allowed to vary for the three experimental factors (trial congruency, block instruction and preparation time). When considering all possible combinations, there are 49 different models where drift rate and starting point bias are allowed to vary on one or more of the three factors (50 when including the null model). A heatmap was created (Figure 7) that depicts, for each participant, a DIC value for each model relative to the DIC value of the null model for that participant. Visually, it is already quite clear that there is a high correspondence of model performance across participants. Additionally, by computing the Spearman rank correlation coefficient between each pair of participants it is possible to measure the consistency of model performance across participants. Indeed, all ten pairwise correlations were significant (p < 0.001) with an average correlation coefficient of 0.84 (SD=0.056).
15
Figure 7. A heatmap of the factorial model comparison. For each participant (x-axis) all combinations of models
were made (y-axis) where drift rate (v) and starting point bias (z) were allowed to vary on one or more of the three experimental factors. On the y-axis, the model names follow a letter scheme where ‘i’ corresponds to preparation time, ‘b’ matches block instructions and ‘c’ stands for trial congruency. For instance, ‘v-ibc | z-ibc’ is a model in which drift (v) and bias (z) were allowed to vary on all three factors. The colours correspond to model fitness, as measured by DIC. Colder colour indicates poorer model fit, warmer colour indicates better model fit. Additionally, the three best performing models were labelled for each participant.
Model Selection. The top 3 models per participant are numbered on Figure 7, where 1 corresponds with the best fitting model for that participant. Although DIC negatively considers model complexity, the most complex model, where drift rate and starting point bias are allowed to vary on all three factors ranks highest for 4 out of 5 participants. For the 5th participant, this model ranks 3rd in
performance. However, the difference in DIC values between the most complex model and the best performing model for that participant is less than 8. This means that the most complex model can still be considered for that participant (Spiegelhalter, Best, Carlin, & van der Linde, 2002). For these reasons as well as the high consistency (spearman rank test) of model performance across participants, the most complex model was selected (with drift and bias varying for all three factors). Consequently, the model was fitted on the data of all participants and used for all further hypothesis testing. In addition, all summary statistics of the observed data fell within the 95% credibility interval of the RTs generated by the fitted model.
16 Hypothesis testing
Because hDDM estimates the model parameters in a Bayesian framework, we are able to calculate p-values by directly comparing the posterior distributions of different conditions (Lindley, 1965; Wiecki, 2014).
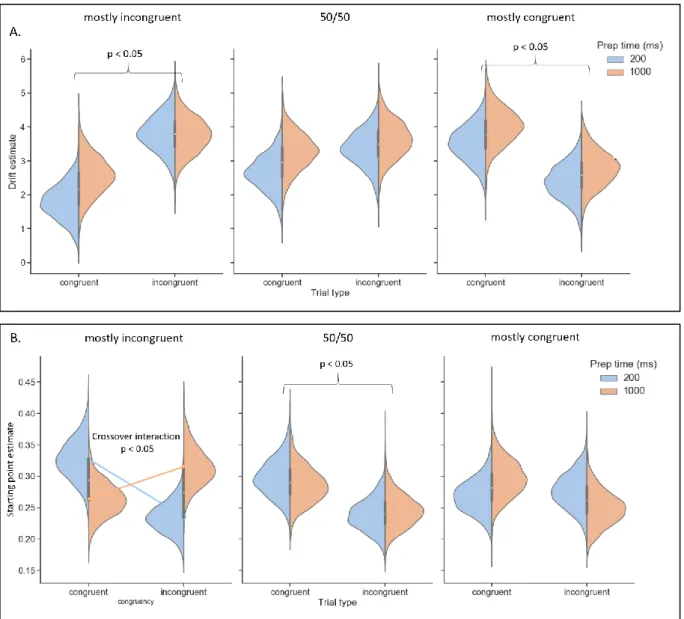
Figure 8. (A) Visual representation of the posterior distributions for the drift rate estimates, for every condition.
Drift rate is higher when the target was expected, for both mostly incongruent (p < 0.05) and mostly congruent (p < 0.05) blocks. (B) Posterior distributions of the starting point bias estimates are visually represented for every condition. The neutral block shows a higher bias towards the correct decision for congruent trials when compared to incongruent trials (p < 0.05). Additionally, there is a clear significant crossover interaction between preparation time and trial congruency for the mostly incongruent blocks (p < 0.05).
Drift rate varies depending on the expectation of the participant (accumulation account). Drift rate varied as predicted, with a stronger drift rate when the target was in line with the expectation of the participant (Figure 8A). As congruent trials were highly expected in the mostly congruent block, there was stronger drift rate when compared to incongruent trials (p < 0.05; 3rd column in Figure 8A).
17 drift rate when compared to congruent trials (p < 0.05; 1st column in Figure 8A). No such difference
between congruent and incongruent trials was found on drift rate for the neutral block (p > 0.05; 2nd
column in Figure 8A). Together, these results show that evidence is accumulated in favour of the expectation of the participant and not in favour of the orientation of the cue or priming.
A short preparation time is not sufficient to overcome a priming bias before target presentation. The neutral block shows a higher bias towards the correct decision for congruent trials (p < 0.05; 2nd column
in Figure 8B). This indicates that when there is no influence of expectation, the participant is biased towards responding in accordance with the orientation of the cue, referred to as a priming bias. For mostly incongruent blocks, there are no main effects of either preparation time or cue-target congruency, but this is due to a clear crossover interaction effect (p < 0.05; 1st column in Figure 8B).
This means that the effect of trial congruency on starting point bias reverses depending on whether there is a short vs long preparation time. When incongruent trials are expected due to the mostly incongruent block, expectation is able to overcome the priming response bias elicited by the cue, but only when the participant was given longer time to prepare. When the participant was given only a short time to prepare, the participant is biased by the cue and not their expectation of what the target will be. In mostly congruent blocks, when there is an expectation but no conflict, no effect of starting point bias was found. Together, these results indicate that the starting point is affected by a priming bias. And, an expectation bias can overrule the priming bias (given enough time), but not when there is an expectation without conflict (i.e. mostly congruent blocks).
18 Discussion
We aimed to investigate in what way cognitive control in the form of instructed expectations affect different processing stages in time and in the face of conflict. To accomplish this, we fitted hierarchical DDMs to the data collected on an RT-based priming task. In a cueing task, we manipulated expectation by including blocks with different proportions of congruent to incongruent trials. Given evidence from previous neuroimaging studies into the mechanisms of expectation, we considered two ways in which the DDM could account for the influence of expectation on perceptual decision making – an accumulation account and a bias account. Additionally, we manipulated whether there was a conflict present between a priming bias and the expected stimulus. We hypothesized that the conflict should mainly affect the starting point bias of the DDM, as the conflict plays out before the target is presented.
First, the DDM indicated evidence for an accumulation account of expectation. Results showed that evidence accumulation is stronger towards the expected stimulus for both shorter and longer timescales, even when the expected stimulus was incongruent to the cue. Secondly, in contrast, the starting point was biased towards the cue (priming bias), but not expectation. However, when the priming bias conflicted with the expected stimulus, the starting point bias shifted to favour the expected stimulus at longer preparation times. Thus, we successfully demonstrated that - given enough time - expectation can overrule or overcome a priming bias.
Interestingly, our results in favour for an accumulation account are in contrast to the results found by Mulder et al (2012) that support a bias account. However, they used considerably larger preparation times between cue and target. Since the starting point bias reflects activity before stimulus onset (Summerfield, 2008), it follows that this parameter is more likely to be affected by larger preparation times. Another explanation that has been suggested before mentions that when the difficulty across trials is fixed, the starting point bias rather than the drift rate is affected (Bogacz, Brown, Moehlis, Holmes, & Cohen, 2006; Mulder, Wagenmakers, Ratcliff, Boekel, & Forstmann, 2012). Indeed, Mulder et al (2012) did not vary difficulty across trials. In contrast, our target stimuli gratings were created by applying a unique noise filter to each of them, using a randomization process that used the same ‘noise level’ for each target. Nonetheless, even within the same noise level there was a certain variability in how recognizable the target orientation was. Thus, it should be considered that the difficulty of trials in our task was not completely fixed.
Possible Neural Mechanisms
Starting point bias and drift rate reflect distinct parameters related to different processing stages in perceptual decision making. Effects on starting point bias and drift rate, respectively reflect a mechanism prior to target and post target presentation. This makes it possible to link them to distinct
19 neural mechanisms that have been proposed. In fact, several neural mechanisms have been proposed in research on expectation that can account for our findings. For example, our results for drift rate can be explained by frontal regions changing the sensitivity of relevant neurons in sensory cortex to an expected stimulus (Rahnev, Lau, & de Lange, 2011), allowing faster evidence accumulation (stronger drift) towards the expected stimulus. Additionally, the effects we found on starting point bias can both be explained on a perceptual level with prior expectations that induce prestimulus templates (Kok, Mostert, & de Lange, 2017), and at a motor level with predictive cues that induce preparatory motor activity (de Lange, Rahnev, Donner, & Lau, 2013). However, it is not clear how such motor and perceptual mechanisms would interact with each other, or how they are instantiated. It has been suggested before that the early visual cortex act as a multiscale cognitive blackboard for read and write operations by cognitive states such as expectation (Roelfsema & de Lange, 2016). Within this blackboard framework, it is possible that a prestimulus template of the expected stimulus is written to the visual cortex and subsequently used by a read operation to match a response to the expected stimulus and induce premotor activity. Combined with our results from computational modelling, future neuroimaging studies could shed more light on such a chain of events.
Future Direction
In fact, we propose a neuroimaging study using electroencephalogram (EEG) or magnetoencephalogram (MEG) in combination with multivariate decoding analysis to delineate the neural chain of events, from forming an expectation to preparing a response and actually producing a subsequent action. For the neuroimaging technique, EEG and MEG are recommended for their excellent temporal resolution, allowing assessment of dynamic cognitive processes over short timescales (da Silva, 2013). Additionally, analysis of EEG or MEG data using multivariate decoding techniques allows for decoding of distinct neural representations across time (Grootswagers, Wardle, & Carlson, 2017). Using the task from the present study, distinct neural representations should be present in the neuroimaging data. Initially (1) there should be a neural representation associated with the physically present stimulus (the cue). And, if the cue automatically elicits a motor response associated with its features, (2) a neural representation of the motor preparation. Then, (3) a neural representation for the sensory template of the expected stimulus should follow before the target appears. And, (4) a neural representation for the motor preparation that is prepared for the expected stimulus should also be present. Finally, (5) the neural representation of the physically presented target and (6) its associated motor preparation response. In order to decode these representations, classifiers must be trained to associate separate brain activation patterns for the left- and right-oriented gratings (perceptual classifier) and left-hand vs right-hand task responses (motor classifier). The perceptual classifier should be used to decode both the neural representation of the physically
20 present stimulus as well as the sensory template of the expected stimulus (neural representations 1 and 3). The motor classifier should serve to decode motor preparation associated with the required response to a left-oriented grating vs a right-oriented grating (neural representations 2 and 4). In mostly incongruent blocks, 3 should be decoded as the incongruent sensory representation of 1. And, 4 should be decoded as the opposite motor preparation to 2. Depending on the chain of events, 3 could be generated at the same time as 4, if they are produced by the same biasing mechanism. Or, if the sensory template is used by a read operation which in turn then drives the motor response, it should precede the motor preparation. Additionally, in line with the evidence we found for an accumulation account of expectation, neural representations 5 and possibly 6 should show higher decoding accuracy when they were expected compared to when they were unexpected (evidence before by Kok, Jehee, & Floris (2012)).
Conclusion
We found evidence for an accumulation account; evidence accumulation is stronger towards the expected stimulus. In contrast, the starting point was biased towards the cue (priming bias), but not expectation. Moreover, our results indicate that - given enough time - expectation can overrule a priming bias. Finally, we proposed a new study to shed more light on the neural mechanisms involved in the chain of events, from forming an expectation to preparing a response and actually producing a subsequent action.
21 References
Bogacz, R., Brown, E., Moehlis, J., Holmes, P., & Cohen, J. (2006). The physics of optimal decision making: A formal analysis of models of performance in two-alternative forced-choice tasks. Psychological review, 113, 700-765. doi:10.1037/0033-295X.113.4.700
da Silva, F. L. (2013). EEG and MEG: Relevance to Neuroscience. Neuron, 80(5), 1112-1128. doi:10.1016/j.neuron.2013.10.017
de Lange, F., Rahnev, D. A., Donner, T. H., & Lau, H. (2013). Prestimulus Oscillatory Activity over Motor Cortex Reflects Perceptual Expectations. Journal of Neuroscience, 33(4), 1400-1410. doi:10.1523/jneurosci.1094-12.2013
De Leeuw, J. R. (2015). jsPsych: A JavaScript library for creating behavioral experiments in a web browser. Behavior Research Methods, 47(1), 1-12. doi:10.3758/s13428-014-0458-y Dehaene, S., Naccache, L., Le Clec'h, G., Koechlin, E., Mueller, M., Dehaene-Lambertz, G., . . . Le
Bihan, D. (1998). Imaging unconscious semantic priming. Nature, 395, 597-600. doi:10.1038/26967
Grootswagers, T., Wardle, S. G., & Carlson, T. A. (2017). Decoding Dynamic Brain Patterns from Evoked Responses: A Tutorial on Multivariate Pattern Analysis Applied to Time Series Neuroimaging Data. Journal of Cognitive Neuroscience, 29(4), 677-697.
doi:10.1162/jocn_a_01068
Kok, P., Failing, M. F., & de Lange, F. P. (2014). Prior expectations evoke stimulus templates in the primary visual cortex. Journal of Cognitive Neuroscience, 26(7), 1546-1554.
doi:10.1162/jocn_a_00562
Kok, P., Jehee, J. F., & Floris, d. P. (2012). Less is more: expectation sharpens representations in the primary visual cortex. Neuron, 75(2), 265-270. doi:10.1016/j.neuron.2012.04.034
Kok, P., Mostert, P., & de Lange, F. P. (2017). Prior expectations induce prestimulus sensory templates. Proceedings of the National Academy of Sciences, 114(39), 10473–10478. doi:10.1073/pnas.1705652114
Lerche, V., Voss, A., & Nagler, M. (2016). How many trials are required for parameter estimation in diffusion modeling? A comparison of different optimization criteria. Behavior Research Methods, 49. doi:10.3758/s13428-016-0740-2
Mulder, M. J., Wagenmakers, E.-J., Ratcliff, R., Boekel, W., & Forstmann, B. U. (2012). Bias in the Brain: A Diffusion Model Analysis of Prior Probability and Potential Payoff. Journal of Neuroscience, 32(7), 2335-2343. doi:10.1523/JNEUROSCI.4156-11.2012
O'Connel, R. G., Shadlen, M. N., Wong-Lin, K., & Kelly, S. P. (2018). Bridging Neural and
Computational Viewpoints on Perceptual Decision-Making. Trends in Neurosciences, 11, 838-852. doi:10.1016/j.tins.2018.06.005
Rahnev, D., Lau, H., & de Lange, F. P. (2011). Prior Expectation Modulates the Interaction between Sensory and Prefrontal Regions in the Human Brain. Journal of Neuroscience, 31(29), 10741-10748. doi:10.1523/JNEUROSCI.1478-11.2011
22 Ratcliff, R. (1985). Theoretical interpretations of the speed and accuracy of positive and negative
responses. Psychological Review, 92(2), 212-225. doi:10.1037/0033-295X.92.2.212 Ratcliff, R., & Childers, R. (2015). Individual Differences and Fitting Methods for the Two-Choice
Diffusion Model of Decision Making. Decision (Washington, D.C.). doi:10.1037/dec0000030 Ratcliff, R., & McKoon, G. (2008). The Diffusion Decision Model: Theory and Data for Two-Choice
Decision Tasks. Neural Computation, 20(4), 873-922. doi:10.1162/neco.2008.12-06-420 Roelfsema, P. R., & de Lange, F. P. (2016). Early Visual Cortex as a Multiscale Cognitive Blackboard.
Annual Review of Vision Science, 2(1), 131-151. doi:10.1146/annurev-vision-111815-114443 Smith, P., & Little, D. (2018). Small is beautiful: In defense of the small-N design. Psychonomic Bulletin
& Review, 25, 2083-2101. doi:10.3758/s13423-018-1451-8
Spiegelhalter, D. J., Best, N. G., Carlin, B. P., & van der Linde, A. (2002). Bayesian measures of model complexity and fit. Journal of the Royal Statistical Society Series B, 64(4), 583-639.
doi:10.1111/1467-9868.00353
Summerfield, C., & Egner, T. (2009). Expectation (and attention) in visual cognition. Trends in cognitive sciences, 13, 403-9. doi:10.1016/j.tics.2009.06.003
van den Berg, R., Awh, E., & Ma, W. J. (2014). Factorial comparison of working memory models. Psychological review, 121(1), 124-149. doi:10.1037/a0035234
Wiecki, T. V., Sofer, I., & Frank, M. J. (2013). HDDM: Hierarchical Bayesian estimation of the Drift-Diffusion Model in Python. Frontiers in neuroinformatics, 7(14).
doi:10.3389/fninf.2013.00014
Yon, D., Zainzinger, V., de Lange, F., Eimer, M., & Press, C. (n.d.). Action biases perceptual decisions toward expected outcomes. JEP:General. doi:10.31234/osf.io/3zp8n