Achieving Food Security and Environmental
Sustainability in Southeast Asia:
A Policy Challenge
W.R. Mahanani
This study was conducted on behalf and for the account of the Netherlands’ Ministry of
Public Housing, Spatial Planning and the Environment, and the United Nations Environment
Programme (UNEP), within the framework of RIVM project 402001, contributions to the
RIVM, P.O. Box 1, 3720 BA Bilthoven, telephone: 31 - 30 - 274 91 11; telefax: 31 - 30 - 274 29 71
Global Environment Outlook.
Abstract
In order to get a thorough picture on the possible situation of food and the environment in Southeast Asia in 2030 and to identify the areas that need policy intervention, five scenarios on future food production are reviewed and compared here. These scenarios include: 1) FAO AT 2015/30 which is taken as the baseline development; UNEP’s GEO-3 2) Policy Reform and 3) Market Forces scenarios; and IPCC scenarios 4) B1 and 5) A1B as interpreted and elaborated in IMAGE 2.2 model. Based on these scenarios, a set of policy measures for ASEAN (Association of Southeast Asia Nations) is identified, especially regarding crop production. Increased crop production in the region will be achieved to a large extent by intensification. There is room for ASEAN to foster the integration of environmental concerns into agricultural policy. Closer networking between the agricultural and the environmental unit is very important for more effective and efficient co-operation. It may be necessary for ASEAN to set up a project to formulate a new ASEAN Common Agricultural Policy (ACAP), covering such elements as: developing agri-environmental indicators for the region; improving fertiliser efficiency; limiting pesticide; limiting methane emission from wetland rice; managing agricultural land expansion; limiting soil degradation; directing genetically modified (GM) crops development with close scrutinisation; enhancing rural development; and taking advantage from international agricultural trade by active and co-ordinated participation in trade talks.
Acknowledgement
There is a long list of people who have helped me in carrying out this study and finally writing this report. I am particularly grateful for the invaluable contributions of Jan Bakkes, Lex Bouwman and Rik Leemans at RIVM. Owing to their expertise and, above all, their sincere interest in my project, they have provided me with exceptionally helpful support and guidance. I would also like to thank Henk Blokland and Jan Schreur, my supervisors at Saxion Hogeschool IJselland in Deventer, for their advice and guidance especially to keep this project in line with the study objectives of the International Masters Programme. To Jelle Bruinsma of FAO, Eric Kemp-Benedict of Tellus Institute, Stephen Mink of the World Bank in Jakarta, and Gayatri Probosasi and Sagita Arhidani of ASEAN Secretariat, I am grateful for our valuable discussion. I acknowledge the help of Detlef van Vuuren, Bas Eickhout, Rineke Oostenrijk, Cor Graveland, Johan Meijer, Gerard van Drecht, Bart Strengers, Marcel Berk and Bert de Vries at RIVM.
The four-month internship period at RIVM was a wonderful learning experience, and fun too. I thank in particular Fred Langeweg, Deputy Director of Environmental Research Division, who was my first contact to the institute, and MNV Internationaal – the international part of the Bureau for Environmental Assessment of RIVM – that has given me this remarkable opportunity. Everyone in MNV deserves my gratitude; they have made my stay there enjoyable as well as fruitful.
Author’s contact address: wmahanani@yahoo.com
Contents
TABLES ...6 FIGURES ...7 ABBREVIATIONS ...8 SAMENVATTING...9 SUMMARY... 10 1. INTRODUCTION... 11 1.1 OBJECTIVE...11 1.2 SITUATION REVIEW...111.2.1 Increasing need for food in Southeast Asia ... 11
1.2.2 Outlook of the world’s future ... 11
1.2.3 The Association of Southeast Asia Nations (ASEAN)... 14
1.3 MAIN RESEARCH QUESTION...15
1.4 DEFINITIONS OF MAIN CONCEPTS AND ELEMENTS...15
1.5 STRUCTURE OF THE REPORT...15
1.6 RESEARCH MODEL...16
2. RESEARCH BOUNDARIES AND METHODOLOGY... 17
2.1 RESEARCH BOUNDARIES...17
2.1.1 Geographical Area ... 17
2.1.2 Timeframe ... 17
2.1.3 Agricultural Products... 18
2.2 RESEARCH METHODOLOGY...18
2.2.1 Description of environmental problems related to crop production ... 18
2.2.2 Setting up comparison of the scenarios ... 18
2.2.3 Identification of policy measures ... 19
2.2.4 Research flowchart ... 19
3. ENVIRONMENTAL ASPECTS OF CROP PRODUCTION IN SOUTHEAST ASIA ... 21
3.1 INTRODUCTION...21
3.2 ENVIRONMENTAL PROBLEMS RELATED TO CROP PRODUCTION IN GENERAL...21
3.3 ENVIRONMENTAL PROBLEMS RELATED TO CROP PRODUCTION IN SOUTHEAST ASIA...21
3.3.1 Land expansion ... 22
3.3.2 Land degradation... 22
3.3.3 Fertiliser use ... 22
3.3.4 Pesticide use ... 23
3.3.5 Water use ... 23
3.3.6 Impacts of agriculture on climate change ... 23
3.3.7 Impacts of climate change on agriculture ... 24
4. COMPARISON OF THE SCENARIOS: CROP PRODUCTION AND THE ENVIRONMENT IN SOUTHEAST ASIA IN 2030 ... 25
4.1 INTRODUCTION...25
4.2 DEMOGRAPHY, ECONOMY AND SOCIETY...25
4.2.1 Population ... 25
4.2.2 GDP per capita ... 26
4.2.3 Hunger incidence/ Incidence of undernourishment ... 26
4.3 FOOD AND AGRICULTURE...27
4.3.1 Average daily consumption ... 27
4.3.2 Share of animal products... 27
4.3.4 Crop production and total crop production ... 28
4.3.5 Total crop area, total harvested area and cropping intensity... 29
4.3.6 Irrigated cropland ... 30
4.3.7 Cereal harvested yield ... 30
4.3.8 Crop Self-Sufficiency Ratio ... 31
4.3.9 Crop net trade ... 31
4.3.10 Domestic crop demand... 32
4.3.11 Overall indicators ... 32
4.4 ENVIRONMENTAL PRESSURE...33
4.4.1 Water withdrawal for agriculture ... 33
4.4.2 Land area ... 33
4.4.3 Fertilisers consumption ... 34
4.4.4 Methane emission ... 35
4.4.5 Nitrous oxide emission ... 36
4.4.6 Land degradation... 38
4.4.7 Climate change impacts on crop yield ... 39
4.5 OUTLOOK SUMMARY...41
4.5.1 FAO AT 2015/30 Technical Report ... 41
4.5.2 UNEP GEO-3... 41
4.5.3 IMAGE 2.2... 41
4.5.4 General Summary... 42
5. POLICY AREAS AND POLICY MEASURES FOR ASEAN ... 45
5.1 INTRODUCTION...45
5.2 ASEAN POLICY FRAMEWORK...45
5.2.1 ASEAN Decision-making Process ... 45
5.2.2 Development towards integration of environmental concerns into agricultural policies... 46
5.2.3 Challenges and Opportunities ... 47
5.3 PRINCIPLES OF EFFECTIVE AGRICULTURAL POLICY...47
5.4 IDENTIFICATION OF POLICY AREAS AND MEASURES...48
5.4.1 Fertiliser use ... 48
5.4.2 Wetland rice and methane emission ... 49
5.4.3 Agricultural land expansion... 50
5.4.4 Land degrada tion: soil mining, salinisation, soil erosion ... 51
5.4.5 Pesticide Use... 51
5.4.6 Genetically Modified Crops... 52
5.4.7 Rural development ... 53
5.4.8 International trade... 54
5.4.9 Agri-environmental indicators... 56
5.5 SUMMARY...56
6. CONCLUSIONS AND RECOMMENDATIONS ... 59
6.1 CONCLUSIONS...59
6.1.1 General findings... 59
6.1.2 Environmental problems related to crop production in Southeast Asia ... 59
6.1.3 Food and the environment in Southeast Asia in 2030 ... 60
6.2 RECOMMENDATIONS...60
6.2.1 Policy areas and measures for ASEAN ... 60
6.2.2 Further research ... 61
REFERENCES ... 63
APPENDIX 1: LIST OF COMMODITIES ... 67
Tables
Table 3.1 Environmental Problems Related to Crop Production...21
Table 4.1 Population Projections... 25
Table 4.2 GDP Per Capita Estimates... 26
Table 4.3 Hunger Incidence / Incidence of Undernourishment Estimates...26
Table 4.4 Average Daily Consumption Estimates...27
Table 4.5 Share of Animal Products Estimates...27
Table 4.6 Meat and Milk Production Estimates...28
Table 4.7 Crop Production Estimates...28
Table 4.8 Total Crop Production Estimates...29
Table 4.9 Total Crop Area Estimates...29
Table 4.10 Total Harvested Area Estimates...29
Table 4.11 Cropping Intensity Estimates...29
Table 4.12 Irrigated Cropland Estimates... 30
Table 4.13 Estimates on Cereal Harvest Yield... 30
Table 4.14 Crop SSR Estimates... 31
Table 4.15 Crop Net Trade Estimate... 31
Table 4.16 Domestic Crop Demand Estimates... 32
Table 4.17 Overall Indicators Estimates... 32
Table 4.18 Estimates on Water Withdrawal for Agriculture... 33
Table 4.19 Land Area Estimates... 34
Table 4.20 Fertiliser Consumption Estimates...34
Table 4.21 Fertiliser Consumption Per Unit Area, Production and Population... 35
Table 4.22 Methane Emission Estimates...35
Table 4.23 Rice Production Estimates...36
Table 4.24 Rice Harvested Yield Estimates...36
Figures
Figure 1.1 Map of the Region of Southeast Asia... 12
Figure 1.2 Main Storylines for the Future in IMAGE 2.2...14
Figure 1.3 Research Model... 16
Figure 2.1 Research Flowchart... 20
Figure 4.1 Annual emission of nitrous oxide (N2O) from upland crops and wetland rice fields in 1995 based on FAO... 37
Figure 4.2 Vulnerability to water-induced soil degradation by the year 2030... 38
Figure 4.3 Change in Potential Yield in Current Rice Growing Area in Southeast Asia (1995-2030), in B1 Scenario and A1B Scenario... 40
Abbreviations
ASEAN : Association of Southeast Asia Nations
ACAP : ASEAN Common Agricultural Policy
AT 2015/30 : Agriculture Towards 2015/30
CGIAR : Consultative Group on International Agricultural Research
EU : European Union
FAO : Food and Agriculture Organization of the United Nations
FAOSTAT : FAO Statistical Database
GEO-3 : Global Environmental Outlook 3
GMO : Genetically Modified Organism
ICM : Integrated Crops Management
IFPRI : International Food Policy Research Institute
IMAGE : Integrated Model to Assess the Global Environment
IPM : Integrated Pest Management
IPCC : Intergovernmental Panel on Climate Change
IRRI : International Rice Research Institute
MF Scenario : The Market Forces scenario of the GEO-3
NGO : Non-Governmental Organisation
PR Scenario : The Policy Reform scenario of the GEO-3
RIVM : The National Institute for Public Health and Environment of the Netherlands
UNEP : The United Nations Environmental Program
Samenvatting
Deze studie gaat over akkerbouw in Zuid-Oost Azië en de milieugevolgen daarvan. Vijf mondiale scenario’s worden vergeleken teneinde een goed beeld te krijgen van de mogelijke situatie in de regio in 2030 met betrekking tot voedsel en milieu. Op grond hiervan zijn onderwerpen geïdentificeerd die om nieuw beleid vragen. In het bijzonder is gelet op mogelijkheden voor beleid van ASEAN, de regionale organisatie van tien landen in Zuid-Oost Azië.
De onderzochte scenario’s zijn FAO Agriculture Towards 2015/2030; Policy Reform en Market Forces uit concepten voor de derde Global Environment Outlook (GEO-3); de IPCC-scenario’s A1B en B1 maar dan geïnterpreteerd en uitgewerkt met het IMAGE 2.2 model.
Bovenal bepalen menselijke keuzen hoe de toekomst er in de regio er uit zal zien. In het bijzonder geldt dat voor de noodzakelijke beleidsmaatregelen. In al de vijf scenario’s moet de gewasproduktie toenemen om in de vraag te voorzien. De mate van toename hangt af van hoe het consumptie-niveau zich ontwikkelt, maar ook van dieetvoorkeuren, zoals vleesconsumptie, en van de export van landbouwprodukten. De toename van de gewasproduktie zal in Zuid-Oost Azië vooral worden bereikt door intensivering van de akkerbouw.
Er blijken inderdaad mogelijkheden voor ASEAN om de integratie van milieu-overwegingen in het landbouwbeleid te bevorderen. Nauwere samenwerking tussen de landbouw- en milieu-eenheden van ASEAN is belangrijk. Wellicht moet ASEAN een nieuw gemeenschappelijk landbouwbeleid voor de regio formuleren. Mogelijke onderdelen daarvan zijn: het ontwikkelen van regionaal toegesneden indicatoren voor landbouw en milieu; efficiënter gebruik van kunstmest door de kennis van boeren te vergroten en door de prijzen van kunstmest en landbouwprodukten te harmoniseren; beperken van het gebruik van bestrijdingsmiddelen door geïntegreerde gewasbescherming en geïntegreerde teelt; het beperken, als onderdeel van mondiaal klimaatbeleid, van de emissie van methaan uit de natte rijstbouw door inzet van de beschikbare technieken; planmatige uitbreiding van landbouwgrond en monitoring van landgebruik; het tegengaan van landdegradatie door speciale programma’s; beheerste en nauwkeurig gecontroleerde toepassing van genetisch gemodificeerde gewassen; het bevorderen van plattelandsontwikkeling door duidelijker eigendoms- en gebruiksrechten van land; het aanmoedigen van de inbreng van niet-overheidsorganisaties; betere benutting van toekomstige handel in landbouwprodukten door gecoördineerde deelname in besprekingen.
Summary
This study focuses on crop production and its implications to the environment. Five scenarios on future food production are compared to get a thorough picture on the possible situation of food and the environment in Southeast Asia in 2030, and to identify the areas that need policy intervention. These scenarios include: 1) FAO AT 2015/30 which is taken as the baseline development, UNEP’s GEO-3 2) Policy Reform and 3) Market Forces scenarios, and IPCC scenarios interpreted and elaborated in IMAGE 2.2 model 4) B1 and 5) A1B. A set of policy measures is identified for ASEAN, the regional organisation of the ten Southeast Asian countries. It is particularly human choices that will shape the future. It is a matter of human choice, e.g. by means of policy, whether necessary actions would be taken to protect the environment. The five scenarios altogether show a basically comparable picture where crop production will increase to keep up with the increase in demand. The extent of the increase depends on the assumptions on average daily consumption and diets, and assumptions on export. Increase in crop production to a large extent will be achieved by crop intensification.
There is room for ASEAN to foster the integration of environmental concerns into agricultural policy. Closer networking between the agricultural and the environmental unit is very important for a more effective and efficient co-operation. It may be necessary for ASEAN to set up a project to formulate a new ASEAN Common Agricultural Policy (ACAP), covering several elements as follows: developing agri-environmental indicators for the region; improving fertiliser efficiency by educating farmers and harmonising price of fertilisers and food products; limiting pesticide use by further co-operation in Integrated Pest Management (IPM) and Integrated Crops Management (ICM); limiting methane emission from wetland rice with available technologies; managing agricultural land expansion with careful land-use planning and monitoring; limiting soil degradation with soil conservation management, directing genetically modified (GM) crops development with close scrutinisation, enhancing rural development by promoting clear land rights and encouraging NGOs participation; and benefiting from international agricultural trade by active participation in international trade talks.
1. INTRODUCTION
1.1 Objective
The objective of the study is to evaluate how food security and environmental sustainability in Southeast Asia can be achieved.
1.2 Situation Review
1.2.1 Increasing need for food in Southeast Asia
The world’s population and economy are both projected to grow over the next century. This growth is expected to raise the world’s demand for human’s basic needs, including food. Global food security calls for more production, poverty alleviation and international agricultural trade mechanisms. Let us now look at food production. Under current agricultural systems, increased food production through intensification and land extension will potentially create pressures to the environment, due to the use of fertilisers and pesticides, the increased energy and freshwater demand, and loss of natural areas. Policy measures are needed if economic, social and environmental sustainability is to be achieved. In relation to food, economic sustainability means increased agricultural productivity and production for regional food security and export. Social sustainability means improved productivity and profitability of small-scale agriculture and ensured household food security, and environmental sustainability means ensured sustainable use and conservation of land, forest, wildlife, fisheries and water resources (UNEP, 1999).
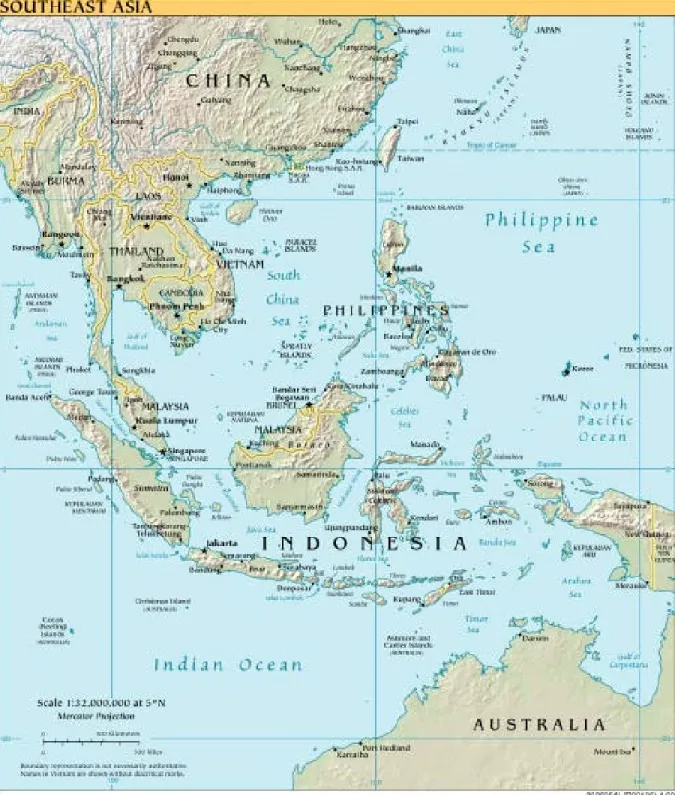
Southeast Asia belongs to the developing world. With its population of about 500 million in the year 2000, it is one of the most populous regions in the world. One of every ten persons in the world today is a Southeast Asian. The region binds ten countries: Brunei, Cambodia, Indonesia, Laos, Malaysia, Myanmar, the Philippines, Singapore, Thailand and Vietnam (Figure 1.1).
Many factors lead to a challenge in meeting food security and environmental sustainability in Southeast Asia. Its population and GDP per capita are projected to increase significantly according to UN projections, hence increasing food demand. But natural resources are limited and the environment is at stake.
1.2.2 Outlook of the world’s future
Projections of the world’s future have been developed by many international institutions. In relation to food security issues in Southeast Asia, this study considers three outlook sources. The first one is the Agriculture: Towards 2015/30 Technical Interim Report of the Food and Agriculture Organization of the United Nations (FAO), which is further referred to in this report as FAO AT 2015/30. The second one is the Global Environmental Outlook 3 (GEO-3) of the United Nations Environment Programme (UNEP). And the third one is the implementations of the new Intergovernmental Panel on Climate Change (IPCC) Special Report on Emission Scenarios (SRES) in the Integrated Model to Assess the Global Environment (IMAGE) 2.2 developed by The Dutch National Institute for Public Health and Environment (RIVM).
Figure 1.1 Map of the Region of Southeast Asia Source: The World Factbook, 2000
FAO AT 2015/30
FAO has been making periodical forward assessments of possible future developments in world food, nutrition and agriculture, including crops, livestock, forestry and fisheries sector. The series include Provisional Indicative World Plan for Agricultural Development (1970), Agriculture: Towards 2000 (1981), World Agriculture: Towards 2000, an FAO Study (1988), and World Agriculture: Towards 2010, an FAO Study (1995). Currently FAO is preparing its latest forward assessment, Agriculture: Towards 2015/30.
The FAO AT 2015/30 Technical Interim Report presents the main quantitative results, with little or no evaluation of the impacts on broader issues such as rural development and poverty, and with little or no analysis of agricultural, international trade and environmental policy issues (FAO, 2000). The reasoning behind this vision includes food demand (determined by population, economic growth, socio-cultural background), development of agricultural technology and management, trade and climate. The FAO vision is developed in a bottom-up approach, where analysis was initially made for individual countries and then aggregated and presented into regional level. The analysis are presented in matrices, showing very detailed data and projections of area, yield, production, demand, supply-utilisation accounts, agricultural land potential and use, etc. of every given country and aggregation. Southeast Asia forms one aggregated region in the analysis, covering all member countries of ASEAN except Brunei and Singapore.
UNEP GEO-3
UNEP, through its GEO series, provides a comprehensive assessment of the state of the global environment, a review of policy responses and an outlook on the future. The outlook of the future is set up by means of scenarios. In GEO-3, four scenarios are considered, namely Market Forces, Policy Reform, Fortress World and Great Transitions (Raskin, 2000). The most significant driving forces that currently shape global and regional development, and condition the future in this projection are demographics, economics, social and cultural effects, technology, environment and governance. In contrary to FAO projections, GEO-3 scenarios are developed with a top-down geographical approach. Storylines were initially made at global level, and then zoomed into regional and sub-regional level such as Southeast Asia.
The first two scenarios envision the global system of the 21st century evolving along the lines of globalisation without major surprises. Both scenarios envisions the evolution of institutions and values, the rapid growth of the world economy, and the convergence of global regions towards the norms set by highly industrialised countries. However, compared to Market Forces, in Policy Reform scenario there is less faith that social and environmental stress can be mitigated adequately through the automatic responses of competitive markets. Sustainable goals are pursued as a proactive strategic priority. There is emergence of the political will to constrain and guide market-driven growth with a comprehensive set of sustainable policies. Policy Reform scenario can be categorised as “backcast”, which begins with an image of desirable future conditions and seeks development trajectories to reach this future states (GEO-3 draft).
Fortress World pictures a world descending towards fragmentation, extreme inequality and widespread conflict as socio-economic and environmental stresses mount. In the Great Transitions scenario, a new development paradigm emerges in response to the challenge of sustainability, distinguished by pluralism, planetary solidarity, and new values and institutions (GEO-3 draft). RIVM IMAGE 2.2
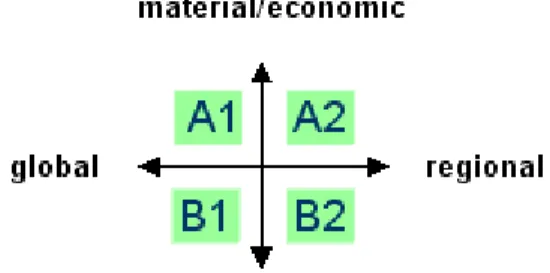
RIVM has been developing a global change model for scenario studies called IMAGE. As implementations of the SRES of IPCC, IMAGE considers four main storylines for the future, namely A1, A2, B1 and B2. These storylines were constructed on two axes, one representing the degree of
globalisation versus regionalisation, and the other representing the degree of orientation on material versus social and ecological values, as shown in the figure 1.2 below.
Figure 1.2 Main Storylines for the Future in IMAGE 2.2 Source: IPCC, 2000
Several driving forces are considered as pressure indicators in this model, including economic, population, energy use and supply, and agricultural demand and production. The currently developed IMAGE 2.2 divides the world into seventeen regions to match the regional grouping of GEO-3, with Southeast Asia being one of the regions.
The relevancy of the three outlooks
The three sources of the world’s future outlook are currently being developed or almost finished. To obtain a comprehensive picture of Southeast Asian future of food, agriculture and environment, these three sources are thus timely.
The GEO-3 Policy Reform scenario pictures a world that strives to balance the ongoing trends towards globalisation and materialism on one hand, with sustainability on the other hand. There is no profound change from the current flow of global development, but policy intervention is believed to be able to make a difference towards sustainability. It is thus reasonable to incorporate FAO’s conservative projection, which is very much rooted on current situation, with this scenario in order to identify what has to be done to meet food security with environmental considerations. Broadly speaking, IMAGE 2.2 B1 scenario matches GEO-3 Policy Reform scenario, as it describes a globalised, convergent world with rapid changes in economic structures toward service and information economy, and emphasises on global solutions to economic, social and environmental sustainability. The B1 scenario will therefore be incorporated as well.
1.2.3 The Association of Southeast Asia Nations (ASEAN)
The Association of Southeast Asia Nations (ASEAN) exists, encompassing all ten countries of the region, to bring together and get all the countries to co-operate in securing the developments of the region. The areas of co-operation include political and security, economic, functional (environment, science and technology, culture and information) and external relations. Food, agriculture and forestry form one sector of the economic co-operation. In its storyline of Policy Reform scenario in Asia Pacific region, GEO-3 envisions that regional institutions such as ASEAN play important roles to bring together countries for further co-operation.
In ASEAN Vision 2020, the countries commit, among other, to enhance food security in the region. It also envisions a clean and green ASEAN with fully established mechanism for sustainable development to ensure the protection of the region’s environment, the sustainability of its natural resources and the high quality of life of its peoples.
1.3 Main Research Question
Having reviewed the current situation, a main research question for this study is formulated:
What policy measures, at the ASEAN level, would be appropriate to realise the FAO’s Agriculture Towards 2015/30 vision for the region in light of UNEP’s GEO-3 Policy Reform scenario and IMAGE 2.2 B1 scenario?
Answering this question, of course, can only contribute a small portion to the huge effort to meet food security and environmental sustainability in Southeast Asia. Other issues linked to food security such as food distribution systems, poverty and conflicts are also crucial and in some cases might pose bigger constraints to food security than the issue of food production. However, those issues will not be discussed in this research.
1.4 Definitions of Main Concepts and Elements
• Food security: the condition when every person is assured of access at all times to the food required to lead healthy and productive lives (IFPRI, 1999).
• Environmental sustainability: responsible use and conservation of natural resources so as to maintain or improve their states to ensure that the future generations can still have access to them.
• Policy measures: actions to be taken within the capacity of ASEAN to eliminate the burdens against achieving food security and environmental sustainability in the region.
• FAO’s Agriculture Towards 2015/30, UNEP’s GEO-3 Policy Reform scenario, IMAGE 2.2 B1 scenario: some scenarios of the future envisioning, among other, the situation of food and the environment in Southeast Asia by the year 2030 (see section 1.2.2).
1.5
Structure of the Report
The Introduction chapter presents the background information about the research. It includes the objective, review of present situation, main research question, definitions of main concepts and the research model.
The Methodology chapter reveals how the study was developed; it presents the steps and the boundaries of the research.
The third chapter briefly describes the currently known Environmental Aspects of Crop Production in Southeast Asia, to give an idea on what kind of environmental problems might arise in Southeast Asia in the future in general due to agricultural activities.
The fourth chapter shows the results of a very important step towards answering the main research question. It presents the Comparison of the Scenarios involved in this study, to get a quantitative picture on the possible food and environmental situation in Southeast Asia by the year 2030.
The core answers to the main research question are presented in the Policy Areas and Measures for ASEAN, the fifth chapter of this report. It includes the description of ASEAN policy framework, principles of effective agricultural policy, and the analysis of possible policy areas and measures for ASEAN to achieve the target in food production and minimise environmental trade-offs.
1.6
Research Model
The research model (figure 1.3) shows the logical structure and scoping of this study.
Ultimate Objective
Main Research Question
Scenarios / Main resources of information Causal chains
Important factor, but not discussed further in this study
Legend:
Figure 1.3 Research Model Agriculture-related
environmental problems
Needs to mitigate the environmental problems
Policy measures at ASEAN level
Increased agricultural activities in Southeast Asia Population and economic growth
in Southeast Asia towards 2030
Achievement of desired food production with minimised environmental trade-offs by 2030
FAO
AT 2015/30
GEO-3
scenarios
IMAGE 2.2
scenarios
Realisation of FAO projection in SE Asia by 2030 in light of PR and B1 scenarios Effective ImplementationIncreased need for food in Southeast Asia
Achieving food security and environmental sustainability in Southeast Asia by 2030 Poverty alleviation Fair distribution of food Absence of conflicts GEO-3 PR, IMAGE 2.2 B1, Other sources Needs of regional co-operation ASEAN opportunities and challenges
2. RESEARCH BOUNDARIES AND
METHODOLOGY
2.1 Research Boundaries
To be able to conduct the study in sufficient depth, research boundaries must be set. These boundaries include the geographical area, timeframe and agricultural products.
2.1.1 Geographical Area
This research sets its geographical boundary in the regional level - Southeast Asia. This level was chosen instead of national level (individual country) to match GEO-3 visions and IMAGE 2.2 modelling. By matching those two resources, collecting of information is then enabled in the aggregate level. FAO regional level of Southeast Asia excludes Brunei and Singapore. But both countries are net importers of food, so agricultural activities are to a large extent limited to trade. The second reason is the existence of the Association of Southeast Asia Nations (ASEAN) in the region. The regional governmental organisation has both its capacity and limitation to enhance co-operation in food and agriculture and in environmental issues. This makes it worthwhile to conduct this research.
The third reason is because to our best knowledge study about ASEAN with regards to the visions of GEO-3, FAO AT 2015/30 and IMAGE 2.2 has never been done before. This creates a space to fill in in the continuous attempt to attain global understanding of the harmony between food security and the environment.
2.1.2 Timeframe
The research defines the year 2030 as its time boundary to match the vision of FAO AT 2015/30 and GEO-3. FAO has chosen 2030 because the time horizon would offer a sufficiently long period (about 35 years from the base year 1995/97) to analyse issues of technical agriculture and sustainability (FAO, 2000). GEO-3 has chosen 2002 as its base-year (10 years after the Rio Summit) and looks 30 years back and 30 years ahead.
The year 2030 gives space for the scenarios to envision the world’s future beyond what is determined by current demographic impetus, capital stock and institutions, but close enough to be influenced by today’s strategic investments. The different scenarios show considerably different states and impacts to the world’s socio-economy and environment by then. This is logical, as many environmental impacts of human’s actions today take effect in relatively long time. PR scenario envisions a notably different world by 2032 than what Market Forces scenario does. IMAGE 2.2 also shows the significant differences in many of the world’s indicators among different scenarios. This gives a clear indication that sustainable policies can and will make the difference. This kind of policies, particularly addressing agriculture and the environment in Southeast Asia, is indeed what we are trying to produce in this research.
Setting the year 2030 as the target year also gives a relatively high degree of uncertainty and speculative nature to this research. Specific policies are difficult to define, as stability in the region is difficult to assess. The policies identified for 2030 will therefore be broad.
2.1.3 Agricultural Products
Agricultural products, not including fishery and forestry, can largely be divided into crops and livestock. This research focuses on crop, because crop production is assumed to significantly lead to both agricultural intensification and land expansion, hence potentially causing environmental problems. FAO projects that crop production in Southeast Asia will increase from some 440 million tons in 1995 to 700 million tons in 2030.
Livestock, on the other hand, is excluded in this research. Although its production is projected to grow at a faster pace than crop (FAO, 2000), in developing countries the growth will be more in the form of intensive production as opposed to grazing system (Seré et al., 1996). Expansion of grazing land, which in some parts of the world is the main cause of deforestation, is in this case negligible in Asia (De Haan et al., 1997). The more important pressures from livestock production will thus be related to the production of animal feed from crop and crop residues. This will be accounted for in crop production.
2.2 Research Methodology
This research commences with the notion that the region of Southeast Asia will need more food in the future, hence more crop production. This will lead to increased pressures on the environment. But how much additional production is needed, and how would that affect the environment? These questions must be answered if one wishes to anticipate the changes by means of policy intervention.
2.2.1 Description of environmental problems related to crop production
A brief study is conducted to point out environmental problems that currently arise as consequences of crop production, especially in Southeast Asia. This is done by literature review. The results are presented in chapter 3.2.2.2 Setting up comparison of the scenarios
Being a technical analysis, the quantitative projections in FAO AT 2015/30 Technical Interim Report give little attention on environmental sustainability and policy issues. GEO-3 and IMAGE 2.2 outlooks provide more information on such issues. To answer the questions on how much additional food production is needed, and how that would affect the environment, the three outlooks are reviewed.
FAO projection is the baseline development in this study. Giving only one scenario, FAO presents the “most likely outcome” of the world food situation in the future. It is considered realistic and directly addressing food issues. The FAO projection gives detailed information on how much production is expected in the region by the year 2030, and how to achieve that. The question is, what would be the environmental implications of this projection?
GEO-3 and IMAGE 2.2 each envisions more than one storyline of the world future, and food and agriculture is not the only sector that is considered in both outlooks. These two outlooks are thus less focused on food security issues, but can critically add environmental and policy perspectives to the FAO projection. GEO-3 and IMAGE 2.2 have their own visions on food production for each of their scenarios, along with the environmental implications. To answer the question above, one needs to know where the FAO projection stands among those visions. Comparison of the three outlooks is thus needed, both quantitative and qualitative.
It is important to keep in mind, however, that GEO-3 quantitative visions are not meant to be rigorous. Instead, they are only meant to give illustrations about the world’s future. The figures are derived from PoleStar that has its own limited capacity, which will not be discussed further in this study. When this research is conducted, the GEO-3 writing process is more focused on developing the narrative, hence qualitative visions. Therefore, IMAGE 2.2, which is a modelling framework for global change that provides a quantitative basis for analysing the relative effectiveness of various policy options, is needed to add strength to the quantitative comparison.
Besides helping to analyse the possible environmental consequences of food production in the future, the comparison of the scenarios also serves as a method to identify the areas that need policy measures. This is why the study chooses to incorporate FAO projection with the GEO-3 Policy Reform (PR) scenario and the IMAGE 2.2 B1 scenario (section 1.2.2). The PR scenario, with the support of policy intervention, is a more sustainable alternative to the Market Forces (MF) scenario. The same way applies to the B1 scenario and the A1 scenarios of IMAGE 2.2. Comparing those scenarios - PR to MF, and B1 to A1 - will reveal what differences are found among them, hence what issues needs to be addressed by means of policy efforts.
There are three scenarios within A1 scenario family, namely A1F, A1T and A1B. Which one should be used? These scenarios are distinguished by their technological emphasis in the energy system, A1F is fossil intensive, A1T is technology intensive and A1B is balanced across all energy sources. The A1B scenario fits best to the MF scenario, as A1F is too traditionally dependent on fossil fuels and A1T is too optimistic in envisioning technology development.
Thus there are now five scenarios involved: FAO AT 2015/30, GEO-3 PR and MF scenarios, and IMAGE 2.2 B1 and A1B scenarios. The comparison method now has its structure and richness. It is necessary to note that the outlooks reviewed here were under way when this study was conducted. The figures presented in the next chapter of this report are subject to changes for the final released version of each outlook. The GEO-3 visions, for example, are currently being distributed around to invite comments. FAO will include broader issues such as rural poverty and environmental policy issues in its final report of Agriculture: Towards 2015/30. However, it is assumed that the changes, if any, will be minor and not radically change the essence of the outlooks that this study is trying to grab.
2.2.3 Identification of policy measures
The next big step towards answering the main research question is identifying the policy measures required to achieve our targets. As described in the earlier section, comparing the scenarios does a part of the work. The comparison reveals several policy areas for ASEAN to address. However, some important issues are not fully covered in the quantitative comparison, such as rural development. To enrich the study, other sources are brought into play. Literature review and expert judgement are resourced. In recommending policy measures, the ASEAN capacity as a regional institution must be considered. A concise study is done, mostly by literature review and interview with ASEAN officials. Interviews were also done to get insights from experts in RIVM, FAO and the World Bank. All of these ingredients are then analysed and integrated, resulting in a set of recommendation of policy measures.
2.2.4 Research flowchart
Figure 2.1 presents the flowchart of the research, showing the steps conducted in the study to answer the main research questions. This illustrates the research methodology described above and how the results of each step are presented in this report.
Research Objective
Preliminary Study – Situation Review
(Literature Review) Chapter I Chapter II Research Boundaries
(Literature Review, Discussion)
Main Research Question
Food and Environment Situation in SE Asia in 2030 (Comparison of Scenarios) Current Environmental
Problems of Crop Production in SE Asia (Literature Review)
Chapter III
Chapter IV
ASEAN policy framework for agri-environemntal co-operation
(Literature Review, Interview)
Conclusions and Recommendations Policy Areas and Measures for ASEAN
(Synthesis, Literature Review, Interview)
Chapter V
Chapter VI
Figure 2.1 Research Flowchart
3. ENVIRONMENTAL ASPECTS OF CROP
PRODUCTION IN SOUTHEAST ASIA
3.1
Introduction
Agriculture in general places a heavy burden on the environment in the process of providing humanity with food and fibres. Agricultural activity has been degrading the world’s land and water resources. It also generates other adverse environmental impacts, such as threat to biodiversity, climate change, etc. (Alexandratos, 1995; FAO, 2000). All over the world, there has been sufficient evidence of trade-offs between feeding people and protecting the environment. This chapter presents briefly the current environmental aspects of crop production, especially in Southeast Asia. It does not seek to be comprehensive. Instead, it only tries to give a quick illustration on what is happening today and hence what might happen in the future should crop production arise.
3.2
Environmental Problems Related to Crop Production in
General
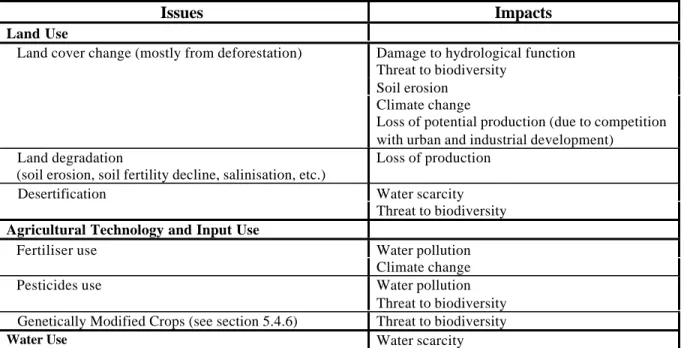
Table 3.1 shows a general summary of environmental issues related to crop production and the relevant impacts. The issues are classified as land use, agricultural technology and input use, and water use.
Table 3.1 Environmental Problems Related to Crop Production
Issues Impacts
Land Use
Land cover change (mostly from deforestation) Damage to hydrological function Threat to biodiversity
Soil erosion Climate change
Loss of potential production (due to competition with urban and industrial development)
Land degradation
(soil erosion, soil fertility decline, salinisation, etc.)
Loss of production
Desertification Water scarcity
Threat to biodiversity Agricultural Technology and Input Use
Fertiliser use Water pollution
Climate change
Pesticides use Water pollution
Threat to biodiversity Genetically Modified Crops (see section 5.4.6) Threat to biodiversity
Water Use Water scarcity
Source: FAO, 2000
3.3
Environmental Problems Related to Crop Production in
Southeast Asia
As table 3.1 has presented the problems in general, I will now try to zoom in into the environmental aspects of crop production in Southeast Asia. They include agricultural land expansion, land
degradation, fertiliser use, pesticide use, water use, and the relationship between agriculture, especially crop production, with climate change.
3.3.1 Land expansion
Agricultural land expansion mostly comes from deforestation, although it is not the only cause of deforestation in Southeast Asia. Collection of wood for domestic fuel, and large-scale logging are other major causes of deforestation. Deforestation leads to release of carbon dioxide, contributing to global climate change. It also affects hydrological function of forests and alters local air temperatures, downwind airflows and humidity. Deforestation also threatens biodiversity, i.e. flora and fauna that might well have commercial potential as food plants, sources of drugs or industrial raw materials in the future (Barrow, 1990). In short, deforestation brings economical as well as ecological losses. FAO projects limited land expansion by 2030: only about 20% of the incremental crop production in developing countries would come from arable land expansion. The rest would come from intensification. The agri-environmental problems that would arise from crop production would thus be caused mostly by intensification. However, considering the losses related to deforestation, attention should be given to this issue.
3.3.2 Land degradation
Land degradation takes a number of forms, including depletion of soil nutrients, salinisation and soil erosion. Land degradation causes a decline in the productive capacity of the land, hence reducing potential yields. Farmers may need to use more fertiliser or manure in order to maintain yields, or they may temporarily or permanently abandon some plots. Degradation may also induce farmers to convert land to lower-value uses. For example, farmers may plant cassava, which demands few nutrients, instead of maize, or convert cropland to grazing land. Farmland degradation can also have important negative effects off the farm, such as deposition of eroded soil in streams or behind dams. Hot spots of land degradation in Southeast Asia include salinisation in the irrigation systems in northeastern Thailand and soil erosion on the sloping lands of Southeast Asia (Scherr and Yadav, 1996).
3.3.3 Fertiliser use
Increases in biomass do require additional uptake of nutrients that may come from both organic and mineral sources. Historical data has shown the relationship between cereal production and fertiliser: one-third of the increase in cereal production worldwide during the 1970s and 1980s has been attributed to increased fertiliser consumption (FAO, 2000). However, the use of fertilisers should be limited because, besides its positive consequences to maintain soil fertility and soil organic matter levels, it also has its negative aspects. These aspects include groundwater nitrate contamination and eutrophication of surface waters by nitrogen and phosphate, soil acidification by release of ammonia, and the emission of nitrous oxide (N2O), which is one of the greenhouse gases that cause global climate change (FAO, 2000; IPCC, 2000).
Food output in Asia has become critically dependent on the nutrient (Smil, 2000). Since the 1960s, agriculture throughout Southeast Asia has come increasingly to rely on chemical fertilisers as well as pesticides. With high rainfall and high temperatures it is difficult to prevent these chemicals from contaminating streams, ponds, groundwater and even marine environment (Barrow, 1990). Limiting fertiliser applications is one of many policy challenges in agri-environment issue.
3.3.4 Pesticide use
Pest damage to crops is a major constraint on food production. Severe pest problems are not unusual at regional or local level. A variety of measures is now in use to assist in controlling pests. Pesticides are an integral and indispensable tool in current agriculture (Laegreid et al., 1999).
However, the use of agricultural chemicals must be limited to avoid related environmental problems, including water pollution and loss of biodiversity, and human health problems. Hundreds of millions of farm workers and consumers (globally) are exposed to excessive levels of pesticides; pesticide-induced farm worker mortality and morbidity is still common in developing countries. Many of the pesticides in widespread use are still fairly broad spectrum, thus the negative impacts of pesticides on beneficial insects, birds, other non-target organisms and ecosystem function continue to be widespread (FAO, 2000; Smil, 2000).
3.3.5 Water use
Water is an important factor for agricultural production. It is estimated that at present in developing countries, irrigated agriculture, with about a fifth of all arable land, accounts for about 40% of all crop production and almost 60% of cereal production (FAO, 2000).
The issue related to water use for irrigation is the irrigation efficiency, i.e. the ratio between the estimated consumptive water use in irrigation and irrigation water withdrawal. Irrigation water withdrawals normally far exceeds the consumptive use of irrigation because of water lost in its distribution from its source to the crops. However, FAO (2000) states that in humid areas (such as Southeast Asia) the issue of irrigation efficiency is much less relevant than in water scarce regions (such as Near East / North Africa regions) and is likely to receive little attention.
3.3.6 Impacts of agriculture on climate change
Agriculture contributes about 30 percent of the global anthropogenic emission of GHGs, among other comprising of 40 percent of methane and 80 percent of nitrous oxide emission (FAO, 2000). Over a 100 year time horizon, methane has a global warming potential of 21 and nitrous oxide 310, which means that methane and nitrous oxide are respectively 21 and 310 times more powerful than carbon dioxide in contributing to atmospheric warming (IPCC, 2000).
Methane emission
Agriculture can contribute to methane (CH4) emissions through rice cultivation and enteric fermentation of cattle (IPCC, 2000). Southeast Asia is a major producer of rice, thus this issue should be addressed, whereas livestock will not be considered in this research (section 2.2.3). Methane emissions from rice cultivation are primarily a function of emission factor and assumed rice cropland area. In turn, emission factors depend on cultivation method (wet versus dry), water management practices, type of rice variety planted, and cropping patterns (IPCC, 2000).
Nitrous oxide emission
Agricultural activities and animal production systems are the largest anthropogenic sources of nitrous oxide emission. Emission from agricultural soils occur through the nitrification and denitrification of nitrogen in soils, particularly that from mineral or organic fertilisers. Emissions are very dependent on local management practices, fertiliser types, and climatic and soil conditions, and are calculated by multiplying an emission factor by the sum of mineral and organic nitrogen applied as fertiliser (IPCC, 2000).
3.3.7 Impacts of climate change on agriculture
Climate change impacts on agriculture remains uncertain. Direct impacts on crop production from increased photosynthesis (CO2 fertilisation effect), improved water use efficiency and changes in precipitation could be beneficial to some regions and possibly negative to other regions. Changes in local climate (i.e. precipitation and temperature) can both shorten and lengthen the growing season of crops, and thus potential yield. With increasing CO2, all plants use water more efficiently. Hence, reduced moisture availability can be offset by enhanced water-use efficiency. Climate change would indirectly affect agriculture through changes in water availability and the impact on pest populations (FAO, 2000; RIVM, 2001). A closer look at the IMAGE 2.2 model will give an illustration on how climate change will affect agriculture in Southeast Asia by the year 2030. This will be discussed in chapter 4.
4. COMPARISON OF THE SCENARIOS: CROP
PRODUCTION AND THE ENVIRONMENT IN
SOUTHEAST ASIA IN 2030
4.1 Introduction
To obtain a quantitative and thorough understanding of crop production and the related environmental consequences in Southeast Asia until 2030/2032, the five scenarios from the three future outlooks are reviewed and compared. The scenarios are the FAO projection, the GEO-3 Policy Reform and Market Forces scenarios, and IMAGE 2.2 B1 and A1B scenarios. All figures and estimates presented in this chapter are for the region Southeast Asia, covering all of the ten ASEAN countries for GEO-3 and IMAGE 2.2 scenarios, and all ASEAN member countries except Singapore and Brunei for FAO scenario.
The indicators selected are those that are related to food security in general, crop production and relevant environmental issues. The data are not always available, or readily available, for every chosen indicator for all the three sources. To resolve this, “hidden” data are pulled out whenever possible. In most cases the figures are converted to the units used in GEO-3. For many of the indicators, growth rates are calculated to show the trends, which are considered more relevant for comparisons than the absolute figures. This is because the base-year data for indicators can be significantly different among the three outlooks, due to differences in definitions or differences in the methods used. As mentioned in chapter 2, it is necessary to note that the outlooks reviewed here are under way when this study is conducted. The figures presented in the next chapter of this report are subject to changes for the final released version of each outlook.
The figures and trends revealed in the comparison matrix reflect the reasoning behind the three outlooks of the future. Below is the discussion on each of the indicators, followed by summary of the three outlooks.
4.2
Demography, Economy and Society
4.2.1 Population
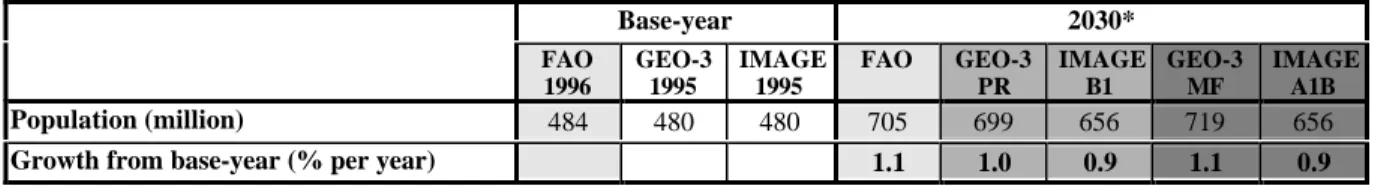
Projections on population are presented in Table 4.1 below. Table 4.1 Population Projections
Base-year 2030* FAO 1996 GEO-3 1995 IMAGE 1995 FAO GEO-3 PR IMAGE B1 GEO-3 MF IMAGE A1B Population (million) 484 480 480 705 699 656 719 656
Growth from base-year (% per year) 1.1 1.0 0.9 1.1 0.9
* For GEO-3: estimates for the year 2032
Using the same source (UN Population Projection), base-year data have the same figures, noting that the base-year of FAO is 1996 instead of 1995. The GEO-3 MF scenario uses Mid-Range projections of the UN 1998 revision and FAO uses world population trends of UN1999. Both show similar projection for 2015, considering that FAO does not include Brunei and Singapore which population comprises 0.7% of total population in the region in 1995 and assuming that the proportion is constant in the timeframe. In GEO-3 PR scenario, the figures are lower than MF due to assumed declines in
fertility rates associated with declining poverty and through more active family planning efforts (Raskin, 2000). The population growth in IMAGE 2.2 is lower because it is based on SRES population from the UN 1998 Long-Range medium projection along with IIASA variants. A1 and B1 scenarios envision identical population growth, which is lower than for A2 and B2 scenarios (IPCC, 2000).
4.2.2 GDP per capita
The scenarios for GDP per capita are presented in Table 4.2. GDP per capita is expressed in three different units in the three scenarios, namely 1995 US$ PPP in GEO-3, 1995 US$ in IMAGE 2.2 and 1987 US$ in FAO AT 2015/30. They are converted into 1995 US$.
Table 4.2 GDP Per Capita Estimates
Base-year 2030* FAO 1996 GEO-3 1995 IMAGE 1995 FAO GEO-3 PR IMAGE B1 GEO-3 MF IMAGE A1B GDP per capita** 931 4805 1478 3363 13407 5171 12031 7165
GDP per capita in thousand 1995 US$
PPP*** 3.4 4.8 3.8 12.2 13.4 13.4 12.0 18.7
Growth from base-year (% per year) 3.8 2.8 3.6 2.5 4.6
* For GEO-3: estimates for the year 2032
** For GEO-3 in 1995 US$ PPP, IMAGE in 1995 US$, FAO in 1987 US$. *** Conversion factor: 1995 US$ PPP = 2.63 x 1995 US$ PPP = 3.64 x 1987 US$.
The base-year data of IMAGE 2.2 and FAO are similar. FAO figure for 1996 is lower than IMAGE for 1995 because FAO leaves out two wealthiest countries of the region: Brunei and Singapore. The GEO-3 figure is higher than IMAGE, probably because the “purchasing power parity” method used in comparing different currency values used a different “basket of goods”.
It is interesting to see that although in general the MF scenario is assumed to be comparable with A1B, and PR to B1, their envisioned economic growth contrast. GEO-3 assumes higher growth in PR than in MF whereas in IMAGE the growth is higher in A1B than in B1. The reason is that the PR assumptions reflect more rapid convergence between developed and developing countries compared to the MF scenario (Raskin, 2000), thus disparities between countries would be smaller. The A1 storylines in IMAGE strongly emphasise economic growth as the ultimate target worldwide as opposed to B1 storyline that emphasises sustainability.
FAO, with its envisioned economic growth for the region, is more optimistic than GEO-3, comparable to IMAGE 2.2 B1, but not as optimistic as the A1B scenario.
4.2.3 Hunger incidence/ Incidence of undernourishment
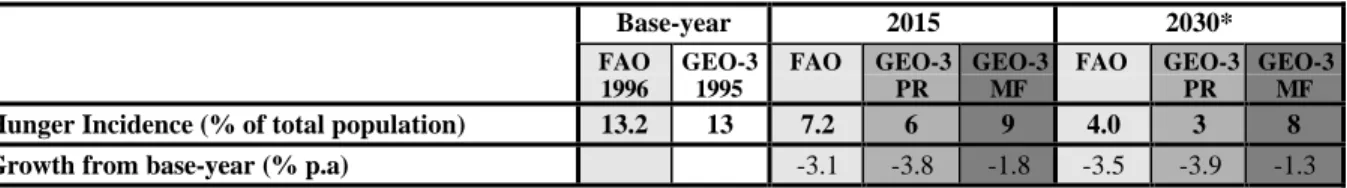
GEO-3 and FAO use this indicator in addressing food security. The figure represents the fraction of the total population in the region that experience hunger, or whose food intake does not provide enough calories to meet their basic energy requirements. The estimates are shown in Table 4.3. Table 4.3 Hunger Incidence / Incidence of Undernourishment Estimates
Base-year 2015 2030* FAO 1996 GEO-3 1995 FAO GEO-3 PR GEO-3 MF FAO GEO-3 PR GEO-3 MF
Hunger Incidence (% of total population) 13.2 13 7.2 6 9 4.0 3 8
Growth from base-year (% p.a) -3.1 -3.8 -1.8 -3.5 -3.9 -1.3
The PR scenario envisions the fulfilment of the target for reducing hunger as one of its social sustainability goals. This is in line with FAO 1996 World Food Summit goal to halve the number of chronically undernourished persons in developing countries by no later than 2015.
FAO itself is not very optimistic about reaching that target, although still shows a more rapid decrease than GEO-3 MF scenario. The reason why FAO is not too optimistic is because a further reduction of incidence of undernourishment would require high rates of growth of aggregate food demand, income growth and better distribution (FAO, 2000). The PR scenario is therefore questionable because compared to FAO it envisions lower increase in average daily consumption, lower economic growth, lower growth in livestock production and only slightly higher crop production, but it envisions more rapid decrease of hunger incidence. One explanation might be that in PR scenario, poverty, one of the causes of food insecurity, is alleviated rapidly due to sustainable policies, whereas the FAO AT 2015/30 technical report does not look into such broader issues.
4.3
Food and Agriculture
4.3.1 Average daily consumption
This indicator expresses the per capita direct human consumption of food in kcal/capita/day. In GEO-3 it is called “average daily consumption”, in IMAGE “daily caloric demand (for agricultural product)”, and in FAO AT 2015/30 “per caput food consumption”. The estimates are presented in Table 4.4.
Table 4.4 Average Daily Consumption Estimates
Base-year 2030* FAO 1996 GEO-3 1995 IMAGE 1995 FAO GEO-3 PR IMAGE B1 GEO-3 MF IMAGE A1B
Avg. Daily Consumption (kcal/cap) 2660 2575 2863 3016 2880 3418 2870 3463
Growth from base-year (% per year) 0.4 0.3 0.5 0.3 0.6
* For GEO-3: estimates for the year 2032
The year data of GEO-3 is comparable to that of FAO, noting the one-year-difference of base-years and an annual increase of about 0.4%. The IMAGE 2.2 estimate for 1995 is about 10% higher than GEO-3 although both are claimed to be derived from the same source (FAO). Because of this difference, the rates of change are more relevant to compare than the absolute figures.
The increases in average daily consumption are consistent with increases in GDP per capita and in food production (both crop and livestock), which makes the growth in GEO-3 higher for PR than for MF, and in IMAGE 2.2 higher for A1B than for B1. FAO projects a slightly higher growth than GEO-3, but lower than IMAGE 2.2.
4.3.2 Share of animal products
This indicator shows the proportion of the daily average consumption per capita that comes from animal products (meat, milk, eggs). The estimates are presented in Table 4.5.
Table 4.5 Share of Animal Products Estimates
Base-year 2030* FAO 1996 GEO-3 1995 IMAGE 1995 FAO GEO-3 PR IMAGE B1 GEO-3 MF IMAGE A1B
Share of animal products (%) 6 7 7 9 11 16 10 18
Growth from base-year (% per year) 1.2 1.2 2.4 1.0 2.7
The share of animal products in the human diets increases in all scenarios. Together with increases in vegetable oils and sugar consumption, this reflects a shift in diets towards more luxury products, along with increasing incomes.
IMAGE 2.2 shows the highest increase compared to GEO-3 and FAO, which is consistent with its high vision in economic growth. The idea of a converging world in A1 and B1 scenarios might explain why the increase is so high, because consumption patterns in developing regions are assumed to move towards those in developed regions.
The difference of visions between GEO-3 and IMAGE is once again shown here; GEO-3 envisions higher increase in PR than in MF, IMAGE envisions higher increase in A1B than in B1. The IMAGE 2.2 assumption is based on the environmental and health aspects associated with the production and consumption of meat and (to a lesser extent) eggs. These environmental and health aspects are assumed to be important in the B1 and B2 scenarios and less so in the A1 and A2 scenarios (RIVM, 2001). GEO-3, on the other hand, envisions that in PR scenario equity will increase among and within countries, whereas in MF inequity will increase.
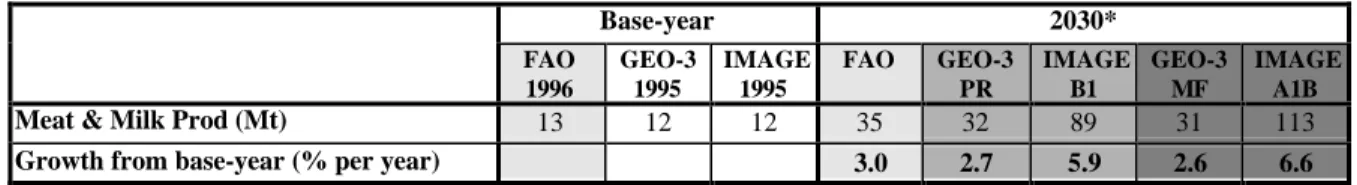
4.3.3 Meat and milk production
Table 4.6 shows the estimates on meat and milk production in the future. Table 4.6 Meat and Milk Production Estimates
Base-year 2030* FAO 1996 GEO-3 1995 IMAGE 1995 FAO GEO-3 PR IMAGE B1 GEO-3 MF IMAGE A1B
Meat & Milk Prod (Mt) 13 12 12 35 32 89 31 113
Growth from base-year (% per year) 3.0 2.7 5.9 2.6 6.6
* For GEO-3: estimates for the year 2032
In all scenarios meat and milk production is projected to increase faster than crop production. This reflects the consumption pattern with increasing share of animal products in average daily consumption. GEO-3 and FAO AT 2015/30 figures (both production and growth rate) are comparable, whereas IMAGE figures are significantly higher. This is due to its vision on the share of animal products in daily consumption, which is also significantly higher compared to GEO-3 and FAO.
Increase in meat and milk production requires extension of grazing land and/or more production of animal feed from crop or crop residues. In Southeast Asia, the increase would probably come mostly from intensification, hence requiring more feed crop production (Section 2.1.3).
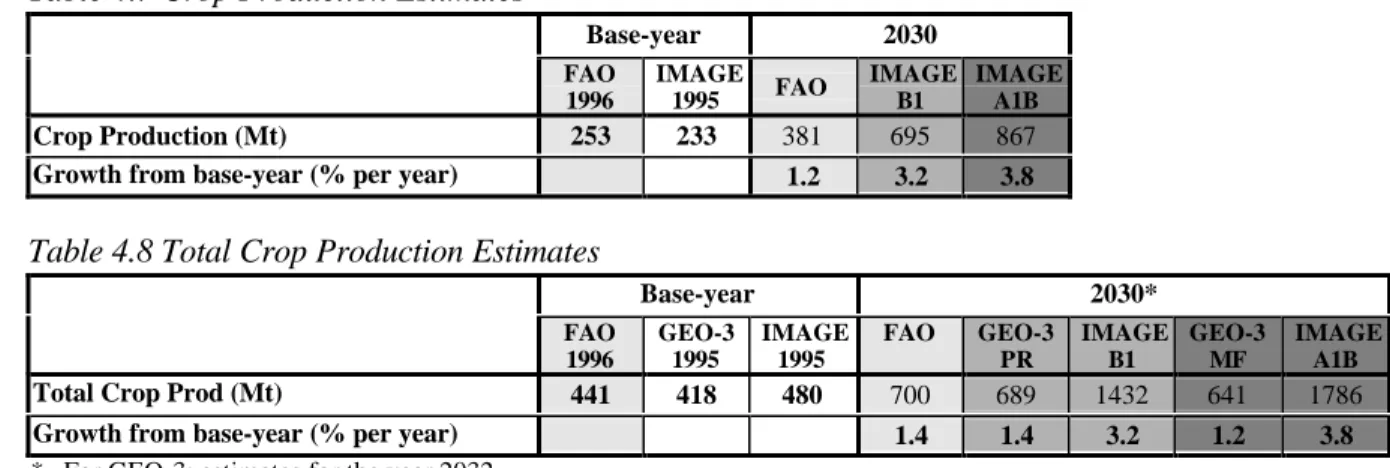
4.3.4 Crop production and total crop production
“Crop production” here refers to the volume of production of food (and feed) crops and biofuel crops, but excluding industrial crops, sugar cane, vegetables and fruits. “Total crop production” expresses volumes of production of total crop, including cereals, roots & tubers, pulses, raw sugar, vegetables and fruits, oilcrops and industrial crops. Crops for animal feed and biofuel crops are taken into account. Lists of commodities are presented in Appendix 1. The estimates on crop and total crop production are presented in Tables 4.7 and 4.8.
IMAGE 2.2 has the estimates on crop production available, but not on total crop production. The figures of total crop production for 1995, however, is available, thus future productions are estimated assuming the same growth rates as crop productions. FAO AT 2015/30 has both data available. Base-year data for both indicators are comparable among the different scenarios. Differences in figures might be caused by the different lists of countries, the different lists of commodities (although it is
tried to be inclusive for all outlooks) or different methods of reporting for each crop, for example biomass or products weights.
Table 4.7 Crop Production Estimates
Base-year 2030 FAO 1996 IMAGE 1995 FAO IMAGE B1 IMAGE A1B Crop Production (Mt) 253 233 381 695 867
Growth from base-year (% per year) 1.2 3.2 3.8
Table 4.8 Total Crop Production Estimates
Base-year 2030* FAO 1996 GEO-3 1995 IMAGE 1995 FAO GEO-3 PR IMAGE B1 GEO-3 MF IMAGE A1B
Total Crop Prod (Mt) 441 418 480 700 689 1432 641 1786
Growth from base-year (% per year) 1.4 1.4 3.2 1.2 3.8
* For GEO-3: estimates for the year 2032
Crop and total crop production corresponds to average daily consumption and trade assumptions. GEO-3 and FAO envisions more or less the same growth rates, with PR scenario being closer to FAO projection. IMAGE 2.2 envisions a much higher growth of crop production, in response to higher domestic crop demand and trade assumptions. Also, higher meat and milk production in IMAGE 2.2 leads to higher feed crop production.
4.3.5 Total crop area, total harvested area and cropping intensity
“Total Crop Area” refers to the area of arable land used for total crop production. “Total Harvested Area” refers to the total area that is actually harvested. If more than one crop is grown each year (i.e. the cropping intensity is greater than one), the total harvested area of all crops is larger than the actual food crop area. In regions where part of the land is left fallow each year, the harvested area is smaller than the total arable area for food crops (i.e. the cropping intensity is less than one).
“Cropping intensity” represents the average number of food crop cycles that can be obtained in a region on its agricultural land. In regions dominated by irrigated crop production, the cropping intensity exceeds 100%, indicating that on the average more than one crop is grown on the same land each year (RIVM, 2001).
Table 4.9 Total Crop Area Estimates
Base-year 2030* FAO 1996 GEO-3 1995 IMAGE 1995 FAO GEO-3 PR IMAGE B1 GEO-3 MF IMAGE A1B
Total Crop Area (Mha) 92 89 88 105 98 122 94 141
Growth from base-year (% per year) 0.4 0.3 0.9 0.1 1.4
* For GEO-3: estimates for the year 2032
Table 4.10 Total Harvested Area Estimates
Base-year 2030 FAO 1996 IMAGE 1995 FAO IMAGE B1 IMAGE A1B
Total Harvested Area (Mha) 91 90 111 158 179
Table 4.11 Cropping Intensity Estimates Base-year 2030 FAO 1996 IMAGE 1995 FAO IMAGE B1 IMAGE A1B Cropping Intensity (%) 98 103 105 128 127
Growth from base-year (% per year) 0.2 0.6 0.6
Base-year data are comparable for all scenarios. GEO-3 shows higher increase of total crop area in PR than MF because there is more production required. For the same reason IMAGE 2.2 shows higher increase in A1B than B1. IMAGE 2.2 figures for 2030 are the highest among the three outlooks, because it envisions the highest production. FAO projects a higher increase in crop area in the next 30 years compared to GEO-3. With about the same increase in domestic crop demand (0.5-0.7% per year), this means that GEO-3 visions are more towards strong intensification in crop production. This is also reflected in the increase of fertiliser use that will be discussed in its section below.
GEO-3 does not use the indicator “cropping intensity”. The base-year estimate in IMAGE 2.2 for this indicator is higher than that of FAO, probably because of the exclusion of some commodities as discussed in the previous section on (total) crop production. The future projection in IMAGE 2.2 also shows much faster increase than FAO, indicating more optimistic assumption on agricultural development.
4.3.6 Irrigated cropland
Table 4.12 presents the estimates on area of irrigated cropland. IMAGE 2.2 gives no estimates of future irrigated areas.
Table 4.12 Irrigated Cropland Estimates
Base-year 2030*
Irrigated Cropland FAO
1996 GEO-3 1995 FAO GEO-3 PR GEO-3 MF
Absolute Area (Mha) 16 15 22 19 19
Relative (% of total crop area) 18 17 20 19 20
* For GEO-3: estimates for the year 2032
The base-year and projected data of GEO-3 and FAO are comparable. In 30 years, irrigated cropland will comprise about 20% of total cropland, increasing from about 17-18% in 1995/1996. With increasing crop area, the water used for irrigation will also increase. This will be discussed in the section on water withdrawal for agriculture. GEO-3 assumes the same area of irrigated cropland in both MF and PR scenario.
4.3.7 Cereal harvested yield
Cereal harvested yield expresses the cereal production per unit of area. The estimates are presented in Table 4.13.
Table 4.13 Estimates on Cereal Harvest Yield
Base-year 2030* FAO 1996 GEO-3 1995 IMAGE 1995 FAO GEO-3 PR IMAGE B1 GEO-3 MF IMAGE A1B
Cereal Harvest Yield (t/ha) 3.13 3.07 3.19 4.07 5.24 5.44 5.16 5.39
Growth from base-year (% per year) 0.8 1.5 1.5 1.4 1.5