NATIONAL INSTITUTE OF PUBLIC HEALTH AND THE ENVIRONMENT
Report no. 719101023
Determination of field-based partition coefficients for heavy metals in Dutch soils and the relationships of these coefficients with soil characteristics
R.P.T. Janssen, P.J. Pretorius, W.J.G.M. Peijnenburg and M.A.G.T van den Hoop
January 1996
This research was carried out on behalf of the Directorate General for Environmental Protection, Directorates for Soils, and for Chemicals, External Safety and Radiation Protection of the Ministry of Housing, Spatial Planning and the Environment, in the framework of
project no. 719101 'Exposure Assessment'.
Laboratory for Ecotoxicology,
National Institute of Public Health and the Environment. P.O. Box 1. 3720 BA Bilthoven, the Netherlands, tel. +31-30-2749111, fax+31-30-2744413.
page 2 of 35 Report no 719101023
Mailing list
1 Directoraat-Generaal Milieubeheer, Directie Bodem
2 Directoraat-Generaal Milieubeheer, Directie Stoffen, Veiligheid, Straling 3 Plv. Directeur-Generaal Milieubeheer, Dr.Ir. B.C.J. Zoeteman
4 Drs. C.A.J. Denneman (DGM/Bo) 5 Dr.ir. A.E. Boekhold (DGM/Bo) 6 Dr. J.H.M, de Bruijn (DGM/SVS)
7 Dr. H.E. Allen, University of Delaware, Newark
8 Dr. J. Bril, AB-DLO, Instituut voor Agrobiologie en Bodemvruchtbaarheid
9 Drs. P. del Castilho, AB-DLO, Instituut voor Agrobiologie en Bodemvruchtbaarheid 10 Ir. Th. Edelman, Gedeputeerde Staten van Gelderland
11 Drs. T.J. Heimovaara, Universiteit van Amsterdam
12 Prof.Dr. A. Kabata-Pendias, Institute of Soil Science and Cultivation of Plants, Pulawy 13 Ir. Th.M. Lexmond, Landbouwimiversiteit Wageningen
14 Dr. J.P.G. Loch, Rijksuniversiteit Utrecht
15 Prof.Dr. W.H. van Riemsdijk, Landbouwuniversiteit Wageningen
16 Ir. P. Römkens, AB-DLO, Instituut voor Agrobiologie en Bodemvruchtbaarheid 17 Dr. W. de Vries, SC-DLO, Staring Centnmi, Instituut voor Onderzoek van het
Landelijke Gebied.
18 Dr.ir. T.M. Mehrian, Hogeschool Delft
19 Depot Nederlandse Publicaties en Nederlandse Bibliografie 20 Directie RIVM, directeur Milieu Prof.lr. N.D. van Egmond 21 Sectordirecteur Stoffen en Risico's, RIVM, Dr.ir. G. de Mik
22 Hoofd Laboratorium voor Ecotoxicologie, RIVM, Dr. H.J.P. Eijsackers
23 Hoofd Laboratorium voor Bodem en Grondwateronderzoek, RIVM, Ir.R. van den Berg 24 Dr. P. van Beelen (RIVM/ECO)
25 Dr.ir. J.J.M, van Grinsven (RIVM/LEG) 26 H.A. den Hollander (RIVM/ECO) 27 Dr.ir. F.A. Swartjes (RIVM/LBG) 28 Ir. E. Elzinga (RIVM/LBG) 29 Dr. O. Klepper (RIVM/ECO)
30 Dr.ir. D. van de Meent (RIVM/ECO) 31 Drs. G. ter Meulen-Smidt (RIVM/LBG) 32 Dr.ir. J. Notenboom (RIVM/ECO) 33 Dr. L. Posthuma (RIVM/ECO) 34 Ir. C. Roghair (RIVM/ECO) 35 Dr. J. Struijs (RIVM/ECO) 36 Ir. B. van de Berg
37 Ir. G. Kwakkel 38 D. van Tongeren 39-42 Auteurs
43 Hfd Voorlichting en Public Relations, RIVM, Drs. J.A.M. Lijdsman-Schijvenaars 44 Bureau Projecten- en Rapportenregistratie
45-46 Bibliotiieek RIVM
Table of contents
Mailing list 2 Table of contents 3 Acknowledgements 4 Summary 5 Samenvatting 61. Equilibrium partitioning concept 7 I. I Introduction 7 1.2 Aim of this research 8
2. Experimental 9 2.1 Soil sampling 9
2.2 Collection of pore water 10 2.3 Pretreatment of soils 11 2.4 Extractions and digestion 11
2.5 Chemical analysis 12 2.6 Principal component analysis (PCA), partial least squares (PLS) 13
3. Results and discussion 14 3.1 Soil phase characteristics 14
3.2 Pore water characteristics 15 3.3 Relations between soil characteristics 20
3.4 Metal concentrations in the solid phase 22
3.5 Partition coefficients 25 3.6 Relations between partition coefficients and soil characteristics 28
4. Conclusions 33
paee 4 of 35 ' Report no 719101023
Acknowledgements
The authors are grateful to the people of the Laboratory for Inorganic Chemistry, the Laboratory for Soil and Groundwater Research and the Department of Physical and Chemical Techniques of the Laboratory for Ecotoxicology for carrying out part of the experimental work. We thank Henri den Hollander and Daniel van Tongeren for their assistence in collecting the soil samples and carrying out part of the experimental work. We are also grateful to the advisory board for helpful discussions and comments on the report. The members are A.E. Boekhold, C.A.J. Denneman (both Directorate General for Environmental Protection), J. Bril (Institute of Soil Fertility), W.H. van Riemsdijk (Department of Soil Science and Plant Nutrition, Wageningen Agricultural University), W. de Vries (Institute for Integrated Land, Soil and Water research), J.J.M. van Grinsven, F.A. Swartjes (National Institute of Public Health and Environmental Protection). We thank D. van de Meent, P. van Beelen, J. Notenboom, L. Posthuma (National Institute of Public Health and Environmental Protection) for comments on the report.
Summary
Twenty Dutch soils were sampled at sites which were polluted with heavy metals. Field-based partition coefficients (Kp) for As, Cd, Cr, Cu, Ni, Pb and Zn were determined by calculating the ratio of the content of metal extracted by 0.01 A/ CaCh or concentrated HNO3 to the total metal concentration in the pore water. Kp values varied greatly with metal and soil type. Kp values based on the CaCl2 extract were poorly correlated to soil and pore water characteristics. Kp values based on the HNO3 destruate were well correlated to the same characteristics. It was concluded that especially pH, clay content, amorphous Fe and Al content, CEC and Ca concentration in the pore water explained the high percentage of the variation in Kp values. Finally, for every studied metal, regression equations, including a combination of two soil characteristics, were derived, explaining most of the variation in Kp.
page 6 of 35 Report no 719101023
Samenvatting
Twintig met zware metalen verontreinigde bodems zijn bemonsterd. Veldgemeten partitiecoëfficiënten (K^) voor As, Cd, Cr, Cu, Ni, Pb en Zn zijn bepaald als de verhouding tussen de metaalgehalten geëxtraheerd met 0,01M CaClj of geconcentreerd HNO3 en de metaal concentraties in het poriewater. De gemeten K^ waarden varieerden sterk per metaal en bodemtype. De K^ waarden gebaseerd op de CaCl2 extracten, zijn slecht gerelateerd aan poriewater- en bodemkarakteristieken. Daarentegen bleken de Kp waarden, gebaseerd op de HNO3 destructies, sterk gerelateerd te zijn aan dezelfde karakteristieken. Vooral pH, lutum gehalte, amorf Fe- en Al-gehalte, CEC en de Ca-concentratie in het poriewater bleken van grote invloed op de variatie in de Kp waarden. Tenslotte zijn per metaal regressiemodellen opgesteld, waarin met een combinatie van twee bodemkarakteristieken de variatie in Kp waarden goed kon worden voorspeld.
1. Equilibrium partitioning concept
1.1 IntroductionThe bioaccumulation of metals in organisms in the environment is highly dependent on the bioavailability of metals to organisms. Until now less is known about the bioavailability of metals to soil organisms and hence there is a lack of toxicity data for soil systems. Bioavailability and toxicity of heavy metals in sediments and soils can also be expressed in terms of pore water concentrations (Van Stralen and Bergema, 1995). For water systems toxicity data are available and water quality data have been derived. Hence, it is of great practical interest and importance to have a quantitative imderstanding in the distribution of heavy metals over the solid phase and pore water in soils. A relatively simple approach for calculating the distribution of heavy metals in soils is the so-called equilibrium partitioning (EP) concept (Shea, 1988; Van der Kooij et al., 1991). The EP concept assimies that chemical concentrations among envirormiental compartments are at equilibrium and the partitioning of metals among environmental compartments can be predicted based on partition coefficients. The partition coefficient, Kp, used to calculate the distribution of heavy metals over solid phase and pore water is defined as:
K = ^^^^^"''d p'--" ^iikg) (1)
p
[Metal]
*- •'pore water
Given water quality criteria, and given the partition coefficients, this method allows for the calculation of maximum permissible metal concentrations associated to the solid phase. The latter concentrations are oiïen a good estimate of the total metal concentrations
and can be used as soil quality criteria. The EP concept also allows for the harmonization of quality criteria in the different compartments, an important objective for setting quality criteria in the Netherlands.
Unfortimately, Kp is not a constant which complicates matters. It is affected by element properties and both solid phase and pore water characteristics. Knowledge of the relationship between soil characteristics and Kp values enables a calculation of the distribution of heavy metals over the solid phase and pore water for different soils. Solid phase characteristics of importance include the reactive sorption phases clay minerals, organic matter and the (hydr)oxides of Fe, Al and Mn. Heavy metal ions react with the reactive components in soils in different ways. They bind to clay minerals via an ion exchange mechanism to the negatively charged siloxane surface that dominates the total surface area of the clay. Ion exchange is not pH dependent. The edges of clay minerals, which form a small fraction of the total surface area of the clay, bind metal ions via formation of surface complexes with reactive groups. Metal ions can also form surface complexes with reactive sites present on metal hydroxide particles (Kinniburgh et al., 1976) and organic matter. In (oxic) soils, Al, Fe and Mn hydroxides occur as (i) cementation agents of primary soil particles and/or as (ii) coatings on soil particles where they intimately mix with clays. For instance Al hydroxide particles are known to bind strongly to the siloxane surface of clay minerals, forming layers of Al hydroxide polymers (Al interlayers) between the clay platelets (Janssen, 1995). Organic matter in soils consists of a continuum from recognizable plant material to highly degraded fulvic acids. Fulvic acids are dominant as soluble components (DOC: dissolved organic carbon), they can form complexes with metals and prevent them from being adsorbed. The
page 8 of 35 ' - -Report no 719101023
strength of metal binding on clay siu-faces is weak relative to binding to metal hydroxides and organic matter. Thus, the most likely role of the clays is that of a carrier for the substrates which bind metals more strongly (Jetme, 1977).
Anderson and Christensen (1988) concluded that the pH was the most important factor in determining the distribution of Cd, Co, Ni and Zn in soils. Clay content and the amount of hydrous Fe and Mn oxides were also significant, but to a lesser extent. According to Buchter et al. (1989), pH and cation exchange capacity (CEC) were significantly correlated with Kp values for 15 elements.
Pore water characteristics such as pH, ionic strength and the nature and concentrations of complexing ligands are also of importance; However, most studies for the determination; of Kp values and their relationships with soil characteristics are carried out through adsorption studies imder laboratory conditions, only taking into account solid phase characteristics. Typically, a dried soil sample with known metal content is brought into contact with some solution. After a fixed contact period solution phase concentrations are determined. The validity of applying Kp values obtained in this way to field situations may be questioned. First, drying may alter the nature of the soil. Second, the laboratory solution phase may not have the same composition as the solution phase in field situations. Thus, equilibrium conditions in laboratory situations may differ markedly from those imder field conditions.
A possible means of overcoming these problems may be to determine metal concentrations in pore waters collected from the soil (Kabata-Pendias and Tarlowski, 1970; Bufflap and Allen, 1995a). However, this method is also not free of problems. It is not known what effect the separation procedure has on pore water metal concentrations. That, the composition of the pore waters is dependent on the way of obtaining the pore waters was shown by Kabata-Pendias and Wi^cek (1986). They showed that the pH and cation concentrations of pore waters obtained by centrifugation and by adding water to air dried soils differed markedly. Further, very low metal concentrations occur in pore water what may lead to detection problems.
Recently Gooddy et al. (1995) determined field-based K^ values for many elements by analyzing element concentrations directly in the pore water. The metal concentrations in the solid phase were analyzed by means of three extraction procedures. They concluded that Kp values were strongly dependent on the type of extraction agent and the concentration of DOC in the pore water. Van den Hoop (1995) determined fiel-based Kp values for Cd, Cu, Ni, Pb and Zn, by analyzing element concentrations directly in the pore water. The sampled soils contained low levels of metals and were assiuned to be at backgroimd level. They found that the CEC correlated well with partition coefficients.
1.2 Aim of this research
The aim of the present research is to evaluate the applicability of the EP concept for the derivation of soil and groimdwater quality criteria in the Netherlands. In order to apply the EP concept in the Netherlands, Kp values for Dutch soils and their relationship with soil characteristics should be studied. Until now, in only a few studies Kp values were measured for Dutch soils and investigated their relationship with soil characteristics (Van den Hoop, 1995; Gerritse and Van Driel, 1984). Van den Hoop (1995) studied backgroimd level soils, whereas Gerritse and Van Driel (1984) studied metal partitioning imder laboratory conditions and excluded metal hydroxides. In the present study two objectives are of importance: (i) Determination of in-situ partition coefficients (As, Cd, Cr, Cu, Pb and Zn) for 20
polluted soils sampled in the Netherlands.
(ii) Investigation of the dependence of measured Kp values on soil and pore water characteristics.
2. Experimental
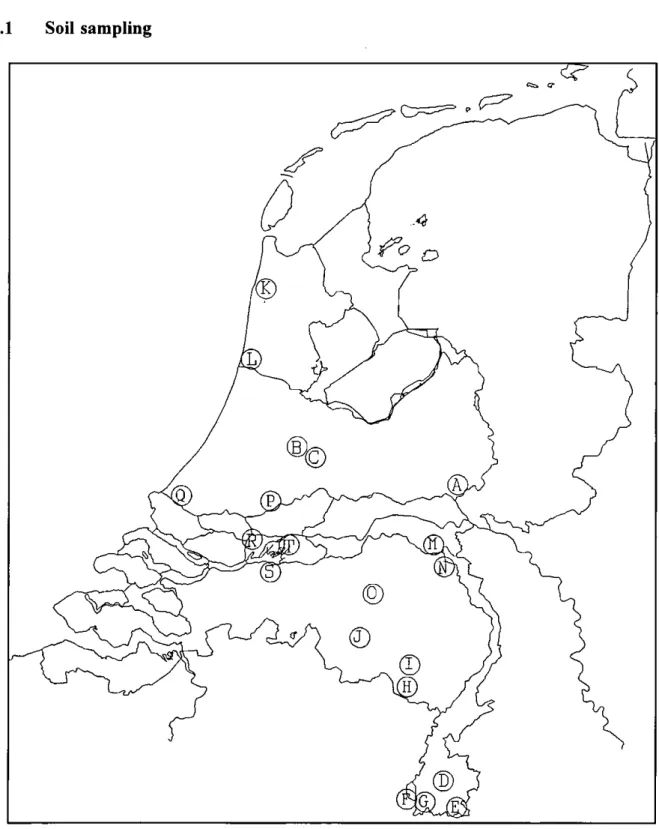
2.1 Soil samplingFigure 2.1. Map of the Netherlands showing the locations of the sampling sites. For site codes see Table 2.1.
page 10 of 35 Report no 719101023 Soil samples were collected from 20 different sites in the Netherlands in October and November 1994. Trying to meet the assumption of equilibrium in the sampled soils, sampling was carried out under dry weather conditions. Figure 2.1 shows the locations and Table 2.1 the site codes. The criteria used for the selection of sampling sites were: (i) elevated metal concentrations had to be expected due to the location of sites close to sources of pollutants of interest, (ii) little or no impact from agricultural practices and (iii) soil characteristics had to vary amongst sites.
For each site the upper litter or gras layer was removed and a total of 20 L of soil from the toplayer (0-20 cm) was collected. The samples were transferred to the laboratory and stored in two 10 L polyethylene containers at ambient temperature for further handling-and analysis.
Table 2.1. Locations, codes and main sources of metal pollution of the sampling sites. Code Site Main source of metals A B C D E F G H I J K L M N O P Q R S T Rozen daal Woerden Woerden
Houthem, river bank (De Geul) Epen, river bank (De Geul) Eijsden
Eijsden, river bank (De Maas) Budel
Budel
Valkenswaard, river bank (De Dommel) Callantsoog
Wijk aan Zee Heumen Mook
Boxtel, river bank (De Dommel) Bergambacht, river bank (De Lek) Vlaardingen
Kop van het Land, river bank (Merwede) Hank, estuarine river bank (Biesbos) Drimmelen, river bank (Amer)
Secondary lead smelter Motorway traffic Railway
Lead/zinc mining Lead/zinc mining Zinc oxide factory Sources upstream Zinc factory Zinc factory Sources upstream Former shooting range Blast-furnace steelworks Power line pylon Zinc plating factory Sources upstream Sources upstream Waste incinerator Sources upstream Sources upstream Sources upstream 2.2 Collection of pore w a t e r
Recently several papers on pore water collection methods have been published (Brumbaugh et al.; 1994, Bufflap and Allen, 1995a and 1995b; Taylor and Shiller, 1995). Four methods of pore water collection are common. Bufflap and Allen (1995b) recommended centrifugation, because this method gives only sligthly lower heavy metal concentrations in the pore water expected and because of the relatively easy way to collect the pore water compared to other methods. Hence, in this study we collected pore water by centrifugation. After the soil samples were taken, pore water was collected as soon as possible (usually the day after, always within a week). Pore water was obtained by centrifugation of the soils at 7500 rpm (6000 g) and 15 °C. Approximately 2.0 kg of soil was centrifuged.
Centrifugation was continued until about 200 mL of pore water was collected. If insufficient quantities of pore water could be collected, another portion of 2.0 kg soil was centrifuged. The final percentage of collected pore water from the total amount of pore water present (moisture content) ranged from 17 to 64 percent (w/w). The moisture content of the wet soil was determined from the weight loss of approximately 10 g of soil heated at 105°C for about 24 hours.
To separate solid phase and pore water from soils,, it is necessary to filter the pore water after or during centrifugation. However, the size of the particles that-are suspended or dissolved is a matter of definition and is operationally defined. This can be controlled by the pore size of the filter. Also preloading of the filter influences the separation (Taylor and Shiller, 1995). In many studies a 0.45 pm pore size filter is used to separate the solid phase from the pore water, mainly for sediments (Brumbaugh et a l ; 1994, Bufflap and Allen, 1995a and 1995b; Taylor and Shiller, 1995). However, in this study we collected pore water from soil samples. One of our goals was to determine Kp values in order to elucidate the mobility of heavy metals. Therefore a filter with a larger pore size is used, since also small soil particles may be mobile. In this study as in a similar study of Van den Hoop (1995) a 2.5 pm pore size filter was used. Filtration was carried out simultaneously with centrifugation, by using teflon centrifuge tubes with a built-in filter and detachable pore water sample cups. Filtration by using a built-in filter is prefered over filtration after the pore water is collected, since several studies reported the loss of trace metals during filtration after collection of the pore water. This may be due to removal of particles associated with trace metals, filtration of oxidized metal-ligand complexes or sorption to the filter (Bufflap and Allen, 1995a). When no precautions are taken against oxidation, ferric (oxy)hydroxide precipitates may form, sorbing trace metals. During filtration, these precipitates would be removed from the samples. By using a built-in filter or by conducting the filtration in an inert atmosphere this is avoided (Bufflap and Allen, 1995a).
After the pore water was collected in the detachable cup it was transferred by a pasteur pipette into a plastic bottle. The pH and the conductivity of the pore water samples were measured. Part of the pore water was transfered to a 50 mL glas bottle for the analysis of the anions. The remaining part of the pore water was acidified with concentrated nitric acid to set the pH to 2 and used for the analysis of trace elements and major cations.
2.3 Pretreatment of the soils
After centrifugation the soil samples were air dried and organic remainders like roots were removed. Agglomerates were broken by hand, and gently ground in an agate mortar. Particles larger than 2 mm were removed by sieving, the remaining soil was mixed. The moisture content of the air-dry soil was determined from the weight loss of approximately 10 g of soil heated at 105°C for about 24 hours.
2.4 Extractions and digestion
CaCl2 extraction
10.00 g of air-dry soil was weighed into a 250 ml plastic bottle and 100 ml of a O.OlMCaClj solution was added to each bottle. The bottles were shaken for about 24 hours at 150 rpm. The supematants were passed through a 0.45 pm filter. The pH in the extracts was measured
page-12of 35 Report no 719101023
(pH(CaCl2)) and the extracts were acidified with concentrated nitric acid to set the pH to 2. Two blanks were prepared and treated in the same way as the soil samples.
Nitric acid digestion
0.500 g of groimd air-dry soil was weighed into a microwave digestion bomb and 2 ml deionized water and 5 mL concentrated nitric acid were added to each bomb. The soil samples were digested in a microwave oven (CEM corporation-MDS 2000) for one hour at.630 W. After the samples were cooled, they were transferred into a volumetric flask and diluted to a final volume of 100 mL with deionized water. The digest was allowed to settle and the next day the clear solution was decanted into a plastic bottle. For reference purposes, two blanks and two standard soils were digested simultaneuosly.
Ammonium oxalate - oxalic acid extraction
2.50 g of air-dry soil was weighed into a 250 ml plastic bottle and 50 ml of a 0.114M ammonium oxalate-0.086Moxalic acid solution was added to each bottle (Houba et al., 1989). The bottles were shaken in a dark room for two hours at 150 rpm and room temperature. The supernatants were passed through a 0.45 pm filter. Two blanks were prepared and treated in the same way as the soil samples.
2.5 Chemical analysis
Pore water cations
The pore water cation concentrations were obtained for several elements. Cd, Cr, Ni and Pb were analyzed by graphite furnace AAS (Perkin Elmer-5100 PC and Zeeman background correction). Cu and Zn were analyzed by AAS (Perkin Elmer-2100 and deuterium background correction). As was analyzed by FIAAS (Perkin Elmer-2100, with FIAS-200). Ca, Mg, Na, K, Zn, Fe, Mn, Al were analyzed by ICP-AES (Spectro Analytical Instruments).
anions
The pore water was analyzed for the following anions: CI", NO3', HCO3", COg^" (all determined by ion chromatography, Dionex-2000i), P04^" (continous flow analysis, Skalar), DOC (dissolved organic carbon, determined with Dohrmaim DC-190, TOC-analyzer).
Extracts
The CaClj extract and HNO3 digest were analyzed for the same cations as the pore water. The ammonium oxalate - oxalic acid extraction was analyzed for Al and Fe by ICP-AES (Spectro Analytical Instruments).
Characterization of the solid phase
The soils have been characterized in terms of pH(H20), pH(KCl), pH(CaCl2), loss-on-ignition (LOI), granular size distribution, cation exchange capacity (CEC) and Al-/Fe-oxyhydroxides (by the ammonium oxalate - oxalic acid extraction).
LOI was determined from the weight loss of approximately 5 g of air-dry soil heated at 550°C for 2 hours. The carbon content of the soil was calculated from LOI by correction for Fe203 and <2pm particles (Houba et al., 1989). The organic matter content was calculated from the carbon content by multiplying with a value of 1.7. pH(H20) and pH(KCl) were determined
at a 1:2/2 soil:liquid (w/v) ratio with HjO and \M KCl. pH(CaCl2) was determined in the O.OlMCaClj extract. CEC of the soil was determined in an unbuffered BaClj extract (Houba et ai., 1989). To that end 2.50 g of air-dry soil was weighed into a centrifuge tube and several portions of 30 mL O.lM BaCl2 were added, the suspension was shaken and the cation exchange sites were loaded with Ba. Eventually 30.0 mL 0.0200A/ MgS04 was added upon which BaS04 precipitated and the cation exchange complex was fully occupied by Mg. The amount of Mg which remained in the supernatant was titrated with EDTA. The amount of Mg not titrated was assumed to be equal to the CEC.
2.6 Principal Component Analysis (PCA) and Partial Least Squares (PLS)
Principal component analysis (PCA) was used to determine meaningful patterns among the soils and relations between the soil characteristics. Details of this method are provided by Geladi and Kowalski (1986). Geometrically the data points can be represented as points in a multidimensional space with the variables as axes (in our case the soil characteristics). Distances and clusterings of points can be interpreted as similarities and dissimilarities among the objects. PCA calculates vectors (principal components) which fits best through the multidimensional data points. The first principal component is the vector of best fit for the data points. SubsequenUy, principal components can be calculated orthogonal to each other creating a plane or hyperplane and retain increasingly smaller R^. To get an overview of the data set, a few (2 or 3) principal components are often sufficient. Subsequently identified principal components are characterized by a decreasing correlation coefficient, which usually becomes insignificant at the level of the third, fourth (or higher level) component. The number of significant components is determined via cross-validation criteria given within the programme. A principal component consists of a score, which summarizes the X-variable (soil sample) and a loading, showing the influence of the variables (soil characteristics). In a score plot defined by 2 principal components, soil samples that have similar characteristics plot out near each other. This can give an indication of the similarity of soils. A loading plot defined by 2 principal components, can give relationships among the soil characteristics. As in score plot, soil characteristics that plot out near each other on the loading plot may be closely related.
Partition coefficients were related to soil characteristics using the partial least squares (PLS) projection to latent structures method (Geladi and Kowalski, 1986). PLS is a multivariate projection method which finds relationships between predictor variables (here: soil characteristics) and a response variable (here: the partition coefficient) through regression modelling in latent variables in a similar way as PCA. As a measure of goodness-of-fit, we used the adjusted R^. This is the variance of all the Y's explained by the principal components. By using the adjusted R^ instead of a non-adjusted R^ the R^ values are corrected for the influence of the number of X's entered in the model. R^ has a maximum value of 1, and the higher this value, the better the model is considered to be. R^ values adjusted calculated with PLS are not sensitive for correlation between the descriptors when determining the relation between predictors and response.
Because the raw soil characteristics and Kp data showed a log-normal distribution, the data sets used in this study were log transformed (except pH) before PLS and PCA analysis were carried out to meet the assumption of normality required for the regression models (Heisterkamp et al., 1992).
PLS and PCA are available in several commercial software packages. We used SIMCA-S for Windows (Umetri AB, 1994).
page 14 of 35 Report no 719101023
3. Results and Discussion
3.1 Soil phase characteristics
Table 3.1 " "'^'Characterization of the solid phase of the sampled soils.
Sample E941018A E941027B E941027C E94I102D E941102E E941102F E941102G E941103H E941I03I E941103J E941104K E94I104L E94H22M E941!22N E9411250 E941128P E941128Q E941I28R E94I129S E94II29T
w,
% 12 74 55 29 26 33 37 10 13 43 8 30 12 6 32 66 56 58 33 40w,
% 7 61 45 18 16 24 27 5 6 33 3 20 8 4 19 51 47 46 23 26 pH HiO 3.8 5.8 5.8 7.4 7.2 6.6 7.6 4.4 3.9 5.5 4.8 7.6 4.5 4.4 5.9 7.5 7.0 7.7 7.8 7.9 pH KCl 3.0 5.0 4.5 6.8 6.5 6.0 7.0 3.2 2.8 4.9 3.4 6.7 3.5 3.6 5.1 6.7 6.4 6.9 7.0 7.0 pH CaCij 3.4 5.7 5.4 7.2 6.5 6.5 6.8 3.5 3.0 5.0 3.8 6.8 3.8 3.9 5.3 6.8 6.7 6.9 7.0 7.0 OM % 3.6 21.8 11.3 3.2 5.1 8.6 9.9 2.9 4.1 6.5 3.4 9.1 2.5 2.0 5.0 3.2 12.3 8.0 5.9 6.2 Clay % 2.9 24.5 33.8 6.2 7.4 11.7 6.8 0.8 3.4 2.7 2.7 3.4 4.3 3.1 7.0 4.3 26.9 19.0 13.6 10.5 Fe„ mmol/kg 27 171 211 65 86 71 297 4 6 283 5 64 30 21 283 236 144 173 114 91 Alo. mmol/kg 17 66 108 20 26 54 71 11 12 81 4 14 28 16 25 26 32 50 34 26 CEC cmol/kg 3.5 41.8 31.4 11.1 10.0 18.6 21.2 2.7 4.0 8.7 2.9 20.5 4.3 1.7 10.1 10.0 32.3 25.8 17.5 16.8 0M= Organic matterFCj.^ and Ai^^= Amount of iron and aluminium extracted with ammonium oxalate/oxalic acid. This is assumed to be present as amorphous Fe and Al hydroxide.
Clay= Soil particles <2 ^m CEC= Cation exchange capacity Wi= moisture content of the soil
W2= moisture content of the soil after centrifugation
Table 3.1 summarizes the results of the soil characteristics. One of the criteria to select the sample sites was that the soil samples should vary with respect to chemical composition and properties. Consequently, values for pH, for organic matter content, clay content, Fe^,^,
AIQX and CEC differ considerably. Metal hydroxides in soils are commonly determined based on two extraction methods. It is assumed that with the ammonium oxalate/oxalic acid extraction, amorphous Fe- and Al hydroxides are determined. Whereas with a dithionate extraction, apart from amorphous Fe- and Al-hydroxides, also mineral Al- and Fe phases are determined (Mehra and Jackson, 1960; McKeague and Day, 1966). Dekker et al. (1995) determined Al^^ and Fe^^ contents in Dutch soils. They found similar ranges for Al^^ and Fe^^ contents as in this study.
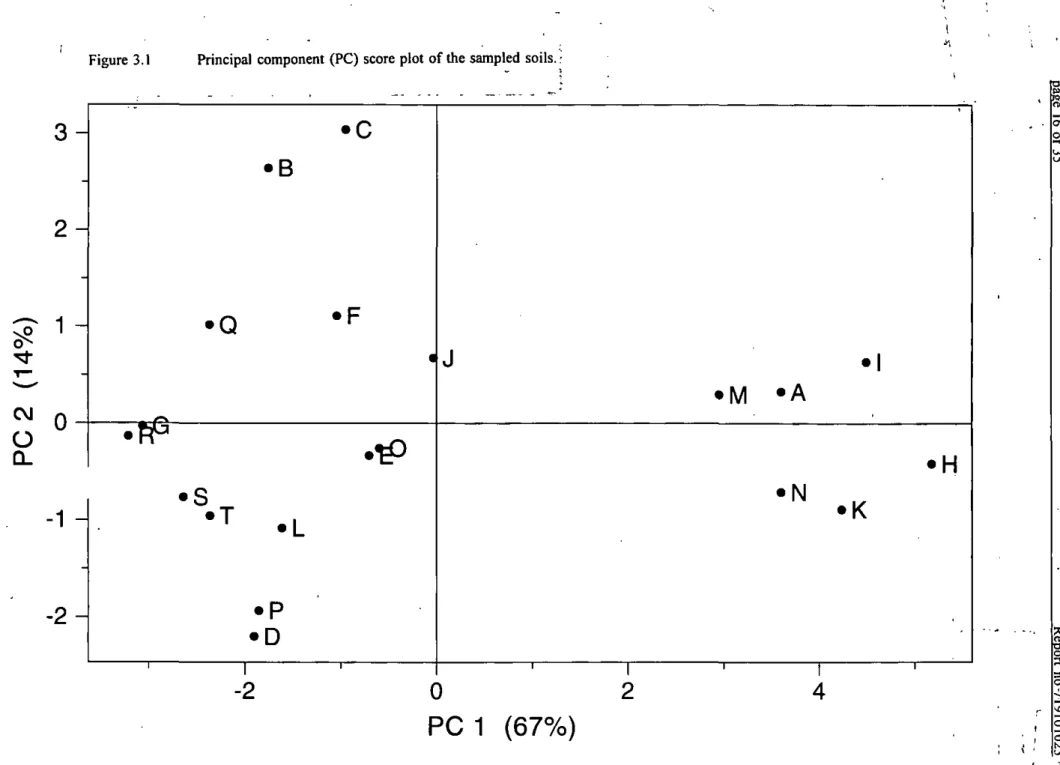
PCA (section 2.6) was performed on the soil characteristics to study the correlation between-the sampled soils. From the outcome of the score plot an indication of the similarity and diversity of soils can be gained. Soils which plot out near each other on the score plot may be related. The first two principal components explained 81 % of the variance. The third principal component explained only a small percentage of the remaining variance (9 %) and did not add much more information. Figure 3.1 shows the scores of the soils for the first two principal components and shows two clusters of soil samples. The first cluster on the right of the figure, contains the soils A, H, I, K, M, N. This indicates that these soils have similar characteristics. A comparison of these soils as listed in Table 3.1, shows a similarity in low pH, OM, clay, Fe^x, Al^^ and CEC. All these soil samples have been sampled in forest areas on sandy soils. Another more vaguely delineated cluster can be distinghuised on the left in Figure 3.1. These samples have a higher pH and CEC and contain more OM, clay, Fe^^ and Alox- These samples were sampled at river banks and meadows. Despite the similarities in types of sampled soils, soil characteristics varied amongst sites according the criteria used for the selection of the sampling sites.
3.2 Pore water characteristics
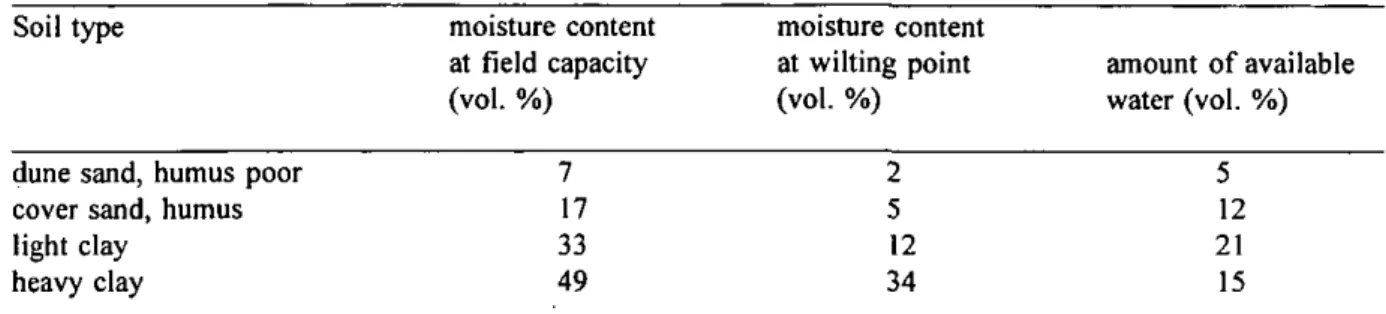
A point of consideration is the type of centrifuged pore water. In principle only easily available pore water should be collected. It should be avoided to collect hygroscopic water, which could contain high ionic concentrations originating from the adsorption phases. Table 3.2 shows for some typical soils in the Netherlands the moisture content at field capacity and at wilting point.
Table 3.2. Moisture content of several types of soils at field capacity and at wilting point, and the amount of available water for plants (from Kuipers, 1984).
Soil type
dune sand, humus poor cover sand, humus light clay
heavy clay
According to the Dutch classification a sandy soil contains <8% clay, a light clay soil contains 8%<clay<35% and a heavy clay soil >35 % clay. A humus poor soil contains <2.5% OM and a humic soil 2.5%<OM<15% (Kuipers, 1984). Consequently the sampled soils M and N are
moisture content at field capacity (vol. %) 7 17 33 49 moisture content at wilting point (vol. %) 2 5 12 34 amount of available water (vol. %) 5 12 21 15
Figure 3.1 Principal component (PC) score plot of the sampled soils.
3
2
-o
Q_
1
-
-2-•B
• Q
•FP
• s
• T . L
• P
• D
' 1• 0
•F
• ' ^ 1J
• M - A
• N
1 ' 1•1
• K
• H
1-2
0
PC 1 (67%)
D P 0\ O ?o n a o ;i 3 O O o ;».humus poor dune sands, the soils A, D, E, G, H, I, J, K, L, O and P are humus cover sands and B, C, F, Q, R, S and T are light clay soils (Table 3.1). According to the classification of the sampled soils and the moisture content before and after centrifugation (Table 3.1), most of the sampled soils have a moisture content at field capacity or higher. This is reasonable .since the soils have been sampled in the autumn which is a rainy period in the Netherlands.
However, some soils (A, H, I and K) seem to be below field capacity.
Table 3.2 gives the available amount of water for plants in soils at field capacity. This water may be assumed not to be hygroscopic. For all soils the amount of water collected during centrifugation did never exceed the amoimt of available water. For the soils A, H, I and K which were probably not at field capacity, always much less than the amount of available water was centrifuged, which indicates that also for these soils no hygroscopic water is centrifuged.
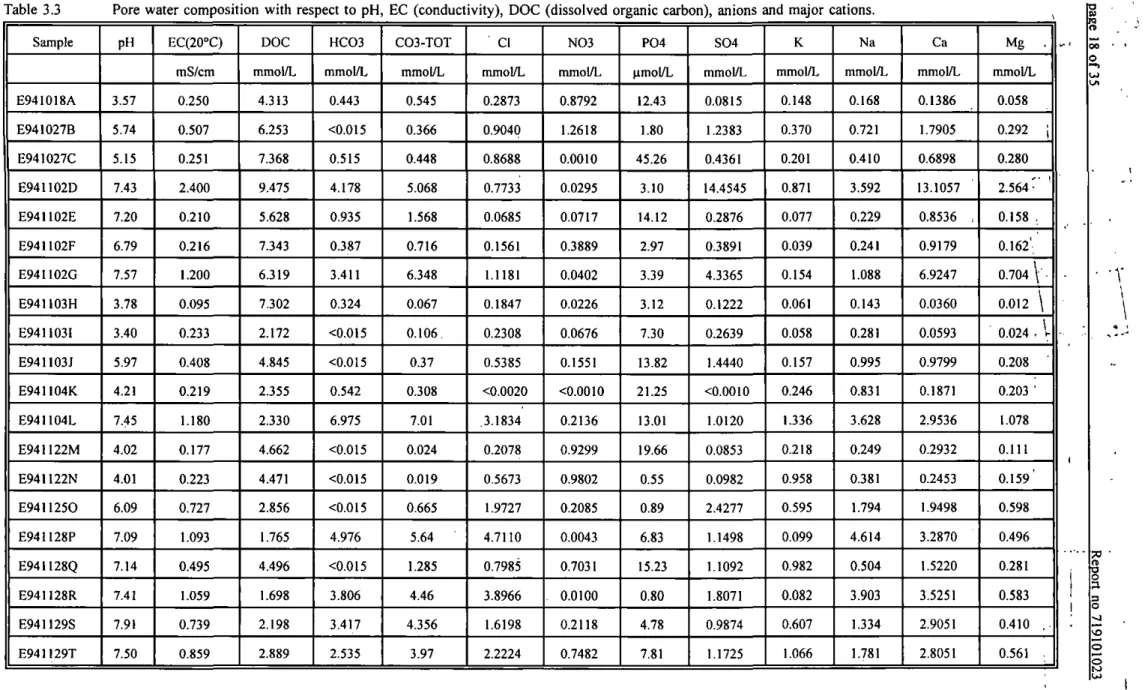
The total concentrations of various anions and cations in the pore water are presented in Tables 3.3 and 3.4. Anions, major cations, pH, electrical conductivity (EC) and DOC have been measured in order to be able to calculate Kp values, the charge balance, and the speciation of the metals present in the pore water. The speciation calculations in combination with bio-assays will be discussed in a separate paper.
The charge balance was calculated by summation of the anions and the cations pore water concentrations. The balance between cations and anions was generally in reasonable agreement. The differences between total cation concentration and total anion concentration, ranged from I to 51 % with a mean of 14 %. The ionic strength (I) of the pore water samples was calculated based upon the electrical conductivity (EC) measured in the pore water (Table 3.3) according to tiie formula I = 0.013 * EC (Lindsay, 1979).
Table 3.3 Sample E941018A E941027B E941027C E941102D E94I102E E94I102F E94I102G E94U03H E941I03I E941103J E941I04K E941104L E941122M E94I122N E9411250 E94iI28P E941128Q E94U28R E941129S E941129T
Pore water composition with respect to pH pH 3.57 5.74 5.15 7.43 7.20 6.79 7.57 3.78 3.40 5.97 4.2! 7.45 4.02 4.01 6.09 7.09 7.14 7.41 7.91 7.50 EC(20°C) mS/cm 0.250 0.507 0.251 2.400 0.210 0.216 1.200 0.095 0.233 0.408 0.219 1.180 0.177 0.223 0.727 1.093 0.495 1.059 0.739 0.859 DOC mmoi/L 4.313 6.253 7.368 9.475 5.628 7.343 6.319 7.302 2.172 4.845 2.355 2.330 4.662 4.471 2.856 1.765 4.496 1.698 2,198 2.889 HC03 mmol/L 0.443 <0.015 0.515 4.178 0.935 0.387 3.411 0.324 <0.015 <0.015 0.542 6.975 <0.015 <0.015 <0.015 4.976 <0.0I5 3.806 3.417 2.535
EC (conductivity), DOC (dissolved organic carbon), anions C03-T0T mmol/L 0.545 0.366 0.448 5.068 1.568 0.716 6.348 0.067 0.106, 0.37 0.308 7.01 0.024 0.019 0.665 5.64 1.285 4.46 4.356 3.97 CI mmol/L 0.2873 0.9040 0.8688 0.7733 0.0685 0.1561 1.1181 0.1847 0.2308 0.5385 <0.0020 .3.1834 0.2078 0.5673 1.9727 4.7110 0.7985 3.8966 1.6198 2.2224 N03 mmol/L 0.8792 1.2618 0.0010 0.0295 0.0717 0.3889 0.0402 0.0226 0.0676 0.1551 <0.0010 0.2136 0.9299 0.9802 0.2085 0.0043 0.7031 . 0.0100 0.2118 0.7482 P04 (imol/L 12.43 1.80 45.26 3.10 14.12 2.97 3.39 3.12 7.30 13.82 21.25 13.01 19.66 0.55 0.89 6.83 15.23 0.80 4.78 7.81 S04 mmol/L 0.0815 1.2383 0.4361 14.4545 0.2876 0.3891 4.3365 0.1222 0.2639 1.4440 <0.0010 1.0120 0.0853 0.0982 2.4277 1.1498 1.1092 1.8071 0.9874 1.1725
ind major cations. K mmol/L 0.148 0.370 0.201 0.871 0.077 0.039 0.154 0.061 0.058 0.157 0.246 1.336 0.218 0.958 0.595 0.099 0.982 0.082 0.607 1.066 Na mmol/L 0.168 0.721 0.410 3.592 0.229 0.241 1.088 0.143 0.281 0.995 0.831 3.628 0.249 0.381 1.794 4.614 0.504 3.903 1.334 1.781 Ca mmol/L 0.1386 1.7905 0.6898 13.1057 0.8536 , 0.9179 6.9247 0.0360 0.0593 0.9799 0.1871 2.9536 0.2932 0.2453 1.9498 3.2870 1.5220 3.5251 2.9051 2.8051 > Mg . mmol/L 0.058 0.292 ; 0.280 2.564-' ' 0.158 , 0.162' 0.704 \ • 0.012 \ 0.024 . V 0.208 • 0.203 • 1.078 0.111 0.159' 0.598 0.496 0.281 0.583 0.410 .-0.561 , a 00 O T n o o s o O O to
Sample E941018A E941027B E941027C E941102D E941102E E941102F E94U02G E941103H E941103I E941103J E94I104K E941I04L E941I22M E941I22N E9411250 E941128P E941128Q .E941128R E941129S E941129T n.d. = not deten Mn Hmol/L 10.81 0.80 1.13 8.00 0.86 0.58 0.22 0.18 0,50 0.65 3.46 0.39 12.81 15.58 5.15 12.68 0.38 3.18 0.42 0.60 nined Fe (imol/L 7.3 58.3 43.2 1.8 43.3 19.0 3.7 10.2 22.9 54.8 22.5 4.4 24.7 91.8 8.7 10.6 28.4 7.9 16.8 10.5 Al Hmol/L 50.5 33.3 147.4 3.4 35.5 31.1 6.0 48.5 74.8 16.8 44.7 5.8 70.1 203.5 5.2 4.9 57.2 15.4 27.6 17.6 As Hmol/L 0.046 0.023 0.027 0.018 0.071 0.076 0.038 0.159 0,139 0.179 0.089 0.052 0.016 0.073 0.017 0.13 0.045 0.087 0.112 0.117 Cd (imol/L • 0.0146 0.0030 0.0043 0.0040 0.0470 0.0287 0.0268 0.0931 0.0586 0.8227 0.0106 0.0136 0.0175 n.d. 0.1283 0.0117 0.0086 0.0071 0.0101 0.0079 Cr Hmo1/L 0.08 0.07 0.15 0.06 0.07 0.10 0.10 0.05 0.08 0.13 0.12 0.08 0.11 n.d. 0.11 0.09 0.09 0.16 0.12 0.10 Cu jimol/L 1.0 4.0 2.4 0.6 0.6 1.6 1.6 0.7 0.6 1.3 0.4 1.3 0.8 0.5 0.5 0.8 0.7 0.4 0.7 0.7 Ni pmol/L 0.24 0.36 0.53 0.72 0.23 0.31 0.26 0.08 0,09 1.08 0.10 0.12 0.18 n.d. 0.18 0.22 0.21 0.13 0.12 0.16 Pb Hmol/L 0.17 0.27 0.04 0.02 0.77 0.07 0.02 0.25 0.30 0.18 1.89 0.05 0.10 n.d. 0.02 0.04 0.03 0.03 0.05 0.03 Zn [jmol/L 3.3 V-2.0 1.3 4.8 ' 19.5 i 15.4 : 2.9 I 16.1 ' 5.4 116.5 1 2.4 , 1.6 7.4 76.9 6.5 2.5 , 0.9 1.4 1.4 1.2 o 3 O O o to
•page 20 of 35 Report no 719101023
3.3 Relations between soil characteristics
The relation between Kp values and soil characteristics heavily depends on the relationships between soil characteristics. The most important soil characteristics that need to be taken into account are: (i) The adsorption phases: clay, organic matter (OM) and metal hydroxides (Al-ox and Fe-ox). (ii) Many studies have shown the importance of soil pH. In this study the pH was measured as pH(KCl), pH(H20), pH(CaCl2) and pH(pore water), (iii) Competitive sorbed ions, corresponding with the CEC, since the CEC is determined as the amount of desorbed ions upon a high concentration of cations. Especially Ca is an important cation at the exchange complex of soils in the Netherlands. Chardon (1984) studied Cd adsorption onto twelve Dutch soils and concluded that Ca strongly influenced Cd adsorption. The 0.0lMCaCl2 extraction and HNO3 digestion method used in this study, imfortunately are not applicable to determine the amount of sorbed Ca. With the O.OIM CaClj, Ca is used to desorb cations and HNO3 dissolves partly the mineral lattice which is rich in, amongst others, Ca. An alternative characteristic for the amoimt of Ca sorbed may be the Ca concentration in the pore water, since these are closely related, consequently CEC and Ca concentration in the pore water have been analyzed.
Among the pore water characteristics influencing metal adsorption, complex-forming anions are an important factor. Especially dissolved organic carbon (DOC) is known to complex metals and keep them into solution (Gooddy et al., 1995). Therefore, DOC was taken into account as an important soil characteristic. Furthermore, the ionic strength (I) was taken into account as a measure of the total amount of ions.
Temperature is probably of minor importance and it is assumed that temperature influence is negligible. Moreover, this was kept as constant as possible.
PCA was carried out to study the correlation between the selected soil characteristics. Soil characteristics that plot out near each other on the loading plot may be closely related. As shown in chapter 3.1, the first two principal components explained 81 % of the variance and the third principal component did not add much more information (explained only 9 % of the remaining variance). Figure 3.2 shows the loadings of the soil characteristics for the first two principal components. The loading plot shows two clusters of soil characteristics. The first cluster contains all determined pore water characteristics except DOC. Especially the pH's are closely related. This suggests that no further information is gained when the pH's are measured in several ways. To study the relationship between Kp values and soil characteristics it is sufficient to use one type of pH measurement. For practical reasons the best choice seems pH(CaCl2), as the method to determine this pH is easy to carry out and already commonly used. Also ionic strength and Ca concentration in the pore water are closely related with the pH's. DOC does not seem to be closely related to the other soil characteristics. The second cluster in the loading plot contains all determined solid phase chracteristies: clay, Al-ox, OM, CEC and Fe-ox. Within this cluster a sub-cluster of Al-ox, OM and clay seems to be present. This suggests the presence of Al hydroxide and organic matter coatings on the clay particles. To a lesser extent this also hold for Fe hydroxide. CEC is correlated with Al-ox, OM, clay and Fe-ox, since they provide the main adsorption phases in the soil.
0 . 4
0 . 2
-CMO 0.0
CLOM
Al-ox
clay
•CEC
• Fe-ox
DGiC
73 n o o o to 1 I0 . 2
--0.3
-0.2 -0.1
PC 1 (67%)
0.0
0.1
- 1 - • • opage 22 of 35 Report no 719101023
3.4 Metal concentrations in the solid phase
The concentrations of some elements displaced by the HNO3 digest and the CaClj extract are given in Tables 3.5 and 3.6 respectively. The data are expressed on a dry weight basis and the- elements extracted with CaCl2 have been corrected for the amount of each element that was supposed to be present in the pore water at the moment of sampling. Through this correction the amount of metal desorbed from the solid phase is calculated. In some cases this led to some small negative values (Table 3.6). The correction was not necessary for the HNO3 digests since the amount of elements present in the digests were much higher than the amounts present in the pore waters. The HNO3 digestion results in nearly 100 percent release of trace metals (Luoma and Bryan, 1981) compared to total sample dissolution in HF. The much weaker CaCl2 extract releases only a small part of the metals from the solid phase, especially metals sorbed onto the oxide phases will not be released. As expected much higher concentrations of elements were found in the HNO3 digests than in the CaClj extracts.
It may be expected that the amount of extracted metals with the O.OIM CaCl2 extraction procedure correspond with pH and metal pore water concentrations. The pH(CaCl2) appeared to be a good estimate of the pH measured in the pore water (R^=0.97). For the various metals, theamount amount of metals extracted with 0.01A/.CaCl2 did correlate well with metal pore water concentrations for Ni (R^=0.64) and Zn (R^=0.7l). A very high correlation was found for Cd (R^=0.99). However, the Cd concentrations in the CaClj extracts were about a factor 5 to 10 higher than the Cd concentrations in the pore waters. This may be explained by considering the adsorption behaviour and solution chemistry of Cd. First, Cd adsorbs less strongly than other metals and (ii) CI" forms relatively strong complexes with Cd^^. For the other metals no good correlation was found.
Because the HNO3 digestion gives nearly total metal concentrations in soils, the heavy metal contents based on the HNO3 digestion (Table 3.5) can be compared with the soil quality criteria for heavy metals in the Netherlands (VROM, 1994). In several sampled soils concentrations were above the intervention and '/2*(intervention+background) values. In Table 3.5 the concentration of metals in soils which exceed the intervention values are marked bold and in italics, and the concentrations which exceed the '/2*(intervention+background) values are underlined and in italics. In total 11 soils are contaminated above the intervention value for As, Cd, Ni, Pb or Zn. The Cu concentration only exceeds the !/2*(intervention+ background) value. Some soils are contaminated with more than one metal. For Cr and Ni policy limits are not surpassed. Since 11 soils exceed the intervention value for one or more metals, these soils should be further investigated if remediation is necessary. The majority of the polluted soils are river bank soils. However, these samples were only point samples and thus give the state of pollution on only one single site.
italic and bold data: italic and underlined data:
E941018A E941027B E941027C E941102D E941I02E E94II02F E941102G E941103H E941I03I E94II03J E94I104K E94I104L E941122M E941122N E94I1250 E941128P E941128Q E941I28R E941129S E941129T K 18.0 92.9 220.7 65.1 71.3 83.6 110.9 3.3 4.6 36.0 7.3 22.8 20.4 27.0 24.7 76.0 112.3 91.1 111.6 93.4 Na 3.2 10.6 22.2 5.9 10.2 9.5 18.0 1.8 3.2 6.9 4.0 8.0 5.1 4.6 10.6 18.7 11.5 12.1 13.3 11.2 Ca 9.6 125.1 163.7 839.5 102.8 125.4 1552.3 1.2 2.5 42.4 8.6 246.7 8.3 8.6 55.1 1142.5 109.4 204.9 448.6 142.6 Mg 13.3 109.3 306.6 84.6 100.2 103.2 426.6 1.0 1.6 30.3 5.4 57.6 16.0 23.5 35.2 214.6 105.6 165.5 175.7 138.1 Fe 78.7 209.4 595.2 228.5 295.4 323.1 655.5 6.7 10.9 350.7 16.3 291.0 72.2 105.4 388.3 392.6 221.1 268.2 344.0 275.5 Mn 1.37 4.44 8.60 6.06 9.02 11.18 17.77 0.11 0.17 2.47 0.41 7.52 1,42 0.76 7.72 13.56 4.48 7.00 10.18 12.81 Al 161.3 633.7 1984.8 327.5 464.5 678.8 839.4 25.4 32.2 311.0 37.7 108.7 155.4 172.3 281.9 421.9 573.5 559.8 716.8 566.0 As 0.063 0.140 0.196 0.069 0.206 0.288 0.253 0.014 0.013 0.951 0.014 0.078 0.034 0.059 0.347 0.262 0.141 0.848 0.282 0.268 Cd 0.000 0.003 0.003 0.023 0.065 0.145 0.095 0.013 0.009 0.438 0.001 0.008 0.000 0.000 0.125 0.054 0.008 0.045 0.065 0.145 Cr 0.21 0.86 1.21 0.47 0.43 0.68 1.98 0.19 0.18 0.57 0.06 0.36 0,27 0.50 1.00 1.69 0.96 3.76 1.12 0.92 Cu 0.03 0.37 1.68 0.19 0.32 0.72 1.65 0.02 0.02 1.14 0.03 0.14 0.11 0.04 0.65 0.67 0.69 1.73 0.88 0.61 Ni 0.07 0.60 0.66 0.18 0.43 0.39 0.81 0.01 0.01 0.25 0.02 0.13 0.07 0,12 0.13 0.41 0.45 0.76 0.49 0.37 Pb 0.58 0.70 1.54 0.67 4.09 0.83 1.28 0.34 0.35 1.05 1.73 1.06 0.36 0.47 0.72 L35 0.92 1.36 0.88 1.98 Zn 0.24 1.21 2.92 13.44 47.55 20.00 18.06 0.37 0.22 17.99 0.08 ' 2.07 0,28 0,44 2.74 9.25 1.15 7.16-9.47 6.57 contaminated soils exceeding intervention value
contaminated soils exceeding !^*(intervention+background) value
o 3 O O to ; u> -a
Table 3.6 E941018A E941027B E941027C E941I02D E941102E E94n02F E94n02G E94n03H E941103I E941103J E941104K E94I104L E941122M E941122N E9411250 E941128P E941128Q E941128R E941129S E941129T
Metal concentrations solid phase (CaCl^ extraction) in )amol/kg. K 7.41 3.33 6.75 12.60 1.25 0.89 2.07 0.64 0.57 2.11 0.81 8.30 1.91 2.63 3.60 0.71 8.57 1.96 2.84 3.11 Na 0.26 0.48 1.38 0.57 0.37 0.68 0.87 0.15 0.79 0.58 0.44 1.56 0.21 0.20 1.04 -3.82 0.90 0.83 I.IO 1.01 Mg 0.33 7,17 13.94 3.44 3.44 4.79 3.05 0.12 0.35 2.10 1,67 9.06 0.33 0.20 4.47 1.58 6.47 8.43 3.62 5.11 Fe 53 -121 -34 5 -5 0 4 3 89 -28 5 4 23 18 b.d. -12 -18 -3 b.d. 0 Mn 110.5 174.5 349.4 44.4 13.1 32.8 3.8 1.6 13.7 66.9 52.6 2.3 72,7 22.7 493.4 6.2 21.8 122.6 4.0 3.5 Al 1155 -20 -47 18 15 37 16 866 1797 55 136 22 978 1420 12 3 b.d. 2 6 3 except K, Na and Mg As 0.33 0.04 0.07 0.20 0.18 0.32 0.18 0.15 , 0.17 0.19 0.10 0.22 0.09 b.d. 0.16 0.34 0.13 0.53 0.36 0.32 Cd 0.102 0.084 0.303 0.040 3.925 2.813 0.866 6.719 3.691 85.122 0.300 0.028 0.254 0.183 9.282 0.321 0.042 0.298 0.491 0.727 in mmol/kg. Cr 0.54 0.30 0.31 0.63 0.28 0.10 0.14 0.04 0.07 0.42 0.02 0.37 0.34 0.25 0.40 -0.07 -0.08 0.04 -0.02 0.21 Cu 4.69 -7.90 2.91 2.48 1.27 3.63 8.59 1.76 2.12 n.d. 0.77 0.28 3.26 0.70 2.26 2.88 1.18 5.14 4.68 2.85 Ni 1.28 1.20 5.53 0.45 1.92 1.83 0.37 0.75 1.13 28.49 0.79 0.06 0.66 1.00 2.61 0.14 0.33 0.19 0.19 0.32 Pb 28.32 -1.04 -0.26 2.93 7.88 -0.30 -0.35 38.84 30.78 n.d. 112.52 0.14 7.64 ,^, 26.49 -0.63 -0.37 -0.21 -0.70 -0.59 -0.64 Zn, I4I4 4.2 i 33.2 14.5 762.9 532.7 7.5 299.2 107.9 ' .3245.8 24.6 3.1 55.4 169.4 142.8 13.0 4.8 31.8 '8.2 9.2 10 4^ n.d. = not determmed b.d. = below detection limit
73 « . o o •A 3 O 'O o o to
3.5 Partition coefflcients
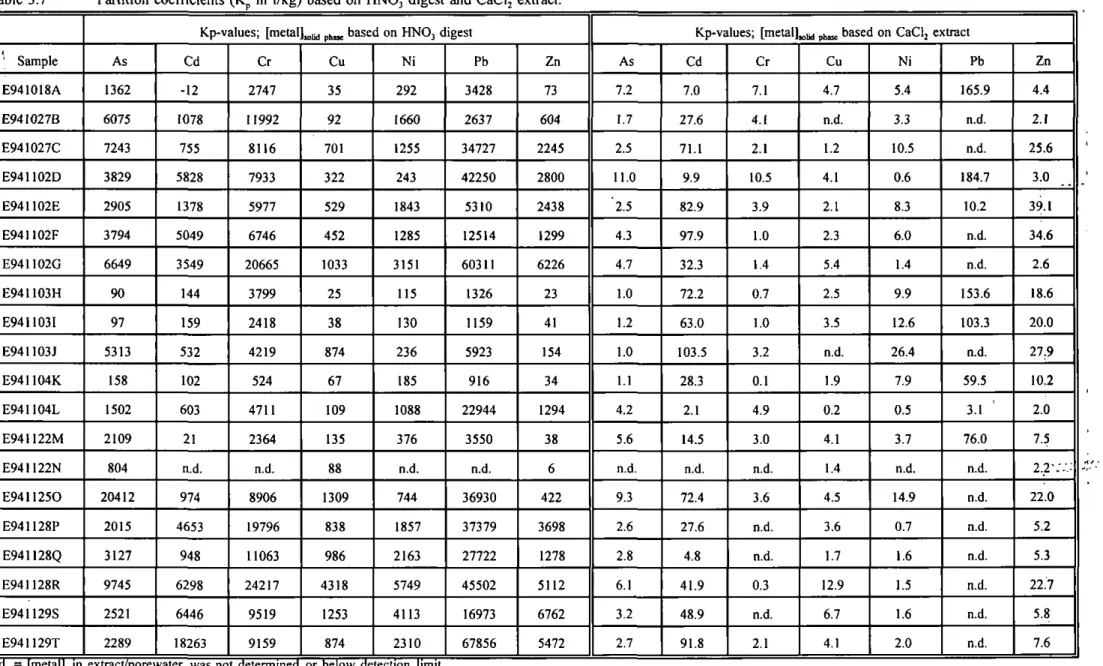
Field-based partition coefficients, Kp (equation I) were determined by calculating the ratio of the amount of a metal digested by HNO3 or 0.01MCaCl2 to the concentration in the pore water (Table 3.7). In certain instances, Kp values could not be calculated because [Metaljpo^g^^tp, was below the detection limit of the analytical technique employed and because in some cases some small negative values for [metal]soij(j p^^^ based on the CaClj extraction were obtained. For a given metal Kp varies significantly among samples and for a given sample Kp varies significantly among metals. Consistently higher Kp values were found with the concentrated HNO3 destruction than with the O.OIJW CaClj extraction.
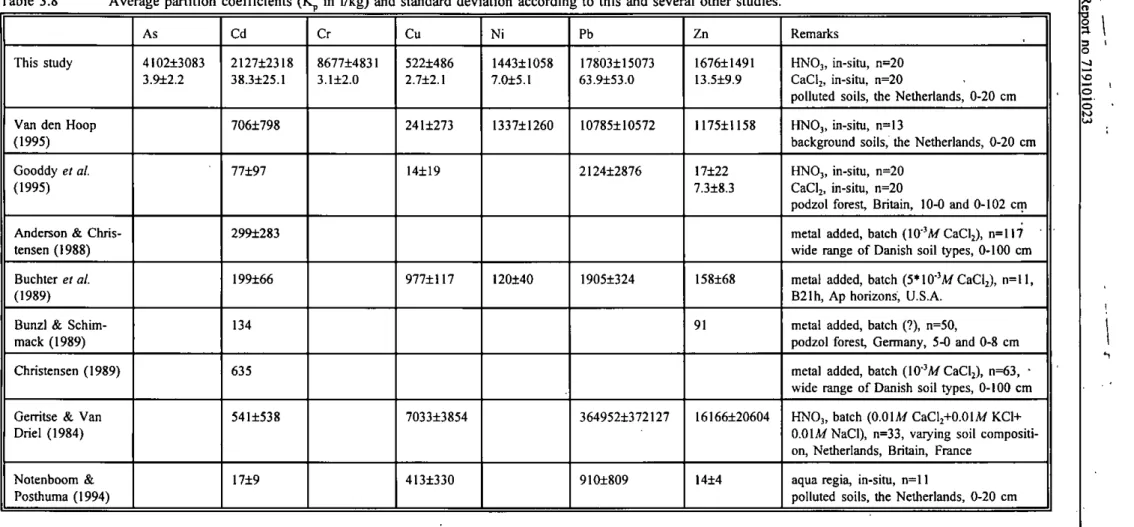
Table 3.8 summarizes average Kp values determined in this study and reported in or deduced from the literature. Standard deviations and experimental conditions are also shown. In three studies from the literature, in-situ Kp values were calculated based on metal concentrations in the pore water and in a HNO3 extract. For the other studies batch experiments were carried out. In general average Kp values measured in this study are higher than in other studies, except the study of Gerritse and Van Driel (1984). Differences in reported Kp values are probably due to the differences in soil types and in case of batch experiments by which extraction method the metal pore water concentrations were estimated. This indicates that one should be very careful in taking Kp values from the literature. The way the metal concentrations in the solid phase and pore water were determined, may influence the Kp in a great extent. Furthermore, the table shows that the standard deviations in Kp is approximately equal to its mean value. This is related to the variation in soil characteristics.
Table 3.7 1 ' Sample E941018A E941027B -E941027C E941102D E941102E E941I02F E941102G E941103H E9411031 ; E941103J E94I104K ' E94II04L E941I22M E941I22N E94II250 E941128P E941I28Q E941128R E941129S E941129T n.d. = ImetalJ in
Partition coefficients (Kp in l/kg) based on HNO3 digest and CaCl^ Kp-values; [metal As 1362 6075 7243 3829 2905 3794 6649 90 97 5313 158 1502 2109 804 20412 2015 3127 9745 2521 2289 extract/pore\ Cd -12 1078 755 5828 1378 5049 3549 144 159 532 102 603 21 n.d. 974 4653 948 6298 6446 18263 vater was no Cr 2747 11992 8116 7933 5977 6746 20665 3799 2418 4219 524 4711 2364 n.d. 8906 19796 11063 24217 9519 9159 t determined extract. «.lid ph>ie based on HNO3 digest
Cu 35 92 701 322 529 452 1033 25 38 874 67 109 135 88 1309 838 986 4318 1253 874 or below de Ni 292 1660 1255 243 1843 1285 3151 115 130 236 185 1088 376 n.d. 744 1857 2163 5749 4113 2310 tection limit Pb 3428 2637 34727 42250 5310 12514 60311 1326 1159 5923 916 22944 3550 n.d. 36930 37379 27722 45502 16973 67856 Zn 73 604 2245 2800 2438 1299 6226 23 41 154 34 1294 38 6 422 3698 1278 5112 6762 5472 As 7.2 1.7 2.5 11.0 '2.5 4.3 4.7 1.0 1.2 1.0 1.1 4.2 5.6 n.d. 9.3 2.6 2.8 6.1 3.2 2.7 Kp-values; [metal] Cd 7.0 27.6 71.1 9.9 82.9 97.9 32.3 72.2 63.0 103.5 28.3 2.1 14.5 n.d. 72.4 27.6 4.8 41.9 48.9 91.8 Cr 7.1 4.1 2.1 10.5 3.9 1.0 1.4 0.7 1.0 3.2 0.1 4.9 3.0 n.d. 3.6 n.d. n.d. 0.3 n.d. 2,1
uiid pimc based on CaCl^ extract Cu 4.7 n.d. 1.2 4.1 2.1 2.3 5,4 2.5 3.5 n.d. 1.9 0.2 4.1 1.4 4.5 3.6 1.7 12.9 6.7 4.1 Ni 5.4 3.3 10.5 0.6 8.3 6.0 1.4 9.9 12.6 26.4 7.9 0.5 3.7 n.d. 14.9 0.7 1.6 1.5 1.6 2.0 Pb 165.9 n.d. n.d. 184.7 10.2 n.d. n.d. 153.6 103.3 n.d. 59.5 3.1 76.0 n.d. n.d. n.d. n.d. n.d. n.d. n.d. Zn 4.4 2.1 25.6 3.0 39.1 34.6 2.6 18.6 20.0 27.9 10.2 2.0 7.5 2.2-:;; 22.0 5.2 5.3 22.7 5.8 7.6 to 0^ 73 D O 3 O O to
Table 3.8 Average partition coefficients (tC in l/kg) and standard deviation according to this and several other studies
This study
Van den Hoop (1995) Gooddy et al. (1995)
Anderson & Chris-tensen (1988) Buchter et al. (1989)
Bunzl & Schim-mack (1989) Christensen (1989)
Gerritse & Van Driel (1984) Notenboom & Posthuma (1994) As 4I02±3083 3.9±2.2 Cd 2127±2318 38.3±25.1 706±798 77±97 299±283 199±66 134 635 541±538 17±9 Cr 8677±4831 3.1 ±2.0 Cu 522±486 2.7±2.1 2411273 14±19 977±1I7 7033±3854 413±330 Ni 144311058 7.015.1 133711260 120140 Pb 17803115073 63.9153.0 10785110572 212412876 19051324 3649521372127 9101809 Zn 167611491 13.519.9 117511158 17122 7.318.3 158168 91 16166120604 1414 Remarks HNO3, in-situ, n=20 CaC!2, in-situ, n=20
polluted soils, the Netheriands, 0-20 cm HNO3, in-sim, n=13
background soils, the Netherlands, 0-20 cm HNO3, in-situ, n=20
CaClj, in-situ, n=20
podzol forest, Britain, 10-0 and 0-102 cm metal added, batch (lO'M CaCy, n=ll7 wide range of Danish soil types, 0-100 cm metal added, batch (5*I0-'A/CaCy, n=ll, B21h, Ap horizons, U.S.A.
metal added, batch (?), n=50,
podzol forest, Germany, 5-0 and 0-8 cm metal added, batch (lO'A/CaCy, n=63, • wide range of Danish soil types, 0-100 cm HNO3, batch (Q.OIM CaClj+O.OIW KC1+ O.OlA/NaCI), n=33, varying soil compositi-on, Netherlands, Britain, France
aqua regia, in-situ, n=l 1
polluted soils, the Netherlands, 0-20 cm HNO3, CaCl2, aqua regia=
metal added=
in-situ=
batch (..)= n=
[Metal]„ud ph3,j based on HNO3, CaCl2 and aqua regia digestion/extraction meta! not present in soil, added during experiment
[Metal]p„„ ^^^ determined in pore water
[Metallp^,^ ^.^ determined in extract after extraction of the air dried soil with the specified solution number of studied soils
a o 3 o O O to o ra to •o
page 28 of 35 Report no 719101023
3.6 Relation between partition coefficients and soil characteristics
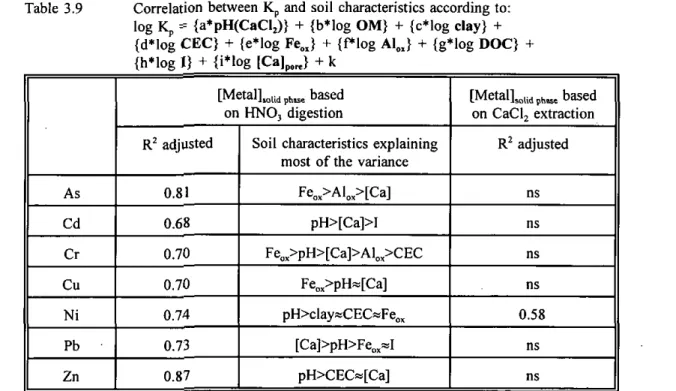
In paragraph 3.3 soil and pore water characteristics which may influence Kp values are mentioned. KpValues were related to these soil characteristics by PLS (section 2.6). Log Kp values for As, Cd, Cr, Cu, Ni, Pb and Zn based on [MetalJsoüj p,^g using the O.Ol M CaCl2 extraction and HNOg 'digestion," were correlated with log transformed solid phase and pore water characteristics, using PLS. The R^ values for each correlation and the percentage variance explained are shown in Table 3.9. In all cases one or two principal components explained most of the variance. Additional principal components contributed little to explain more variance. The PLS model is fairly successful in fltting observed data for solid phase metal concentrations using the HNO3 destruction: R^ values are relatively high, and vary from 0.68 for Cd to 0.87 for Zn. With the CaCl2 extraction, R^ values are not significant, except for Ni (R^ is 0.58). The poor R^ values observed for the CaClj extraction, suggest that Kp values based on this extraction method can not explain the variation in Kp values by taking into account the determined soil characteristics. One reason for this may be that CaCls is not successful in desorbing the studied metals from the adsorption phases. This is in line with the earlier observation for Ni and Zn that the amount of metal extracted by O.OIM CaCl2 correspond with metal pore water concentrations. The latter observation also suggests that Kp values for Ni and Zn can also be calculated as the ratio of the amount of metal digested by HNO3 to the amoimt of metal extracted by O.OlMCaCls. Correlation of these Kp values with the studied soil characteristics obtained slightiy lower R^ values for Zn (R^ is 0.85) and Ni (R^ is 0.59) compared to calculated Kp values based on metal pore water concentrations. On the basis of the high R^ values obtained, the relation between Kp and soil characteristics can best be studied based on metal pore water concentrations and HNO3 as an agent for estimating [metal],„iidph^,.
Table 3.9 Correlation between Kp and soil characteristics according to: log Kp = {a*pH(CaClj)} + {b*log OM} + {c*log clay} + {d*log CËC} + {e*log Fe„} + {Plog Al„} + {g*log DOC} + {h*log Ï} + {i*log [Calp,^} + k
As Cd Cr Cu Ni Pb Zn
[Metalh„,id ph^e based on HNO3 digestion R^ adjusted 0.81 0.68 0.70 0.70 0.74 0.73 0.87
Soil characteristics explaining most of the variance
Fe,,>Al„,>[Ca] pH>[Ca]>I Fe,,>pH>[Ca]>Al,,>CEC Fe„,>pH«[Ca] pH>clay«CECaFeo^ [Ca]>pH>Fe„,«I pH>CEC«[Ca] [MetalL^iid ph3,, based on CaClj extraction R^ adjusted ns ns ns ns 0.58 ns ns ns= not significant (P<0.05)
In case Kp values are predicted by considering all studied soil characteristics from Table 3.9, many characteristics must be specified for each soil considered. Preferred is a simple relationship with a few soil characteristics which are easily obtainable. The most important soil characteristics controlling partitioning should be included in the model. The relative significance of soil characteristics in relation to variation in Kp values, as calculated by PLS, are shown in Table 3.9 and ranked according to their influence on Kp. It was obtained that pH explained a high percentage of the variation in Kp values for nearly all metals. Other researchers reported similar results (Anderson and Christensen, 1988; Buchter et a l , 1989). This can be explained by the fact that H"" ions compete for binding sites. Further, the soil pH affects the surface charge and is important in regulating metal speciation in the pore water.
Fe^^ content is another important soil characteristic to explain the variation in Kp. The results of our experiments demonstrate that Fe plays an important role in metal partitioning. On weight base Fe is, as compared to other phases, not a very important adsorption phase. If one assumes that Fe is present as Fe203, the content ranges from 0.1 to 2.37 % with a mean of 1.0 %. The OM content ranges from 2.9 to 21.8 % (mean 6.7 %) and the clay content fi-om 0.8 to 33.8 % (mean 9.7 %) (all percentages in w/w). This shows that the metal hydroxides competed effectively for binding metals and that the available sorption siteson amorphous Fe hydroxide are highly favourable for metal ions. Another explanation may be that Fe blocks adsorption processes onto other adsorption phases by forming surface coatings on soil particles. For As and Cr both metal hydroxides are important. This agrees with observations made by Sposito (1984), and is probably due to the normally negative charge of As and Cr ions in pore waters.
The Ca concentration in the pore water is also an important soil characteristic. This can be explained by the fact that Ca is the predominant cation in the pore waters and may compete effectively for sorption sites (Chardon, 1984), governing the soluble stage of trace metals in soils (Kabata-Pendias and Wi^cek, 1986). Other important soil characteristics explaining the variation in Kp are I, CEC and clay. An-unexpected result is the absence of a significant effect from OM and DOC, indicating that OM and DOC did not compete effectively for binding metals. This could become more important for soils with relatively low pH values, because metal binding to OM is relatively important at low pH values, whereas metal binding to metal hydroxides is nearly absent.
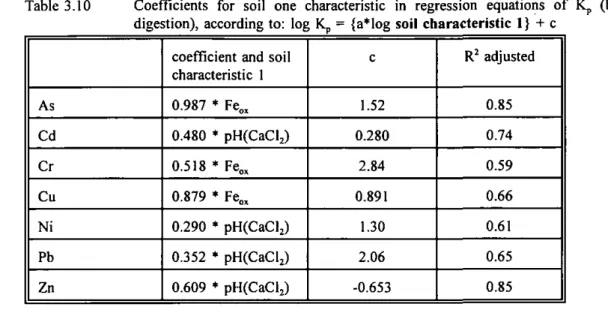
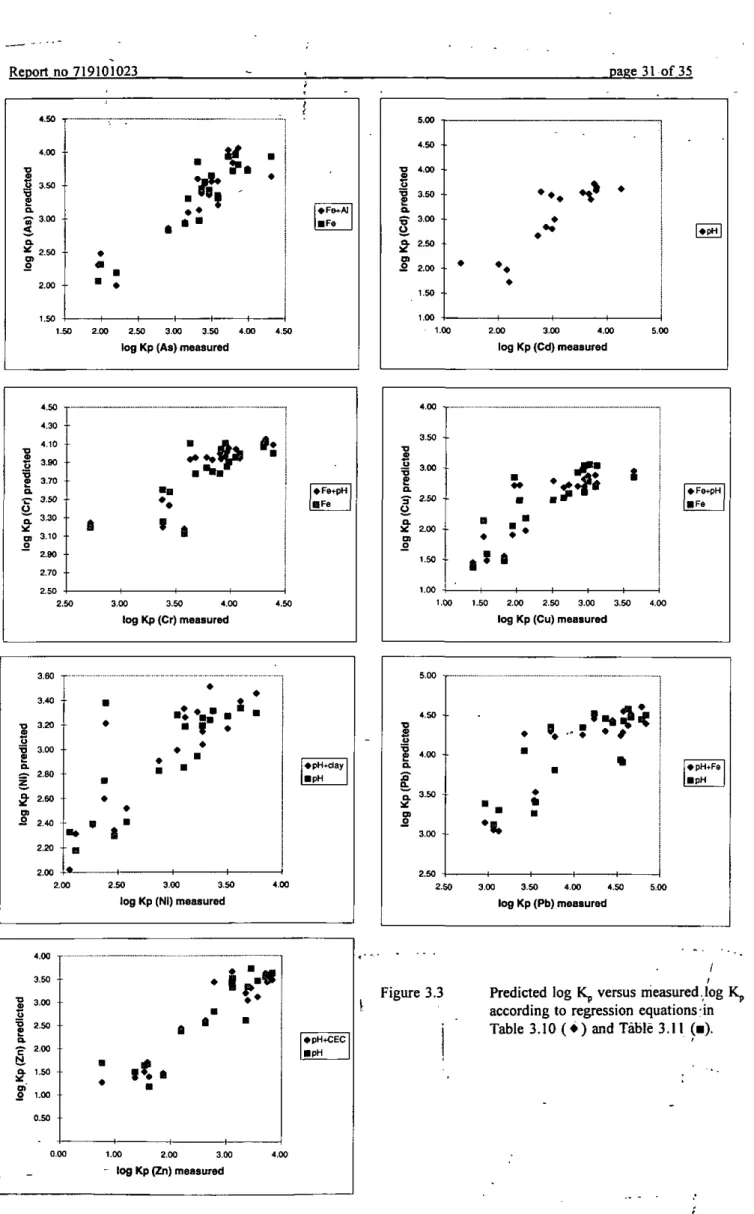
For a practice-based approach, a regression equation to predict Kp values should include soil characteristics explaining most of the variation in Kp. Soil characteristics to be introduced in the regression equation should be easily obtainable. Pore water characteristics, except pH, are therefore not preferable. One soil characteristic explained already a high percentage of the variance for all metals. The coefficients for soil characteristics in regression equations of log Kp are listed in Table 3.10, together with the R^ values for each regression model. Two soil characteristics explained some more variation in Kp, adding a third one gained only a marginal improvement of the model. The coefficients for two soil characteristics in regression equations of log Kp are listed in Table 3.11, together with R^ values for each regression model. R^ values in Table 3.10 were calculated with multiple linear regression, since only one soil characteristic was taken into account. Since pH and Fe content are correlated, R^ values in Table 3.11 were calculated with PLS which is not sensitive for correlation between the descriptors (chapter 2.6). However, this makes it difficult to compare R^ values from Tables 3.10 and 3.11 as the R^ values for As show. Figure 3.3 shows the correlation between experimental and predicted log Kp values according to regression equations containing one or two soil characteristics. The figure shows that a slight
page 30 of 35 Report no 719101023 Table 3.10 Coefficients for soil one characteristic in regression equations of Kp (based on HNO3
digestion), according to: log Kp = {a*log soil characteristic 1} + c
As Cd Cr Cu Ni Pb Zn
coefficient and soil characteristic 1 0.987 * Fe„ 0.480 • pH(CaCl2) 0.518 * Fe.,, 0.879 * Fe„, 0.290 * pH(CaCl2) 0.352 * pH(CaCl2) 0.609 * pH(CaCtj) c 1.52 0.280 2.84 0.891 1.30 2.06 -0.653 R^ adjusted 0.85 0.74 0.59 0.66 0.61 0.65 0.85 (P<0.05)
Table 3.11 Coefficients for tvv-o soil characteristics in regression equations of Kp (based on HNO3 digestion), according to: log Kp = {a* log soil characteristic 1} + {b*log soil characteristic 2} + c As Cd Cr Cu Ni Pb Zn
coefficient and soil characteristic 1 0.547 * Fe„, 0.480 * pH(CaCl2) 0.308 * Fe„, 0.511 *Fe„, 0.179 *pH(CaCl2) 0.203 * pH(CaCl2) 0.340 * pH(CaCl2)
coefficient and soil characteristic 2 0.782 * Al„, -0.118 *pH(CaCl2) 0.190 *pH(CaCl2) 0.605 * clay 0.474 * Fe„ l.l I *CEC c 1.20 0.280 2.59 0.502 1.45 2.06 -0.295 R^ adjusted 0.80 0.74 0.67 0.71 0.74 0.72 0.87 (P<0.05)
improvement of the regression models is obtained when two soil characteristics are used. A closer inspection of the table 3.11 shows that the calculated proton coefficient is different per metal, indicating that the influence of pH on Kp values changes per metal. Kp values for Cd and Cu will especially be sensitive in pH fluctuations. The proton coefficient for Cd has also been calculated in several other studies (Chardon, 1984; Christensen, 1989; Boekhold, 1992). They found a coefficient which was in the same order as found in this study, namely 0.5.
In the present approach in which the solid phase metal concentrations are determined based upon the concentrated HNO3 destruction, the Kp values correlated reasonably well with the studied soil characteristics. The studied soil characteristics accounted for most of the variation in Kp values. Other factors are involved in explaining the remaining variation. One
4.30 4.10 ? O 3.70 a. T 3-50 O - 3,30 D) 3.10 O 2.90 2.70 • -• • • _ É " A^.
^ ^ 9 i
m V ^ • B • • ' •tf«
I • • Fe+pH BFe 3.00 3.50 4.00 l o g K p (Or) m e a s u r e d 3.60 -• 3.40 •• 3.20 3.00 •• 2.80 2.60 2.40 • 2.20 2.00 V • : • • > •-• r -•
• «pH-fday • pH 2.00 2,50 3.00 3.50 l o g K p (Nl) m e a s u r e d 4,00 1 3.50 1 3.00 o 1 2.50 a •£• 2.00 H £ • 1-50 • at' o 1.00 0.50 0.( " • K] 1.00 2.00 3.00 4,C ' log Kp (Zn) measured K) • p H ^ E C • pH 4,50 4,00 3,50 • 3,00 2.S0 2.00 1,50 • 1,00 • • _ • • • •• *n»
• [ ^ ^ 1.00 2.00 3.00 4.00 l o g K p ( C d ) m e a s u r e d 3,50 -• a o g K p (Cu ) predi c 8 S 8 1.50 • 1.00 -1.C . « » 1.50 m m ^ M ft • Fo-fpH NFe 2,00 2,50 3,00 3,50 4,00 log Kp (Cu) measured4,50 4,00 -3.50 • 3.00 • 2.50 • • « •8» i — • • ft • ^
K
m:'??
« • pH-fFe • pH 2,S0 3,00 3,50 4,00 4,50 l o g K p ( P b ) m e a s u r e dFigure 3.3 Predicted log Kp versus measured.log Kp according to regression equations;in Table 3.10 ( • ) and Table 3.11 (•).
page 32 of 35 Report no 719101023 ^ " ^ z lo g K p (Cd ) pre c 8 8 8 0,00 -o
•X
o A n» • 0 1 1 • This study O Hoop & Gooddy 2 3 4 l o g K p ( C d ) m e a s u r e d 3,50 -£ | 3 , 0 0 -Q. = • 2,50 Z 5 " 2,00 • O) o 1,50 • 1,00 -• O H 1» • • o • • • • « T h i s Study O Hoop 1,00 1,50 2,00 2.50 3.00 3.50 4.00 l o g K p ( N i ) m e a s u r e d o . 1 -.•4,00--i 3,00 i 2,00 i ^ - -0,00^•
?«-r
o o * ^ * c* 0 A & ^ ^ È \ 1 1 1 • This Study O Hoop &Gootkfy -1.00 0,00 1,00 2.00 3.00 log Kp (Zn) measured 4,00 u -4,00 3.50 3.00 2.50 2.00>- • liSOi--l.OO x ' 0.50 -o & o _ o o ° • This study O Hoop A Gooddy • • -1,00 0,00 1,00 2.00 3,00log Kp (Cu) measured
5,00 T S 4.00 o . •S- 3.00 + 0> 2,00 + O 1,00 o» o
^ J ^ *
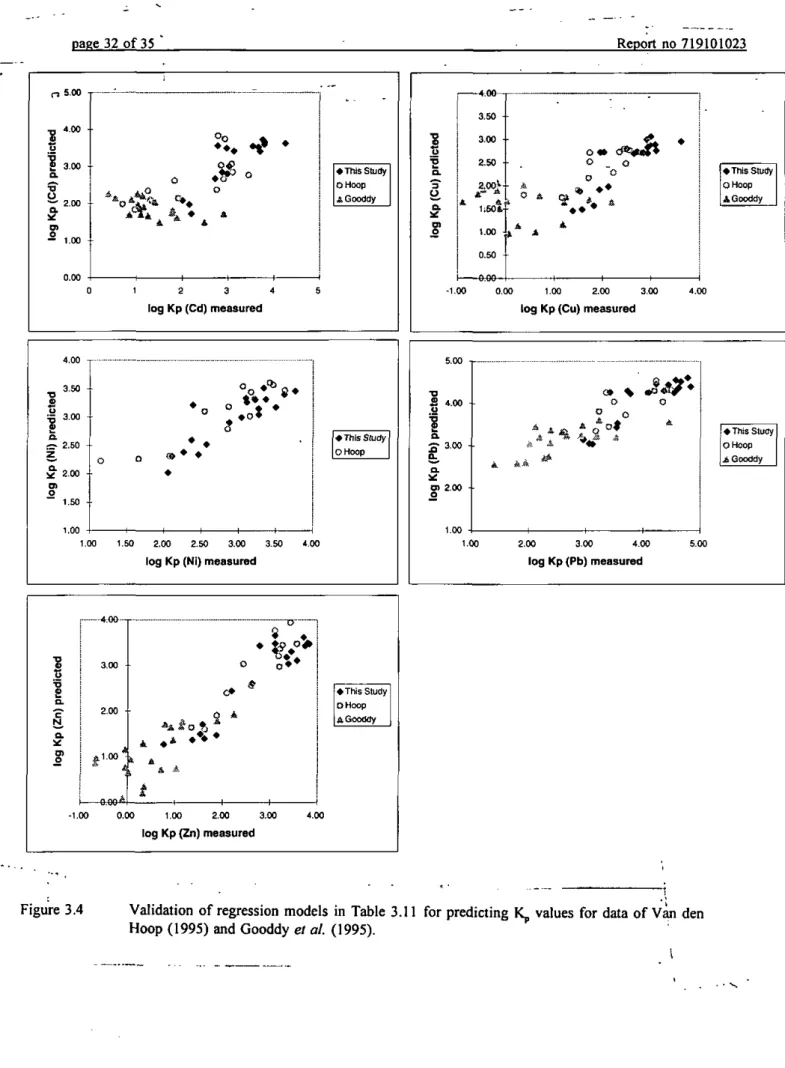
« This Study O Hoop jiQooddy 1.00 2,00 3,00 4.00 l o g K p ( P b ) m e a s u r e d 5-00Figure 3.4 Validation of regression models in Table 3.11 for predicting K^ values for data of Van den Hoop (1995) and Gooddy et al. (1995).
of these factors may be that the characterization of reactive surfaces in soils as metal hydroxides and organic matter is not unequivocal. Using the standard analyzing methods for some soil characteristics only an estimate of the presence of the adsorption phases is given and not necessarily good estimators for the various types of reactive surfaces present (Van Riemsdijk and Hiemstra, 1993). Another factor may be that metal present in the solid phase other than adsorbed metal, i.e. precipitates and metals incorporated in the mineral lattice, will dissolve during the HNO3 destruction. Metals from these phases will also contribute to [Metal]soiid phase and this is not taken into account in the present modelling approach. Brumbaugh et al. (1994) showed by sequential extractions of some sediments contaminated with heavy metals, that the amount of metals present in the residual fraction, which is assimied to be present in the mineral lattice, ranges from several percentages for Cd to 40 % for Pb. Pretorius et al. (1995) showed via chemical equilibrium modelling that precipitates may be present in soil systems. Further research may take these complicating factors into account, e.g. with moderate, metal specific extraction agents.
We have applied the regression models for some metals in Table 3.10 to predict Kp, to data of Van den Hoop (1995) and Gooddy et al. (1995) (Figure 3.4). Botii studies give field-based Kp values, pH(CaCl2), Fe^^ content, CEC and clay content for soils in the Netherlands and Britain. Field-based K^ values were determined by calculating the ratio of the amount of metal digested by concentrated HNO3 (Van den Hoop, 1995) or 0.43M HNO3 (Gooddy et al., 1995), to the concentration metal in the pore water. Predicted log Kp values for the data set of Van den Hoop (1995) are in reasonable agreement with the measured Kp values. Predicted log Kp values for this data set were within 1.5 order of magnitude of the observed log Kp values; mean and standard deviation for Cd was 0.61+0.05; for Cu: 0.47+0.04; forNi: 0.33+0.03; for Pb: 0.30±0.02 and for Zn: 0.39±0.03. Van den Hoop (1995) studied partitioning of heavy metals at background levels. Since no pronounced difference can be distinguished between predicted Kp values according to this study and the study of Van den Hoop (1995), it may be concluded that the regression models are also valid for soils with heavy metals at background levels. Predicted log Kp values for the data set of Gooddy et al. (1995) were less acciarate, probably because the pH(CaCl2) of the sampled soils were very low and ranged from 2.5 to 4.1. At these low pH values sorption of heavy metal ions onto organic matter becomes relatively more important, which is not accounted for in our models.
4. Conclusions
Based on in-situ determination of partition coefficients, Kp values, for As, Cd, Cr, Cu, Ni, Pb and Zn, of 20 Dutch soils it is concluded that:
Kp values varied highly with metal and soil type.
Kp values based on the CaCl2 extract were poorly correlated to soil and pore water characteristics. Kp values based on the HNO3 destruate correlated well to the same characteristics.
pH and amorf Fe content were the most influential factors in the partitioning of metals. Clay content, Al content, CEC and Ca concentration in the pore water were also significant.
Kp values for As, Cr and Cu correlated rather well with Fe content, whereas Cd, Ni, Pb and Zn correlated rather well with pH(CaCl2). Introducing a second soil characteristic improved the correlation and explained most of the variation in Kp.