Traffic emissions of elemental
carbon (EC) and organic carbon
(OC)and their contribution to
PM
2.5
and PM
10
urban background
concentrations
In the Netherlands Research Programme on Particulate Matter (BOP), the
contribution of elemental (EC) and organic carbon (OC) to urban background
concentrations of PM
2.5and PM
10has been studied. The increment of EC and
OC in urban background concentrations was concluded to be mainly related to
road traffic emissions. The annual total contribution was 0.5 µg/m
3. Considering
average urban background concentrations of PM
2.5and PM
10, it was concluded
that the potential for reducing urban background concentrations by reducing
exhaust emissions from road traffic would be less than 5%.
This study is a BOP publication produced under the auspices of TNO and ECN.
The Netherlands Research Program on Particulate Matter (BOP) is a national
program on PM
10
and PM
2.5
. It is a framework of cooperation involving
the Energy Research Centre of the Netherlands (ECN), the Netherlands
Environmental Assessment Agency (PBL), the Environment and Safety Division
of the National Institute for Public Health and the Environment (RIVM) and
TNO Built Environment and Geosciences.
BOP report
Traffic emissions of elemental carbon
(EC) and organic carbon (OC)
and their contribution to PM
2.5
and PM
10
urban background concentrations
Traffic emissions of elemental carbon (EC) and organic carbon (OC) and their contribution to PM2.5 and PM10 urban background concentrations
This is a publication of the Netherlands Research Program on Particulate Matter Report 500099011
M. P. Keuken, H.M. ten Brink Contact: karin.vandoremalen@pbl.nl ISSN: 1875-2322 (print) ISSN: 1875-2314 (on line) This is a publication in the series: BOP reports Project assistant: Karin van Doremalen English editing: Annemarieke Righart
Figure editing: PBL editing and production team Layout and design: RIVM editing and production team Cover design: Ed Buijsman (photographer: Sandsun) ECN Energy Research Centre of the Netherlands PBL Netherlands Environmental Assessment Agency TNO Built Environment and Geosciences
RIVM National Institute for Public Health and the Environment
This study has been conducted under the auspices of the Netherlands Research Program on Particulate Matter (BOP), a national program on PM10 and PM2.5 funded by the Dutch Minis-try of Housing, Spatial Planning and the Environment (VROM).
Parts of this publication may be reproduced provided that reference is made to the source. A comprehensive reference to the report reads as ‘ Keuken M.P., Ten Brink H.M. (2009) Traffic emissions of elemental carbon (EC) and organic carbon (OC) and their contribution to PM2.5 and PM10 urban background concentrations ’:
The complete publication, can be downloaded from the website www.pbl.nl, or a copy may be requested from reports@pbl.nl, citing the PBL publication number.
Netherlands Environmental Assessment Agency, (PBL) P.O. BOX 303, 3720 AH Bilthoven, the Netherlands; Tel: +31-30-274 274 5;
Fax: +31-30-274 4479; www.pbl.nl/en
Rapport in het kort 5
Rapport in het kort
In het Nederlandse Beleidsondersteunend Programma Fijnstof (BOP) is onderzoek uitgevoerd naar de bijdrage van elementair koolstof (EC) en organisch koolstof (OC) aan de
stedelijke achtergrond van PM2.5 en PM10. Hieruit is
geconclu-deerd dat de toename van EC en OC in de stedelijke achter-grond het gevolg is van verkeersemissies. Deze
jaargemid-delde toename is in de orde van 0.5 µg/m3. Rekeninghoudend
met de gemiddelde jaarlijkse concentratie van PM2.5 en PM10
is het potentieel om de stedelijke achtergrond te reduceren door het terugdringen van uitlaatemissies van autoverkeer minder dan 5%.
Contents 7
Contents
Rapport in het kort
5 Executive summary 9 1 Introduction 11 1.1 Background 11 1.2 Objectives 11
2 Methodology and results
13
2.1 EC and OC and black smoke measurements 13 2.1.1 EC and OC measurements 13
2.1.2 Black smoke measurements 13
2.2 Monitoring EC, OC and Black Smoke in 2006 and 2007, and Black Smoke from 1989 to 2006 13 2.2.1 Monitoring locations for EC, OC and black smoke in 2006 and 2007 13
2.2.2 Regional-urban-street gradient of EC and OC, in 2006 and 2007 15 2.2.3 Correlation between black smoke, EC and OC, in 2006 and 2007 17 2.2.4 BS trend as proxy for EC trend from 1989 to 2006 18
2.3 Monitoring EC, OC and Black Smoke, in March 2008 19
2.3.1 Monitoring locations for EC, OC and Black Smoke, in March 2008 19 2.3.2 Spatial variability of EC in Rotterdam, in March 2008 19
2.4 EC and OC emission factors for urban traffic (September to October 2008) 21 2.4.1 Monitoring locations (September to October 2008) 21
2.4.2 Traffic intensity near the street location 22 2.4.3 Monitoring data on EC and OC (October 2008) 22 2.4.4 Establishing the EC emission factor 22
2.4.5 Concentration map of EC for Rotterdam 24
2.5 The contribution of EC and OC to urban background concentrations 26
3 Conclusions and recommendations
29
Annex 1 EC and OC analysis of filter samples in BOP
31
Annex 2 Automatic EC and OC monitor
32
Annex 3 Data input for inverse modelling emission factor EC
33 References 34 Acknowledgement 35
Executive summary 9
The Netherlands Research Program on Particulate Matter
(BOP) is a national programme on PM2.5 and PM10, funded by
the Netherlands Ministry of Housing, Spatial Planning and the Environment (VROM), and implemented by TNO, the Energy Research Centre of the Netherlands (ECN), the National Insti-tute for Public Health and the Environment (RIVM) and the Netherlands Environmental Assessment Agency (PBL). The programme aims to reduce uncertainties regarding concen-tration levels of particulate matter (PM), and to gain a better insight into the different sources which contribute to PM concentrations in ambient air. BOP started in February 2007 and was finalized in March 2009.
One of the aspects studied in the BOP programme is the con-tribution of elemental carbon (EC) and organic carbon (OC)
to the urban background concentrations of PM2.5 and PM10.
Knowledge about anthropogenic sources controlling the com-position and urban background concentrations of especially
PM2.5 is important, as under the new EU Air Quality Directive,
there is a requirement to reduce the urban background
con-centrations of PM2.5 in 2020 against 2010. Reduction in road
traffic emissions of EC and OC, potentially, may be important
for reducing urban background concentrations of PM2.5.
Presently, there is a gap in knowledge on 1) the increment in EC and OC in urban background concentrations, compared to those in regional background concentrations, and 2) EC and OC emission factors for urban traffic, to model the contribu-tion from urban traffic to EC and OC concentracontribu-tions. Research carried out in this part of the BOP programme has the following objectives:
to determine the increment in EC and OC concentrations, 1.
from the regional to the urban background, the so-called “urban increment”;
to establish EC and OC emission factors for urban traffic, 2.
and
to estimate the contribution of traffic-related EC and OC to 3.
urban background concentrations of PM.
Specific research on EC and OC was performed in the Rotter-dam-Rijnmond area, in three monitoring campaigns: the first campaign, held in 2006 to 2007, was directed at identifying urban sources contributing to EC, and looked at the trend for black smoke (BS) at urban background locations, between 1989 and 2006; the second campaign, in March 2008, was directed at the regional/urban/street increment in EC, and the third campaign, in Oktober 2008, at establishing EC and OC emission factors for urban traffic. Furthermore, this report
presents EC and OC data from the monitoring campaign in the BOP research programme, in 2007 and 2008.
The main findings and conclusions from this study are sum-marised as follows:
EC; The annual regional background concentration of EC
was 2.1 ± 1.2 µg C/m3, and the annual urban increment was
0.3 ± 0.2 µg C/m3 (BOP). The annual average EC
concen-tration at heavy-traffic inner-urban roads was 4 ± 2.2µg C/
m3 (BOP). The study in Rotterdam indicated that other
sources than road traffic, such as industry, refineries, avi-ation and shipping, did not contribute significantly to the urban background concentrations of EC;
OC; The annual regional background concentration of OC
was 1.6 ± 0.5 µg C/m3, and the annual urban increment
was 0.1 ± 0.2 µg C/m3 (BOP). Thus, the urban background
concentration was not significantly elevated against that of the regional background. The annual average OC concentration at heavy-traffic inner-urban roads was 1.9
± 0.8 µg C/m3 (BOP). These results illustrate that urban
and street OC concentrations were mainly controlled by regional OC background concentrations. The regional level was controlled by primary emissions (e.g. combus-tion processes) and secondary organic aerosol. The latter was attributed to biogenic precursors, such as terpenes released by vegetation and photochemical ageing of diesel engine emissions. The contributions to OC from biogenic and combustion sources was estimated at 60% and 40%, respectively [Harrison, 2008]. The study in Rotterdam indicated no significant increment in OC at the traffic locati-ons, contrary to at the urban background locations. Other urban sources, such as industry, refineries, aviation and shipping, also did not significantly contribute to the urban background concentration of OC;
Contribution of EC and OC emissions from road traffic to
urban background concentrations of PM2.5 and PM10; From the
study in Rotterdam could be concluded that the increment in EC and OC at the urban background locations was mainly related to road-traffic emissions. To compute the
contribu-tion of OC to the PM2.5 and PM10 background
concentrati-ons, OC was expressed as the mass of organic compounds ‘OCom’. This was performed by multiplying OC by a factor of 1.6 [Bae, 2006]. For the urban increment in OC, in the Netherlands, this resulted in a contribution of organic
com-pounds of 0.2 µg/m3 to PM
2.5 and PM10. Consequently, the
contribution of EC and OCom emissions from road traffic
to the urban background concentrations of PM2.5 and
PM10 was 0.3 (EC) plus 0.2 (OCom), which is 0.5 µg/m3. The
average urban background concentrations of PM2.5 and
PM10, in the Netherlands, were in the range of 15 to 20 and
20 to 30 µg/m3, respectively (BOP). It was concluded, that
the potential for reducing urban background concentrations of
PM2.5 and PM10 by reducing exhaust emissions from road traffic,
would be less than 5%;
EC as traffic-related PM indicator; The hourly increments in EC at street locations compared to urban background loca-tions – measured by automated monitors in Rotterdam – were in good agreement with the traffic intensity during weekdays and weekends. The EC emission factor for urban traffic was established at 10 mg C/km, which is at the low end of the range of values 8 to 20 mg C/km presented in the literature. For OC, no increment could be measured and, thus, no emission factor for OC was established. In the literature, a ratio of 4:1 is indicated for EC and OC in road-traffic emissions [Harrison, 2008], which, in our study in Rotterdam, would have resulted in an increment below the detection limit of the monitoring method. This indica-ted that traffic emissions of EC and OC were dominaindica-ted by EC, which is in agreement with the BOP results for the Netherlands, in this report. Subsequently, an annual EC concentration map for Rotterdam was modelled, by using the dispersion model ‘URBIS’. The modelled contrast between EC concentrations near heavy road-traffic and at
background locations, was much higher than that for PM2.5
and PM10. This confirms, that EC is a sensitive indicator for
the dispersion of traffic-related PM emissions;
Black Smoke (BS) as proxy for EC trend; The results for Rot-terdam confirmed the results from earlier studies, that BS measurements – presented in optical units without
con-version to mass units – have a linear correlation with EC (R2
=F 0.93), but not with OC. Both BS and EC reflect the contri-bution of (incomplete) combustion emissions to PM. From measurements of BS at an urban background location in Rotterdam and a regional location, in the period from 1989 to 2006 – as a proxy for EC concentrations – could be concluded that EC concentrations, especially those after 2001, have been decreasing significantly, by 5% per year. This shows the impact from cleaner vehicles on urban air
quality. When using PM10 as an indicator for air quality, this
trend could not be detected. Differences in road-traffic composition, and other local factors, would have to be considered before the results from Rotterdam could be generalised for the Netherlands as a whole;
Note on the EC and OC measurements; Major problems in research on EC and OC are the lack of an agreed standar-dised analytical procedure, and the uncertainty about the artefacts that occur by adsorption of volatile OC com-pounds to filters. The use of field blanks for correction is the approach used here to correct for the artefact, but this approach should be further supported. Two analy-tical methods are widely applied to determine EC and OC: the ‘Sunset method’ and the ‘Cachier method’. The BOP programme applied a method developed by ECN, based on the Cachier method, to measure the average annual EC and OC at street, urban and regional locations in the Netherlands [ten Brink et al, in preparation]. In the study in Rotterdam on the EC and OC contributions from traffic, the Sunset method was used, as well as automated methods for hourly measurements of EC and OC. From a comparison of filters that were collected in the BOP
programme, it was concluded that results from the Sunset method, systematically, were lower by a factor of 0.4 for EC, compared to those from the Cachier method. The field
blank for OC, in BOP, was 1.2 µg C/m3, while, in Rotterdam,
the field blank was 0.7 µg C/m3. The relevant results for OC
were corrected in accordance to the field blanks. In the findings and conclusions is indicated whether the results refer to the Cachier analysis (‘BOP’) or the Sunset analysis (‘Rotterdam’). Because of the fact that the Cachier method measures a higher EC content also differences in EC are more pronounced in this method as compared with the Sunset approach.
It is recommended to :
develop, improve and standardise sampling and analy-–
tical procedures for monitoring EC and OC ambient air concentrations and
perform more research on EC as an indicator for traffic-–
Introduction 11
Background
1.1
This study was conducted under the auspices of the Neth-erlands Research Program on Particulate Matter (BOP),
a national programme on PM10 and PM2.5, funded by the
Netherlands Ministry of Housing, Spatial planning and the Environment (VROM). The programme is a framework of cooperation, involving four Dutch institutes: the Energy Research Centre of the Netherlands (ECN), the Netherlands Environmental Assessment Agency (PBL), the Environment and Safety Division of the National Institute for Public Health and the Environment (RIVM), and the Netherlands Research Organisation (TNO).
The goal of BOP is to reduce uncertainties about particulate matter (PM) and the number of policy dilemmas, which com-plicate development and implementation of adequate policy measures. Uncertainties concerning health aspects of PM are not explicitly addressed.
These objectives are approached through the integration of
mass and composition measurements of PM10 and PM2.5,
emis-sion studies and model development. In addition, dedicated measurement campaigns have been conducted to research specific PM topics.
The results from the BOP research programme are published in a special series of reports. The general subjects in this series are: sea salt, mineral dust, secondary inorganic aerosol, elemental carbon and organic carbon (EC and OC), and mass closure and source apportionment. Some BOP reports concern specific PM topics: urban background concentra-tions, PM trends, shipping emissions, EC and OC emissions from traffic (this report), and the attainability of PM2.5
stand-ards. Technical details of the research programme are con-densed in two background documents; one on measurements and one on model developments. In addition, all results are combined in a special summary for policymakers.
The urban background concentration of PM consists of 1) a regional background concentration which depends on the contributions from large-scale transport of pollutants, and 2) a contribution from urban sources. Presently, there is a lack of knowledge on 1) the increment in EC and OC at urban background locations, compared to that at the regional background locations, 2) the impact from local combustions sources (e.g. shipping, industries and road traffic) on urban background concentrations of EC and OC, and 3) EC and OC
emission factors for urban traffic, to model its contribution to EC and OC concentrations.
In general, EC is emitted from incomplete combustion of fossil fuels and natural fires. OC originates from a wide range of sources, including combustion processes, re-suspension of road dust and secondary organic aerosol. Secondary OC origi-nates from biogenic precursors, such as terpenes released by vegetation and photochemical ageing of diesel engine emis-sions. The ratio between biogenic and combustion sources of OC is estimated at 60% to 40% [Harrison, 2008]. The sum of EC and OC emissions from combustion processes is known as ‘soot’.
A study on these EC and OC aspects has been carried out on the city of Rotterdam, by ECN and TNO, supported by the Environmental Protection Agency Rijnmond (DCMR) and RIVM. Prior to this study, TNO performed research, in cooper-ation with DCMR, on EC and black smoke (BS) in Rotterdam, in 2006 and 2007, the results of which are also presented in this report.
Objectives
1.2
The study carried out in this part of the BOP Programme has the following objectives:
to determine the increment in EC and OC concentrations, 1.
from the regional to the urban background;
to establish EC and OC emission factors for urban traffic, 2.
and
to estimate the contribution of traffic-related EC and OC to 3.
the urban background concentrations of PM.
Methodology and results 13
EC and OC and black smoke measurements
2.1
EC and OC measurements 2.1.1
The content of carbonaceous material in PM can be distin-guished in elemental carbon (EC) and organic carbon (OC), which are defined according to analytical method. Quite often, the terms EC and ‘black carbon’ (BC) or ‘black smoke’ (BS) are also mixed. The terms BC and BS are used when optical methods are applied to quantify the light-absorbing fraction of PM, while the term EC is used when thermal methods have been applied for distinguishing EC and OC. The total carbon content of PM shows good agreement between various methods, but large uncertainties are encountered for the ratio between EC and OC. This is attrib-uted to artefacts associated with sampling of OC, especially adsorption of volatile OC (also in field blanks) and analytical difficulties of separating EC from OC. At present, the most widely applied methods for analysing EC and OC are the thermal methods. These methods are based on heating the sampled filter in a non-oxidising environment (e.g. helium atmosphere) to measure OC, followed by heating the filter in an oxidised environment (e.g. oxygen atmosphere) to measure EC. During the heating of the filter for the OC analy-sis, artificial EC is generated and, if not accounted for, this will positively bias the ‘true’ EC of the sample. Basically, two types of thermal methods were applied: the Sunset method and the Cachier method [Chow, 1993]. The former method resulted in lower EC and higher OC than the latter. Lower values for EC in the Sunset method related to the thermal-optical correction for the artificially generated EC, which was not corrected for in the Cachier method.
Currently, there is no consensus within the scientific commu-nity on how to sample OC while taking artefacts into account; neither of the above-mentioned analytical methods should be applied to quantify EC and OC. Within the EU-funded project EUSAAR (European Supersite for Atmospheric Aerosol Research), a unified protocol for sampling and analysing EC and OC is being developed. Also, the Commission of European Stand-ardisation prepares a protocol for EC and OC measurements, for which the Sunset method is likely to be adopted.
In the BOP programme, EC and OC were analysed by using a method developed at ECN, based on the Cachier method,
while in the Rotterdam study the Sunset method was applied. To derive EC and OC emission factors for urban traffic, auto-matic monitoring on an hourly basis was applied in Rotter-dam, with equipment developed by ECN (see Annex 2). Another issue of EC and OC measurements concerns the contribution of OC to the mass of PM. For EC and OC, the
analysis results in mass carbon per m3. For EC, this is the
contribution to PM, but for OC, the carbon content is associ-ated with organic compounds containing hydrogen, nitrogen and oxygen. The mass of these organic compounds (OCom) depends on the time and location. To compute the mass of organic compounds, studies indicate multiplication by a factor of 1.3 to 1.6 for urban OC, and 1.5 to 1.9 for regional OC [Bae, 2006]. In this report, in Section 2.5, multiplication by a factor of 1.6 was used to correct the OC data to OCom data, to compute the contribution of OC to the urban background.
Black smoke measurements 2.1.2
In the past, BS has been determined, as an indicator for partic-ulate matter originating from incomplete combustion of fossil fuels (e.g. fly-ash particles). BS measurements to establish mass concentration of ‘black particles’ are now regarded semi-quantitative, due to the time and location specific conversion of absorbance coefficient units to mass units [Erdmann, 1993; Hamilton, 1995; Muir, 1995]. Today, the optical BS method has widely been replaced by EC and OC measurements, to achieve quantitative mass units for carbonaceous PM. However, there are long time-series of BS, which may be used for studying the trend of black particles in ambient air. For example, in the Rijnmond area, DCMR and RIVM have been monitoring BS since the 1960s. In this report, first the correlation of BS with EC is investigated, followed by a trend analysis of BS, as a proxy for the trend in EC, in Section 2.2.4.
Monitoring EC, OC and Black Smoke in 2006
2.2
and 2007, and Black Smoke from 1989 to 2006
Monitoring locations for EC, OC and 2.2.1
black smoke in 2006 and 2007
From November 2006 to September 2007, TNO, in coopera-tion with DCMR (the Rijnmond Environmental Proteccoopera-tion Agency), executed a monitoring programme for EC, OC and Black Smoke (BS) in Rotterdam, the Netherlands. The
objec-Methodology
tives of this study were directed at 1) the contribution from local sources to the urban background concentrations of EC and OC, 2) the correlation between BS and EC, and 3) the trend of BS in the period from 1989 to 2006, as a proxy for the trend of EC.
At six sampling locations, fortnightly PM samples were taken between November 2006 and March 2007, and monthly samples were taken between April and September 2007; they were analysed for BS, EC and OC. The sampling volume was
of the order of 4 m3 on QMA filters, and field blanks were
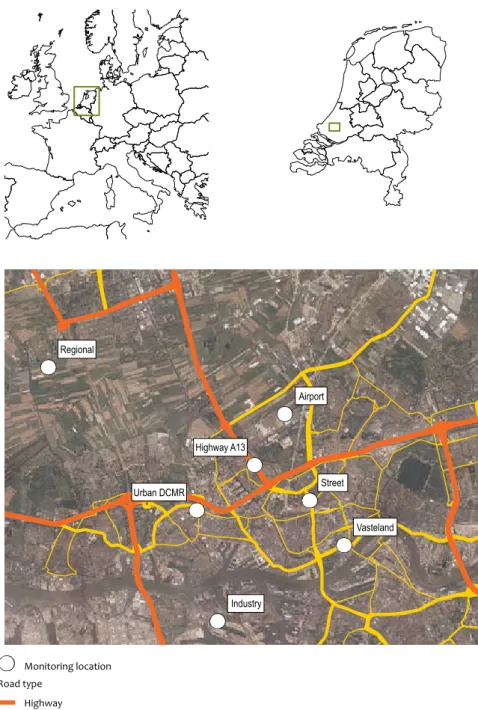
included during each sampling period. The BS measurements were performed with an EEL 43 Smoke Stain Reflector [ISO 9835, 1993], and for EC and OC measurements the Sunset method was used [Chow, 1993]. The six locations are shown in Figure 2.1. Also, the urban background location (‘Vaste-land’) is shown, where in the period from 1986 to 2006 BS measurements were performed by DCMR. In this period, BS measurements were also executed by RIVM, at the regional location at Westmaas, which is located 10 kilometres south of Rotterdam. This regional location is outside of the area shown in Figure 2.1.
Six sampling locations for EC, OC and BS, in Rotterdam, between 2006 and 2007, and the urban background loca-tion (Vasteland) with BS measurements in the period from 1989 to 2006.
Figure 2.1 Sampling locations for EC/OC and BS in Rotterdam
Airport Industry Vasteland Urban DCMR Regional Highway A13 Street Monitoring location Road type Highway Main road Other roads
Methodology and results 15
Similar to Figure 2.2A, but for OC (µg C/m3).
Figure 2.2B
nov dec jan feb mar apr may jun jul aug 0 1 2 3 4 5 6 7 µg C/m 3 Regional Highway A13 Street Urban Industry Airport
During the period from November 2006 to September 2007
OC concentrations in Rotterdam
The six locations for monitoring EC, OC and BS, in 2006 and 2007, were selected with the following monitoring objectives:
‘regional’: the regional background concentration near
Rotterdam;
‘urban DCMR’: the urban background concentration in
Rotterdam;
‘industrial’: the impact of industrial/refineries emissions;
‘street’: the impact of traffic emissions at a street location,
Bentinckplein in Rotterdam (of the National Air Quality Monitoring Network);
‘motorway A13’: the impact of traffic emissions from the
motorway A13 and
‘airport’: the impact from Rotterdam airport
‘Zestienhoven’.
Regional-urban-street gradient of EC 2.2.2
and OC, in 2006 and 2007
The monitoring results for EC and OC at the six locations in Rotterdam are presented in Figure 2.2A and 2.2B.
The results in Figure 2.2A show, that there is no seasonal vari-ation in the regional background concentrvari-ations of EC. This is in line with other research [Bae, 2006]. Figure 2.2A illustrates the importance of traffic emissions to EC, by the elevated levels near traffic impacted locations ‘street’ and ‘motorway’. Increased levels of EC near the traffic locations in the summer period are difficult to explain, as one expects lower values due to increased dispersion in the summer, and less emissions due to summer holidays.
The results in Figure 2.2B have been corrected for a field blank
of 0.7 µg C/m3, as established by the Sunset method. Figure
EC concentrations (µg C/m3) at the six locations in Rotterdam, during the period from November 2006 to September 2007.
Figure 2.2A
nov dec jan feb mar apr may jun jul aug 0 1 2 3 4 5 6 7 µg C/m 3 Regional Highway A13 Street Urban Industry Airport
During the period from November 2006 to September 2007
2.2B shows a seasonal variation of OC at all locations, with elevated OC levels in the summer period. This is in agreement with other research [Bae, 2006]. Contrary to EC, no elevated levels were measured at the traffic locations. These results illustrate that urban OC concentrations are mainly controlled by the regional background concentrations of OC. The latter is the result of primary emissions (e.g. from combustion proc-esses) and secondary organic aerosol (SOA). SOA is attributed to photochemical ageing of biogenic precursors, such as ter-penes released by vegetation, and carbonaceous compounds emitted by anthropogenic sources, for instance, diesel engines. The elevated levels of OC in summertime may reflect increased biogenic emissions during the growing season [Bae, 2006], and may be caused by enhanced photochemical ageing of diesel emissions.
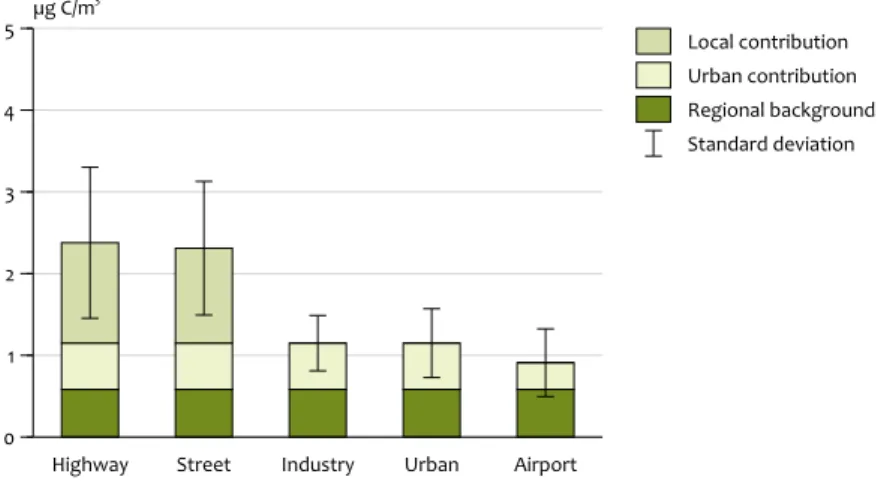
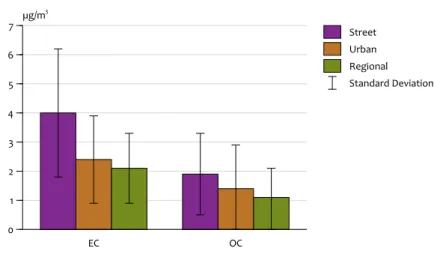
Figures 2.3A and 2.3B present the annual average results for EC and OC at the six locations.
Figure 2.3A illustrates the following issues:
EC urban increment; the average, annual urban background concentration was elevated against the regional back-ground concentration. This urban increment was 0.6 +/- 0.2
µg C/m3 . The annual average urban background of 1.1 ±
0.3 µg C/m3 was in good agreement with studies done in
Ghent in 2004 and 2005 with 1.0 µg C/m3, in Amsterdam in
2005 and 2006 with 1.8 µg C/m3, and in Birmingham in 2004
and 2005 with 1.7 µg C/m3. [Viana, 2007; Harrison, 2008].
However, caution is required when comparing EC monitor-ing results, in view of the variation in samplmonitor-ing/measure- sampling/measure-ment procedures.
EC roadside concentration; there was a strong roadside to urban to regional gradient, which illustrated the
impor-Annual average of EC concentrations (µg C/m3) and standard deviation, at the six locations in Rotterdam, during the period from November 2006 to September 2007.
Figure 2.3A
Highway Street Industry Urban Airport 0 1 2 3 4 5 µg C/m 3 Local contribution Urban contribution Regional background Standard deviation
at the six locations in Rotterdam during the period from November 2006 to September 2007
Annual average EC concentration
Similar to Figure 2.3A, but for OC (µg C/m3).
Figure 2.3B
Highway Street Industry Urban Airport 0.0 1.0 2.0 3.0 4.0 5.0 µg C/m 3 Local contribution Urban contribution Regional background Standard deviation
at the six locations in Rotterdam during the period from November 2006 to September 2007
Methodology and results 17
tance of traffic emissions to EC concentrations. The annual concentration at the street location and near a motorway
was 2.3 ± 0.7 µg C/m3. The elevated EC levels near traffic
locations agreed with the findings from the study in Bir-mingham [Harrison, 2008].
EC emissions from other sources; other sources than road traffic hardly contributed to the urban background con-centration of EC. At the airport location, no impact from aviation on EC concentrations was identified, and even the urban background contribution was lower at this location, because of its proximity to the rural region. Also, at the industrial location, no impact on EC concentrations was found from industrial/refinery emissions, at the monitoring location. Probably, this was the result of the height of the emission stacks. High emission stacks allow for dilution of the emitted substances before they reach ground level. Consequently, these concentration levels are expected to be lower at the surface, than when emissions would have been emitted more closely to the surface.
Figure 2.3B illustrates the following issues:
OC urban increment; the average, annual urban back-ground concentration of OC was slightly elevated against the regional background concentration. The regional and
urban increment was of the order of 0.7 +/- 0.4 µg C/m3.
The annual, average urban background concentration of
2.8 ± 1.7 µg C/m3 was low, compared to studies in Ghent in
2004 and 2005 with 4.1 µg C/m3, in Amsterdam in 2005 and
2006 with 5.4 µg C/m3, and in Birmingham in 2004 and 2005
with 3.8 µg C/m3. [Viana, 2007; Harrison, 2008]. However,
as discussed for EC, also for OC caution is required when comparing OC monitoring results from various studies. OC roadside concentrations; contrary to EC, there was hardly
any roadside to urban to regional gradient. The annual concentration at the street location and near the motor-way is of the order of 2.6 ± 1.4 µg C/m3. This illustrates the
importance of the regional OC background concentrations, on which limited OC traffic emissions are superimposed. In our study, no increment at the traffic locations was meas-ured compared to the urban background. However, in
the study in Birmingham, an increment of 0.6 µg C/m3 was
determined at an urban roadside [Harrison, 2008]. OC emissions from other sources; similar to EC, no other
sources apart from road traffic (e.g. refineries and airport) contribute significantly to the urban background con-centrations of OC. The differences between the average OC concentrations at the six locations, in Figure 3B, are not significant, in view of the annual variation at these locations.
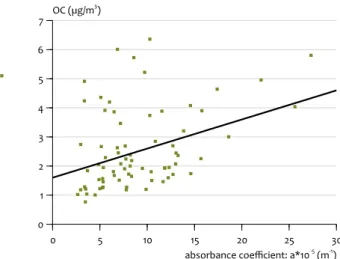
Correlation between black smoke, EC 2.2.3
and OC, in 2006 and 2007
To investigate the application of BS trends as a proxy for EC and OC trends, first the correlation between BS and EC and OC measurements was investigated. In the BS method, the measured absorbance was computed in the absorbance
coefficient and than converted into µg black carbon per m3.
However, as discussed in Section 2.1, this absorbance/mass conversion is no longer valid, due to the shift in fossil-fuel consumption, since the 1950s. Therefore, in this study, the absorbance coefficient was directly applied, without mass conversion. For all locations, during all periods, BS absorb-ance coefficients were plotted against the EC and OC concen-trations in Figure 2.4A and 2.4B.
Figure 2.4A indicates a linear relation between EC and BS, which is in agreement with earlier findings [Quincey, 2007; Schaap, 2007]. However, Schaap found a different relation between EC and BS for each of the regional and urban loca-tions. In Rotterdam, there was no indication of a different fit between EC and BS at the regional and urban locations. Figure 2.4B shows that there is no useful linear relation between OC and BS.
From these findings, presented in Figure 2.4A and 2.4B, was concluded that BS is an adequate proxy for EC concentrations and, thus, BS trends may be used as a proxy for EC trends.
Correlation between BS (10-5 m-1) and EC concentrations (µg C/m3), at six locations in Rotterdam, for all fourteen periods from November 2006 to September 2007.
Figure 2.4A
0 5 10 15 20 25 30
absorbance coefficient: a*10-5
(m-1 ) 0 1 2 3 4 5 EC (µg/m 3)
BS trend as proxy for EC trend from 1989 to 2006 2.2.4
For the Netherlands, there are time series of BS measure-ments available over periods of more than 30 years, which have been applied in health studies [Fischer, 2009]. In view of the increasing use of EC and OC measurements, instead of BS measurements, and the correlation between EC and BS, these BS trends may be used as a proxy for EC trends. In Figure 5, the delta between the urban background concentrations in Rotterdam and regional background concentrations near Rot-terdam for BS, are shown for the period from 1989 to 2006. Figure 2.5 shows a declining difference in the BS concentra-tions between the regional and urban background locaconcentra-tions, especially after 2001. This indicates that BS emissions and (in view of the correlation between BS and EC) also EC emissions from the road traffic, in Rotterdam, were decreasing faster than the long-range contribution of BS and EC to regional background concentrations. It is assumed that, for the last 20
years, BS and EC in the urban background concentration, in Rotterdam, predominantly have come from road traffic emis-sions and, thus, confirm the correlation between BS and EC, established in 2006 and 2007 (see Section 2.2.2).
[Note: A personal communication from the GGD in Amster-dam indicated that, contrary to RotterAmster-dam, BS concentrations have not declined since 2001. In general, in the Netherlands
BS concentrations decreased with 0.3 – 0.5 µg BS/m3 per year
in rural areas and 0.7-0.8 µg BS/m3 per year in urban areas in
the period 1984 – 2006 [Bloemen et al., 2007]. Similar, as in Amsterdam no decreasing trend has been measured since 2000. Hence, differences in road-traffic composition, and other local factors, would have to be considered before the results from Rotterdam could be generalised for the Nether-lands as a whole.]
Similar to Figure 2.4A but for OC (µg C/m3).
Figure 2.4B
0 5 10 15 20 25 30
absorbance coefficient: a*10-5
(m-1 ) 0 1 2 3 4 5 6 7 OC (µg/m 3)
Correlation of black smoke versus OC concentrations
The difference between annual BS at the urban background location in Rotterdam (Vasteland; DCMR) and at a regional location (Westmaas; RIVM), for the period from 1989 to 2006, including a three-yearly moving average trend line. Figure 2.5 1988 1992 1996 2000 2004 0 2 4 6 8 10 12 14 16 18 µg/m 3 Vasteland - Westmaas Three-year moving average
Methodology and results 19
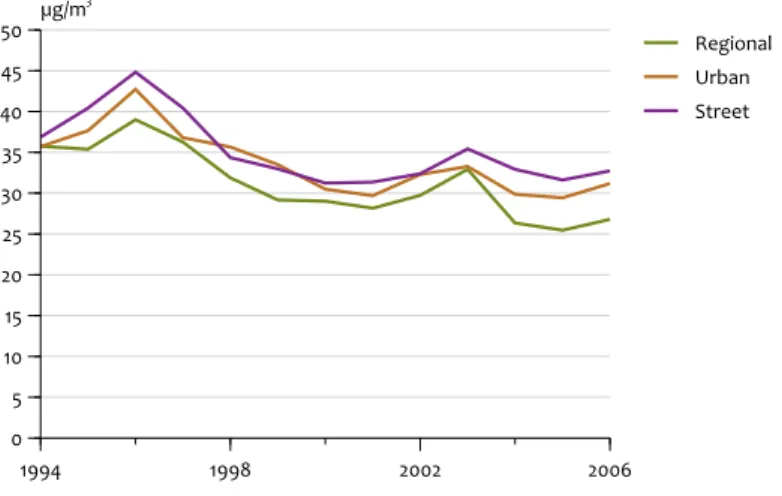
It is interesting to note that this decreasing trend of BS was
not measured by RIVM’s regular monitoring network for PM10.
The results for PM10 at regional, urban and street locations are
shown in Figure 6.
Figure 2.6 illustrates that, since 2000, the trend for PM10 at
urban and street locations has remained constant. This has been the case not only in the Netherlands, but also in other
European countries. PM10 is a less sensitive indicator for these
traffic-related PM contributions, as PM10 at urban background
locations is dominated by long-range transport and (partly) by the contribution of road dust from resuspension. This dominant impact of regional concentrations on the urban and street locations is also valid for OC. The comparison of Figure 6, and the trend of BS en EC in Figure 5, confirms that BS and
EC are more adequate indicators than PM10 for measuring the
impact of exhaust emissions from road traffic on urban back-ground concentrations of PM.
Monitoring EC, OC and Black Smoke, in March 2008
2.3
Monitoring locations for EC, OC and Black Smoke, in 2.3.1
March 2008
In the framework of the BOP programme, in March 2008, at eleven locations in Rotterdam, fortnightly PM samples were collected to measure EC, OC and BS. The objectives of this study were directed at: 1) the spatial variation in urban background concentrations of EC, OC and BS, 2) the regional-urban gradient of EC, OC and BS, and 3) EC, OC and BS contri-butions to PM2.5 and PM10.
The eleven locations are detailed in Figure 2.7, four of which (6, 9, 10 and 11) are similar to the locations ‘regional back-ground’, ‘urban background DCMR’, ‘street location’ and ‘motorway A13’, presented in Figure 1. At five (of the eleven)
locations separate PM2.5 and PM10 samples were collected to
differentiate EC in PM2.5 and PM10, while at the remaining six
locations, no particle size separation was performed during sampling. The BS analysis was performed by TNO, and the EC and OC analysis by ECN. More details on the ECN method are provided in Annex 1.
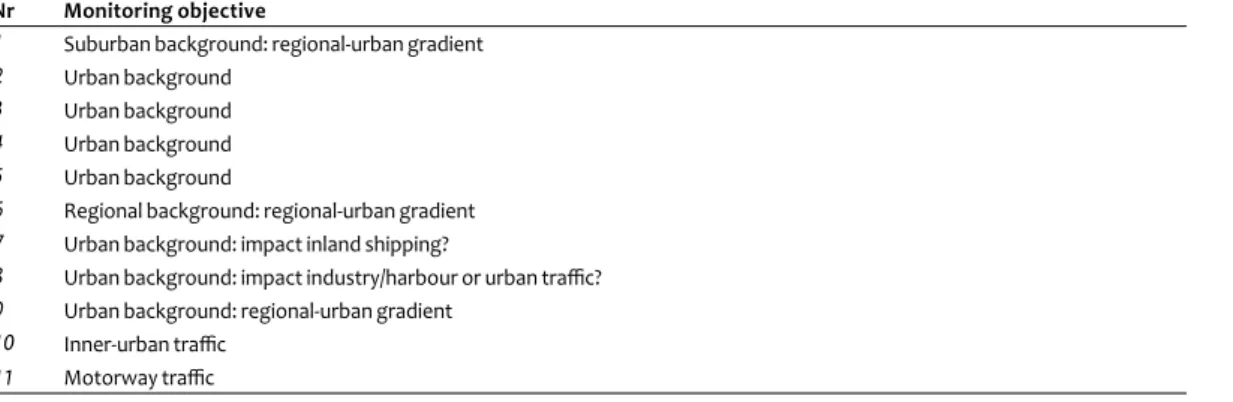
The eleven locations were selected for research on the urban
background of PM2.5 and PM10 [Voogt et al., 2009]. The
objec-tives of these locations are presented in Table 2.1. The locations 2, 3, 4, 5 and 9, in Table 2.1, were regarded ‘true’ urban background locations – in accordance with EU guidelines [Larsen, 1999] – to study the variability in the urban background concentrations of EC, OC and BS. The gradi-ent from regional to urban background concgradi-entrations was studied at locations 6, 1 and 9. Station 7 was characterised as an urban background location, but because of the relatively close proximity to the river ‘Nieuwe Maas’ and the harbour ‘Leuvehaven’, its results may have been influenced by emis-sions from inland shipping, during wind directions from south to east. Analogously, location 8 may have been affected by industrial emissions during westerly winds, while location 11 monitored the impact of motorway emissions. Finally, location 10 was a traffic location, located at Bentinckplein in Rotterdam.
Spatial variability of EC in Rotterdam, in March 2008 2.3.2
The sampled filters at the eleven locations did not produce adequate results for EC and OC, for reasons unknown. Therefore, the objective of studying the spatial variability of EC and OC and the regional-urban gradient in Rotterdam could not be achieved. However, the filters were successfully analysed for BS, and the EC concentrations were derived from these BS results, by using the correlation between BS and EC estab-lished in Section 2.2.3. Therefore, this study reports on the results for BS and EC, only. The results for EC from the five
locations with PM2.5 and PM10 samples and from the six
loca-tions with no size fraction, are presented in Table 2.
The trend in annual average PM10 concentrations at regional, urban and street locations, from measuring stations of the National Air Quality Monitoring Network 1994 to 2006 (source: RIVM/PBL).
Figure 2.6 1994 1998 2002 2006 0 5 10 15 20 25 30 35 40 45 50 µg/m 3 Regional Urban Street
Measurements of the National Air Quality Monitoring Network
The agreement in the EC results for PM2.5 and PM10 in Table 2.2
(between locations 2, 5, 6, 10 and 11), confirm the results from earlier measurements, showing that no size fraction is required to measure EC in ambient air. EC originates from incomplete combustion processes of fossil fuels, and these emissions are in the sub-micron size fraction: hence, differentiation in
PM2.5 and PM10 samples is not required. This is confirmed by
research performed in Birmingham with size fractions of PM1,
PM2.5 and PM10 [Harrison, 2008].
The urban background concentrations of EC for the locations
2 to 5 and 9 was 0.6 ± 0.3 µg C/m3. Therefore, the spatial
variation in the urban background concentrations of EC, during March 2008, was less than the uncertainty in the EC measurement. The latter is of the order of 50%. Similar to the results in Figure 3A, for EC, no significant impact on the urban background concentration was identified from shipping or industrial emissions at locations 7 and 8, respectively. The increment in EC at traffic locations 10 and 11, against measure-ments at the urban background locations, is of the order of 1.2
Eleven sampling locations for EC, OC and BS in Rotterdam, in March 2008.
Figure 2.7 Sampling locations for EC/OC and BS in Rotterdam in the period March 2008
Monitoring location Road type Highway Main road Other roads 1 9 8 7 6 5 4 3 2 1 11 10
Monitoring locations and specific objectives
Nr Monitoring objective
1 Suburban background: regional-urban gradient 2 Urban background
3 Urban background 4 Urban background 5 Urban background
6 Regional background: regional-urban gradient 7 Urban background: impact inland shipping?
8 Urban background: impact industry/harbour or urban traffic? 9 Urban background: regional-urban gradient
10 Inner-urban traffic 11 Motorway traffic
Methodology and results 21
µg C/m3. This agrees well with the annual average increment
in EC, in Figure 2.3A.
An average urban increment, in March 2008, was determined
at 0.1 µg ± 0.3 µg C/m3, which is not significant. The annual
urban increment for 2006 and 2007, in Section 2.2.2., was 0.6
± 0.3 µg C/m3. The lack of a significant increment, in March
2008, could be attributed to the domination of south-westerly winds. Consequently, the urban increment was expected to be low, for this period, as urban emissions are transported in the direction of the regional locations (see Figure 2.7).
EC and OC emission factors for urban
2.4
traffic (September to October 2008)
Regulatory EC and OC emission factors for road traffic are not available by dynamometer test cycles. Estimates for EC and OC emission factors have been established by research in road tunnels or roadside measurements [Ning et al, 2008]. The objectives of the study in the BOP programme were directed at 1) establishing EC and OC emission factors for urban traffic and 2) preparing a map with annual average con-centrations of EC and OC, for the Rotterdam-Rijnmond area. EC and OC emission factors were determined by measure-ments performed at an urban background location and a traffic location. Hourly EC and OC measurements were performed by ECN, using an OC monitor (Sievers) and an EC monitor developed by ECN (for the technical details of this experimental configuration, see Annex 2). The monitoring period lasted from 18 September to 23 October 2008. The instruments that were used, were compared before and after this campaign, to account for the reproducibility of the instru-ments. It was found that EC and OC data values deviated by 10 and 4%, respectively. Here, it was assumed that the increment
measured at the traffic location, compared with measure-ment results from the background location, was a proxy for the additional contribution to EC and OC due to traffic emissions.
In addition to air quality data, hourly traffic data were col-lected near the traffic location, by automatic traffic counting (e.g. the number of vehicles and the average speed). Mete-orological data on wind speed and wind direction are moni-tored routinely at Rotterdam airport, at less than 3 kilometres from the monitoring locations. Monitoring, meteorological data and traffic data were input for a CFD (Computational Fluid Dynamics) model, to compute the emission factors for EC and OC by inverse modelling. These emission factors were applied as input for TNO’s urban dispersion model, Urbis, to compute the annual average concentrations of EC and OC in the Rotterdam-Rijnmond area.
Monitoring locations (September to October 2008) 2.4.1
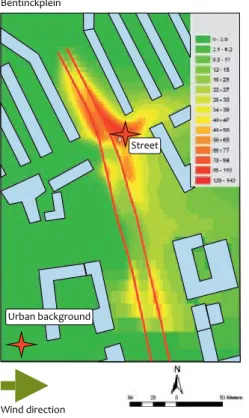
In the period from 18 September to 23 October 2008, at the street location ‘10’ (Figure 2.2) and at an urban background location at less than 500 metres from the street location, EC and OC concentrations were measured by ECN, using auto-matic equipment (see Annex 2). The locations are presented in Figure 8.
The distance between the urban background monitoring location and the traffic north of the location (not indicated in Figure 8) was more than 50 meters across open field. The traffic intensity at this street, north of the urban background location, was significantly lower than near the street location. Therefore, location 1 was considered an adequate background location for this study. In addition to the monitoring locations, Figure 2.8 also shows the dispersion of traffic emissions as computed by the CFD model (WinMISKAM: www.etcaq.rivm. nl/databases/mds.html) at a westerly wind.
Monthly EC concentrations (µg C/m3) Nr Monitoring objective EC PM2.5 PM10 No size fraction 1 Suburban 0.7 2 Urban 0.3 0,2 3 Urban 0.9 4 Urban 0.8 5 Urban 0.8 0.7 6 Regional 0.3 0,5
7 Urban: impact inland shipping? 0.6
8 Urban: impact industry/harbour? 0.9
9 Urban 0.5
10 Traffic 1.8 1.8
11 Urban: impact motorway traffic? 1.9 1.9
March 2008, at eleven monitoring locations in Rotterdam.
Table 2.2
Traffic intensity for light and heavy-duty vehicle
Weekday Saturday Sunday
# private cars/24 h 29852 25280 23864
# trucks/buses/ 24 h 1897 929 647
Total 31749 26209 24511
Percentage trucks/buses 6.4% 3.7% 2.7%
September to October 2008, at the street location in Rotterdam.
Traffic intensity near the street location 2.4.2
The traffic intensity near the traffic location is presented in Table 2.3.
The traffic near the traffic monitoring location is representa-tive for an inner-urban road with high traffic intensity, in the Netherlands.
Monitoring data on EC and OC (October 2008) 2.4.3
The collected monitoring data, from both locations, were used to compute the hourly EC and OC concentration dif-ferences between the background location and the street location. The automatic monitoring data, from the period between 8 and 20 October 2008, were used to present the diurnal increment in the concentrations of EC and OC at Ben-tinckplein, both for weekdays and weekends. The results are presented in Figures 2.9 and 2.10.
Figure 2.9 illustrates that the typical morning and evening rush hours during weekdays, resulted in larger increments in EC at the street location, while Figure 10 shows that, typically, at the weekend, significant increases in EC at the street location only occurred in the afternoons and evenings. Both, during weekdays and at weekends, no increment in OC was measured at the street location, contrary to the urban background location. This indicated that the increment in OC emissions from traffic was at least smaller than the variability during the monitoring method, which was established by
parallel measurements at 0.5 µg C/m3.
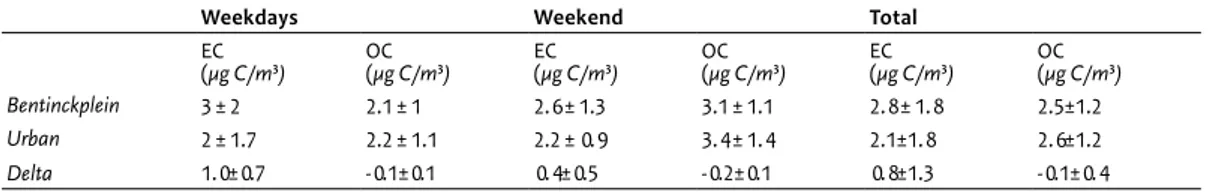
Table 2.4 presents the average EC and OC concentrations from the monitoring period, at the street location and the urban background location.
The levels measured with the automated monitoring equip-ment during the October 2008 campaign at the street
loca-tion were 2.8±1.8 µg C/m3 for EC, and 2.5±1.2 µg C/m3 for OC.
Both levels are in agreement with the annual average range for EC and OC in 2006 to 2007 (see street location in Figures 2.3A and 2.3B).
The urban-street increment in EC of 1.0±0.7 µg C/m3 was only
significant for weekdays, which have a significant amount of (heavy-duty) traffic (see: Table 2.3). During the weekend, the emissions from road traffic were too low to result in a signifi-cant increment at the street location, in contrast to the urban background location. For OC, no increment was measured; either during weekdays or at weekends, and, consequently, no emission factor for OC could be established.
Establishing the EC emission factor 2.4.4
Hourly increments in concentrations of EC, hourly averaged meteorological data, and hourly averaged traffic data were stored in a database. Subsequently, certain hours were selected to compute the emission factors for EC. As no sig-nificant increments in OC were measured, this method was only applied for EC. The criteria for selecting hours, were as follows:
Traffic volume; for a significant contribution of traffic emis-sions, only the hours were selected with more than 750
The urban background location (1) and the street location (2) in Rotterdam, as well as buildings (blue), traffic flow (red lines) and the dispersion of traffic emissions at westerly winds (green-yellow-red).
Figure 2.8 Dispersion of traffic emissions near monitoring locations in Rotterdam
Bentinckplein Stations High emission Traffic flow Buildings Urban background Street Low emission Wind direction
Methodology and results 23
vehicles. This resulted in day-time hours between 7 a.m. and 8 p.m.;
Monitoring data; only those hours were selected for which the data on concentrations of EC and OC at both the traffic and the background location were available. This narrowed down the available period to between 8 and 20 October 2008. For this period, the increment in EC and OC at the traffic location was established for weekends and weekdays.
Meteorological conditions; to have a representative con-tribution of traffic emissions during a monitoring hour, without remaining contribution from the previous hour, a certain amount of ventilation of the street-canyon would be required. Only those hours were selected with wind speeds of more than 1 m/s. In addition, only the hours were selected with a wind direction transporting traffic
emissions towards the traffic location: from west to north-northeast.
For the selected number of hours, the EC and OC emission factors for urban traffic were determined. The criteria for selecting suitable hours from within the monitoring period, yielded 199 weekday hours and 77 weekend hours. Subse-quent selection, by applying the criteria for suitable meteoro-logical conditions, narrowed down the number of hours to 21. For these hours, inverse modelling was applied with the Win-MISKAM model, as well as data input on hourly increments in EC, traffic intensity and meteorology.
The input data for this exercise are presented in Annex 3, while the range and the average values are summarised in Table 2.5.
The diurnal variation of the increment in EC and OC (µg C/m3), on weekdays, at the street location, against the urban background location, in Rotterdam.
Figure 2.9 0 1 2 3 4 5 6 7 8 9 10 11 12 13 14 15 16 17 18 19 20 21 22 23 24 (hours) -0.5 0.0 0.5 1.0 1.5 2.0
2.5 Traffic contribution EC/OC (µg C/m
3)
EC OC
street location against the urban background in Rotterdam for working days
The diurnal variation of the increment EC/OC
Similar to Figure 2.9, but for weekends.
Figure 2.10 0 1 2 3 4 5 6 7 8 9 10 11 12 13 14 15 16 17 18 19 20 21 22 23 24 (hours) -1.0 -0.5 0.0 0.5 1.0 1.5
2.0 Traffic contribution EC/OC (µg C/m
3)
EC OC
street location against the urban background in Rotterdam for weekend days
The average emission factor for EC was established for each hour, and averaged over the range of values. Another option would be to determine this emission factor from a linear regression of the data in Annex 4, which is presented in Figure 2.11.
The slope of the linear regression of the data presented in Figure 2.11 provides an EC emission factor for urban traffic of 10 mg C/km. Linear regression is a more appropriate method for determining the emission factor and variability, than that of the arithmetic mean, as presented in Table 2.4. Based upon linear regression, an emission factor for EC of 10±6 mg C/km was established.
Concentration map of EC for Rotterdam 2.4.5
An annual average concentration map was computed for EC, by using the Urbis model of TNO. This model calculates the contribution from local traffic to air pollution with Plume Motorway, a line-source model for motorway traffic, and CAR, a statistical street-canyon model for inner-urban traffic[Boeft, 1996]. These contributions were added to the regional background concentrations, taking into account the dispersion of local traffic emissions towards the urban back-ground location.
As input for the Urbis model, meteorological data, the regional background concentrations of pollutants, and the emission factors for traffic, all from the previous year, were provided by the Netherlands Environmental Assessment Agency (PBL) (http://www.mnp.nl/nl/themasites/gcn/index. html). Traffic data were made available by the Regional Envi-ronmental Agency DCMR. However, the regional background concentrations and emission factors for EC were not available.
Therefore, the measured value of 0.5 µg C/m3 for the annual
regional background concentration of EC, based on the Rot-terdam study (Sunset method), was applied (see: Section 2.2.2). The EC emission factor for urban traffic of 10 mg C/km was used, as determined in the previous section. For emis-sion factors for motorway traffic, the results from a separate study by TNO, in 2008 [Keuken et al., 2009], were applied: 5 mg C/km (for light-duty vehicles) and 25 mg C/km (for heavy-duty vehicles). These last two emission factors were
estab-lished in a motorway tunnel with a separate tunnel tube for heavy-duty vehicles.
These emission factors agreed with a recent source-appor-tionment study, in a motorway tunnel in the UK, on the emissions from motorway traffic [Lawerence et al., 2009].
For PM10, an emission factor of 40 mg/km was established
for motorway traffic, with 65% non-exhaust emissions (e.g. from road wear due to breaking, tire wear and resuspension), 10% un-accounted for, and 25% exhaust emissions. The last of which, consisted of EC plus OC with a ratio of 4:1 [Harrison, 2008]. Hence, this resulted in an emission factor for EC of 8 mg C/km. With a traffic composition of 95% in light-duty vehicles and 5% in heavy-duty vehicles, the aforementioned emission factors of 5 mg C/km and 25 mg C/km, respectively, provide an overall emission factor of about 6 mg C/km. However, studies in Japan [Naser et al., 2009] and Switser-land [Hueglin et al., 2006] indicate emission factors for EC in the order of 20 mg per kilometer per vehicle for motor ways. Hence, the value of 6 mg C/km in BOP is regarded rather low, as compared to other studies.
The annual concentrations in Rotterdam were computed with traffic data from 2006, meteorology from 2006, and the above mentioned regional background concentrations and emission factors for EC. The results are presented in Figure 12. Figure 2.12 illustrates elevated concentrations of EC near heavy-traffic inner-urban roads and the motorways around
the centre of Rotterdam. For PM10 and PM2.5, similar maps
were modelled, which showed relatively fewer elevated
concentrations near traffic locations. This illustrates that PM2.5
and PM10 concentrations are more dominated by large-scale
transport. To illustrate that EC concentrations were relatively
higher (than those of PM 2.5 and PM10) compared to
back-ground concentrations, a contrast map was made. This map, produced by dividing concentrations according to regional background concentration, is presented in Figure 13. The map in Figure 2.13 shows that EC is a more sensitive indi-cator for traffic-related PM emissions. It is assumed that EC is
probably a better indicator than PM2.5 and PM10, for monitoring
Average EC and OC concentrations and variability (µg C/m3)
Weekdays Weekend Total
EC
(µg C/m3) OC(µg C/m3) EC(µg C/m3) OC(µg C/m3) EC(µg C/m3) OC(µg C/m3)
Bentinckplein 3 ± 2 2.1 ± 1 2.6 ± 1.3 3.1 ± 1.1 2.8 ± 1.8 2.5±1.2 Urban 2 ± 1.7 2.2 ± 1.1 2.2 ± 0.9 3.4 ± 1.4 2.1±1.8 2.6±1.2 Delta 1.0±0.7 -0.1±0.1 0.4±0.5 -0.2±0.1 0.8±1.3 -0.1±0.4
At the monitoring locations in Rotterdam from 8 to 20 October 2008.
Table 2.4
Average data input for inverse modelling by WinMISKAM, on hourly increments
Wind direction
(o) Traffic intensity(#/h) Traffic speed(km/h) Delta EC(µg C/m3) EF EC(mg C/km)
Range
(21 hours) 270-290 1000-2500 45-50 0.2-4.6 2-25 Average
(21 hours) 277 1838 48 2.0 12±6
Traffic intensity and meteorology between 8 and 20 October 2008, in Rotterdam, and the resulting average emission factor for EC (mg C/km).
Methodology and results 25
Linear regression of the WINMISKAM data and the delta EC, as measured at the street location and the urban background location, between 8 and 20 October 2008, in Rotterdam.
Figure 2.11 0.00 0.10 0.20 0.30 0.40 0.50 Delta EC (µg C/m3) 0 1 2 3 4 5 CFD factor (1/m 2)
Measured at the street location and urban background from 8-20 October 2008 in Rotterdam
Linear regression of the WINMISKAM data and the delta EC
Annual concentrations of EC (µg C/m3), with traffic and meteorological data from 2006, in Rotterdam.
Figure 2.12 Annual concentrations of EC in Rotterdam (2006 traffic data and meteorology)
EC concentration (µg C/m3) < = 1.0 1.0 - 1.2 1.2 - 1.4 1.4 - 1.6 > 1.6
Annual contrast concentrations of EC in Rotterdam.
Figure 2.13 Annual contrast of EC in Rotterdam
Contrast 1.0 - 1.2 1.2 - 1.4 1.4 - 1.6 > 1.6
the effectiveness of emission reduction measures directed at exhaust emissions. Also, the results for EC may be used in epi-demiological studies more effectively than the more general
parameters, such as PM2.5 and PM10, specifically when directed
at the role of traffic-related PM emissions.
The contribution of EC and OC to
2.5
urban background concentrations
In this section, the contribution of EC and OC traffic emis-sions to urban background concentrations is assessed. This was based on the results from the monitoring campaign in the BOP programme, in the Netherlands. In the year 2007 to
2008, PM2.5 and PM10 samples were collected at street, urban
and regional locations and analysed for EC and OC. These analyses were performed by the Cachier method, which resulted in systematically higher values for EC (see Annex 1). The annual average concentrations of EC and OC at street, urban and regional locations are presented in Figure 2.14. Only
the results for EC and OC in PM10 are shown, but the results
for PM2.5 were similar, which confirmed the conclusion, drawn
in Section 2.2.3, that ‘no size fraction is required to measure EC in ambient air’.
Figure 2.14 shows that, in the Netherlands, the average
street-urban increment in EC was 1.6 ± 0.8 µg C/m3, and for OC this
was 0.5 ± 0.2 µg C/m3. These results were in agreement with
the study in Rotterdam, taking into consideration the differ-ences in analytical method. The average EC and OC roadside increments resulted from road-traffic emissions. Thus, for road-traffic emissions, in the Netherlands, the ratio for EC and OC is approximately three, which is consistent with the study in Birmingham, where the ratio between EC and OC is 4:1 [Har-rison, 2008]. This ratio depends on the road-traffic composi-tion (e.g. ratio in heavy-duty traffic and diesel vehicles). Figure 2.14 shows that, in the Netherlands, the average
urban-regional increment in EC was 0.3 ± 0.2 µg C/m3, and for OC
this was 0.2 ± 0.2 µg C/m3. This indicates that superimposed
on the regional background emissions of EC and OC, was an urban increment in mainly EC, and no significant increment in OC. The urban-regional EC and OC increment was mainly related to road-traffic emissions, as other urban sources (e.g. industries, refineries, shipping) do not contribute significantly to urban background concentrations (see Figure 3A). From the ratio of 4:1 for EC and OC for road-traffic emissions, was computed that the urban-regional EC increment of 0.3 µg C/
m3 (as a result of road-traffic emissions) is associated with an
OC increment of 0.1 µg C/m3. However, this computed
incre-ment in OC is not measurable against the regional background of OC, due to the uncertainty of the monitoring method. In the next step, the contribution of EC and OC in road-traffic
emissions to the urban background concentrations of PM2.5
and PM10, in the Netherlands, was estimated. As indicated by
the BOP results, the urban-regional increment in EC of 0.3
± 0.2 µg C/m3 was associated with a computed increment in
OC of 0.1 µg C/m3. To estimate the contribution to PM
2.5 and
PM10, the mass of organic carbon (OC) had to be computed
as the mass of organic compounds (OCom). Studies indicate a factor 1.3 to 1.6 for urban OC and 1.5 to 1.9 for regional OC, to compute the mass of organic compounds [Bae, 2006]. For the urban increment in OC, in the Netherlands, this resulted
in a contribution of organic compounds to PM2.5 and PM10 of
1.6* 0.1 µg C/m3, which is 0.2 µg OCom/m3. Consequently, the
contribution of EC and OCom emissions from road traffic to
the urban background concentrations of PM2.5 and PM10 is 0.3
(EC) plus 0.2 (OCom), which is 0.5 µg/m3.
Figure 2.15 shows the results from the BOP programme for PM2.5, PM10 and (calculated PM2.5-10) in the Netherlands..
Figure 2.15 shows that the average urban background
con-centrations for PM2.5 and PM10, in the Netherlands, was in the
range of 15 to 20 and 20 to 30 µg/m3, respectively. Hence,
the contribution of EC and OCom from road-traffic emissions
to the urban background concentrations of PM2.5 and PM10
Average concentrations, and standard deviation, of EC and OC (µg C/m3) at street, urban and regional locations in the Netherlands, during the period from august 2007 to september 2008 [Arkel et al., 2009].
Figure 2.14 EC OC 0 1 2 3 4 5 6 7 µg/m 3 Street Urban Regional Standard Deviation the Netherlands 2007 - 2008
Methodology and results 27
was maximally 2.5 and 3%, respectively. It is concluded that the
potential for reducing the urban background of PM2.5 and PM10 by
reduction of exhaust emissions, is less than 5%. Hence, policies directed at reducing exhaust emissions from vehicles, will
hardly reduce the urban background of PM2.5 and PM10. From
a health point of view, it may be effective to reduce EC and OCom levels near heavy-traffic locations. However, more epidemiological research is required on the relation between population exposure, EC and OCom levels and health effects. Figure 2.15 also shows that there was no significant
street-urban-regional gradient for PM2.5, and only a limited
street-urban-regional gradient for PM10. For PM2.5, this illustrates that
the urban background concentration of PM2.5 was dominated
by the regional background concentrations, and that local measures for reducing these background concentrations
would not be effective. For PM10, this illustrates that
incre-ments in PM10, mainly at street level, but also at urban level,
were the result of an increase in PM2.5-10. These particles are
not emitted in exhaust emissions, but are mainly related to resuspension of road dust, tire wear and other friction proc-esses. These emissions are difficult to control, other than by reducing traffic volumes.
Average concentrations and standard deviation of PM2.5, PM10 and PM2.5-10 (µg/m3) at street, urban and regional locations in the Netherlands, during the period from august 2007 to september 2008 [Arkel et al., 2009].
Figure 2.15 PM10 PM2.5 PM2.5-10 0 10 20 30 40 µg/m3 Street Urban Regional Standard deviation the Netherlands 2007 - 2008