Evaluation of the Dutch legislation on
food fortification with folic acid
and vitamin D; focus on young children
Letter report 350090006/2009RIVM Letter report 350090006/2009
Evaluation of the Dutch legislation on food fortification with folic acid and
vitamin D; focus on young children
J. Verkaik-Kloosterman M.J. Tijhuis M. Beukers E.J.M. Buurma-Rethans Contact: J. Verkaik-Kloosterman Centre for Nutrition and Health Janneke.Verkaik@RIVM.nl
This investigation has been performed by order and for the account of Dutch Ministry of Health, Welfare and Sport, within the framework of the national policy for food fortification
© RIVM 2009
Parts of this publication may be reproduced, provided acknowledgement is given to the 'National Institute for Public Health and the Environment', along with the title and year of publication.
Contents
Samenvatting 5 Summary 7 Abbreviations 8 1 Introduction 9 2 Methods 132.1 Evaluation of the legislation on the food level 13
2.1.1 Inventory of folic acid and vitamin D fortified products 13
2.1.2 Evaluation of the fortification level in the identified products 13
2.2 Evaluation of the legislation on the intake level 14 2.3 Evaluation of the model assumptions 15
3 Results 19
3.1 Inventory and evaluation of food products 19
3.1.1 Folic acid fortified products 19
3.1.2 Vitamin D fortified products 19
3.1.3 Amounts of folic acid in fortified products 20
3.1.4 Amounts of vitamin D in fortified products 22
3.2 Evaluation of intake: exceeding the tolerable upper intake level 22
3.2.1 Folic acid 22
3.2.2 Vitamin D 24
3.3 Evaluation of model assumptions: comparing old and new values 28
3.3.1 Habitual energy intake 28
3.3.2 Folic acid-specific values and recalculation 28
3.3.2.1 Model parameters for folic acid 28
3.3.2.2 Recalculation of the maximum fortification level for folic acid 29
3.3.3 Vitamin D-specific values and recalculation 29
3.3.3.1 Model parameters for vitamin D 29
3.3.3.2 Recalculation of the maximum fortification level for vitamin D 30
4 Discussion 31
4.1 Product inventory 31
4.2 Food consumption and composition data 31
4.3 Food supplements 32
4.4 Maximum fortification levels 33
4.5 The tolerable upper intake level 34
4.6 EU legislation 34
5 Recommendations 36
6 Conclusions 37
7 Acknowledgements 38
8 References 39
Annex A 41
Samenvatting
Door een uitspraak van het Europese Hof is de Nederlandse wetgeving ten aanzien van verrijking van levensmiddelen met microvoedingsstoffen herzien. In 2007 is een algemene ontheffing afgegeven voor verrijking van levensmiddelen met foliumzuur en vitamine D tot een maximum niveau van
respectievelijk 100 μg/100 kcal and 4.5 μg/100 kcal. Deze maximale niveaus zijn berekend met behulp van een rekenmodel dat is aangepast aan de Nederlandse situatie.
De verandering in wetgeving kan hebben geleid tot een toename van op de Nederlandse markt verkrijgbare foliumzuur- of vitamin D-verrijkte levensmiddelen. Bovendien kan de inneming van foliumzuur en vitamine D zijn toegenomen. Vooral jonge kinderen lopen het risico op een
voedingsstofinneming boven de maximaal aanvaardbare bovengrens van inneming (UL). In deze studie hebben we geëvalueerd welke foliumzuur- of vitamine D verrijkte levensmiddelen er op de
Nederlandse markt zijn en of het gehalte foliumzuur of vitamine D voldoet aan de maxima die gesteld zijn in de algemene vrijstellingsregeling. De levensmiddelen zijn geïdentificeerd in
voedingsmiddelendatabases en een supermarktinventarisatie. Daarnaast is de inneming van foliumzuur en vitamine D bepaald voor verschillende verrijkingsscenario’s met behulp van consumptiegegevens van de voedselconsumptiepeiling onder jonge kinderen (2-6 jaar) en is het percentage kinderen met een inneming boven de UL geschat. Verder zijn de verschillende input parameters van het rekenmodel geëvalueerd op basis van nieuwe gegevens over de inneming.
Het aantal foliumzuur- of vitamine D-verrijkte levensmiddelen op de Nederlandse markt is toegenomen. Echter het aantal productgroepen waarin deze levensmiddelen zich bevinden is nog relatief gering. Op één product na, voldoen alle verrijkte producten aan de wetgeving. In de huidige situatie heeft een klein deel (< 5%) van de kinderen een foliumzuurinneming boven de UL. Met de huidige inneming van foliumzuur uit voedingssupplementen en als de markt van vrijwillig verrijkte producten toeneemt lopen vooral jonge kinderen (2-3 jaar) risico op te hoge foliumzuurinneming. De huidige en mogelijke toekomstige vitamine D inneming bleef onder de UL. Het maximale
verrijkingsniveau voor foliumzuur en vitamine D zijn in de huidige situatie hoog genoeg voor jonge kinderen. Verschillende model input parameters (bv. inneming uit voedingssupplementen en de fractie van de energie-inneming die verrijkt zou kunnen worden) zouden geüpdate moeten worden op basis van nieuw beschikbare gegevens. Herberekening van de maximale verrijkingsniveaus geeft waarden die overeenkomen met de huidige waarden. Indien de markt van vrijwillig verrijkte levensmiddelen toeneemt zullen de maximale verrijkingsniveaus herzien moeten worden. Het regelmatig monitoren van de Nederlandse markt aan verrijkte levensmiddelen en inneming uit de voeding wordt daarom
aanbevolen.
Summary
Due to a decision of the European Court, the Dutch policy on fortification of foods changed in 2007. A general exemption is given for fortification with folic acid and vitamin D, up till a maximum level of 100 μg/100 kcal and 4.5 μg/100 kcal, respectively. This maximum level was estimated using a calculation model for the Dutch situation.
The change in legislation may have led to an increase in folic acid and vitamin D fortified foods and their intakes. Young children may especially be at risk for intakes exceeding the tolerable upper limit (UL). Therefore, we evaluated the folic acid and vitamin D fortified foods available on the Dutch market, we evaluated the intakes of folic acid and vitamin D of young children, and we evaluated the input parameters and assumptions of the calculation model.
We identified folic acid or vitamin D fortified products using product databases and a supermarket inventory and compared their fortification levels with current legislation. We developed fortification scenarios using the results of the inventory and consumption data from the Dutch National Food Consumption Survey (DNFCS) on children aged 2-6 years. These intakes were compared with the UL. We recalculated the different model parameters using the results from the inventory and intake
information and compared with the old parameters.
New fortified food products have entered the market, all but one comply with current legislation. Currently a small proportion (< 5%) of the children exceeds the UL for folic acid. With increasing availability of fortified food products and current intakes from food supplements, especially young children (2-3 yr) will be at risk on too high folic acid intakes. The current and estimated future vitamin D intake do not exceed the UL. The maximum fortification levels are accurate for young children (2-6 yr) in the current situation. Several input parameters (e.g. food supplement intake, fraction of energy intake that may and will be fortified) should be updated based on newly available data. However, the recalculated maximum fortification levels remain similar. With increased voluntary fortification the maximum fortification levels need to be revised. Regular monitoring of the Dutch market and dietary intakes is therefore recommended.
Abbreviations
DNFCS Dutch National Food Consumption Survey UL tolerable upper intake level
1
Introduction
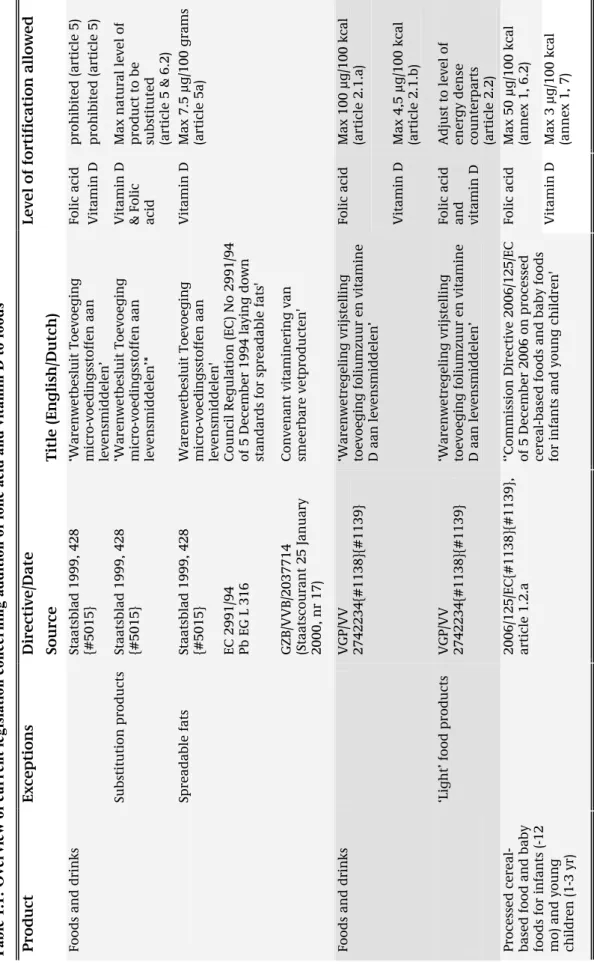
The main reason why foods are fortified with micronutrients is to prevent deficiencies or to provide additional health effects. Such fortification should be safe for the whole population; unacceptably large intakes (i.e. above the tolerable upper intake level (UL)) of the micronutrient, from all sources, should be prevented. Fortification (other than restoration and substitution) with vitamin A, vitamin D, folic acid, selenium, copper, and zinc is prohibited in the Netherlands [1]. However, in 2007 a general exemption [2] on this prohibition on fortification with folic acid and vitamin D was set, due to a decision of the European Court of Justice of the European Community [3] (Table 1.1). This general exemption is in force until the maximum levels for food fortification (EC 1925/2006) and
supplementation (2002/46/EC) are set in new EU legislation. In addition, several other legislations concerning addition of folic acid or vitamin D are in force for specific food products (Table 1.1). The general exemption for fortification with folic acid and vitamin D is given for fortification up till a maximum level; for folic acid this is 100 µg / 100 kcal and for vitamin D 4.5 µg / 100 kcal [2]. These maximum fortification levels were defined using a calculation model for the Dutch situation [4]. With this calculation model the ‘free space’ between the UL and intake from both background diet (i.e. without voluntary fortification practices, but including ongoing mandatory or otherwise via national policy regulated (e.g. covenants) fortification practices) and food supplements. The remaining ‘free space’ is divided over the proportion of the energy intake that may and will be fortified, resulting in a maximum fortification level per 100 kcal food. The calculation model requires several input parameters that are based on actual data or best educated assumptions (Box 1). With changes in e.g. dietary
patterns or when more or new data will be become available the input parameters of the model might change and as a consequence this might have influence on the maximum fortification levels.
The risk manager decided that light foods (at least 30% less energy than energy dense counterpart) may be fortified up till the same maximum level as their energy-dense counterparts [2]. With respect to the general exemption for folic acid, the risk-manager focussed on the results of the calculation model of adults only [4]. The UL for adults is based on the risk of masking vitamin B12 deficiency. The UL for
children is extrapolated from the UL for adults. The risk-manager assumed this extrapolation to be conservative, because the risk of masking B12 deficiency is thought to be low in children. Other issues,
are also relevant in the ongoing debate about the UL for folic acid, such as the recent data on colon cancer risk [5,6]. However, these data are currently not yet taken into account in the UL.
The change in legislation may have led to an increase in foods voluntarily fortified with folic acid or vitamin D available on the Dutch market and as a consequence the intake of these micronutrients might have increased. In this study, we evaluated three aspects that are important to the ultimate aim of guarding a fortification practice that is safe for the whole population.
1) An inventory of the folic acid and vitamin D fortified foods available on the Dutch market in first half of 2009 was made. The amounts of folic acid or vitamin D in these foods were compared with the currently legal maximum fortification levels.
2) The habitual folic acid and vitamin D intakes of Dutch young children were estimated for several scenarios of food fortification, using the results of the product inventory and the data of the Dutch National Food Consumption Survey among young children (2005-2006). The proportion of Dutch young children with intakes above the UL were determined for these scenarios.
3) We evaluated whether the current market situation meets the model assumptions and input parameters of the calculation model used to define the maximum fortification levels. This is important, because changes in the model parameters might have an effect on the maximum fortification levels. Depending on the changes in the parameters, the currently legal maximum fortification levels might be correct, too low (assumptions were too conservative) or too high (assumptions were too liberal).
This report describes the evaluation of new legislation with respect to the fortification of foods with folic acid and vitamin D. In chapter 2, the methods behind our evaluation are described. Chapter 3 presents its results. In chapter 4, we discuss our methods and results, in light of the question whether the current and possible future market situation of fortification may result in a folic acid or vitamin D intake that is too high, from a public health perspective. We end with our conclusions (chapter 5) and recommendations (chapter 6).
Table 1. 1: Overvi ew of cur rent legi sl ation concernin g addition of f olic acid
and vitamin D to foods
* Product Exceptio ns Directive/Date Level of forti ficatio n allo wed Source Title (E ng lis h/Dut ch) Folic acid prohibited (art icle 5 )
Foods and drin
ks Staatsblad 1999, 428 {#5015} ‘Warenw etbesl u it Toev o eg in g micro-vo edi n g sstoffen aan lev ensmidd el en’ Vitamin D prohibited (art icle 5 ) Max natural le ve l of product to b e substituted Substitution pr oducts Staatsblad 1999, 428 {#5015} ‘Warenw etbesl u it Toev o eg in g micro-vo edi n g sstoffen aan lev ensmidd el en’*
Vitamin D & Folic acid
(article 5 & 6.2 ) Spreadable fats Staatsblad 1999, 428 {#5015} Warenwetbesl uit Toevoegin g micro-vo edi n g sstoffen aan lev ensmidd el en'
Max 7.5 µg/100 grams (articl
e 5a) EC 2991/94 Pb EG L 316 Council Regulation (EC) N o 2 991/94 of 5 Decemb er 1994 laying down
standards for spreadable fats'
GZB/VVB/2037 714 (Staatsc ourant 25 January 2000, nr 17) Convenant vit aminering van smeerbare v et p roducten '
Vitamin D Folic acid
Max 100 µg/100 kcal (article 2.1.a)
Foods and drin
ks VGP/ VV 2742234{#1138}{#1139} ‘Warenw etreg eling v rijste llin g
toevoeging foliumzuur en vitamine D aan levensm
iddelen’
Vitamin D
Max 4,5 µg/100 kcal (article 2.1.b) Adjust to lev
el of energ y dense count erpa rts ‘Lig ht’ food products VGP/ VV 2742234{#1138}{#1139} ‘Warenw etreg eling v rijste llin g
toevoeging foliumzuur en vitamine D aan levensm
iddelen’
Folic acid and vitamin D
(article 2.2)
Folic acid
Max 50 µg/100 kcal (annex 1, 6.2)
Vitamin D
Max 3 µg/100 kcal (annex 1, 7)
Processed cereal- based food an
d baby
foods for i
n
fan
ts (-12
mo) and youn
g children (1-3 y r) 2006/125/EC{# 1138}{#1139}, article 1.2.a ‘’Commission Directive 2006/125/EC of 5 Decemb er 2006 on processed ce
real-based foods and baby foods
for infants and
young children'
*with relevance to this rep
o rt RIVM Let ter rep ort 35 00 90 00 6 11
Box 1: Calculation model,
model p
arame
ters and ass
u
mptions used to estimat
e the max imu m fortific ati on leve ls [4]
ris
k
-ass
ess
m
ent
ris
k
-manag
ement
MSFL = UL-(CI 95 +SI))/((EI 95 /1 00)*PFF n ) A F L eva lua ti on MSFL Max im um safe fortifi cat io n leve l per 1 00 kcal A F L A llow ed fortif icat io n l eve l p er 10 0 kca l (foli c ac id 10 0 µg / 1 00 kca l; vit am in D 4. 5 µg / 1 00 kca l) UL To le rab le up per i ntake lev el [ 7] CI95 Current in ta ke at the 9 5 th per cent ile of ha bi tua l m icronutr ien t i nta ke dis tribu ti on of n on -fortifie d fo od s (ba ck grou nd d iet), per ag e gro up ; base d o n dat a of D N F CS-3 (19 97-1 99 8) [8 ] SI Real isti c h ig h int ake sce nari o from food sup plem ents, c rude assum ptions base d o n [9,1 0] EI95 In ta ke at 95 th perce nti le of h abi tua l e nergy int ak e d istri bu ti on, p er ag e grou p, base d on dat a of D N FCS-3 (199 7-19 98) [8] PFF n Proporti on of the to tal en erg y inta ke tha t c om es fro m fortifie d fo ods; 1 0% ass um ed RIVM Let ter rep ort 35 00 90 00 6 122
Methods
2.1 Evaluation of the legislation on the food level
Foods fortified with folic acid or vitamin D and available on the Dutch market were identified and their fortification levels were compared with the current legislation.
2.1.1 Inventory of folic acid and vitamin D fortified products
In the Netherlands there is no central registration of fortified foods available on or introduced to the market. We used three databases to start the inventory on folic acid and vitamin D fortified foods: Dutch Food Composition Database (including additional food product data collected for recent and ongoing Dutch Food Consumption Surveys) [11], Innova database (commercial food product database) (www.innovadatabase.com), and Compendium dietary products and food supplements
(www.dieetconsult.nl). In all three databases we searched (February-April 2009) for foods containing folic acid or vitamin D as an ingredient on the declaration. Unfortunately, all databases are incomplete, especially foods recently launched, foods recently reformulated, and home brands are missing.
Therefore a supermarket inventory was conducted (March-April 2009) to complete the product evaluation as far as possible. This supermarket inventory was limited to the food groups identified in the database search, as we expected that the most important food groups were represented in the three databases. The eight supermarket chains with highest market share (2008) were visited (i.e. Albert Heijn, C1000, Aldi, Super de Boer, Plus, Jumbo, Dirk van den Broek, Lidl) (www.distrifood.nl), as well as two supermarkets with relative high contribution of foods in the Dutch Consumption Survey among young children (i.e. Coop, Spar) and two supermarkets with a low market share (2%) (i.e. Deen, Dekamarkt). Although the addition of vitamin D to spreadable fats and baking fats has an independent legislation [12,13], these food products were also taken into account in the inventory to be able to update the vitamin D levels. For all folic acid or vitamin D fortified foods, data were collected on product name, brand name, folic acid or vitamin D content, and energy content. Missing data were completed by searching for information on manufacturer websites or by contact with manufacturers. All data were collected on the basis of information provided on the label or by manufacturers; no chemical food analyses were conducted.
2.1.2 Evaluation of the fortification level in the identified products
All folic acid or vitamin D fortified foods found in the inventory were evaluated on amount of folic acid or vitamin D per 100 kcal and compared to the legal amounts (100 µg/100 kcal for folic acid; 4.5 µg/100kcal for vitamin D). For each food the declared amount of folic acid or vitamin D 100 g (or ml)
was divided by the amount of energy (kcal) per 100 g (or ml) times 100. The declared micronutrient amounts on the label are the total micronutrient content in the food product, not only the proportion added. As the legislation applies to the added part of micronutrients, the natural content of folate and vitamin D was estimated based on similar food products in the Dutch food composition database [11]. Using these corrected amounts, representing the added micronutrient content, the folic acid or vitamin D level per 100 kcal were calculated again and compared to the legal maxima.
If the actual fortification levels of the food products appeared to exceed the maximum fortification levels, we considered if they meet the definition of so-called ‘light’ products. Light products are defined as foods containing ≤ 30% less energy than energy dense counterparts. There is no clear definition on required similarity between the counterparts. Advice on whether or not a food could be stated as ‘light’ was obtained from the Dutch Food and Consumer Product Safety Authority (VWA). For the foods defined as ‘light’ the folic acid or vitamin D content per 100 kcal was also calculated using the energy content of energy dense counterparts and compared to the legal maximum fortification level.
2.2 Evaluation of the legislation on the intake level
In this study we used data of the Dutch National Food Consumption Survey among young children (DNFCS-kids) [14]. In brief, this survey was conducted in 2005-2006 among 1279 children aged 2-6 years old. Data were collected by means of a written general questionnaire and two food records on independent days (8-13 days in between). The food records were filled in by the care taker of the children; in pre-structured diaries all foods and drinks and food supplements consumed on that day were recorded. In addition, data of an extended version of the Dutch food composition database (NEVO) [11] and the Dutch supplement database (NES)[15] were used. For a small fraction of the foods, no vitamin values are available in the Dutch food composition database. For these products, values were set at zero.
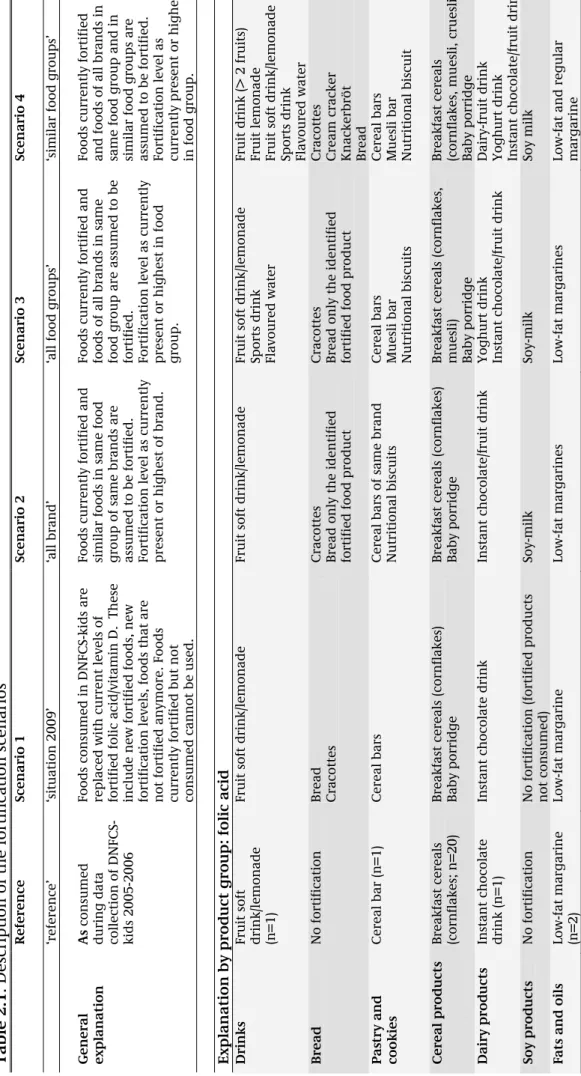
The general exemption for folic acid and vitamin D was not in force during the data collection of DNFCS-kids. Therefore, four different scenarios of fortification strategies were defined based on the results of the inventory (see below). These scenarios represent a realistic situation in 2009 up to a potential future, more worst-case, situation based on the current market situation (Table 2.1). The situation in 2005-2006 was taken as a reference. The first scenario is a representation of the situation in 2009. In the DNFCS-kids data all foods currently fortified with folic acid or vitamin D (and
consumed in DNFCS-kids) were identified based on brand name and product name. The micronutrient (folic acid or vitamin D) content of these foods was replaced by the levels that were applied in 2009. Foods fortified during DNFCS-kids and not fortified in 2009 were regarded as not fortified. For foods
fortified during DNFCS-kids and currently fortified with a different level, the micronutrient content was replaced by the content in 2009. Foods not consumed during DNFCS-kids were not taken into account in this scenario.
The second scenario, ‘all brands’, represents the situation where the current fortified foods are expanded with currently not fortified foods of the same food groups and same brands. For the foods currently not fortified, the highest fortification level of the same brand and food group was assigned, taking into account the legal maximum.
In the ‘all food group’ scenario (scenario 3), not only foods currently not fortified in same food group and with same brand, but also foods in the same food group of other brands are assumed to be fortified. For the currently not fortified foods, the highest fortification level in the same brand or product group was allocated, taking into account the legal maximum. For folic acid one exemption was made, bread (see below) was not taken into account in scenario 3 only in scenario 4, as this was considered as staple food.
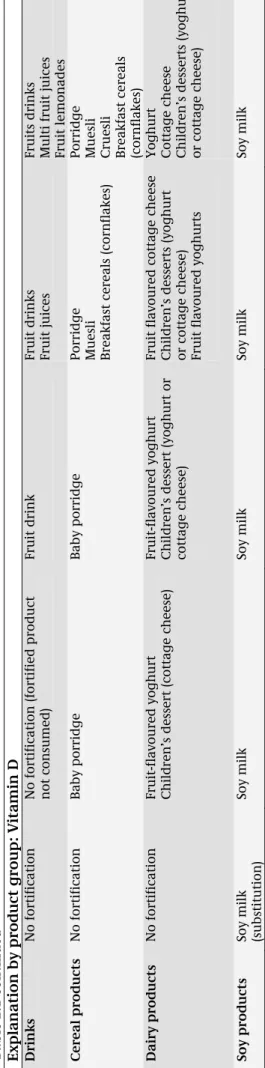
In scenario 4 (‘similar food groups’), not only foods in the same food group, but also foods in similar food groups are assumed to be fortified. For the currently not fortified foods, the highest level in the same brand, the same or a similar food group was assigned, taking into account the legal maximum. In all scenarios we assumed folic acid and vitamin D intake from food supplements to be the same as in the reference situation. Eventual reformulations since 2005-2006 were not taken into account. For vitamin D the current market situation of addition of vitamin D to spreadable fats and baking fats was applied in scenario 1 through 4 without changes.
Based on the consumption data of DNFCS-kids and the defined fortification scenarios the habitual folic acid and vitamin D intake was calculated for four age-gender groups (i.e. boys 2-3 yr, girls 2-3 yr, boys 4-6 yr, girls 4-6 yr). Data was corrected for within-person variation using ISU-method (IML-SIDE and C-SIDE) [16] and weighted for socio-demographic factors and season. The proportion of the children with intakes above the UL was also estimated using the cut-point method. The age-specific ULs set by the Scientific Committee on Food and the Scientific Panel on Dietetic Products, Nutrition and Allergies were used [7]
2.3 Evaluation of the model assumptions
In the model used to calculate the maximum fortification levels, input was needed for the following parameters (Box 1) [4]:
-the 95th percentile of habitual energy intake
-the 95th percentile of habitual folic acid or vitamin D intake
-folic acid or vitamin D intake from food supplements
-the fraction of the habitual energy intake that may and will be fortified.
For children, these parameters on habitual energy, folic acid, and vitamin D intake are based on out-dated food consumption data of the DNFCS-3 (1997-1998) [8]. Assumptions were made on the intake from food supplements based on scarce data [9,17]. The fraction of the total energy intake that may and will be fortified was rather arbitrary chosen and mainly based on the fact that a traditional Dutch dinner in general consists of fresh products like meat, vegetables and potatoes.
The different model parameters were recalculated using data of the DNFCS-kids and for the different fortification scenarios that were defined based on results of the inventory. A comparison is made between the old and recalculated parameters, and the maximum fortification levels of folic acid and vitamin D are recalculated for children aged 2-3 yr and 4-6 yr old. For each fortification scenario the proportion of the habitual energy intake originating from folic acid or vitamin D fortified foods was calculated and the proportion of the children with a fraction larger than the assumed proportion was estimated.
Table 2. 1. Descrip tion of the fortif ication scen ario s Referen ce Scenario 1 Scenario 2 Scenario 3 Scenario 4 ‘reference’ ‘situation 2009 ’ ‘all brand’ ‘a ll food group s’ ‘similar food g roups’ General explanation As co n sume d
during data col
lec tion of D N FCS-kids 2005-200 6 Foods co nsumed in DNFCS-ki ds are replaced with current levels of fortifie d fol ic a cid/vitamin D. These includ e new fo rtified f oods, n ew fortificat ion le
vels, foods that
are not fort ified a n ymore. Foo ds currently fort if ied but n o t consumed can n ot be use d. Foods current ly fortified and
similar foods in same food group of same brands are assumed to be
fortifie d. Fortificati o n l evel as currentl y present or hig h est of brand. Foods current ly fortified and foods of al l brands in same food g
roup are assumed to be
fortifie d. Fortificati o n l evel as currentl y present or hig h est in fo od gro up. Foods current ly fortified
and foods of all brands in same food g
ro u p and in similar food g roups are assumed to be fortifie d. Fortificati o n l evel as currently pres ent or hig h est in food g roup. Explanat ion by product group: folic acid Drin k s
Fruit soft drink
/lem
o
nad
e
(n=1)
Fruit soft drink/lem
o
nade
Fruit soft drink/lem
o
nade
Fruit soft drink/lem
o
nade
Sports drink Flavoured water Fruit drink (> 2 fruits) Fruit lemo
nade
Fruit soft drink/lem
o
nade
Sports drink Flavoured water
Bread No fortif icatio n Bre ad Cracottes
Cracottes Bread only the
identif ied fortifie d foo d product
Cracottes Bread only the identif
ied
fortifie
d foo
d
product
Cracottes Cream cracker Knackerbröt Bre
ad
Pastry and cookies
Cereal bar (n= 1 ) Cereal bars Cereal bars of same brand Nutritional b iscuits
Cereal bars Muesli bar Nutritional b
iscuits
Cereal bars Muesli bar Nutritional b
iscuit Cereal produc ts Breakfast c ereals (cornf lak es; n=20) Breakfast c ereals (cornflakes) Baby porridge B reak
fast cereals (cornf
lak
es)
Baby porridge
Breakfast c
ereals (cornflakes,
muesli) Baby porridge
Breakfast c
ereals
(cornf
lak
es, muesli, cruesli
) Baby porridge Dairy p rod uc ts Instant choc ol ate drink (n=1) Instant choc ol ate drink Instant chocol ate/fruit drink
Yoghurt drink Instant chocol
ate/fruit drink
Dairy-fruit dri
n
k
Yoghurt drink Instant chocol
ate/fruit drink Soy products No fortif icatio n No fortif icatio n (fortif ied pro ducts not c o nsumed ) Soy-milk Soy-milk Soy milk Fats and oi ls Low-fat margarine (n=2) Low-fat margarine Low-fat margarines Low-fat margarines Lo w-fat and re gul ar margarine 17 RIV M Lett er r eport 3 50 09 00 06
Table 2.1 continued Explanat ion by product group: Vit a min D Drin k s No fortif icatio n No fortif icatio n (fortif ied pro duct not c o nsumed ) Fruit drink
Fruit drinks Fruit juices Fruits drinks Multi fruit jui
ces Fruit lemo nades Cereal produc ts No fortif icatio n Baby porridge Baby porridge
Porridge Muesli Breakfast c
ereals (cornflakes)
Porridge Muesli Cruesli Breakfast c
ereals (cornf lak es) Dairy p rod uc ts No fortif icatio n
Fruit-flavoured yoghurt Children’s dess
ert (c
ottag
e ch
eese)
Fruit-flavoured yoghurt Children’s dess
ert (yoghurt or cottag e ch eese ) Fruit flav oured cottag e ch ees e Children’s dess erts (yoghurt or cot tag e che ese)
Fruit flavoured yoghurts
Yoghurt Cottag e chees e Children’s dess erts (yoghurt or cot tag e che ese) Soy products
Soy milk (substitution
) Soy milk Soy milk Soy milk Soy milk RIVM Let ter rep ort 35 00 90 00 6 18
3
Results
3.1 Inventory and evaluation of food products
3.1.1
Folic acid fortified products
139 folic acid fortified foods in 7 food groups were found in the inventory (Table 3.1). These foods were from 43 different brands. In the supermarket inventory, 54 folic acid fortified foods were found that were not found in the database inventory, mainly home brands but also new variants of fortified foods. 24 foods found in the database inventory were not or not anymore available in the supermarket. Largest amount of folic acid fortified foods (n=62) is in the food group ‘cereal products’; all fortified foods in this group are breakfast cereals. The food group ‘pastry and cookies’ is second with 26 fortified foods; these foods are mainly cereal bars. The food groups ‘drinks’ and ‘fats and oils’ have 20 and 19 fortified foods, respectively. Compared to the consumed folic acid fortified foods during DNFCS-kids (2005-2006) the number of food groups containing folic acid fortified foods hardly changed. In the current situation there is one additional food group with folic acid fortified foods: soy products. On the other hand, the number of folic acid fortified foods in each food group did expand. It should be noted however, that the number of fortified foods in DNFCS-kids is not based on the actual number of fortified foods on the market 2005-2006, but on the consumed foods. One dairy product fortified with folic acid in 2005-2006 is currently not fortified anymore.
3.1.2
Vitamin D fortified products
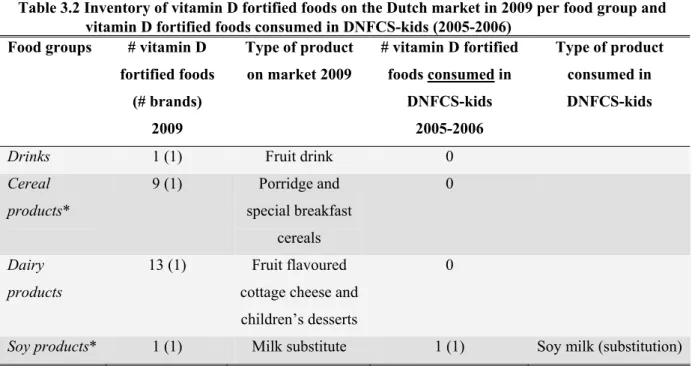
Our inventory identified four product groups containing 24 vitamin D fortified products in 2009 (Table
3.2): ‘drinks’ (1), ‘cereal products’(9), ‘dairy products’ (13) and ‘soy products’ (1). Most vitamin D
fortified foods were found in the database inventory or on manufacturer websites, only one product was additionally found in the supermarket inventory. Five foods (3 brands) found in the database inventory were not available (anymore) in the supermarket. Compared to the consumed vitamin D fortified foods during DNFCS-kids (2005-2006) the number of food groups containing vitamin D fortified foods increased from 1 to 4, the number of vitamin D fortified foods increased from 1 to 24 (excluding ‘fats and oils’). However, it should be noted that the number of fortified foods in DNFCS-kids is not based on the market situation in 2005-2006, but on the consumed foods.
Table 3.1 Inventory of folic acid fortified foods on the Dutch market in 2009 per food group and folic acid fortified foods consumed in DNFCS-kids (2005-2006)
Food groups # folic acid fortified foods
(# brands) – 2009
Type of product - on market 2009
# folic acid fortified foods consumed in DNFCS-kids – 2005-2006 (# brands) Type of product - consumed in DNFCS-kids
Drinks 20 (8) Fruit soft drink
Fruit drink Sports drink Sweetened water
1 (1) Fruit soft drink
Bread 4 (2) Bread cracottes 1 (1) White bread Pastry and cookies 26 (7) Cereal bars Cereal snacks Nutritional biscuits 1 (1) Cereal bar Cereal products 62 (15) Breakfast cereals (cornflakes) Baby porridge 20 (7) Breakfast cereals (cornflakes) Dairy products 6 (2) Yoghurt drink Instant chocolate/fruit drink 3 (1) Instant chocolate/fruit drink
Soy products 2 (1) drink 0
Fats & oils 19 (8) (low-fat) margarine 2 (2) Low-fat margarine
3.1.3
Amounts of folic acid in fortified products
The amounts of folic acid available from the database inventory often deviated from the levels declared on the label. The level of folic acid declared on the label varied from 15-500 µg per 100g. Five
products (bread and ‘pastry cookie’) did not have the level of folic acid declared on the label, and levels were provided by the manufacturers. The level of folic acid per 100 kcal, taking the levels declared on the label as being added synthetic folic acid, ranged from 3 – 267 µg/100 kcal. Thirty products had folic acid levels above the maximum of 100 µg per 100 kcal. Correction of the levels of folic acid declared on the label for estimates of natural folate present resulted in a range of 1 – 235 µg added folic acid per 100 kcal. After this correction 22 food products were left with folic acid levels above 100 µg per 100 kcal. There is an exception for ‘light’ food products (i.e. foods containing 30%
less energy than counterparts); these food products may contain similar folic acid levels as their energy dense counterparts. In the food group ‘fats and oils’ only low-fat margarines are fortified with folic acid, 9 have levels above 100 µg per 100 kcal. Low-fat margarines can be seen as light versions of margarine (containing 80% fat; about 720 kcal/100 g). In that case, the levels of folic acid fortification are below the legal maximum. The remaining food products with folic acid levels above the legal maximum belong to the food group ‘drinks’. Four of these drinks could be regarded as light-products with an easy to define energy-dense counterpart (i.e. exactly same food product) and contain folic acid levels below the legal maximum.
Ten other drinks, which cannot be regarded as light-products with an easy to define energy-dense counterpart (i.e. exactly the same food product was not available), contain folic acid levels of 155-235 µg per 100 kcal. A common energy dense soft drink (NEVO code 400) which has an energy content of 38 kcal/100 ml. Considering this energy content, six of the ten ‘drinks’ have folic acid levels below the legal maximum, three ‘drinks’ have folic acid levels just above the maximum level (105 µg / 100 kcal), one remains with too high folic acid levels.
Cereal products specifically for young children may contain at maximum 50 µg folic acid per 100 kcal ready-to-consume product (EC directive 96/5/EC), all cereal products for young children found in our inventory did have folic acid levels below this maximum (data not shown).
In summary, most of the folic acid fortified foods did contain folic acid levels at or below the legal maximum level of 100 µg per 100 kcal. Only one of the folic acid fortified foods contain folic acid levels way above the legal maximum level.
Table 3.2 Inventory of vitamin D fortified foods on the Dutch market in 2009 per food group and vitamin D fortified foods consumed in DNFCS-kids (2005-2006)
Food groups # vitamin D fortified foods (# brands) 2009 Type of product on market 2009 # vitamin D fortified foods consumed in DNFCS-kids 2005-2006 Type of product consumed in DNFCS-kids
Drinks 1 (1) Fruit drink 0
Cereal products* 9 (1) Porridge and special breakfast cereals 0 Dairy products 13 (1) Fruit flavoured cottage cheese and children’s desserts
0
Soy products* 1 (1) Milk substitute 1 (1) Soy milk (substitution)
*subject to exceptions to the general exemption law (see table 1)
3.1.4
Amounts of vitamin D in fortified products
The vitamin D level declared on the label varied from 0.1 to 16.5 µg per 100 grams or 100 ml. It is not clear what proportion of this amount is added to fortify the food product. The level of vitamin D ranged from 0.2 to 5.8 µg per 100 kcal. For two drinks containing vitamin D as an ingredient this could be regarded as restoration or substitution rather than fortification.
Four products had a vitamin D level above the legal maximum level of 4.5 µg per 100 kcal. One of these products (a drink) could be regarded as light product, and after correction for energy content, the legal maximum level was not exceeded anymore. It should be noted that this vitamin D fortified drink that was found in the supermarket in the first half of 2009 could not be detected on the website of the manufacturer or elsewhere in second half 2009. This product may be taken off the market. The other three food products with vitamin D levels (i.e. 4.8 µg per 100 kcal) above the legal maximum are breakfast cereals specifically for young children (aged 6, 8, or 12 months). The EU commission directive 2006/125/EG gives another legislation concerning ‘simple cereals which are or have to be reconstituted with milk or other appropriate nutritious liquids’ aimed at young children with a
maximum fortification level of 3 µg vitamin D per 100 kcal ready-to-consume product. This means that the amount vitamin D should be 3 µg/100 kcal or less in the porridge using the recipe on the label. In general, 20 grams of cereals will be combined with 200 ml follow-on formula, which results in about 3 µg per 100 kcal.
In summary, all vitamin D fortified foods available on the Dutch market have vitamin D levels at or below the legal maximum level of 4.5 µg per 100kcal.
3.2 Evaluation of intake: exceeding the tolerable upper intake level
3.2.1
Folic acid
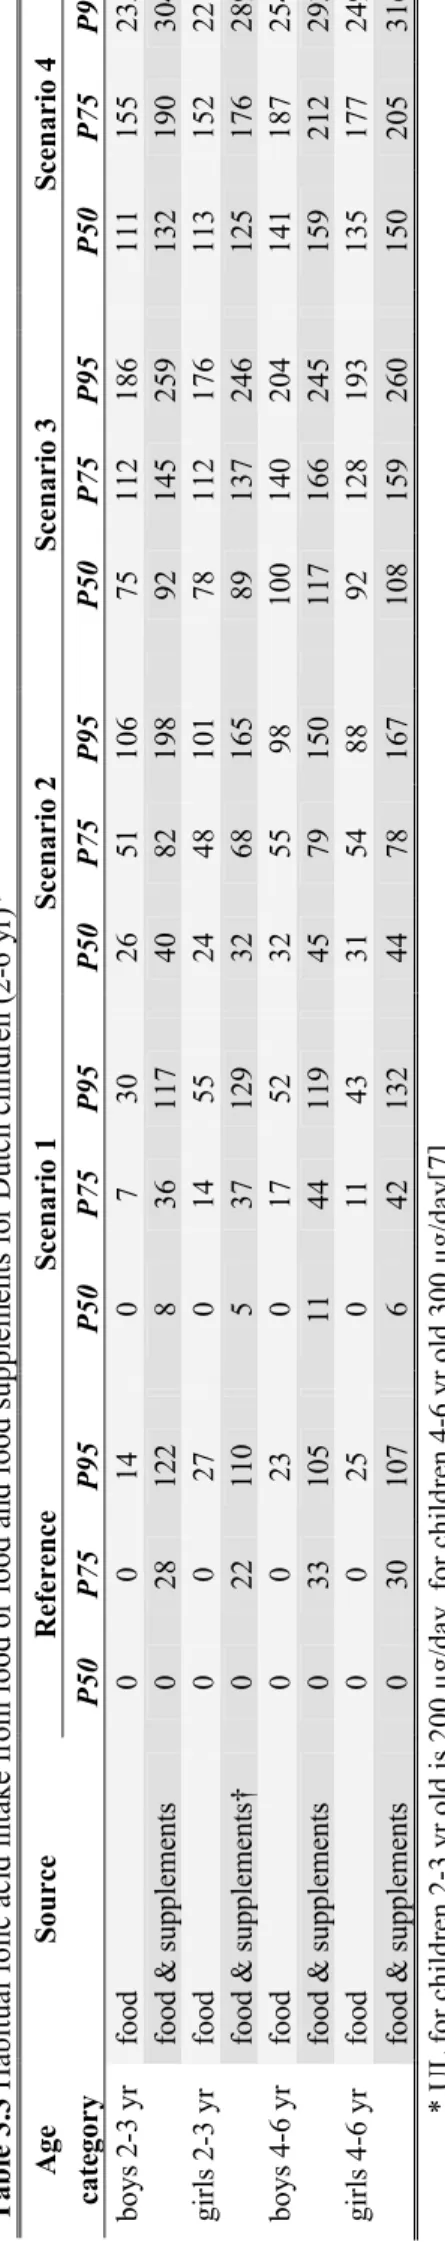
During DNFCS-kids (2005-2006) 16-24% of the young children (grouped as boys 2-3 years, girls 2-3 years, boys 4-6 years and girls 4-6 years) consumed folic acid fortified foods (data not shown). Of these, 36-44% children used folic acid fortified foods and or folic acid containing food supplements. At the 95th percentile the habitual folic acid intake ranged from 14-27 µg per day for the different age-gender groups (Table 3.3). For the consumers of folic acid fortified foods the 95th percentile of intake was somewhat higher and ranged from 29-60 µg per day (Annex A). Including the use of food
supplements, the habitual folic acid intake at the 95th percentile increased to 105-122 µg per day (Table
3.3) and 157-233 µg per day and for consumers only (Annex A). In general there are no large
differences in intake between the four age-gender categories.
In the first scenario, representing the situation in 2009, the percentage of the young children consuming folic acid fortified foods increased to 37-49% and to 57-66% for the combination of fortified foods and food supplements (data not shown). The 95th percentile of habitual folic acid intake from food only increased little to 30-55 µg per day, see table 3.3 (when looking at consumers only, this is 40-72 µg/day; annex A). When also taking into account the folic acid intake from food supplements, the habitual intake increased to 117-132 µg per day (for consumers only this is 145-184 µg/day). Increasing the number of fortified foods in scenario 2-4 resulted in a proportion of the young children consuming folic acid fortified foods of about 90% in scenario 2 ‘all brand’ to 100% in scenario 3 and 4 (data not shown). In the second scenario, ‘all brand’, the 95th percentile of habitual folic acid intake from foods ranged from 88-106 µg/day (when including food supplements this is 150-198 µg/day). In the ‘all food groups’ scenario (scenario 3) the habitual intake from foods increased to 176-204 µg/day at the 95th percentile (when including food supplements this is 245-260 µg/day). The habitual folic acid
intake from foods further increased to 221-254 µg/day at the 95th percentile in the fourth scenario, ‘similar food groups’, (when including food supplements this is 289-316 µg/day).
The folic acid intake from food supplements only at the 95th percentile was 100 µg/day for girls 2-3
years old, 200 µg/day for boys 2-3 years old, and 100 µg/day for children 4-6 years old. These results represent the mean intake over 2 days (as it was not possible to estimate habitual folic acid intake from food supplements only) and therefore are somewhat overestimated.
During DNFCS-kids (2005-2006) the habitual food folic acid intake of young children (2-6 yr) did not exceed the UL (Figure 3.1). Also in scenario 1, ‘2009’, and scenario 2, ‘all brand’, the UL was not exceeded. In the ‘all food groups’ scenario (scenario 3) 3-4% of the children aged 2-3 years exceeded the UL (i.e. 200 µg/d), in the group with older children (4-6 yr) there was no exceeding of the UL (i.e. 300 µg/d). In the scenario with the highest amount of fortified foods (scenario 4) the UL was exceeded by about 10% of the children aged 2-3 years and by about 1% of the children aged 4-6 years. When the use of folic acid containing food supplements was taken into account, a proportion of the Dutch young children exceeded the UL in all scenarios including the reference situation of DNFCS-kids (2005-2006). In the reference situation, up to 2% of the children in the different age-gender groups exceeds the UL. In scenario 1 and 2, this proportion increased up to 5%. In the third scenario, ‘all food groups’, 10-12% of the children aged 2-3 years and about 1-3% of the children aged 4-6 years had habitual total folic acid intakes above the UL. In scenario 4, ‘similar food groups’, these proportions increased to about 20% and about 5%, respectively.
In summary, children 4-6 years old are not at risk of too high folic acid intakes in the current situation (scenario 1 and 2 are most realistic). For the children 2-3 years old, the habitual folic acid intake from foods only does not exceed the UL in the current situation. However, the folic acid intake from food
supplements is high in this age group compared to the age-specific UL. The combined intake from food and food supplements results in up to 5% of the young children exceeding the UL in the scenarios for the current situation.
3.2.2
Vitamin D
During DNFCS-kids vitamin D fortified foods were not available on the Dutch market except for spreadable fats, baking products etc. The 95th percentile of habitual food vitamin D intake ranged from 3.0-3.7 µg/day for the different age-gender groups (Table 3.4), which is very similar. When including the use of food supplements, the habitual intake was higher and ranged from 4.9-10.0 µg/day. The vitamin D intake from food and food supplements was higher for the youngest children (2-3 yr) compared to the children aged 4-6 years. Parents in the Netherlands are advised to give their children a daily food supplement of vitamin D in addition to a healthy diet until they are 4 years old. In 2005-2006, the advised amount was 5 µg vitamin D. Recently this advice was revised and the amount was increased to 10 µg/day [18].
In the first scenario representing the situation in 2009 the 95th percentile of habitual vitamin D intake from food only increased a little to 3.3-4.1 µg per day (Table 3.4). The main increase was observed for the children aged 2-3 years old. When also taking into account the vitamin D intake from food
supplements, the habitual intake increased to 5.2-10.6 µg per day. Increasing the number of fortified foods in scenario 2, ‘all brand’, resulted in very similar intake compared to scenario 1: 3.4-4.3 µg/day from food only and 5.2-10.6 µg/day from both food and food supplements. In the ‘all food groups’ scenario (scenario 3) the habitual intake from foods increased more to 5.2-6.3 µg/day at the 95th percentile (including food supplements: 7.0-12.8 µg/day). The habitual vitamin D intake from foods further increased to 6.0-7.3 µg/day at the 95th percentile in the fourth scenario, ‘similar food groups’,
(including food supplements: 7.7-13.6 µg/day).
The vitamin D intake from food supplements only at the 95th percentile was 9 µg/day for children 2-3 years old and 3.1 µg/day for children 4-6 years old. These results represent the mean intake over 2 days (as it was not possible to estimate habitual vitamin D intake from food supplements only), and
therefore are somewhat overestimated.
For vitamin D the EFSA and the Health Council of the Netherlands have set different ULs. The UL set by the Health Council of the Netherlands is 50 µg/day [19], the UL set by EFSA is 25 µg/day [7] for children aged 2-6 years old. Comparison of the habitual vitamin D intake with the UL set by EFSA, the lowest value, showed that neither in the reference situation nor in one of the scenarios the habitual intake exceeded the UL.
Table 3. 3 H abit ual fol ic aci d i nta ke from food or fo od and fo od su pp le m ents for D utch ch il dren ( 2-6 y r)* Age Source Refere nce Scenari o 1 Scenari o 2 Scenari o 3 Scenari o 4 cate gory P50 P75 P95 P50 P75 P9 5 P5 0 P7 5 P9 5 P5 0 P7 5 P9 5 P5 0 P7 5 P9 5 bo ys 2-3 yr food 0 0 14 0 7 30 26 51 10 6 75 11 2 18 6 11 1 15 5 23 5 food & supp lemen ts 0 28 12 2 8 36 11 7 40 82 19 8 92 14 5 25 9 13 2 19 0 30 4 gi rl s 2-3 yr food 0 0 27 0 14 55 24 48 10 1 78 11 2 17 6 11 3 15 2 22 1 food & supp lemen ts† 0 22 11 0 5 37 12 9 32 68 16 5 89 13 7 24 6 12 5 17 6 28 9 bo ys 4-6 yr food 0 0 23 0 17 52 32 55 98 10 0 14 0 20 4 14 1 18 7 25 4 food & supp lemen ts 0 33 10 5 11 44 11 9 45 79 15 0 11 7 16 6 24 5 15 9 21 2 29 3 gi rl s 4-6 yr food 0 0 25 0 11 43 31 54 88 92 12 8 19 3 13 5 17 7 24 9 food & supp lemen ts 0 30 10 7 6 42 13 2 44 78 16 7 10 8 15 9 26 0 15 0 20 5 31 6 * UL fo r c hi ld re n 2-3 y r ol d i s 2 00 µg/ day , fo r c hi ld re n 4-6 yr ol d 30 0 µ g/ day [7] † refe rence res ults CSI D E ty pe 1 e rr or rate A -D test = 0 .0 1 (d efa ult = 0. 15 ) 25 RIV M Lett er r eport 3 50 09 00 06
boys 2 -3 ye ar s 0 5 10 15 20 25 Refe renc e Scen ari o 1 Scen ari o 2 Scen ari o 3 Scen ari o 4 perc enta ge ( %) food foo d & d iet ar y su pp le m ent s gi rl s 2-3 ye ar s 0 5 10 15 20 25 Refe renc e Scen ari o 1 Scen ari o 2 Scen ari o 3 Scen ari o 4 perc enta ge ( %) food foo d & d iet ar y su pp le m ent s boys 4 -6 ye ar s 0 5 10 15 20 25 Refe renc e Scen ari o 1 Scen ari o 2 Scen ari o 3 Scen ari o 4 perc enta ge ( %) food foo d & d iet ar y su pp le m ent s gi rl s 4-6 ye ar s 0 5 10 15 20 25 Refe renc e Scen ari o 1 Scen ari o 2 Scen ari o 3 Scen ari o 4 per centa ge ( %) food foo d & d iet ar y su pp le m ent s Figure 3. 1 Pe rcent age of D utc h c hi ldre n ( 2-6 y r) w ith ha bi tua l fo lic a cid in ta ke fro m food or fo od a nd f oo d su ppl em ents abo ve t he U L for different scenari os of foli c a cid fortif icat ion. RIVM Let ter rep ort 35 00 90 00 6 26
Table 3. 4 H abit ual v itam in D inta ke fro m food a nd f oo d su pp lem ents for D utc h c hi ldren (2-6 y r)* Source Refere nce Scenari o 1 Scenari o 2 Scenari o 3 Scenari o 4 Age cate gory P50 P75 P95 P50 P7 5 P9 5 P5 0 P7 5 P9 5 P5 0 P7 5 P9 5 P5 0 P7 5 P9 5 bo ys 2-3 yr food 1. 8 2. 2 3. 0 2. 1 2. 7 4. 1 2. 1 2. 9 4. 3 3. 1 4. 2 6. 2 3. 7 4. 8 6. 9 food & supp lemen ts 3. 9 6. 2 8. 7 4. 3 6. 6 9. 4 4. 4 6. 7 9. 6 5. 5 7. 8 11 .3 6. 1 8. 3 12 .0 gi rl s 2-3 yr food 1. 7 2. 2 3. 3 2. 0 2. 7 4. 1 2. 1 2. 8 4. 2 3. 0 4. 1 6. 3 3. 6 4. 9 7. 3 food & supp lemen ts 4. 4 6. 7 10 .0 4. 7 7. 0 10 .6 4. 8 7. 1 10 .6 5. 7 8. 2 12 .8 6. 3 8. 8 13 .6 bo ys 4-6 yr food 2. 1 2. 6 3. 7 2. 2 2. 9 4. 0 2. 3 2. 9 4. 0 3. 3 4. 3 6. 1 4. 0 5. 1 6. 9 food & supp lemen ts 2. 6 3. 7 6. 2 2. 8 3. 9 6. 5 2. 8 3. 9 6. 5 3. 9 5. 4 8. 2 4. 6 6. 2 9. 1 gi rl s 4-6 yr food 1. 9 2. 3 3. 0 2. 0 2. 5 3. 3 2. 0 2. 5 3. 4 3. 0 3. 8 5. 2 3. 6 4. 5 6. 0 food & supp lemen ts 2. 3 3. 1 4. 9 2. 4 3. 3 5. 2 2. 4 3. 3 5. 2 3. 4 4. 6 7. 0 4. 1 5. 4 7. 7 * U L for c hi ld ren is s et at 50 µg/ day by D utch H eal th Co unc il [19] a nd at 25 µg /day by EFSA [7] 27 RIVM Let ter rep ort 35 00 90 00 6
3.3 Evaluation of model assumptions: comparing old and new values
3.3.1
Habitual energy intake
The 95th percentile of habitual energy intake calculated from DNFCS-kids was for children 2-3 years old1725 kcal/day for girls and 1814 kcal/day for boys and for children 4-6 years old 1891 kcal/day for girls and 1977 kcal/day for boys. This is in the same order of magnitude as the 95th percentile of habitual energy intake used in the calculation model (based on data from DNFCS-3 (1997-1998)); for children 1-3 years old 1890 kcal/day and for children 4-6 years old 1995 kcal/day (girls and boys together). The differences can partly be explained by the difference in age group and by difference in methodology collecting the data among the surveys.
3.3.2
Folic acid-specific values and recalculation
3.3.2.1
Model parameters for folic acid
In the UL only synthetic folic acid is taken into account and not dietary folate, therefore dietary folate is not taken into account in the calculation model. Synthetic folic acid is naturally not present in the diet.
Based on DNFCS-kids, the 95th percentile of folic acid intake from food supplements is 106-135 µg per day (205-264 µg per day for food supplement users only) (Table 3.2). In the calculation model this intake was estimated at 300 µg per day, based on research from 2002 among toddlers [9] and levels of folic acid in food supplements specific for children available on the Dutch market [17]. This seems an overestimation. Taking into account some margin because of the relatively small number of users of food supplements, an amount of 150 µg seems a more realistic value.
It was assumed that up to 10% of the total energy intake would be consumed as folic acid fortified foods. In the reference situation (DNFCS-kids (2005-2006)), although folic acid fortification was not legal, several folic acid fortified foods were on the market. < 1% of the children had a proportion of the energy intake above 10%. In scenario 1 ‘2009’this increased to 0.8-5%, in scenario 2 ‘all brand’ to 4-10%, in scenario 3 ‘all food groups’ to 49-57%, and in scenario 4 ‘similar food groups’ to almost 100%. These results show that a fraction of 10% of the energy intake that will be consumed as folic acid fortified foods is currently occurring among young children (scenario 1 and 2 are most realistic for the current situation). With an increasing market more children will exceed this fraction of 10% and reconsideration of this fraction will be advised. Taking a fraction of 15%, that was originally applied in the calculation model, resulted in somewhat smaller percentage of the children exceeding this fraction:
reference ≤ 1%, scenario 1 ‘2009’ ≤ 2%, scenario 2 ‘all brand’ 0.7-4%, scenario 3 ‘all food groups’ 23-30%, and scenario 4 ‘similar food groups’ 97-98%. In conclusion, the fraction of 10% seems somewhat conservative for the current situation; a fraction of 15% seems a better estimate for the current situation as most children have currently intakes below this fraction.
3.3.2.2
Recalculation of the maximum fortification level for folic acid
Recalculation of the maximum fortification levels using the above described data results in a maximum fortification level of 28 µg per 100 kcal for children 2-3 yr and about 76 µg per 100 kcal for children 4-6 yr (intake from food supplements 150 µg, fraction 10%). Taking a fraction of 15%, the maximum fortification level becomes lower to about 20 µg per 100 kcal for children 2-3 yr and about 50 µg per 100 kcal for children 4-6 yr. In both situations the recalculated maximum fortification level is higher than the level estimated earlier [4], however still below the currently legal maximum level of 100 µg per 100 kcal, which is based on data of adults only.
3.3.3
Vitamin D-specific values and recalculation
3.3.3.1
Model parameters for vitamin D
Based on DNFCS-kids, the 95th percentile of habitual vitamin D intake from background diet
(including vitamin D added to spreadable fats and baking fats) ranged from 3.0 to 3.7 µg per day. This is lower than the 95th percentile of habitual vitamin D intake used in the calculation model: 4.8 µg/day for children 1-3 yr and 4.4 µg per day for children 4-10 yr. Similar as for habitual energy intake, the differences can partly be explained by the difference in age group and by difference in methodology collecting the data among the surveys.
In this model the 95th percentile of vitamin D intake from food supplements was estimated to be 10 µg,
based on research from 2002 among toddlers [9] and levels of vitamin D in food supplements specific for children available on the Dutch market [17] an amount of 10 µg seems indeed a realistic value for children 2-3 years old. For the older children (4-6 yr) a lower estimate of about 5 µg might be more realistic.
It was assumed that up to 10% of the total energy intake would be consumed as vitamin D fortified foods (excluding spreadable fats and baking fats). In the reference situation (DNFCS-kids (2005-2006)), vitamin D fortification was not legal and also not applied. In scenario 1 ‘2009’ < 1% of the children had a proportion of the energy intake from vitamin D fortified foods above the fraction of 10%. In scenario 2 ‘all brand’ this increased to almost 2%, in scenario 3 ‘all food groups’ to 3-10% and in scenario 4 ‘similar food groups’ to 8-23%. For the current situation (scenario 1 and 2 are most
realistic) a fraction of 10% seems adequate, however when the market will increase a little higher fraction should be considered. Taking a fraction of 15%, in scenario 4 ‘similar food groups’ < 5% of the children had a proportion of the energy intake from vitamin D fortified foods above 15%. The proportion of the children exceeding the fraction is higher for the youngest age group, this might be due to the fortification of breakfast cereals specific for these young children, and although these products have their own legislation, they were taken into account in these calculations.
3.3.3.2
Recalculation of the maximum fortification level for vitamin D
Recalculation of the maximum fortification level 6.4-7.0 µg per 100 kcal is calculated with the model for children 2-3 years old, and 8.6 µg/100kcal for children 4-6 yr old. Both values are higher than the currently legal maximum level of 4.5 µg per100 kcal. It should be noted that the age groups used for this recalculation are different from the age groups used in the model setting the maximum levels, new consumption data of children aged 7-10 years old are not available yet. These results indicate that the maximum level of 4.5 µg per 100 kcal [4] seems conservative, however the proportion of energy intake from vitamin D fortified foods (excluding spreadable fats and baking fats) of 10% might be rather low with increasing market. Taking a proportion of energy intake from vitamin D fortified foods of 15%, instead of 10%, the recalculated maximum level is 4.3-4.6 µg/100 kcal for children 2-3 years old and 5.7 µg/100 kcal for children 4-6 years old. The result is a similar maximum fortification level.
4
Discussion
4.1 Product inventory
The results of our inventory show that the market of folic acid and vitamin D fortified foods increased since the new legislation [2]. Unfortunately, an up-to-date database of fortified foods, including the fortification levels, on the Dutch market is not available. Lack of these data makes it difficult to evaluate the legislation on the exemption of fortification with folic acid and vitamin D. In the current evaluation study, several incomplete databases were searched for folic acid and vitamin D fortified foods. In these databases mainly the recently launched fortified foods and home brands were missing. To fill this gap, an additional supermarket inventory was conducted. Such a supermarket inventory is very time-consuming and labour-intensive. Therefore we limited our supermarket inventory mainly to the supermarkets with the highest market shares and we visited only one store per supermarket chain. In addition, we restricted the supermarket inventory to the product groups in which folic acid or vitamin D fortified foods were identified in the database search. These limitations may have resulted in an incomplete overview of folic acid and vitamin D fortified foods on the Dutch market. Although we might have missed some food groups or specific foods, as we have searched in three independent databases and did visit the main supermarkets, we do think that we have identified the main food groups containing folic acid or vitamin D fortified foods.
Based on our experience we would recommend having an up-to-date database on fortified foods and food supplements available on the Dutch market. The food database is currently under development by the National Institute of Public Health and the Environment (RIVM) and the Nutrition Centre. It will be filled with product information from the manufacturers and might be a helpful instrument for
monitoring.
4.2 Food consumption and composition data
In this evaluation study we used data of the Dutch National Food Consumption Survey among young children. These data were collected in 2005-2006 in the period before the change of the legislation on fortification with folic acid and vitamin D [2]. It was therefore not possible to directly evaluate the model assumptions and proportion of children exceeding the UL. We therefore had to define several scenarios of potential situations of fortification. The results of the inventory were the basis of the definition of the scenarios. Although none of the scenarios will exactly represent the current market situation, the first and second scenarios are thought to be most close to this situation. The third and
fourth scenario present the situation of a continuing increase in folic acid or vitamin D fortified foods in similar type of foods as currently fortified. These scenarios did not take into account the situation in which the type of food products fortified will change. With data of new DNFCS, e.g. DNFCS-basic that is currently conducted, it will be possible to evaluate this legislation more directly.
The estimated proportion of children exceeding the UL as well as the habitual intakes are based on a sample of young children from the Dutch population. This sample is considered representative (if weighted) for the Dutch population of young children (excluding children of non-Dutch speaking parents/caretakers) on age, gender, education level of household head, region of residence, population density and season. However, this is no guarantee that the study population is representative for e.g. lifestyle factors.
The food composition database had a small number of NEVO-codes with missing data for vitamin D or folate levels. We assumed these values to be zero. This might have resulted in a small underestimation of total vitamin D intake and an overestimation of the fraction added as folic acid. However, the data were complete for the most important sources of these micronutrients, indicating that the respective underestimation and overestimation is low. We believe that the current calculations do give a good picture of the intake and the potential risk of exceeding the UL. We did not chemically analyse foods to obtain the folic acid or vitamin D levels, but used data declared on the label or provided by
manufacturers. In general, no information on possible overages was available. When overages are applied in fortification, depending on the decline of the micronutrient over time, the declared amounts will be an underestimation of the true amounts.
The amount of micronutrients presented on the label is the total amount in the food. The level of micronutrient naturally present and the level added with fortification can not be distinguished. Especially for folic acid this was difficult as the legislation [2] is based on folic acid only. Based on manufacturers information we assumed that the amount declared on the label is the sum of natural folate and added folic acid without correction for differences in bioavailability. We estimated the level of folate from the folate levels presented in NEVO for similar foods. This assumption might cause an over- or underestimation of the added folic acid; however the order of magnitude will be correct. It is recommended that when the amount of folate is declared on the label, it is also stated how much of this total folate consists of folic acid. Especially as the UL is also only based on folic acid.
4.3 Food supplements
In this evaluation study we did take into account the micronutrient intake from food supplements. We used the food supplement composition data of 2005-2006 and did not check whether this composition changed in 2009.
For folic acid the intake from food supplements was above the UL in part of the young children (2-3 yr). It is not known if this is due to the intake of multiple food supplements and/or to the use of dietary supplements containing folic acid levels not suitable for children of this age. For 2010 it is planned to study the micronutrient intake from food supplements in more detail.
Based on DNFCS-kids we estimated the vitamin D intake from food supplements. In 2005-2006 it was recommended for children up to 4 years old to daily use a food supplement containing 5 µg vitamin D. Recently the Health Council of the Netherlands revised this recommendation and increased the amount to 10 µg vitamin D per day. The vitamin D intake from dietary supplements might therefore be an underestimation of the actual situation. When the vitamin D intake will be higher the maximum fortification level will decrease.
4.4 Maximum fortification levels
For the comparison the actual fortification levels and the set maximum fortification levels the
exemption for light food products had to be taken into account. In the current legislation the description of the demands of similarity between a light-food product and the energy dense counterpart are vague. On what level is similarity required? Is a general soft drink a counterpart of a sports drink or water-like drink or is more similarity needed? If we make the comparison using very strict guidelines for
similarity (exact same food), ten foods in the product group ‘drinks’ had folic acid levels above the legal maximum level. However, applying less strict guidelines for similarity (i.e. general product group) only one of these drinks remained to have folic acid levels way above the legal maximum (three drinks had folic acid levels slightly above the maximum level). This shows that the proportion of foods with too high fortification levels depends on the applied guidelines for similarity in the comparison of light food products with energy dense counterparts.
The currently legal maximum fortification levels for folic acid and vitamin D are calculated with a calculation model using several assumptions and input data based on DNFCS-3 (1997-1998) [8]. Using the data of DNFCS-kids and the results of the inventory, we evaluated these assumptions. DNFCS-kids and DNFCS-3 are conducted with different methodology and therefore differences in outcome are not only caused by differences in dietary pattern over years.
The habitual energy and vitamin D intake was somewhat lower in DNFCS-kids, however in the same order of magnitude as estimated from DNFCS-3.
The model assumption of the 95th percentile of folic acid intake from food supplements was overestimated. Based on the intakes observed in DNFCS-kids, lower levels seem more valid. For vitamin D, the intake from food supplements seem overestimated for children aged 4-6 years. However, due to the recent change in the recommendation of daily use of a food supplement containing higher
vitamin D levels, the vitamin D intake as estimated with data of DNFCS-kids might be an underestimation, especially for the young children (2-3 yr). In addition, the fraction of the energy intake that may and will be fortified was estimated at 10% in the calculation model [4]. Based on the results of our scenario calculations, this 10% seems rather conservative for folic acid and borderline accurate for vitamin D. This shows that it is difficult to make accurate assumptions on input data for the model if actual data is missing or poor. It is important to evaluate such input data regularly with the newest data available, to keep the maximum fortification levels indeed safe for virtual the whole population.
4.5 The tolerable upper intake level
The UL for folic acid for children is extrapolated from adults. For adults this UL is based on the masking of vitamin B12-deficiency. When medics are aware that not only the haematological picture
has to be taken into consideration diagnosing vitamin B12-deficiency, but also the actual measurement
of vitamin B12 status this risk will diminish. Furthermore, vitamin B12-deficiency is mainly a problem
of the elderly [7]. Other potential harmful effects, like the risk of exacerbation of existing cancer, might be more relevant in setting the UL [5,6,20,21]. However, it was not possible to set the UL for folic acid based on other end points [7]. As soon as it is possible to take these other end points into account, the UL for folic acid should be revised, especially for children.
For vitamin D there are two different ULs for children which are set based on the same scientific data. The Health Council of the Netherlands set an UL of 50 µg per day [19], the EFSA of 25 µg per day [7]. In our study we used the lowest UL as cut-off point in the calculations. With this low level we did not observe a risk of exceeding the UL. Although for our study the results did not change applying one or the other value, if the model calculating the maximum fortification level the UL set by the Health Council of the Netherlands was used [19]. Applying the UL set by EFSA, the maximum fortification level will be much lower (more than half). For these calculations it is important that ULs are set accurately. It is noted that for a similar population and based on same scientific data, the resulting UL values are not similar. However, the EU is more and more using the EFSA values.
4.6 EU legislation
Recently, within the EU two legislations concerning fortified foods (EC 1925/2006) and food
supplements (2002/46/EC) became into force. These legislations regulate what micronutrients (and in what chemical form) may be applied in food supplementation or fortification (EC 1170/2009), as well as the minimum and maximum levels that may be applied. The actual maximum (and minimum) levels