Evaluation of the
Water Framework Directive
in the Netherlands;
Evaluation of the
Water Framework Directive
in the Netherlands;
© Netherlands Environmental Assessment Agency (PBL), Bilthoven, September 2008 PBL publication number 500140004
W. Ligtvoet, G.P. Beugelink, R. Franken Contact
Willem Ligtvoet: Willem.Ligtvoet@pbl.nl ISBN 978-90-6960-215-8
You can download the publication from the website www.pbl.nl/en or request your copy via email (reports@pbl.nl). Be sure to include the PBL publication number.
Parts of this publication may be reproduced, on condition of acknowledgement: ‘Netherlands Environmental Assessment Agency, the title of the publication and the year.’
Netherlands Environmental Assessment Agency. P.O. Box 303 3720 AH Bilthoven T: +31 30 274 27 45 F: +31 30 274 44 79 E: info@pbl.nl www.pbl.nl
Contents
Contents
Summary 5 1 Introduction 9
2 WFD implementation: challenges for the Netherlands 13 3 Main findings of the WFD ex-ante evaluation 19
Summmary
Summary
Evaluation of costs and benefits of the measures proposed by the Dutch water authorities
Just as all the other European Member States, the Netherlands also has the obligation to implement the European Water Framework Directive (WFD). At the request of the Dutch Ministry of Transport, Public Works and Water Manage ment, the Netherlands Environ-mental Assessment Agency (PBL) has executed a cost-benefit analysis and has evaluated the ambition level regarding the proposed WFD package of measures for improving the ecological quality of the Dutch surface waters. The WFD package of measures encom-passes both the measures for the large national water bodies, as proposed by the national water authority (RWS), and the measures for the regional water bodies, proposed by the regional water authorities.
Extra costs of measures for WFD implementation are estimated at 2.9 billion euros
Investments in the complete RWS/regional package of measures total around 7.1 billion euros, to be spent during the 2007 - 2027 period. An estimated two thirds of the invest-ments in the total package of measures is based on standing and already proposed policies. The extra investments for the WFD implementation are, thus, estimated at 2.9 billion euros. Of the total of 7.1 billion euros, the regional water boards are accountable for 5.4 billion euros, and the national water authority for 1.7 billion euros. The annual costs to society of the total RWS/regional package of measures, once all investments have been made, will come to 390 million euros per year, from 2007 till 2027. About 60% of these costs are to be paid by the water boards, 15% by the municipalities and 15% by the national water authority.
The extra expenses per household rise 0,7% annually during the 2007 – 2027 period; one third of this as a consequence of the WFD implementation.
Proposed measures focus on reaching ecological targets in 2027
Both the regional and national measures are to be implemented in phases. Between 65 and 70% of the total investment is expected to be made during the 2007 - 2015 period, which in fact means that the option of postponing the deadline for achievement of the targets by two six-year periods, until 2027, has been anticipated. The question is whether the expected increase in charges could be considered disproportionate and could, there-fore, be sufficient reason for legitimising phased implementation up to 2027. Which level of ambition and effort the European Union will consider to suffice, is still uncertain.
Ecological targets will not be reached
For the regional waters, it is estimated that a maximum of 30 to 50% of the targets for WFD-relevant species groups could be achieved in 2027. When following the ‘one out - all out’ principle, an even significantly lower number of targets could be achieved. It, thus, seems improbable that the proposed targets for the regional waters can be achieved, by 2027. For the larger national waters, it is concluded that the proposed targets may be within reach, with the exception of the natural coastal waters. The package for the national and regional waters contributes only to some extent to the realisation of the required water conditions for internationally determined nature and biodiversity areas (Natura 2000). Presenting the currently proposed targets for the regional waters to Brussels, may involve the future risk of failing to meet this obligation. This risk may be reduced by adapting the targets in a more realistic way for 2015 and 2021, based on the results of a monitor-ing programme, evaluatmonitor-ing the effects of the measures.
Further improvement: design measures and ecological fish stock management most cost-effective
To obtain further ecological improvement and to reach more targets in the period up to 2015 or 2027, a number of additional design measures can be taken, the most cost-effective of which in streams/rivers, waterways/canals and ditches and in the ecological management of fish stocks (especially bream) in lakes. In 2027, it is expected that around 75% of the nutrient load of the regional waters will be derived from agricultural land. It is difficult, however, to reduce the nutrient load to regional surface waters, because of large amounts of nutrients which have accumulated in agricultural soils. The implementation of effect-oriented measures, such as helophyte filters, may significantly reduce the nutrient load, but the quantitative effects are still uncertain and the costs to the agricultural sector potentially high. However, reduction of the nutrient load is also important in mitigating the effects of climate change (the increasing risk of eutrophication). A more ambitious policy on manure use − such as a phosphate stop on phosphate saturated soils − as formu-lated in current recommendations, will be necessary to prevent further accumulation of phosphate in the soil and to reduce the nutrient load to surface waters, in the long run.
Benefits appeared difficult to be monetised; ecological quality is primary benefit of WFD
Improving ecological quality is the primary objective and, therefore, the most significant and desired benefit of the WFD. This benefit could not be monetised in this report due to a lack of underpinning evidence in available studies. A broad assessment of available studies concerning potential secondary and monetary benefits, such as effects on recrea-tion, health and the fisheries sector, revealed that these benefits are either negligible or difficult to underpin with reliable data. Therefore, a full cost-benefit analysis could not be made. Nevertheless, the undeniable ecological benefits, resulting from the proposed measures, have been made clear, as well as the measures which are significant to producing these benefits, including the costs involved. This study also elaborates which additional measures would make an important contribution to the further improvement of the ecological quality.
Summmary
Regulation costs WFD policy estimated at 300 to 350 million euros, between 2000 and 2009
In the Netherlands, many institutions are involved in water management. It is estimated that, on a yearly basis, over 400 FTEs (which represent about 45 million euros) are involved in the process of implementing the WFD. Another 45 million euros is spent, yearly, on research, engineering and the development of techniques and tools. The so-called regulation costs of the WFD amount to 300 to 350 million euros, between 2000 and 2009. That is about 10 to 12% of the total investment in WFD measures.
Introduction 1
Introduction
1
The aim of this study and the policy process
The Netherlands has the obligation to implement the European Water Framework Directive (WFD) as have all other European Member States. As an important step in this process, draft River Basin Management Plans (RBMPs) will be published at the end of 2008, followed by the final version at the end of 2009. In these plans, the govern-ment will describe how the Netherlands intend to achieve the WDF targets, based on the proposals by the 26 regional water authorities and the Directorate-General for Public Works and Water Management (RWS), responsible for the quantity and quality of the large(r) national water bodies, such as the main rivers and the coastal zone. The primary targets of the WFD are to achieve chemically clean and ecologically healthy surface water and chemically clean groundwater and to ensure that there is sufficient groundwater available for the needs of terrestrial nature. According to the WFD system, the quality of all surface waters should, officially, carry the qualification ‘good’, formally by 2015 but, on postponing the deadline by two six-year periods, by 2027 at the latest.
The Directorate-General for Public Works and Water Management (RWS) and the regional water authorities drew up a series of measures in 2007, to be implemented in the 2007 - 2027 period, to realise the targets of the WFD in national and regional water bodies, the so-called RWS/regional package of measures. Although the decision-making process of the regional water boards and the RWS is not yet complete, meaning that the targets and measures may yet be subject to further change in some areas, the PBL has carried out an assessment at the request of the Directorate-General for Water Affairs, focusing on providing an overview of the costs, the future effects of the proposed meas-ures and the extent to which the targets could be achieved (PBL, 2008). This WFD ex-ante assessment aims to provide information for the debate in the Dutch House of Representa-tives, concerning implementation of the WFD and the proposed ambition level, as set out in the draft river-basin management plans.
Scope of the Water Framework Directive ex-ante assessment
Focus on ecological quality of surface waters
The proposed package of measures is, primarily, comprised of measures focusing on the ecological targets of the WFD, through the restoration and (re)design of water systems and the reduction of nutrient emissions to surface waters. This is, therefore, where the emphasis lies in this assessment. As far as the chemistry of surface water and ground-water is concerned, the assessment is restricted to providing information concerning the current state in relation to the environmental quality targets.
Analysis outline ex ante assessment Water Framework Directive
RWS/regional package and variants
Effects of prosperity
Assessment
Social cost (euros) Social benefits
Ecological effects
Benefits which can be monetised
User value ecosystem (euros and qualitative)
No user value ecosystem (changes in ecological quality) Changes in Environmental conditions: - Nutrient levels - Physical design
Changes in Ecological quality: - Algae - Water plants - Macro fauna - Fish Ecological quality - Ambition targets - Target range 2027 - Synergy other targets Water Policy 21st Century (WB21), Natura 2000, Ecological Network
SCBA
(Social Cost Benefit Analysis) Division of costs/burdens: - Who pays
- Who benefits
Figure 1 General structure of WFD ex-ante assessment.
The primary targets of the WFD ex-ante assessment are (Figure 1):
to provide information on the ecological effects, expected achievement of targets and •
the costs and benefits of the proposed RWS/regional package of measures, and the resulting cost to citizens and businesses
and to indicate to what extent the reduction of the nutrient load to surface waters can •
contribute to an improvement in ecological water quality and the costs thereof. WFD measures difficult to distinguish in package of measures
Many of the proposed measures in the RWS/regional package contribute to both WFD targets and targets which fall under other policy areas, such as the Dutch Water Manage-ment in the 21st Century (WB21), the European Birds and Habitats Directives (Natura
2000 areas), the Nitrates Directive and the Bathing Water Directive.
As information about the links between specific measures and the relating policy field was lacking in the proposed package, it was difficult to distinguish WFD measures from measures based on standing water policy or on other policy fields. Therefore, in deter-mining the effect of the package of measures on the ecological quality, those measures
Introduction 1
which fall under standing and/or proposed policies and measures which can be consid-ered specific to the WFD, had to be treated as one. However, based on additional infor-mation, a rough estimate is made of the particular costs of the package which can be attributed to the WFD and to standing water policy or to other policy fields.
Monetising benefits appeared difficult; primary benefit of the WFD is ecological quality The preamble to the Water Framework Directive states that ‘water is not a commercial product like any other but, rather, a heritage which must be protected, defended and treated as such’. Therefore, the WFD focuses on the protection and management of all European waters and includes the complete system, from source to sea and from salt water to freshwater. Improving ecological quality is the primary objective of the WFD and, therefore, the most important desired benefit of the RWS/regional package of meas-ures. This benefit is not quantified in this study, due to a lack of evidence in the studies available. Other, secondary benefits considered in other studies, including effects on recreation, health and the fisheries sector, turn out to be either negligible or difficult to justify.
Due to the lack of reliable estimates of the monetary value of various benefits, it has not been possible to conduct a complete cost-benefit analysis. Nevertheless, the undeniable ecological benefits of the RWS/regional package have been made clear, as well as the measures which are significant in producing benefits, the costs that they involve and the additional measures that would make an important contribution to the further improve-ment of the ecological quality.
WFD implementation: challenges for the Netherlands 2
WFD implementation: challenges
2
for the Netherlands
The Netherlands is an artificial country, consisting largely of man-made water bodies
Around 40% of the area of the Netherlands is found below sea level. Low-lying areas are made habitable with man-made constructions like dikes, sluices and pumps and major alterations in the natural morphology and hydro-dynamics of water courses. An extensive network of ditches (approximately 300,000 km) and canals has been created to ensure adequate drainage of low-lying land. Moreover, canals have been dug and rivers canalised for transport purposes. Consequently, a large proportion of the water bodies in the Netherlands are what the WFD characterises as ‘heavily modified’ or ‘artificial’ (Figure 2). The only large body of water designated as a ‘natural water body’ is the coastal zone, including the Wadden Sea in the north.
Status national and regional waters 2007
Status
Heavily modified Artificial Natural
High environmental pressure
The Netherlands has the highest density of population, industry, livestock and transport in Europe. Precisely because of the pressures this imposes, the Netherlands is required to take technical measures that usually go beyond what is, on average, necessary in the European Union (EU) to meet European environmental quality standards. The burden posed on soil, groundwater, surface water and nature in the Netherlands, is currently the highest in Europe, due to acidification, nitrogen and phosphorus. These areas, in particular, pose diffi-culties for the Netherlands in meeting EU requirements (e.g., RIVM/MNP, 2004; MNP, 2005). The intensity and environmental impact of Dutch agriculture per hectare are high,
compared to other countries, both in Europe and elsewhere (e.g., MNP, 2006). The high cost of land and labour are offset by the high level of productivity per hectare and by labour productivity. The intensive forms of agriculture in the Netherlands have led to the highest level of over-fertilisation with nitrogen and phosphate in the EU and to the intensive use of pesticides. In certain other areas of Europe, where intensive livestock farming is also prac-ticed, the nitrogen surplus per hectare is generally 30 to 50% of the surplus in the Nether-lands. Although the nitrogen surplus in the Netherlands declined, substantially, between 1998 and 2002, compared to the other EU countries, it is still the highest (Figure 3).
Nitrogen surplus EU member states (EU 15), 2001
N k/ha per year < 25 26 - 50 51 - 75 76 - 100 101 - 150 151 - 200 > 200
Figure 3 Regional nitrogen surplus in 2001 for EU15, calculations based on the Capri data-base (EC, 2007).
WFD implementation: challenges for the Netherlands 2
This is also the case for phosphorus (MNP, 2007). Concerning phosphorus, the situation in the Netherlands is also characterised by a large area of phosphate saturated agricul-tural soils, due to the accumulation of phosphorous over the last decennia.
In the period between 1992 and 1998, the area of phosphorus saturated soils was esti-mated at 56% of the total agricultural area (MNP, 2007).
In the present situation, due to the emission levels of nutrients, only 30 to 50% of the regional freshwater bodies reach the standards for the Good Ecological Situation (GES) (Figure 4). Current ecological quality of surface waters mostly moderate; good conditions are rare Measured against the WFD standards for water plants, macro fauna and fishes, the current ecological quality of regional fresh surface waters included in the study (streams, lakes, ditches and waterways/canals) are largely classified as ‘moderate’ or ‘inadequate’. For these species groups, in only 5% of the regional waters the status is classified as ‘good’. For algae, though, a good status was found in about 50% of the regional waters. The current ecological quality in regional waters (2000-2005) is presented in Figure 11.
Streams Canals Lakes Ditches Brackish waters 0 20 40 60 80 100 % Very good Good Moderate Inadequate Poor Nitrogen
Concentration of nutrients in regional waters 2000 - 2005
Streams Canals Lakes Ditches Brackish waters 0 20 40 60 80 100 % Phosphorus
Just as for the regional waters, the ecological quality of many of the national waters is also classified as ‘moderate, ‘inadequate’ or ‘poor’ for all WFD-relevant species groups, with the exception of algae. For water plants, macro fauna and fishes, the status of the water bodies is classified as ‘good’ in about 10 - 15%; for algae this is about 65%. The current ecological quality in national waters (2003-2006) is presented in Figure 12.
Text box WFD standards for ecological quality Following the WFD procedures, the ecological targets for various water bodies are derived from so-called refer-ence situations, being the almost undisturbed situation with natural hydro-morphological conditions and natural concentrations of nutrients and substances. The ecologi-cal quality is presented in terms of the “Ecologiecologi-cal Quality Ratio” (EQR). The ecological quality of natural waters represents an EQR of 1 (Figure 5, left panel).
The ecological quality of surface waters is determined, based on four species groups in the WFD system: algae (phytoplankton), water plants (macrophytes), macro fauna (‘small aquatic animals’) and fishes.
In the Netherlands, standards have been developed for these species groups (the Ecological Quality Ratio, EQR), based on a natural reference condition. It has been agreed in the Dutch National Consultative Committee on Water that the status of natural waters (i.e. the Wad-den Sea and some streams) and heavily modified waters (rivers, streams, lakes) is to be indexed by using these standards, based on the natural reference situations. The Good Ecological Status (GES, with an EQR of 0.6 as the lower limit) is an important reference point. The status of artificial water bodies (waterways and canals) is indexed, based on a chosen set of values for the Good Ecological Potential (default GEP, lwith an EQR of 0.6 as the lower limit; Figure 5, right panel).
Standards ecological quality of the Water Framework Directive
0 0,2 0,4 0,6 0,8 1 EQR
Natural and heavily
modified waters Artificial waters
GES VGES 0 0,2 0,4 0,6 1 EQR MEP GEP
EQR = Ecological Quality Ratio
MEP = Maximum Ecological Potential GES = Good Ecological
State
GEP = Good Ecological Potential VGES =Very Good Ecological
State Very good Good Moderate Inadequate Poor
Figure 5 Standards for determining the ecological quality, based on the standards for natural and heavily modified waters (left panel) and artificial waters (right panel). For the natural and heavily modified waters classes of Ecological Quality Ratio (EQR) are fixed, using five colours and qualifications, ranging from ‘very good’ to ‘poor’. Classes for artificial waters are not fixed and are represented by only four colours and qualifications.
The WFD uses four species groups for assessing the ecological quality. For the final qualification of the eco-logical status of a water body, the WFD uses the ‘one out - all out’ principle.
This means that if even only one species group is below target quality, the water body will be classified according to this species group.
WFD implementation: challenges for the Netherlands 2
Artificial design and relatively high nutrient concentrations restrict ecological quality
The ecological quality of national and regional surface waters in the Netherlands is deter-mined, to a significant extent, by the hydrology (e.g., flow velocity and artificial water level changes), the physical design of the water systems (e.g., damming and normalisation), the physical and chemical status of the water (e.g., oxygen levels and temperature) and by the nutrients nitrogen and phosphorus. The WFD regards the hydro-morphology and the nutri-ents as important indicators for the ecological quality of surface waters or their restoration. Analysis of the current situation shows that, for the macro fauna, water plants and fishes species groups, the water is classified as ‘good’ far less often than for algae, which would suggest that artificial design is more of a limiting factor than are nutrient levels.
International challenges
The Netherlands form a delta where four European river basins meet, namely, those of the Rhine, the Meuse, the Scheldt and the Ems (Figure 6). The quality and quantity of Dutch waters are, therefore, heavily influenced by the land use and emissions of substances in the upstream countries of Germany, Switzerland, Austria, Belgium, Luxembourg and France.
Brussels Luxembourg North Sea Rhine Rhine Rhine Rhine Meuse Meuse Scheldt Scheldt GERMANY BELGIUM FRANCE Ems Amsterdam NETHERLANDS
The Netherlands and the international river basins
River basins Rhine Meuse Scheldt Ems
More than 75% of the phosphorus and nitrogen loads in the coastal zone of the erlands originates in other countries and the high water levels in the rivers of the Neth-erlands depend in part on the situation upstream (safety levels, water retention, water storage capacity, etc.), in the four river basins. On a regional scale, in the eastern and southern parts of the Netherlands, there are cross-border river basins, as well. Improving the water conditions in the cross-border systems on the national and regional scale, will mean a concerted effort on the international scale.
Main findings of the WFD ex-ante evaluation 3
Main findings of the WFD
3
ex-ante evaluation
Analysis of the RWS/regional measures packageFocus on habitat restoration and improvement of sewage treatment plants
A summary of the proposed measures for the regional and national water bodies is given in Table 1. For the regional water bodies, not all proposed measures are equally relevant to the ecological quality of the surface waters. Also, not all proposed measures for regional waters are easily translated into effects on ecological quality.
Measures which, for instance, result in a decrease in the bacteriological and organic load to surface waters (such as separating rainwater and sewerage overflow and the treatment of sewerage overflow; total investment over 1 billion euros) are not included, because the effect of these measures on the nutrient load is negligible (less than 1%) and usually very location-specific. This does not mean that such measures are unnecessary. Their neces-sity is primarily determined by, for example, the frequency and the extent of sewerage overflow and by location-specific circumstances, which fall beyond the scope of this research. ‘Other design, immission and management measures’ and ‘anti-groundwater depletion/re-wetting measures’ are not included, as they are too generally defined, or primarily relevant to terrestrial groundwater dependent ecosystems.
In total, this concerns a package of measures worth over 800 million euros. Also not included are the effects of unspecified projects on local inlet of water and freshwater flushing (about 300 million euros). As a result, the calculated ecological effects of the regional package of measures may be an underestimate of the actual effects on a local scale. On the scale of the water bodies, though, the estimated ecological effects are considered to be representative (see text box).
Thus, for further analyses, the regional package is divided into a sub-package with substantial ecological effect and a sub-package with little or unspecified effects on the ecological quality, in terms of the WFD system (nutrients and the species groups algae, macrophytes, macro fauna and fishes).
Measures for regional water bodies that could be incorporated in analysing ecological effects The measures with substantial ecological effect, which have been proposed by the regional water boards, include the creation of a total of about 8,000 kilometres of nature-friendly river banks and remeandering, and over a thousand fish passes. To reduce the
(below). Given are the expected investments in billion euros and the share of standing policies. Within the regional package, measures with substantial ecological effects and measures with little or unspecified effects are distinguished. See also text.
Type of measure Investment
2007-2027 (billion €) Estimated share of standing policies Regional water bodies
• Measures with substantial effect on ecological quality of surface waters and WFD species groups
Construction of 8,312 km of nature-friendly riverbanks, remeandering of
streaming waters 929 519
Construction of 1,067 fish passes 102 14
Development of 534 ha of nutrient-filtering marshes 9
Implementation of 47,000 manure-free buffer zones 34 1
Improvement of 168 Sewage Treatment Plants 746 449
Changing agricultural land use in 4,690 ha 53 53
Total 1,873 1,036
• Measures with little or unspecified effects on ecological quality of surface waters and WFD species groups
Inlet/flushing/water level management (70 projects) 300 85
Measures against groundwater table deficit 201 201
Other design, immission and management measures 618 82
Disconnecting rainwater discharges/cleaning-up of sewage overflows 1,051 1,051
Dredging (1,3 x 10⁶ m3) 332 332
Reducing emissions of other substances in 82 Sewage Treatment Plants 384 231 Water quantity and/or groundwater measures (388 small-scale projects) 553 553
Research, information activities and other projects 132 7
Total 3,570 2,542
Total 5,443 3,578
National water bodies
185 Fish passes 71
-Clear-water measures (emission control and 10,000 ha ecological
engineering) 224
-Reconstruction of 440 km nature-friendly banks 1,129 593
Development of 55 side channels, 1,150 ha floodplain reconstruction and
2,240 ha tidal flats 264 70
Total 1,687 663
Total package regional + national water bodies 7,130 4,241
Measures for the national waters (Table 1) also encompass, to a large extent, habitat restoration measures, such as the construction of 440 kilometres of nature-friendly banks, the digging of 55 permanent side channels, the lowering and restoration of about 1,100 hectares of river floodplains, the construction of 180 fish passes and the development of 2,200 hectares of tidal flats. Investments for this package amount to about 1,7 billion euros. The proposed package includes no measures which focus on the reduction of manure use on agricultural land. The regional water authorities consider this not their responsibility, but that of national government.
Main findings of the WFD ex-ante evaluation 3
Regional
waters Nationalwaters Regionalwaters Nationalwaters Regionalwaters Nationalwaters 0
1 2
3 billion euros (price level 2008)
Effect average ecological quality of surface waters Significant effect
No/limited effect
Directorate-General for Public Works and Water Management (RWS)
2007 - 2009
Investments RWS/regional package
0 1 2
3 billion euros (price level 2008)
2010 - 2015
0 1 2
3 billion euros (price level 2008)
2016 - 2027
Figure 7 Phasing of investments for measures in the regional and national waters, as proposed by the regional and national water authorities.
Investment in the complete RWS/regional package of measures totals about 7.1 billion euros, to be made in the 2007 - 2027 period (Table 1, Figure 7). In addition, capital tax, management and maintenance costs will also have to be paid, reaching a maximum of about 390 million euros per year, by 2027. The regional water boards are accountable for about 5.4 billion of the 7.1 billion euros, about 65% of which is for measures to be implemented in the period up to 2015.
Investment in measures for national waters totals about 1.7 billion euros, about 70% of which concerns the period up to 2015. Phased implementation up to 2027, applies both to measures which are significant in determining ecological quality and measures which have a more indirect effect. It is expected that targets will be achieved by 2027, rather than by 2015, for both national and regional waters.
between 2007 and 2027, for the RWS/regional package of measures. For regional waters, a distinction has been made between measures which have a substantial ecological effect (nutrients and design) and those which have limited to no effect. All figures are rounded.
Proposed policy Extra WFD Total billion € % billion € % billion €
Regional waters
Measures with a substantial ecological effect 1.0 53% 0.8 47% 1.9
Measures with a limited/ unknown ecological effect 2.5 69% 1.0 31% 3.6
Total regional waters 3.6 67% 1.9 33% 5.4
National waters
Measures with a substantial ecological effect 0.7* 40% 1.0 60% 1.7
Total regional + national waters 4.3 60% 2.9 40% 7.1
* Concerns an estimate of measures which have a substantial ecological effect within the framework of Room for the River and the Meuse Works.
58 % 16 % 3 % 15 % 8 % Water authorities Local authorities Regional authorities Directorate-General for Public Works and Water Management (RWS) Not allocated
Yearly costs of RWS/Regional package, per actor, after 2027
Figure 8 Annual costs of the RWS/regional package of measures, for the local and water authorities.
About two thirds of investments in the total package of measures is in standing and proposed policies
Of the measures which have a substantial ecological effect (also representing about 1.9 billion euros), about half are for proposed policies (Table 1), in particular for the construction of nature-friendly river banks (within the framework of Water Management in the 21st Century) and already proposed improvements in sewage treatment plants.
Main findings of the WFD ex-ante evaluation 3
Annual costs to society are estimated at 390 billion per year by 2027
The annual costs to society of the total RWS/regional package of measures, once all investments have been made, will be 390 million euros per year, from 2027 onwards. About 60% of these costs are to be paid by the water boards, 15% by the municipalities and 15% by RWS (Figure 8).
The costs to the water boards will result in an extra increase in water-board charges of about 0.7% per year, during the 2010 - 2027 period. This will mean that the total revenue from water-board charges will be about 13% higher in 2027, than would otherwise be expected, based on autonomous developments. About 75% of this increase in charges is to be paid for by households, the rest by businesses. It is estimated that two thirds of the package of meas-ures is attributable to proposed policies (Table 2). Therefore, the charge increase − directly attributable to investments made under the WFD − is considerably less than 0.7% per year. As far as postponing the objective deadline to 2027 is concerned, the question is whether the expected increase in charges can be considered disproportionate and can, therefore, be considered reason for legitimising phased implementation up to 2027.
Other than this, the largest autonomous increase in water-related charges, in the coming years is expected to be municipal sewerage charges (over 6% per year, averaged over the 2010 - 2027 period). The expected extra increase in municipal charges, resulting from the RWS/regional package of measures, is about 0.1% per year.
Expected ecological effects of the RWS/regional package of measures
Nutrient loads from abroad substantially reduced
Based on the available information from the international river basin committees about measures to be taken in the four river basins, a substantial reduction in the nutrient load from abroad is to be expected. For the Meuse and Scheldt river basins, a reduction in the phosphorus load of 30 to 35% is expected, in the period up to 2027; for the Rhine and Ems river basins, a reduction of about 15% is expected. The load of nitrogen is expected to be reduced by 15% (Rhine, Scheldt, Ems) to 20% (Meuse), by 2027 (Witteveen+Bos, 2008). The decrease in nutrient loads primarily improves the water quality of the national waters and coastal zone. The inlet from national waters is only a minor contribution to the total nutrient load of the regional waters (less than 1%) and has little impact, except in specific local situations (PBL, 2008).
Improvement in water quality of regional waters, but targets will not be reached By 2027, the nutrient load to regional surface waters will be 16% less for phosphorus and 24% less for nitrogen, compared with the current situation (Figure 10). The 24% reduction in nitrogen load would be the result of both the expected improvements in
Developed ecological model
Within the Netherlands, an ecological model suitable for exploring and evaluating possible ecological effects of measures within the WFD was not available. A new eco-logical model was developed, especially for the ex-ante study, to quantify the effects of design measures and nu-trient reduction measures on the Ecological Quality Ratio (EQR) of the four relevant species groups: algae, water plants, macro fauna and fishes. Using the best available monitoring data and the neural network as a statistical method for developing the model for four types of regional water bodies (streams, lakes, canals and ditches), a robust dose-effect model was created (Royal Haskoning, 2008).
In Figure 9, the conceptual structure of the model is given, showing a direct relationship between the present situa-tion (biotic and abiotic), the impact of applied measures on the selected steering factors and the resulting change in EQR per species group. The predicting power of the model is high, as 60 to 80% of the actual monitoring data are predicted well within the range of 0.1 EQR. Using the same dataset, an additional analysis using Tree regres-sion showed that the chosen steering factors in the model explain 80 to 95% of the variance within the species groups (Visser et al., 2008). In our study it is assumed that the pre-dicting power and relevance of the steering factors also hold for the future situation.
Expert system ecological effects Starting position
Steering factors
Measures
Knowledge rules / expert system
Ecological effects Alteration steering factors Change in Ecological Quality Ratio
Figure 9. Schematic representation of the ecological model developed for the ex-ante study.
Available data
The regional waters in the Netherlands encompass 737 water bodies, composed of different water types. Due to the limited availability of data on the current situation, changes in ecological quality could only be determined for circa half of the regional waters (streams, lakes, water-ways/canals and ditches). Brackish regional waters are not included in the analysis. The streams, lakes and wa-terways/canals included in the analysis are well distrib-uted throughout the Netherlands and can be considered representative. However, this does not apply to ditches, as this water type includes a diverse range of water bodies in the west, the centre and the east of the Netherlands and is not representative of ditches in the peat and clay areas of the north and the west of the country. The national water bodies covered in this study, include nearly all water bod-ies; fresh, brackish, as well as salt waters.
As the available monitoring data up to 2005 are not based on the requirements of the WFD monitoring data, expert processing was needed to make the data suitable for use in the WFD framework.
Dealing with uncertainties
In all the analysing steps in the ex-ante study uncertainties occur, encompassing uncertainties in the present situation (see available data) and in the specification of measures, uncertainties and restrictions in scientific knowledge about dose/effect relations, and uncertainties in the esti-mations of the water authorities, concerning the feasible ambition levels for ecological quality. In the ex-ante study the ecological effects of the measures are quantified and an evaluation is given of the extent to which the proposed ecological quality targets may be within reach.
In quantifying the effects, their potential maximum effect was also explored, assuming a maximum efficiency of the measures. Concerning the physical design, meas-ures (remeandering, construction of nature-friendly river banks) are presented for both the ‘expected ecological quality’ (effect of measure in water body proportional to total length of banks in the water body) and what could, potentially, be the ‘maximum ecological effect’ (effect of measure for 100% of water body) (see Figures 11, 12, 14 - 16). Concerning the effects of the considered additional measures to reduce nutrient loads, generally, the higher values for potential efficiency of nutrient reduction are used in the calculations.
Furthermore, in evaluating whether targets are likely to be reached, it is concluded that the target is ‘possibly’ within reach, if the calculated Ecological Quality Ratio (EQR) is within the range of +/- 0.05 of the proposed Good Ecological Potential (GEP): light green in Figures 11,12,14 - 16. Above GEP + 0.05, targets are qualified as within reach (dark green); below GEP – 0.05, targets are out of reach (red). With this approach the estimated potential effects may be optimistic rather than pessimistic, making conclusions about whether or not the targets seem within reach, ro-bust. (see for further discussion PBL, 2008).
Ecological effects of measures in the national waters have been estimated, based on expert judgement. Based on the maximum expected effect of the measures, in this study, we explicitly and carefully conclude that the tar-gets might be within reach. A more scientific and model-based analysis, such as that for the regional waters, is needed for underpinning this qualification.
Main findings of the WFD ex-ante evaluation 3
Nutrient load regional waters
2000 - 2005 2027 with extra WFD-measures 2027 with extra WFD-measures 0 2 4 6 Million kg Phosphor 2000 - 2005 2027 determined and proposed policy 2027 determined and proposed policy 0 20 40 60 80 Million kg Other
Sewage treatment plants Agriculture
Nitrogen
Figure 10 Expected changes in the nutrient load of regional waters, in the period up to 2027. As shown, the main effect is due to standing and proposed policy measures. Effects of the extra measures in the regional package are small.
The proportion of the total load attributable to sewerage plants is, therefore, reduced from a third to a quarter, and so, the relative share of nutrient load attributable to agri-culture increases to about three quarters of the total. The realised emission reduction is expected to improve the water quality, by 2027, but still 40 to 50% of the regional waters are not expected to meet the nutrient standards (PBL, 2008).
Substantial improvement in ecological quality of regional waters
On implementation of the measures proposed by the regional water boards, the propor-tion of water bodies labelled as ‘good’ for the species groups of water plants, macro fauna and fishes, will increase from about 5% in the current situation to a potential maximum of 30 - 50%, by 2027 (Figure 11).
Phyto- plank-ton
Macro-phytesMacrofauna Fish 0 20 40 60 80 100 % Very good Good Moderate Inadequate Poor 2000 - 2005
Ecological quality regional waters
Phyto- plank-ton
Macro-phytesMacrofauna Fish 0 20 40 60 80 100 % 2027 Potential maximum Phyto- plank-ton
Macro-phytesMacrofauna Fish 0 20 40 60 80 100 % 2027 Expected
Figure 11 Actual, expected and, potentially, maximum ecological quality per species group in regional waters. ‘2027 Expected’ refers to the ecological effects as a result of the expected use of measures. ‘2027 Potential maximum’ refers to the ecological effects as a result of the maximum possible use of measures.
Improvement in ecological quality of national waters mainly in rivers
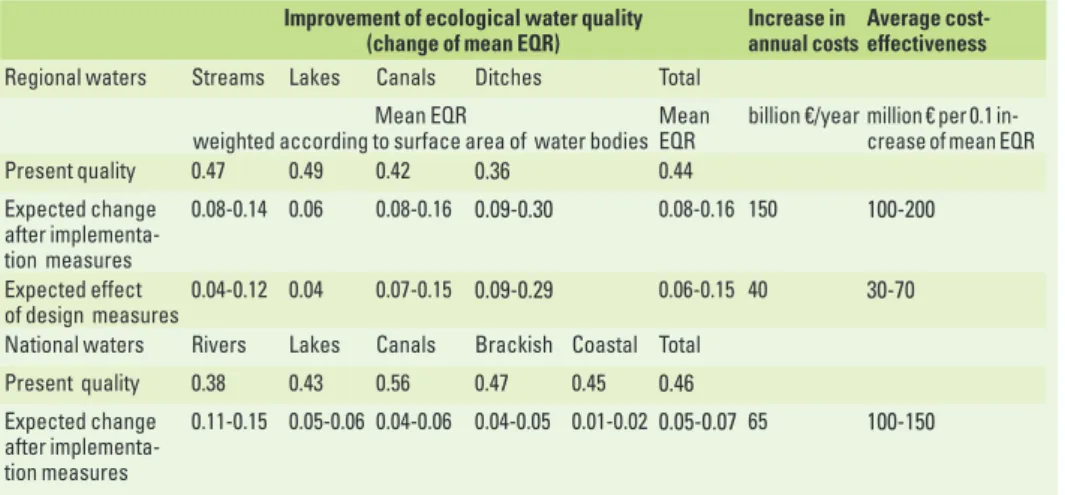
Ecological quality improves the most in rivers, especially for water plants (Figure 12). The proportion of situations labelled as ‘good’ for this species group, increases from 25% in the current situation to 50%, by 2027, following implementation of the measures. The average Ecological Quality Ratio (EQR) of the rivers increases from almost 0.4 to almost 0.5, with the value 0.6 representing Good Ecological Potential (Table 3). The ecological quality of canals, lakes and transitional waters shows little improvement. In transitional waters, the reduced nutrient load from other countries is only apparent as a marked improvement in phytoplankton. The ecological quality of coastal waters shows almost no improvement, as the measures are limited in the extent to which they address this Ecological improvement mainly achieved through design measures
Although there is limited improvement in water quality, in the period up to 2027, the proposed measures allow for the realisation of a marked improvement in ecologi-cal quality. For regional waters, the design measures alone (which account for a little more than a quarter of the costs) enable the achievement of 80 to 90% of the change in ecological quality (average EQR) (Table 3).
Main findings of the WFD ex-ante evaluation 3
Phyto- plank-ton
Macro-phytesMacrofauna Fish Very good Good Moderate Inadequate Poor Phyto- plank-ton
Macro-phytesMacrofauna Fish
2027 Potential maximum
Phyto- plank-ton
Macro-phytesMacrofauna Fish
2027 Expected 0 20 40 60 80 100 % 2003 - 2006
Ecological quality national waters
0 20 40 60 80 100 % 0 20 40 60 80 100
Figure 12 Actual, expected and, potentially, maximum ecological quality per species group in national waters. ‘2027 Expected’ refers to the ecological effects as a result of the expected use of measures. ‘2027 Potential maximum’ refers to the ecological effects as a result of the maximum possible use of measures.
Table 3 Expected ecological improvement (EQR) and cost-effectiveness of the package of measures for the regional waters (top) and national waters (bottom). Changes in ecological quality (EQR) are weighted according to the surface areas of the water bodies.
Improvement of ecological water quality
(change of mean EQR) Increase in annual costsAverage cost-effectiveness
Regional waters Streams Lakes Canals Ditches Total
Mean EQR
weighted according to surface area of water bodiesMean EQR billion €/year million € per 0.1 in-crease of mean EQR
Present quality 0.47 0.49 0.42 0.36 0.44 Expected change after implementa-tion measures 0.08-0.14 0.06 0.08-0.16 0.09-0.30 0.08-0.16 150 100-200 Expected effect 0.04-0.12 0.04 0.07-0.15 0.09-0.29 0.06-0.15 40 30-70
Therefore, this part of the package of measures is much more cost-effective than the measures focusing on reducing the nutrient load to surface waters (primarily, through tougher measures for sewage treatment plants).
Proposed ambition levels of ecological targets and expected achievement of targets
Ambition levels proposed by regional and national water authorities
Targets have been set for each species group and water type. Targets for natural and heavily modified waters are indexed, using a natural reference condition in which the Good Ecological Status (EQR = 0.6) is an important reference point. For artificial waters (waterways, canals and ditches), a lower ambition level is incorporated in the standards. Targets for artificial waters are indexed, using a default value for the Good Ecological Potential (default GEP; EQR = 0.6). For artificial and heavily modified waters, the regional and national authorities may set their own GEP and, therefore, their own ambition level. The most recent targets are used in this report and date from 27 March 2008. Figure 13 shows the presented ambition levels for artificial and heavily modified waters, including both the regional and national water bodies.
For many heavily modified waters Good Ecological Status is considered unachievable For artificial waters (ditches and waterways/canals), the proposed target level is usually roughly equal to the default GEP (equivalent to an EQR value of 0.6, according to the standard for artificial waters). The proposed targets show a larger spread for the heavily modified waters (streams and small rivers). The target level is between the EQR values of 0.3 and 0.6, according to the standard for natural waters for a substantial number of water bodies, but lower values are also found. Therefore, the Good Ecological Status of 0.6 is, according to the water authorities, usually unachievable in the heavily modified waters. Information to substantiate this was not yet available at the time of this study. Full achievement of proposed ecological targets in regional waters unlikely
Compared with the current situation, it is estimated that the percentage of targets achieved for the various species groups in regional waters will increase to a maximum of 40 to 60% (Figure 14).
Given the large uncertainty, and despite the substantial improvement in ecological quality following implementation of the package of measures, it is unlikely that all targets for regional waters will be achieved, by 2027. However, more targets may be achieved locally than is estimated for the regional level, due to measures not included in the calculation of the ecological effects.
Main findings of the WFD ex-ante evaluation 3 0.9-1 0.8-0.9 0.7-0.8 0.6-0.7 0.5-0.6 0.4-0.5 0.3-0.4 0.2-0.3 0.1-0.2 0-0.1 EQR 0 20 40 60 80 100 % Artificial waters
Proposed ambition levels
Sub border Good Ecological Potential
0,9-1 0,8-0,9 0,7-0,8 0,6-0,7 0,5-0,6 0,4-0,5 0,3-0,4 0,2-0,3 0,1-0,2 0-0,1 EQR 0 20 40 60 80 100 %
Heavily modified waters
Sub border Good Ecological Potential
Figure 13 Ambition levels for artificial (at the left) and heavily modified waters (at the right).
0 20 40 60 80 100 % 2000 - 2005
Regional waters valued against Good Ecological Potential
0 20 40 60 80 100 % 2027 Potential maximum 0 20 40 60 80 100 % 2027 Expected Phyto- plank-ton
Macro-phytesMacrofauna Fish Phyto- plank-ton
Macro-phytesMacrofauna Fish Phyto- plank-ton
Streams
LakesCanalsDitches Streams LakesCanalsDitches Streams LakesCanalsDitches 0 20 40 60 80 100 % Adequate
Possibly adequate (target Good Ecological Potential +/- 0.05) Inadequate
2000 - 2005
Regional waters valued against Good Ecological Potential according to ‘one out/all out’ principle
0 20 40 60 80 100 % 2027 Expected 0 20 40 60 80 100 % 2027 Potential maximum
Figure 15 Expected achievement of targets (Ecological Potential) per water type, based on the ‘one out - all out’ WFD principle. This principle leads to a substantial lower achievement of targets.
Based on the ‘one out, all out’ WFD principle and the targets available for regional waters, the achievement of targets is by far not within reach, for all water types. Assum-ing maximum effectiveness of the proposed measures, only 40 to 60% of all water types will meet their targets (Figure 15).
Achievement of ecological targets for national water bodies possibly within reach As for the regional waters, RWS applies a proposed target level to canals (artificial water), which is roughly equivalent to the default GEP value of 0.6. For heavily modified rivers and lakes, the proposed targets for the various species groups are, on average, between 0.4 and 0.55 (rivers) and between 0.3 and 0.45 (lakes), which is much lower than the standard for natural waters.
Based on the ‘one out, all out’ WFD principle and the standards for national waters, the full achievement of targets is almost within reach for artificial waters (canals) and heavily modified national waters (rivers and lakes), assuming maximum effectiveness of the measures (Figure 16). The GES remains the standard for natural coastal waters. These waters will probably not meet the GES targets, by 2027, even assuming the implementa-tion of less ambitious targets for angiosperms (sea grasses).
Main findings of the WFD ex-ante evaluation 3
Adequate
Possibly adequate (target Good Ecological Potential +/- 0.05) Inadequate 0 20 40 60 80 100 % 2027 Potential maximum 0 20 40 60 80 100 % 2027 Expected Canals Lakes Rivers Transitional waters Coastal waters Canals Lakes Rivers Transitional waters Coastal waters Canals Lakes Rivers Transitional waters Coastal waters 0 20 40 60 80 100 % 2003 - 2006
National waters valued against Good Ecological Potential according to ‘one out/all out’ principle
Figure 16 Expected achievement of targets per water type, based on the ‘one out - all out’ WFD principle.
Remaining challenges: further improvement of ecological quality
Improving ecological quality in regional waters requires additional design and nutrient reduction measures
The achievement of all targets for regional waters is, based on the calculated effects, unlikely. Therefore, it seems that the ecological ambitions are not sufficiently in line with the proposed measures. Entering the currently proposed regional targets for the reporting commitment towards Brussels, possibly involves the future risk of failing to meet this obli-gation. Depending on the required ambition level, there are two possible ways of achieving a better balance, for example, by changing the targets or by implementing more measures in the period up to 2027, which focus on design and/or on a reduction in the nutrient load.
and waterways/canals) with, as far as streams are concerned, an expected greater ecolog-ical effect from remeandering, than from the construction of nature-friendly banks. Ecological fish-stock management (bio-manipulation) in lakes and other water types, such as artificial waterways and canals, and the damming of lower reaches of streams, seem promising, additional measures for greatly improving ecological quality in the short term. Important lake systems − considered suitable for the implementation of this measure − include the Frisian lakes, the Randmeren, the Loosdrechtse Plassen, the Nieuwkoopse Plassen and the Volkerak-Zoommeer. Compared to other measures, the cost-efficiency of ecological fish-stock management seems very positive (Table 4; Witteveen+Bos, 2008). As of 2027, it is expected that 75% of the nutrient load to the regional water systems come from agricultural soils (Figure 10). In the ex-ante study, the potential effects have been investigated of six additional measures, aiming at a further reduction in the nutrient load to regional surface waters (Table 4). However, the available knowledge is restricted, especially concerning measures for reducing emissions from agricultural soils, and the uncertainties about the potential effects are substantial. To explore whether any of the measures would, potentially, have a substantial effect, these effects are calculated using the higher values of the potential range of efficiency, mainly based on figures found in literature (PBL, 2008). Based on the knowledge now available and with the assumptions applied, it is improb-able that measures, such as mining of soil phosphorus by zero-P-application, increased drainage depth and manure-free zones will achieve a substantial reduction in the phos-phorus load. With these measures, nutrient reductions of only 1 to 5% are found for both phosphorus and nitrogen and this level of reduction is hardly relevant for improving the ecological quality (Table 4).
Table 4 Expected ecological improvement (EQR) and cost-efficiency for measures that can be taken in addition to the regional package. Changes in ecological quality (EQR) are weighted according to the surface areas of the water bodies. Compare Table 3.
Improvement ecological quality (change in mean EQR) Increase in
yearly costs Mean cost- efficiency Regional waters Streams Lakes Canals Ditches Total
Change mean EQR weighted according to surface area
Overall change in
mean EQR billion €/year
billion € per 0.1 increase mean EQR Additional measures - Sewage Treatment Plants 0.01 0.02 0.02 0.01 0.01 85 - 3)
- Wet buffer strips 0.01 0.04-0.05 0.03-0.05 0.02-0.04 0.03-0.04 355 900-1300
- Manure-free zones 0.00 0.02 0.01 0.01-0.03 0.01-0.02 68 - 3) - Restrict drainage 0.00 0.00 0.00 0.00 0.00 90 - 3) - Helophyte filters 0.04-0.05 0.13 0.11-0.13 0.07-0.14 0.09-0.11 600 550-650 - Mining op soil P 1) 0.00-0.01 0.00 0.00 0.00 0.00 25 - 3) Ecological fish-stock management 2) 0.00 0.04-0.07 0.00 0.00 0.01-0.02 1-3 10-20
1) Mining of soil phosphorus by zero-P-application
2) Measure executed for 25 to 50% of the total surface area of the Dutch regional lakes. Source: Witteveen+Bos (2008). 3) The expected ecological improvement is very little and uncertain, therefore it is senseless to calculate the cost-efficiency.
Main findings of the WFD ex-ante evaluation 3
Of the variants that were investigated for further reducing nutrient loads, only the wide-spread implementation of wet buffer strips (4% of agricultural land) or helophyte filters (6% of agricultural land) seem to result in a significant reduction in the phosphorus load (15% and 40%, respectively) and the nitrogen load (18% and 50%, respectively) (PBL, 2008). With this level of reduction, substantial ecological improvements are found. Although the yearly costs of helophytes are higher than those of wet buffer strips, the cost-efficiency of the helophytes seems more positive.
Further reduction of nutrients appears difficult and costly
The analyses show that, assuming an intensity of manure use, according to the Dutch policy on manure use, and given the current level of phosphorus accumulated in the soil, nutrient reduction of any ecological significance is only possible if radical action is taken. However, the effects and applicability of the measures considered (such as buffer strips and helophyte filters), are still uncertain, and the estimated annual costs seem high (Table 4). Given the uncertainties and the possibility of high costs associated with these effect-focused nutri-ent measures, it is also necessary to consider the option of achieving the required nutrinutri-ent reduction by a further reduction in the amount of manure applied. However, because the phosphorus accumulated in the soil will continue to leach, it will take many decades before stringent manure use (or even a stop on phosphate use) will result in a significant decrease in the phosphorus load from agricultural land to surface water. The choice between the area-specific implementation of effect-oriented measures (buffer strips, helophyte filters, and fish-stock management) or source measures, will partially depend on the importance attached to achieving the targets by 2027 and/or after this date.
The present Dutch manure policy will result in a further accumulation of phosphorus in the soil. A more stringent manure policy is, therefore, needed to prevent this from happening and to reduce leaching and run-off from agricultural land, in the long run (MNP, 2007).
Final Remarks
Synergy between WFD and other policies represents two to three billion euros The fact that it is difficult to distinguish between WFD measures in the RWS/regional package of measures and those taken in other policy areas, suggests that there is a large amount of synergy between them. Other policy areas include the Water Management in the 21st Century (WB21), the Birds and Habitats Directives (Natura 2000 areas), the national nature policy (National Ecological Network), the Nitrates Directive, the Bathing Water Directive and the Urban Waste Water Directive.
As far as the two primary measures are concerned, (design measures and water-quality improvement measures), it is possible to conclude that about 2.7 billion euros (almost
Habitats Habitat Directive
species Breeding birds Migratory birds 0 20 40 60 80 100 % Unknown Very unfavourable Unfavourable Favourable Natura 2000 areas under pressure in 2005
Figure 17 In 2005, 80% of the Natura 2000 habitats were in an unfavourable state (MNP, 2006).
Slight contribution to improvement in water quality in Natura 2000 areas
In the Netherlands, for about 80% of the surface area of the Natura 2000 areas, the current situation does not meet the requirements for the preservation of the protected habitats (Figure 17). Despite efforts to reduce emissions from sewage treatment plants, the water quality in regional waters will improve only slightly, up to 2027, compared with the current situation. For sixty-nine Natura 2000 areas, the quality of regional surface water is impor-tant for maintaining the habitat (streams, lakes and swamps) or the species for which the area is designated. In the current situation, in eight Natura 2000 areas the WFD water body meets the GES or default GEP value for nutrients; following implementation of the measures, this increases to twelve areas. However, the process for determining the nutrient targets for the Natura 2000 water bodies is still not complete, and so it is not yet possible to determine whether there should be extra policy tasks related to Natura 2000 water targets.
The improvement in water quality in national waters is, primarily, due to measures taken in other countries. These measures (the construction of new sewage treatment plants or improvements to existing plants in Belgium, France and Germany) are explicitly taken to implement the WFD and so, for national waters, there is some synergy between WFD measures and improvements to water conditions in a few Natura 2000 national water bodies (the IJsselmeer, the Wadden Sea, the south-west delta and the coastal zone). The RWS makes a clear distinction, at national level, between WFD-focused measures and Natura 2000-focused measures and has, in addition to the package of measures for the WFD, drawn up a supplementary package of measures which contributes to the realisation of Natura 2000 targets. These measures have not been included in the calculations of the WFD ex-ante assessment.
Main findings of the WFD ex-ante evaluation 3
Groundwater deficit stress (desiccation) in Natura 2000 areas remains a major challenge Groundwater deficit stress (desiccation) in nature areas is a major environmental
problem, in the Netherlands. The problem was first recognised in the eighties of the last century. At that time, about 400,000 hectares of nature area suffered from groundwa-ter deficit stress. In 2000, only 3% was hydrologically restored; the policy target was 25%. So there lies a major challenge concerning the groundwater levels in nature areas. Therefore, in 2006, a list of priority areas for combating groundwater deficit stress (the so-called TOP areas) was drawn up within the framework of the Rural Investment Budget (ILG). About 25% of the desiccated Natura 2000 areas is not included in this list. The areas not included in the TOP list will not reach the required groundwater conditions, by 2015, necessary for their conservation. Furthermore, the provinces claim that only around 80% of the TOP areas will fully recover from groundwater stress.
No agreements have yet been made on how to tackle groundwater stress after 2013, in those areas (including Natura 2000 areas) not included in the TOP list, and it is not clear in the regional package of measures whether and when additional anti-groundwater-stress measures are to be implemented to improve water conditions in Natura 2000 areas. It is, therefore, questionable whether the target of the Ministry of Agriculture, Nature and Food Quality (LNV) will be met, worded in the Policy Vision for Nature Management target, as ‘…to at least realise the necessary water quality for the Natura 2000 areas, in 2015’. Cost of restoring groundwater levels in desiccated Natura 2000 areas considerable The cost of restoring the desiccated Natura 2000 areas is projected at 800 million euros, about half of which is available within the framework of the ILG. A minimum of an extra 400 million euros needs to be found, after 2013, for implementation of the remaining measures. Funds are seriously lacking, since the available budget for the entire TOP list totals only 457 million euros. An exploratory analysis shows that extracting groundwater for the production of drinking water can result in pressure on the conditions for conser-vation in Natura 2000 areas. An initial estimate shows that the necessary reduction and/ or transfer of groundwater-extraction sites will require about 1.8 billion euros. These measures and costs are not included in the calculations carried out in this study.
Policy challenges concerning chemical water quality and groundwater bodies
Exceedance for a limited number of priority substances and other relevant substances Based on provisional EU standards for priority substances in surface waters, the Nether-lands has policy task for six substances (20% of the priority substances), five of which are priority hazardous substances, which require emissions eventually to be reduced to zero. Reducing the emissions of these substances, primarily, requires a European approach.
Based on monitored substances, the ecological effect on surface waters seems small In all the possible monitoring locations for which the toxicity of exposure to the combination of substances was calculated, it appears that over 5% of species are inadequately protected at 35 locations. The potential toxicity at these locations is caused by the combination of a pesticide, zinc and copper. The effects of substances of which concentrations are below the detectable limit (i.e. many pesticides) could, of course, not be included in the toxicity calcu-lation, which, in turn, could result in an underestimation when calculating the effects. WFD list of substances does not fully protect drinking water
There are fifteen substances found in surface waters at a concentration higher than the drink-ing water standards allow. They form a problem in drinkdrink-ing-water production, although there are no WFD standards for these substances. In addition, another 171 substances have been recognised as a potential threat to the drinking-water quality; moreover, there is no standard for 91 of them (KIWA, 2008). This means that the implementation of the WFD does not result in cost savings in water treatment for the purpose of drinking-water production.
Limited measures concerning chemical water quality in RWS/regional package
All measures in the RWS/regional package that contribute to an improvement in chemical surface-water quality, amount to about 600 million euros.
Policy task for groundwater quality as yet unclear
The task concerning groundwater quality is as yet unclear, as no decision has been taken on the method for determining the threshold values of chemical substances in groundwa-ter. Another policy task − for nitrate − continues after 2015, particularly in the south of the Netherlands.
Effects of climate change on the ecological quality of surface waters
The policy challenge will increase due to climate change
Temperature increases and an increase in precipitation intensity will affect the ecological quality of the water system in various ways (shifting of species, mismatch of life cycles and increase in eutrophication). As far as eutrophication is concerned, climate change will probably increase the risk of unfavourable situations, which means that the policy task for tackling the negative effects of eutrophication is more likely to increase than decrease. In particular, the likelihood of eutrophication, algal bloom and lower oxygen concentrations will increase in the expected warmer and drier summers, because the water will remain in the rivers, lakes, streams and waterways/canals for greater lengths of time.
Limiting nutrient load is most important steering mechanism
As far as the direct and indirect effects of climate change are concerned, it is almost impossible to influence the expected temperature increase and change in precipitation patterns. The most important steering mechanism for contributing to a reduction in the influence of climate change on ecological quality, over the coming decades, is the mechanism determining the nutrient load of surface waters. As about three quarters of the nutrient load will come from agricultural land by 2027, intensity of manure use, as well as leaching and run-off mechanisms represent important steering opportunities.
References
References
EC (2007). Report from the commission to the council and the European parliament on implementation of Council Directive 91/676/EEC concerning the protection of waters against pollution caused by nitrates from agricultural sources for the period 2000 – 2003. KIWA (2008). Drinkwater productie wordt duurder onder Kaderrichtlijn water regime.
Kiwa Water Research, Nieuwegein, februari 2008.
MNP (2005). Milieubalans 2005. MNP rapportnr. 251701066, Den Haag: Sdu uitgevers. MNP (2006). Nationale Milieuverkenning 6 2006-2040. MNP rapportnr. 500 085 001.
Den Haag: Sdu uitgevers.
MNP (2007). Werking van de Meststoffenwet 2006. MNP rapportnr. 500124001. Milieu- en Natuurplanbureau, Bilthoven.
PBL (2008). Kwaliteit voor later. Ex ante evaluatie Kaderrichtlijn Water. PBL-rapportnr. 500140001/2008. Planbureau voor de Leefomgeving, Bilthoven.
RIVM-MNP (2004). Milieubalans 2004. MNP rapportnr. 251 701 057. Bilthoven: Rijks-instituut voor Volksgezondheid en Milieu.
Royal Haskoning (2008). Ontwikkeling en toepassing ecologisch expertsysteem voor regionale wateren. Achtergrondrapport Ex ante evaluatie KRW. Royal Haskoning, Den Bosch.
V&W, Ministerie van (2006). De strategische MKBA voor de Europese Kaderrichtlijn Water. Ministerie van Verkeer en Waterstaat, december 2006.
Visser, H., P.J.T.M. van Puijenbroek, P.H.M. Janssen (2008). Stuurfactoren voor de ecologische kwaliteit van regionaal oppervlaktewater. Een statistische analyse met regressiebomen. Achtergrondrapport bij de Ex ante evaluatie KRW. PBL-rapportnr. 500140002/2008. Planbureau voor de Leefomgeving, Bilthoven.
Witteveen+Bos (2008). Analyse van de effecten van de KRW-maatregelen op de water-kwaliteit in de Rijkswateren. Witteveen+Bos, Deventer.
What are the costs and benefits of the Water Framework Directive in the Netherlands?
Just as all other European Member States, the Nether lands also has the obligation to implement the European Water Framework Directive (WFD). This requires a number of policy choices at the edge of economics and ecology: What are the Netherlands’ ambitions regarding water quality? What is required by the WFD? Which ambitions are feasible and at what costs?
The proposed measures, taken by the water authori ties in the context of the WFD proposals, will lead to a significant improvement of the ecological quality of Dutch surface waters. The expected improvement in ecological water quality would mainly be the result of the widespread implementation of design measures and improving the hydromorphological conditions of water bodies. These measures seem to be cost effective. The benefits of the WFD primary consist of the improvement in the ecological water quality.
Although the ecological water quality is improving, it seems improbable that the proposed targets for regional water will be achieved by 2027. Also, the Natura 2000 sites will hardly profit from the proposed measures.
Netherlands Environmental Assessment Agency, October 2008