Effect of Climate Change on the Hydrology of
the River Meuse
This project is carried out in the framework of the Dutch National Research Programme on Global Air Pollution and Climate Change, Phase II (NOP-II)
M.J.M. de Wit
1,6(ed.), P.M.M. Warmerdam
1(co-ordinator), P.J.J.F. Torfs
1,
R. Uijlenhoet
1, E. Roulin
2, A. Cheymol
2, W.P.A. van Deursen
3,
P.E.V. van Walsum
4, M. Ververs
5, J.C.J. Kwadijk
5, H. Buiteveld
61 Wageningen University, Sub-department Water Resources 2 Royal Meteorological Institute of Belgium
3 Carthago Consultancy 4 Alterra
5 WL/Delft Hydraulics 6 RIZA
Rapport 104
Sub-department Water Resources
Nieuwe Kanaal 11, 6709 PA Wageningen The Netherlands
Internet: www.dow.wau.nl/whh ISSN 0926-230X
FOREWORD
In 1995 the second phase of the Dutch National Research Programme on Global Air Pollution and Climate Change, NOP-II, commenced. The primary objective of the NOP as a strategic and long-term research programme is to meet the demand for information relevant for the development of national and international climate policy.
The project entitled 'Effect of climate change on the hydrology of the river Meuse' is part of the research theme focussing on impacts of climate change. The project was carried out in co-operation with a number of research institutes and resulted in this report. Model simulations of the impact of climate change on the hydrology of sub-catchments of the Meuse basin were performed at the Royal Meteorological Institute of Belgium (RMI), Alterra, and Carthago Consultancy. The effect of climate change on the water quality in the Meuse was analysed at Delft Hydraulics (WL). A statistical analysis of precipitation and discharge records was performed at the Sub-department Water Resources of the Wageningen University. This sub-department also co-ordinated the project and the finalisation of this report. RIZA provided support and a link between the research groups. Marcel de Wit moved from Wageningen University to RIZA, and part of the writing of this report has been performed at RIZA.
The data used in this project have many different sources. Detailed climate change scenarios were provided by the NOP office and by the RMI. Precipitation records were provided by RMI. The French streamflow data were provided by the Direction Régionale de l'Environnement (DIREN) de Lorraine. The streamflow data from Belgium were provided by the Ministère Wallon de l’Equipement et des Transports (MET) in Namur. The Dutch streamflow data were provided by Rijkswaterstaat Directie Limburg, and the Water Authority “de Dommel”. All these sources are gratefully acknowledged.
Many people contributed to the project by attending the workshop held in Wageningen in December 2000. In particular we would like to thank Alexandra Jaskula-Joustra, Hans Middelkoop, Herman Crommelinck, Gaston Demarée, Lambert van Breemen, Lilian van Wijngaarden, Sander Bastings, Paul Dewil, Wilko Verweij, Cathelijne van Haselen, Reinder Feddes and Peter Troch for their contribution to this project.
CONTENTS page Abstract 5 Summary 7 Samenvatting 11 1 Introduction 17 2 The Meuse 19 3 Data 29
4 Analysis of precipitation and discharge records 35
4.1 Precipitation 35
4.2 Discharge 38
4.3 Winter precipitation and summer discharge 41
4.4 Statistical analysis of 23 discharge time series 47
5 Model simulations 53
5.1 Climate change scenarios 53
5.2 Simulation of climate change 59
5.3 Simulation of other changes 71
5.4 Simulation of water quality 80
6 Workshop reportage 91 6.1 Workshop presentations 91 6.2 Workshop discussions 95 7. Conclusions 99 References 101 Appendices
1 Low flow forecasting 107
2 Description of the rainfall-runoff models 109
3 Results of the scenario runs 125
ABSTRACT
This study describes historical observations and future estimates of the discharge regime of the river Meuse, with reference to climate change. It specially deals with low flows and integrates results obtained from analyses of observed records and simulations performed with hydrological models.
ABSTRACT
Deze studie beschrijft historische waarnemingen en toekomstschattingen van het afvoerregime van de Maas, met het oog op mogelijke klimaatsveranderingen. De studie richt zich met name op lage afvoeren en integreerd resultaten verkregen uit analyses van waargenomen reeksen en simulaties uitgevoerd met hydrologische modellen.
SUMMARY
Low flows and flooding are both natural phenomena. Therefore, the use of the river Meuse for water supply, navigation, and recreation, and the use of the Meuse floodplain for housing and agricultural production implies certain risks. There is a growing concern that these risks increase due to a global change of climate. The major aim of this study is to analyse whether or not this concern is justified. Below an answer will be given to the questions that are raised in this report.
• What is the predicted climate in the Meuse basin at the end of the 21th century? • Has the precipitation regime in the Meuse basin changed over the last century?
The theory that greenhouse gas emissions are influencing the global climate is supported by the exceptional upward trend of the global temperature over the 20th century. How global warming will effect the climate in the Meuse basin is far more uncertain. The results of a number of global circulation models (GCMs) suggest that the average temperature will increase, the average winter precipitation will increase and the average summer precipitation will decrease in the Meuse basin. However, regional predictions derived from global experiments, should be interpreted with care. Another way to look at climate change is to analyse historical records. These records suggest a small increase of annual and seasonal average precipitation volumes, especially during the winter season. However, the natural variability of the climate is large and the data series used for the analyses described above are relatively short. Therefore, one cannot conclude that there is a significant upward trend in precipitation in the Meuse basin. Moreover, it remains to be seen whether the changes observed are due to global warming or not.
• Has the flow regime of the Meuse changed over the last century?
The natural variability of the discharge of the Meuse is large, and the differences over longer time intervals are small. This implies that one can not distinguish a significant trend.
• Does the winter precipitation affect the duration of the low flow period in the summer? • Does the vulnerability to low flows and floods differ between different sub-catchments of
the Meuse basin?
Low flows in the Meuse occur naturally during summer and early autumn. The analysis of precipitation and discharge records clearly showed that the duration of the low flow period not only depends on the summer precipitation, but also on the precipitation volume in the previous winter. This implies that in certain parts of the Meuse basin a substantial portion of the discharge originates from delayed (groundwater) flow. The statistical analysis of discharge time series measured at 23 gauging stations revealed large differences in the magnitude and rapidity of discharge fluctuations in the river Meuse network. Catchments with small and slow discharge fluctuations suggest a dominance of slow runoff components (groundwater flow), whereas catchments with large and fast discharge fluctuations suggest a dominance of fast runoff components. The latter are likely to be more vulnerable with respect to both floods and low flows. Vulnerable catchments seem to be located in the regions that consist of rocks from the Lias formation (southernmost part of the French Meuse basin, and eastern upper part of the Chiers and Semois), and in the Ardennes Massif (the upper Ourthe, Lesse, Vesdre and Amblève). Flood prevention at the source will be most effective in these regions. Less vulnerable catchments seem to be located in the Carboniferous limestones of the Condroz region and the Mesozoic limestones in the French part of the Meuse basin and the region north of the Ardennes. The groundwater reservoirs in these regions need to be protected in order to maintain a minimum water flow in the Meuse during dry periods.
• What will be the effect of climate change on the discharge regime of the Meuse? • What will be the effect of other future changes on the discharge regime of the Meuse?
patterns: an increase of the average discharge at the end of winter and at the beginning of spring and a decrease in average discharge in autumn.
The land use change scenarios were applied to three small sub-catchments of the Meuse basin. A simulation of a removal of drains and ditches and a stop of irrigation suggests that such a change of agricultural water management tempers the flow regime of streams in the Dutch part of the Meuse basin. This may result in lower flows during winter and larger baseflows during summer. Whether these drastic measures will also be effective in other parts of the Meuse basin needs further analysis. A simulation of a complete afforestation of two Belgian catchments suggests that this might reduce peak flows, but also increase low flow problems.
The topic of (human induced) changes of land use, and flow regulation on the hydrology of the Meuse was lively discussed at the workshop. During this discussion it was also argued that the use of (sub-surface and surface) reservoirs for both flood reduction and the augmentation of low flow rates is not easy. Reservoirs should be filled at the end of the winter in order to be used effictively during the summer. This implies that at the end of winter there is less capacity to store water, which might increase the risk of flooding.
• Will climate change affect the water quality of the Meuse?
Water quality problems in the Meuse are most severe during extremely dry and warm periods. However, a simulation of the effect of climate change on some general water quality variables suggests that these 'average' changes do not have a distinct impact on the 'average' water quality in the Meuse. A brief review of the literature suggests that other future changes, such as the reduction of emissions and changes in flow regulation, might have a greater impact on the quality of the water in the river Meuse than climate change.
This leaves the question whether the existing concern about the impact of climate change on the hydrology of the river Meuse is justified. To answer this question it should be noted that the model results presented in this report are based on average changes. The impact of global warming on the occurrence of extreme regional meteorological conditions, and as a result extreme hydrological conditions, is not (yet) known, and has therefore not been the focus of
the research presented in this report. As long as the impact of global warming on the occurrence of extreme meteorological events in the Meuse basin is not known, there remains a reason for continuing concern about the impacts of global warming.
The floods of 1993 and 1995 have triggered the concern for floods in the river Meuse basin. However, the ‘extreme low flow memory’ hasn’t been refreshed since 1976. The discharge record of the Meuse at Monsin indicates that low flow periods of more than 100 days occur almost every ten years. The fact that such long lasting low flow period has not occurred during the last 25 years does not imply that it will not occur in the near future. Since 1976, navigation on the Meuse and the use of Meuse water for water supply in Belgium and the Netherlands have considerably increased. This means that a situation like 1976, may result in great economical loss.
So far only ‘end of the pipe’ measures have been taken to combat the negative effects of low flows in the Meuse (e.g. creation of buffer reservoirs). During the workshop it was stressed that also structural measures are needed to prevent long periods of low flows in the Meuse. The construction of surface water reservoirs in the Ardennes may be effective, but does not seem realistic due to lack of public support. Other more realistic measures to forcome problems caused by low flows are the reduction of pollution, further improvement of weirs and locks, good agreements on the distribution of water during periods of low flows, better predictions of low flows and, on the long term, the use of water from the Scheldt (Flandres) and the Rhine (the Netherlands) as an alternative for drinking water production.
Whatever the future of the Meuse basin will be, floods and long periods of low flows will continue to occur in the river Meuse. This implies that the benefits of the use of the river Meuse and its floodplains should be balanced against the risks associated with the use of the river Meuse and its floodplains. The results presented in this report may help to carry out
SAMENVATTING
In de rivier de Maas zijn zowel laagwater als overstromingen natuurlijke verschijnselen. Dit betekent dat het gebruik van de Maas voor (drink)watervoorziening, scheepvaart en recreatie en het gebruik van de overstromingsvlakte van de Maas voor bebouwing en agrarische productie bepaalde risico’s met zich meebrengt. Er bestaat groeiende bezorgdheid dat deze risico’s zullen toenemen als gevolg van de wereldwijde klimaatverandering. Het belangrijkste doel van dit onderzoek was te analyseren of deze bezorgdheid gerechtvaardigd is. Hieronder zal een antwoord gegeven worden op de vragen gesteld in de introductie van dit rapport.
• Welke verandering van het klimaat wordt voor de 21e eeuw voorspeld voor het stroomgebied van de Maas?
• Is het neerslagregiem in het stroomgebied van de Maas veranderd gedurende de laatste honderd jaar?
De theorie dat de uitstoot van broeikasgassen het wereldklimaat beïnvloedt, wordt ondersteund door de buitengewoon sterke opwaartse trend van de mondiale temperatuur gedurende de 20e eeuw. Hoe het klimaat in het stroomgebied van de Maas beïnvloed zal worden door een wereldwijde temperatuurstijging, is echter moeilijk te quantificeren. De resultaten van ‘global circulation models’ (GCM’s) suggereren dat in het stroomgebied van de Maas de gemiddelde temperatuur zal stijgen, de gemiddelde neerslag gedurende de winter zal toenemen en de gemiddelde neerslag gedurende de zomer zal afnemen. Regionale voorspellingen afgeleid van wereldwijde experimenten, moeten echter met de nodige voorzichtheid geïnterpreteerd worden. Een andere manier om naar klimaatsverandering te kijken is het analyseren van historische reeksen. Neerslagreeksen over de 20e eeuw suggereren een kleine toename van het jaarlijkse en seizoensgemiddelde neerslagvolume, met name gedurende de winter. De natuurlijke variatie van neerslag is echter groot en de gemeten meetreeksen zijn relatief kort. Derhalve kan niet worden geconcludeerd dat er sprake is van een significante trend in de neerslag. Bovendien valt nog te bezien of een eventuele opwaardse trend samenhangt met een wereldwijde temperatuurstijging.
• Is het afvoerregime van de Maas veranderd gedurende de afgelopen honderd jaar?
De natuurlijke verschillen in de afvoer van de Maas zijn groot en de verschillen over langere tijdsintervallen zijn gering. Dientengevolge kan er geen trend worden vastgesteld.
• Heeft de neerslaghoeveelheid in de voorafgaande winter invloed op de duur van de laagwaterperiode in de zomer?
• Zijn er verschillen tussen de deelstroomgebieden met betrekking tot de kwetsbaarheid voor het optreden van laagwater en overstromingen?
In de Maas zijn laagwaterperioden in de zomer een natuurlijk verschijnsel. De analyse van neerslag- en afvoergegevens toonde duidelijk aan dat de duur van een laagwater periode niet alleen afhangt van de neerslag in de zomer, maar ook van de hoeveelheid neerslag gedurende de voorafgaande winter. Dit komt doordat in bepaalde delen van het stroomgebied van de Maas een belangrijk deel van het neerslagoverschot vertraagd wordt afgevoerd. Statistische analyse van afvoerreeksen, gemeten op 23 verschillende locaties, toonde grote verschillen in de mate en snelheid van afvoerfluctuaties in het riviernetwerk. Deelstroomgebieden met kleine en langzame afvoerfluctuaties suggereren een dominantie van langzame afvoercomponenten (grondwaterstroming), terwijl deelstroomgebieden met grote en snelle afvoerfluctuaties een dominantie aangeven van snelle afvoercomponenten. De laatste zijn waarschijnlijk gevoeliger met betrekking tot het optreden van overstromingen en laagwater. Gevoelige deelstroomgebieden liggen in het zuidelijkste puntje van het Franse stroomgebied van de Maas, het oostelijke deel van de stroomgebieden van de Chiers en de Semois en in de Ardennen (de Boven-Ourthe, Lesse, Vesdre en Amblève). Minder kwetsbare deelstroomgebieden liggen in het kalksteengebied van de Condroz, het overgrote deel van het Franse stroomgebied van de Maas en het gebied ten noorden van de Ardennen. De grondwaterreservoirs in deze gebieden dienen beschermd te worden teneinde een minimum
Het afvoerregiem van de Maas wordt bepaald door vele factoren (klimaat, landgebruik, bodemsoort, stroomregulering, enz.). In dit onderzoek zijn drie verschillende neerslag-afvoermodellen gebruikt om het gecombineerde effect van een aantal van deze factoren op het afvoerregiem van de Maas en enkele geselecteerde deelstroomgebieden te analyseren. Het berekende effect van klimaatverandering op het afvoerregiem van de Maas is sterk afhankelijk van het klimaatscenario dat wordt gekozen voor de berekening. De beide klimaatscenarios die voor dit onderzoek zijn gebruikt, resulteren echter in vergelijkbare patronen: een toename van de gemiddelde afvoer aan het einde van de winter en het begin van de lente en een afname van de gemiddelde afvoer in de herfst.
De scenario’s voor verandering in landgebruik werden toegepast op drie kleine deelstroomgebieden. Een simulatie van het verwijderen van drainagebuizen en afwateringssloten en het stoppen van irrigatie suggereert dat een dergelijke verandering in watergebruik door de landbouw het afvoerregiem van beken in het Nederlandse deel van het stroomgebied zal temperen. Dit kan resulteren in lagere afvoeren gedurende de winter en een hogere basisafvoer gedurende de zomer. Of deze drastische maatregelen ook effectief zullen zijn in andere delen van het stroomgebied van de Maas dient nader onderzocht te worden. Simulatie van totale bebossing van twee gebieden in het Belgische stroomgebied suggereert dat dit de gemiddelde hoogwaterstanden zou kunnen reduceren, maar tevens de problemen met betrekking tot laagwater zou kunnen doen toenemen.
De invloed van de mens op het afvoerregime van de Maas was onderwerp van een levendige discussie tijdens de workshop. Gedurende deze discussie werd gesteld dat het gebruik van reservoirs (ondergronds en bovengronds) voor het verlagen van hoogwaterstanden en het verhogen van laagwaterstanden geen eenvoudige zaak is. Deze reservoirs zouden aan het einde van de winter gevuld dienen te worden om in de zomer effectief gebruikt te kunnen worden. Als gevolg daarvan is er aan het einde van de winter minder opslagcapaciteit beschikbaar, hetgeen het risico van overstromingen juist zou kunnen vergroten.
• Zal klimaatverandering de waterkwaliteit in de Maas beïnvloeden?
De problemen met de waterkwaliteit in de Maas zijn het grootst gedurende extreem droge en warme periodes. Echter, de simulatie van het effect van klimaatverandering op een aantal algemene waterkwaliteitsvariabelen suggereert dat deze ‘gemiddelde’ veranderingen geen duidelijke invloed hebben op de ‘gemiddelde’ waterkwaliteit van de Maas. Een kort overzicht
van de literatuur geeft aan dat andere toekomstige veranderingen, zoals het reduceren van de uitstoot van afvalstoffen en veranderingen in de afvoerregulering, een grotere invloed zouden hebben op de kwaliteit van het water in de Maas dan klimaatverandering.
Dit laat de vraag open of de bezorgdheid over het effect van klimaatverandering op de waterhuishouding van de rivier de Maas gerechtvaardigd is. Voor de beantwoording van deze vraag dient men zich te realiseren dat de modelresultaten die in dit rapport worden gepresenteerd gebaseerd zijn op gemiddelde veranderingen. Het effect van temperatuurstijging op het voorkomen van extreme meteorologische gebeurtenissen – en hydrologische gebeurtenissen als gevolg daarvan – is (nog) niet bekend. Dit is daarom geen onderwerp van studie geweest in het hier gepresenteerde rapport. Zo lang de invloed van een mondiale temperatuurstijging op het voorkomen van extreme meteorologische verschijnselen in het stroomgebied van de Maas niet bekend is, blijft er reden voor voortdurende bezorgdheid over de mogelijke effecten ervan.
De overstromingen van 1993 en 1995 hebben het bewustzijn voor het gevaar van overstromingen in het stroomgebied van de Maas gewekt. De herinnering aan extreme lange laagwaterperioden is echter sinds 1976 niet meer opgefrist. De afvoerdata van de Maas bij Monsin geven aan dat laagwaterperioden van meer dan 100 dagen ongeveer een keer per tien jaar voorkomen. Het feit dat een dergelijke langdurige periode van laagwater in de Maas in de laatste 25 jaar niet is voorgekomen, wil niet zeggen dat dit niet in de nabije toekomst kan gebeuren. Sinds 1976 is de scheepvaart op de Maas en het gebruik van Maaswater voor de watervoorziening in België en Nederland belangrijk toegenomen. Dit betekent dat een situatie als die van 1976 grote economische schade zou veroorzaken.
Tot dusver zijn slechts ‘end of the pipe’ maatregelen getroffen om de negatieve effecten van laagwaterperioden in de Maas tegen te gaan (bijv. het inrichten van bufferreservoirs voor de
laagwaterperioden, betere voorspelling van laagwaterperioden en, op de langere termijn, het gebruik van water uit de Schelde (Vlaanderen) en de Rijn (Nederland) als alternatieven voor de drinkwaterproductie.
Hoe de toekomst ook zal zijn, overstromingen en lange perioden van laagwater zullen in de Maas blijven voorkomen. Daarom zullen de voordelen van het gebruik van de rivier de Maas en de overstromingsvlakte van de Maas moeten worden afgewogen tegen de risico’s die met dit gebruik gepaard gaan. De resultaten die in dit rapport gepresenteerd worden kunnen een bijdrage leveren aan deze afwegingen.
1. INTRODUCTION
The rivers Rhine and Meuse are used for water supply for domestic and industrial uses, irrigation, hydropower generation, navigation, in-stream ecosystems, and water-based recreation. There is a growing concern that climate change will change the discharge regime of these rivers, which may hamper the functions of these rivers. Several studies have analysed the impact of climate change on the discharge regime of the Rhine (Middelkoop, 1999; Grabs et al., 1997). To date, the Meuse has received less attention.
The Meuse can be regarded as an almost purely rain-fed river, as opposed to the Rhine, for which snowmelt in the Alps plays an important role. The deviating characteristics of the Meuse justify an additional investigation towards the possible effects of climate change on the hydrology of the Meuse (Van Deursen, 1998). So far, most research on the hydrology of the Meuse focused on peak flows (e.g. Dijkman and Pedroli, 1994; WHM, 1998). The focus of the present study will be on the effects of climate change on low flows in the Meuse, but also aspects of climate change and high flows in the Meuse will be mentioned. The following questions will be addressed in this study:
• Has the precipitation regime in the Meuse basin changed over the last century? • Has the discharge regime of the Meuse changed over the last century?
• Does winter precipitation affect the duration of the low flow period in the summer?
• Does the sensitivity to low flows and floods differ between different sub-catchments of the Meuse basin?
• What is the predicted climate change in the Meuse basin?
• What will be the effect of the predicted climate change on the discharge regime of the Meuse?
• What will be the effect of other future changes on the discharge regime of the Meuse? • Will climate change affect the water quality of the Meuse?
The methodology used is a combination of data analysis and modelling studies. Precipitation and discharge are measured in the Meuse basin and one of the records dates back to the beginning of the 20th century. These records are analysed in order to find out whether precipitation and discharge in the Meuse basin have already changed over the last 90 years
(section 4.1 and 4.2). The relation between precipitation in the Meuse basin and the occurrence of low flows in the river Meuse is addressed in section 4.3. Discharge records from 23 monitoring stations spread across the river Meuse network are used for statistical analysis of (low) flow characteristics in the different tributaries of the Meuse (section 4.4).
Section 5.1 describes how two climate change scenarios for the Meuse basin are derived from the results of Global Circulation Models. These two climate change scenarios are applied to three different rainfall-runoff models in order to simulate changes in discharge patterns in four different sub-catchments (section 5.2). Changes in land cover, irrigation, and drainage management are simulated in section 5.3, in order to get an impression of how climate change relates to other (autonomous or forced) changes in the Meuse basin.
The issue of low flows and water quality is addressed in section 5.4. Section 6 summarises the results of a workshop on climate change and low flows in the river Meuse. Conclusions and recommendations are given in chapter 7. First of all a description of the Meuse basin (chapter 2) and the data used (chapter 3) are given.
2. THE MEUSE
The river basin
The Meuse basin (figure 2.1) covers an area of approximately 33,000 km2, including parts of France, Luxembourg, Belgium, Germany, and the Netherlands. The elevation of the Meuse basin is shown in figure 2.2. The differences in elevation are reflected in the average annual precipitation pattern (figure 2.3). The Meuse basin can be subdivided into three major geological zones: i) the Lotharingian Meuse. This part of the Meuse basin mainly consists of sedimentary Mesozoic rocks, ii) the Ardennes Meuse. Here the river transects the Paleozoic rock of the Ardennes Massif, and iii) the lower reaches of the Meuse. The Dutch and Flemish lowlands are formed by Cenozoic unconsolidated sedimentary rocks. According to Corine data about 34 % of the Meuse basin upstream of the Belgium/Dutch border is defined as agricultural land, 20% as pasture, 35 % as forested, and 9% as built-up area (figure 2.4).
Figure 2.1 The Meuse basin
Figure 2.2 Elevation
Data derived from the USGS DEM, elaborated at the Joint Research Centre, Ispra
Figure 2.3 Average annual precipitation
Data elaborated at the Joint Research Centre, Ispra
Figure 2.4 Land cover
The river network and discharge regime
The river Meuse has a total length of almost 875 kilometres from its source in France to the Hollands Diep in the Netherlands. The most important tributaries of the Meuse are shown in figure 2.1. Low flows in the Meuse mainly occur between May and October. Precipitation is evenly distributed throughout the year, summer low flow coincides with the peak of evaporation during the summer months and high runoff values occur during the winter months when evaporation is small. Figure 2.5 shows the average monthly discharge of four monitoring stations along the Meuse. The flow regime of the Meuse is strongly influenced by the construction of weirs and locks, withdrawals of water, and canalisation (Berger, 1992). Downstream of Liège there are a number of canals that are fed by water from the Meuse. The most important are the Albertkanaal (16-22 m3s-1), the Zuid-Willemsvaart (approximately 16 m3s-1), and the Julianakanaal (approximately 16 m3s-1). These canals are not only used for navigation but also play an important role in the water supply in Flanders and the southern Netherlands. Reservoirs are found in the upper branches of the Rur (Germany), the Viroin, the Semois, the Sambre, the Ambleve, the Ourthe, and the Vesdre. These reservoirs are used for electricity production, drinking water supply, and flow regulation. Except for the Rur reservoir and the reservoir in the Eau d'Heure (Sambre), these reservoirs are too small to have a major effect on the discharge regime of the Meuse.
Figure 2.6 compares the discharge regime of the Meuse with the discharge regime of other rain-fed rivers of comparable size located in the vicinity of the Meuse basin. This figure shows that the average discharge regime of the Meuse, expressed as the ratio of monthly and annual averages, is more variable compared to that of the other rivers. This implies that the Meuse has a relatively fast response to precipitation and is therefore relatively sensitive to both flooding and drought. Figure 2.7 shows that the discharge of the Meuse also strongly varies over the years.
Low flows in the Meuse
During an average year there is sufficient water to fulfil the water supply, navigation and ecological functions of the Meuse. However, even under the ‘current’ climate there are many summers when the supply of water from the Meuse cannot meet the demands. Water stress
occurs when the discharge rate at Monsin (near Liège) drops below 60 m3·s-1 (personal comment Rijkswaterstaat Directie Limburg). Figure 2.8 shows the number of days over the past century that this situation occurred.
During periods of low flows weirs are operated to maintain a minimum water level. This reduces the flow velocity and turbulence in the river, which in turn may lead to increased growth of algae (Ietswaart & van Dijk, 1996). Low flows also lead to water quality degradation, as the diluting and aerating capability of streams and rivers is reduced. Water from the Meuse is used for the water supply of about six million people in Belgium and the Netherlands (RIWA, 1995). The demand for water of good quality has increased with the advent of industrialisation and rapid population growth and is expected to increase further in the nearby future (WL, 1996). There is also a tendency to exploit more surface water instead of groundwater. All these factors explain the concern for the possible negative effects of climate change on the (drinking) water supply and shipping in the river Meuse (Van Deursen, 1998; Philips, 2000).
Figure 2.5 Average monthly discharges of the Meuse at Stenay (3904 km2), Chooz (10120 km2), Borgharen (21260 km2), and Lith (29370 km2).
The relatively low summer discharge at Borgharen reflects the water inlet to the canals upstream of Borgharen. 0 100 200 300 400 500 600 700
jan feb mar apr may jun jul aug sep oct nov dec
m3/s
Stenay 1963-1996 Chooz 1968-1997 Borgharen 1968-1998 Lith 1911-1985
Figure 2.6 Normalised monthly discharge regimes of a number of Northwest European rivers. 0.0 0.5 1.0 1.5 2.0 2.5
jan feb mar apr may jun jul aug sep oct nov dec
Q a vg M onth / Q a vg Year Meuse 1961-1998 +/-20.000 km2 Mosel 1980-1996 +/-25.000 km2 Main 1973-1996 +/-25.000 km2 Weser 1980-1995 +/-35.000 km2 Havel 1983-1995 +/-25.000 km2 Neckar 1980-1996 +/-15.000 km2
Figure 2.7 Average, minimum, maximum, and percentiles of the discharge at Meuse-Monsin (1911-1998)
In both boxes the black line shows the average monthly discharge (note that the two boxes have different scales for the y-axis). During 10% of the years the average monthly discharge exceeded the value given in the dotted line of the upper graph and during 10% of the years the average monthly discharge was less than the value given in the dotted line in the under graph. The + sign gives the maximum discharge that has been recorded in the specific month, whereas the - sign gives the minimum discharge that has been recorded in the specific month.
0 600 1200 1800 2400 3000
Jan Feb Mar Apr May Jun Jul Aug Sep Oct Nov Dec
m3/s Avg Max 90% 200 300 400 500 600 m3/s Avg Min 10%
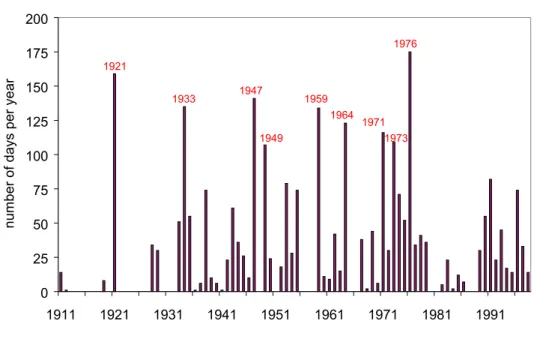
Figure 2.8 Annual number of days with a critical discharge rate of less than 60 m3s-1 at Meuse-Monsin over the period 1911-1998
0 25 50 75 100 125 150 175 200 1911 1921 1931 1941 1951 1961 1971 1981 1991 num
ber of days per year
1976 1921 1933 1947 1959 1964 1949 1971 1973
The Meuse fulfils an important link in the network of canals and rivers that connect the harbours of Antwerp and Rotterdam to the European hinterland. About 30,000 cargo-boats a year navigate the river Meuse. These numbers are expected to increase since the national authorities stimulate transport by water (personal comment Rijkswaterstaat Directie Limburg). Low flows (and floods) hamper the transport capacity of the waterways and lead to severe economical damage (e.g. RWS, 1983).
Meuse water is also used for the irrigation of agricultural land in Flanders and the southern part of the Netherlands. In general the need for irrigation water negatively corresponds with the discharge in the river Meuse. Long lasting low flows in the Meuse limit the water supply to agriculture. Another problem that is caused by low flows in the Meuse is the intrusion of seawater near the mouth of the Meuse (and Rhine). Finally, concern exists for the ecological functioning of the river Meuse during low flows, especially for the common Meuse (Flemish/Dutch border) (Salverda et al., 1998).
In 1995 the Flemish and Dutch authorities signed a treaty with respect to the water distribution between Meuse and the Dutch and Flemish canals. This treaty regulates an equal distribution of water and a shared responsibility for the common Meuse.
Floods in the Meuse
The flood of 1993 resulted in the largest peak discharge in the Meuse since 1926, and the flood of 1995 was of comparable size. The damage of the 1993 flood was estimated at more than 100 million Euro for the dutch province of Limburg alone (Dijkman & Pedroli, 1994). The damage of the 1995 flood was estimated at about 25 million Euro for the Belgium alone (KINT, 1999). The 1993 and 1995 floods have initiated several actions to combat flood problems in the Meuse (WHM, 1998). These actions include both measures to reduce the occurrence of peak flows (e.g. water retention and flow regulation) and measures to reduce the damage caused by floods (e.g. improved flood forecasting and improvements of embankments).
3. DATA
Daily discharge records
In some tributaries of the Meuse the discharge regime is strongly influenced by human impacts (e.g. the Sambre). Stations located at these tributaries were excluded from this study. This selection was based on expert judgements of the data providers. Also stations with a large number of missing data were not used. The remaining 24 stations used in this study are presented in figure 3.1 and table 3.1. The station Meuse-Monsin (code 24, near Liège) is an important record used in this study. This station represents the ‘undivided Meuse’. Downstream of Monsin the ‘Kempische’ canals branch off. The discharge downstream of Monsin (e.g. at Borgharen) is influenced by the water flow in these canals. Discharge is not directly measured at Monsin. The record has been derived from discharge measurements at Borgharen, adjusted with information on water flows towards the canals between Monsin and Borgharen (personal comment, Rijkswaterstaat Directie Limburg).
Monthly precipitation records
The longest discharge record available (Meuse-Monsin/Borgharen) dates back to 1911. For precipitation even longer records exist, but here only data from 1911 to 1998 have been used. The analyses presented in this report are based on monthly average precipitation data measured at eight stations in Belgium (see figure 3.2). Information about the origin and quality of these data is given in Demarée et al. (1994). For comparison also monthly average precipitation data for De Bilt (Central Netherlands), Paris, and Strasbourg have been collected (KU, 2000). The total list of stations used is given in table 3.2. It should be noted that over the last century the methodology to measure precipitation has slightly changed. It is assumed that these changes do not have a major impact on the results of the analyses (see also Demarée et al., 1994).
Case studies
The impact of climate change on the hydrology of the Meuse is simulated with distributed rainfall-runoff models (section 5.2). These rainfall-runoff models are applied to four different sub-basins of the Meuse basin; the basin of the Ourthe Orientale upstream of Mabompre, the
basin of the Mehaigne upstream of Moha, the basin of the Beerze, and the basin of the Meuse upstream of Borgharen. Section 5.4 presents a simulation of the water quality in the Belgian part of the Meuse. All these models have been calibrated with data for the period 1988-1992. For a description of the data underlying these case studies, the reader is referred to the separate reports, which are mentioned in chapter 5 and appendix 2.
Figure 3.1 Location of discharge stations
Table 3.1 Monitoring stations daily discharge
River Station Code
(figure 3.1) Basin
km2 First yearused Last yearused Origin Data
Amblève Martinrive 1 1068 1968 1998 MET a
Eau Blanche Nismes 2 254 1969 1990 MET
Eau Noire Couvin 3 176 1986 1996 MET
Essche Stroom Nemelaer 4 330 1973 1996 WSD b
Hoyoux Modave 5 94 1973 1987 MET
Lesse Gendron 6 1314 1968 1998 MET
Mehaigne Moha 7 343 1969 1996 MET
Meuse Borgharen 8 21260 1968 1998 RWS c
Meuse Chooz 9 10120 1968 1997 DIREN d
Meuse Domrémy-la-Pucelle 10 1031 1987 1996 DIREN
Meuse Goncourt 11 364 1980 1996 DIREN
Meuse Montcy-Notre-Dame 12 7724 1985 1992 DIREN
Meuse Saint-Mihiel 13 2540 1985 1996 DIREN
Meuse Stenay 14 3904 1985 1996 DIREN
Meuse Vaucouleurs/Chalaines 15 1717 1986 1996 DIREN
Molignée Warnant 16 125 1969 1996 MET
Nieuwe Leij Goirle 17 115 1980 1994 WSD
Ourthe Nisramont 18 737 1978 1996 MET
Ourthe Tabreux 19 1616 1968 1998 MET
Ourthe Occidentale Ortho 20 386 1978 1996 MET
Ourthe Orientale Mabompré 21 317 1978 1996 MET
Semois Ste. Marie 22 143 1978 1996 MET
Vesdre Chaudfontaine 23 677 1968 1998 MET
Meuse Monsin e 24 20000 1911 1998 RWS
a Ministère wallon de l'Equipement et des Transports, Belgium b Waterschap de Dommel, The Netherlands
c Rijkswaterstaat Nederland, The Netherlands
d Direction Régionale de l'Environnement Lorraine, France
e The discharge record of Monsin has been composed from discharge data measured at Borgharen and information about the water inlet to
Figure 3.2 Location of precipitation stations
Table 3.2 Monitoring stations monthly precipitation
Station Code
(figure 3.2)
Elevation (m)
First Year Last Year Origin Data Ath Chièvres 1 19101983 19821999 RMI a Thimister 2 1910 1999 RMI Rochefort 3 1910 1999 RMI Denée Maredsous Mettet Saint-Gérard 4 1910 1982 1992 1981 1991 1999 RMI Ukkel 5 1910 1999 RMI Leopoldsburg Koersel 6 1910 1982 1981 1999 RMI Stavelot 7 1910 1999 RMI Chimay 8 1910 1999 RMI
Climate change scenarios
All climate change impact studies that are initiated by the Dutch National Programme on Climate Change and Air Pollution ( NOP ) are requested to use a climate change scenario that is based on the results of the HadCM2Gsa1 run. This global circulation model (GCM) has been developed at the Hadley Centre and its results are distributed by the Climate Research Unit of the University of East Anglia (Verweij & Viner, 2001). For comparison also the results of some other GCM runs were used in this study (table 3.3). The results of these GCMs were derived from the homepage of the Data Distribution Centre (DDC) of the Intergovernmental Panel on Climate Change (IPCC). This was done by the Royal Meteorological Institute of Belgium (RMI). The RMI uses these data for impact studies in Belgium (Roulin et al., in prep). GCMs are grid-based global models. A typical spatial resolution of these models is shown in figure 3.3. For a more detailed description of all GCM runs used in this study the reader is referred to the homepage of the DDC (http://ipcc-ddc.cru.uea.ac.uk/).
Table 3.3 GCM output used
GCMrun Computation Centre Elaborated by Averaged at
HADCM2Gsa1 Hadley Centre, UK Verweij & Viner (2001) See figure 3.3
HADCM2Gga1 Hadley Centre, UK RMI 50°5'N 5°E
HADCM2Gga2 Hadley Centre, UK RMI 50°5'N 5°E
HADCM2Gga3 Hadley Centre, UK RMI 50°5'N 5°E
HADCM2Gga4 Hadley Centre, UK RMI 50°5'N 5°E
CGCM1 Canadian Centre for Climate Modelling and Analysis RMI 50°5'N 5°E CSIRO-MK2 Austalia's Commonwealth Scientific and Industrial Research Org. RMI 50°5'N 5°E CCSR-98 Center for Climate Research Studies, Japan RMI 50°5'N 5°E
Figure 3.3 Example of spatial resolution GCM output (cells HADCM2 runs)
For the HADCM2gsa1 run a weighted average of four cells was calculated to represent the Meuse basin: The weight of each cell was roughly derived from the overlap of the cell with the Meuse basin
Cell (x;y;weight): 2;17;0.5 2;18;0.2 3;17;0.2 3;18;0.1 Source: Climate Research Unit, University of East Anglia, UK
4 ANALYSIS OF PRECIPITATION AND DISCHARGE RECORDS
4.1 Precipitation
Has the precipitation regime in the Meuse basin changed over the last century?
The prediction that global temperature increases as a result of greenhouse gas emissions is supported by the exceptional upward trend of the global temperature over the 20th century (IPCC, 2001). This upward trend has been derived from temperature measurements all over the world, and suggests that greenhouse gas emissions are already influencing global climate. This raises the question whether one can also observe changes in temperature and precipitation for Northwest Europe (including the Meuse basin) over the last century.
In the third assessment report of the state of the climate in the Netherlands the KNMI (1999) concludes; 'The average temperature in the Netherlands was 0.7 oC higher in the last twenty years than it was in the first twenty years of this century. There was also more precipitation in the second half of the century, which may be partially related to the warmer weather. The changes in temperature and precipitation levels, which were the greatest in winter, can be largely attributed to remarkable variations in atmospheric circulation' (see also
http://www.knmi.nl/onderzk/). Also Pfister et al. (2000) report a marked increase of the westerly air currents above (North-)Western Europe. They found that this change in atmospheric circulation corresponds with an increase in rainfall intensity and duration in Luxembourg since the 1950s. The variations of atmospheric circulation may primarily have natural causes, but are also consistent with some of the increasing CO2 GCM experiments (Dai et al. (1997). An overview of the climate in the 20th century for Belgium is presented at: http://www.meteo.oma.be/IRM-RMI/century/xxeeuw.htm.
In addition, the monthly precipitation records for the eight Belgian stations presented in figure 3.2 (station codes 1 to 8) were analysed. The monthly values for all stations were simply averaged (not weighted), resulting in one value representing the Belgian part of the Meuse basin. This average record is here named ‘record Ardennes’. The monthly values of the Ardennes record have been averaged for hydrological years (November to October), the winter period (November to April) and the summer period (May to October). The results are shown in figure 4.1. The differences between the average monthly precipitation values for
1910-1954 and the average monthly precipitation values for 1955-1998 (in terms of percentage) are plotted in figure 4.2. This graph compares the Ardennes record with the average of the values measured in De Bilt, Paris, and Strasbourg. This shows that the monthly pattern of change is rather consistent between the two records. In chapter 5 this graph (figure 4.2) will be compared with changes in the monthly discharge pattern of the Meuse.
Conformable the conclusions of the above studies, the records presented in figure 4.1 suggest a small increase of annual and seasonal average precipitation volumes, especially during the winter season. However, the natural variability of the climate is large and the data series used for the analyses described above are relatively short. Therefore, one cannot conclude that there is a significant upward trend in precipitation in the Meuse basin (see table 4.1). Moreover, it remains to be seen whether the changes observed are due to global warming or not.
Figure 4.1 Precipitation record 'Ardennes'
Each dot represents a measured year/season. The line represents the moving average (window 10 years). The index value is calculated as the ratio of the value for the specific year and the average value for the period 1911-1998. So an index value of 1 represents an average year/season, an index value smaller than 1 represents a relatively dry year/season, and an index value large than 1 represents a relatively wet year/season.
a
Average hydrological year
(November-October)) b Average winter (November-April) c Average summer (May-October) 0.2 0.4 0.6 0.8 1.0 1.2 1.4 1.6 1911 1921 1931 1941 1951 1961 1971 1981 1991 Index 'Ardennes' 0.2 0.4 0.6 0.8 1.0 1.2 1.4 1.6 1911 1921 1931 1941 1951 1961 1971 1981 1991 Index 'Ardennes' 0.2 0.4 0.6 0.8 1.0 1.2 1.4 1.6 1911 1921 1931 1941 1951 1961 1971 1981 1991 Index 'Ardennes'
Table 4.1 Regression analysis of the precipitation record
This table shows the calculated value, standard error and 95% confidence intervals of the slopes of linear regressions applied to the records presented in figure 4.1. Positive slopes were calculated for all three records, suggesting an increase of precipitation. However, no trend (a slope of zero) falls within the confidence interval. The analysis presented in this table allows for a rough detection of trends. A more extended trend analysis, including a critical evaluation of the time series used falls beyond the scope of this study.
Variable Slope of lineair
regression
Standaar error Lower bound Upper bound
P year (mm/year) 0.699 0.577 -0.447 1.846
P winter (mm/month) 0.066 0.069 -0.071 0.203
P summer (mm/month) 0.045 0.066 -0.086 0.176
Figure 4.2 Relative change in monthly average precipitation values (%)
Change is P (1955-1998) minus P (1910-1954) -30 -20 -10 0 10 20 30
jan feb mar apr may jun jul aug sep oct nov dec
Change (%)
Ardennes
Average De Bilt, Paris and Strasbourg
period) daily discharge values. Figure 4.3 shows that the average annual and seasonal discharge has hardly changed over the last century. However, the maximum measured daily winter discharge values seem to have increased (figure 4.3b), whereas the minimum summer discharges seem to have decreased (figure 4.3c). The natural variability of the discharge of the Meuse is large (see also figure 2.7), the differences over time are relatively small, and the discharge record is relatively short. Therefore, one cannot identify a significant trend from these discharge records (see table 4.2). One exception is the observed pattern for the minimum summer discharge (figure 4.3c). The upper bound of the 95% coinfidence interval is below zero. This suggests a downward trend for the minimum summer discharge.
The possible increase in maximum winter discharge (figure 4.3) is conformable to the possible increase in winter precipitation of the Ardennes record (figure 4.1b). The decrease of the minimum (and average) summer discharges (figure 4.3c) is not in accordance with the possible increase of the (summer) precipitation in the Ardennes (figure 4.1c). This might be due to an increase of water abstractions upstream, flow regulation, and/or changes in land use. Another possible explanation may be the increase of evaporation, caused by an increase in temperature (see chapter 4). Also systematic errors related to the indirect composition of the Monsin record (see chapter 3) may have caused a trend in the data.
The differences between the average monthly discharge values for 1910-1954 and the average monthly discharge values for 1955-1998 (in terms of mm/month) are plotted in figure 4.4. This figure also includes the differences in average monthly precipitation values of the Ardennes record (see also figure 4.2). It appears that changes in the monthly average discharge regime of the Meuse are not simply a reflection of changes in the monthly average precipitation regime of the Ardennes record. This stresses the need for a more detailed analysis of rainfall-runoff processes in the Meuse basin (see chapter 5).
Figure 4.3 Discharge record Meuse-Monsin (Nov-Oct).
Each bar represents a year. The line shows the moving average (window 10 years) a
Annual average discharge (Nov-Oct)
b
Average winter discharge (Nov-Apr)
Black line for the maximum daily values, white line for the average values
c
Summer discharge Meuse-Monsin (May-Oct). Black line for the average values, white line for the minimum values 0 100 200 300 400 500 1911 1921 1931 1941 1951 1961 1971 1981 1991 m3/s 0 500 1000 1500 2000 2500 3000 3500 1911 1921 1931 1941 1951 1961 1971 1981 1991 m3/s 150 200 250 300 m3/s
Table 4.2 Regression analysis of the discharge record
This table shows the calculated value, standard error and 95% confidence intervals of the slopes of linear regressions applied to the records presented in figure 4.3. Except for Qmin summer, no trend (a slope of zero) falls
within the confidence interval of the regression analysis. The analysis presented in this table allows for a rough detection of trends. A more extended trend analysis, including a critical evaluation of the time series used falls beyond the scope of this study.
Variable Slope of lineair
regression
Standaar error Lower bound Upper bound
Qavg year (m3/s) -0.142 0.308 -0.755 0.470
Qavg winter (m3/s) -0.210 0.521 -1.247 0.826
Qmax winter (m3/s) 3.027 2.177 -1.299 7.354
Qavg summer (m3/s) -0.131 0.217 -0.563 0.301
Qmin summer (m3/s) -0.222 0.087 -0.395 -0.048
Figure 4.4 Relative change in monthly average precipitation (Ardennes record) and discharge values (Meuse-Monsin) (%)
Change is (1955-1998) versus (1910-1954) -30 -20 -10 0 10 20 30
jan feb mar apr may jun jul aug sep oct nov dec
Change (%)
P Q
4.3 Winter precipitation and summer discharge
Does winter precipitation affect the duration of the low flow period in the summer?
In chapter 2 the Meuse is characterised as a relatively fast responding river (see figures 2.6 & 2.7). This implies that compared to some other rivers the discharge of the Meuse will decrease relatively fast during a dry period. This raises the question; how fast? Is one dry summer enough to result in a long lasting low flow period in the river Meuse, or is the magnitude and
duration of the low flow also influenced by the precipitation in the previous winter? To answer this question the average annual (November to October), winter (November to April), and summer (May to October) precipitation indices of the Ardennes record have been compared with the number of days (during one year) that the discharge of the Meuse at Monsin dropped below a critical discharge rate of 60 m3·s-1. The results are presented in figure 4.5. This figure can be used to analyse to what extent low flows correspond with low precipitation values in the summer and with low precipitation values in the (previous) winter. This visual analysis reveals the following:
The longest low flow periods in the Meuse were recorded in 1921 and 1976. In these years a dry winter was followed by a very dry summer. The winters of 1932/1933 and 1995/1996 are the driest winters in the Ardennes record, but no long lasting low flows were recorded in these years, because the summers of 1933 and 1996 were not dry. The summers of 1975 and 1991 were much drier than the summers of 1964, 1971, and 1973. However, the duration of the low flow period was longer in 1964, 1971, and 1973 than in 1975 and 1991. This can be explained by the fact that the winters of 1974/1975 and 1990/1991 were relatively wet, whereas the winters of 1964, 1971, and 1973 were relatively dry. Summarising, it can be said that long lasting low flow periods occur when a dry winter is followed by a dry summer. A dry winter followed by a wet summer or a wet winter followed by a dry summer does not result in a long lasting low flow period in the Meuse.
Between 1910 and 2000 there were nine years where the discharge at Monsin was below 60 m3/s-1 for more than 100 days in one year (see also figure 2.8). The latest of these long lasting low flow periods was 25 years ago in 1976! The observation period is too short to conclude whether this is purely coincidental (no sequence of dry winter and dry summer) or a sign of climate change.
where IPwinter is the index for the winter precipitation, IPsummer is the index for the summer precipitation, Pwinter is the winter precipitation (November to April) , Psummer is the summer precipitation (May-October), i is the specific year (November-October), and avg is the average value for all years in the Ardennes record (1910-1998). So an index value smaller than 1 represents a dry season and an index value larger than 1 represents a wet season.
The summer baseflow is here calculated as the average value of the minimum discharge values for each of the six summer months (May-October):
BFsummer = [Qminmay + Qminjune + Qminjuly + Qminaugust + Qminseptember + Qminoctober) / 6
where BFsummer is the summer baseflow and QminMay..October is the minimum measured discharge in May....October. The baseflow index of the summer is then calculated as:
IBFsummer,i= BFsummer,i /BFsummer,avg
where IBFsummer is the index for the summer baseflow, BFsummer is the summer baseflow (may to october), i is the specific year, and avg is the average value for all years in the discharge record (for duration of the different records see table 3.1). An index value smaller than 1 represents a summer with a relatively low baseflow and an index value larger than 1 represents a summer with a relatively large baseflow.
Figure 4.6a shows that for some sub-basins the summer baseflow index correlates better with the winter precipitation index than with the summer precipitation index. This suggests basins with a relatively long memory. For other basins it is found that the summer baseflow index correlates better with the summer precipitation index than with the winter precipitation index. This suggests basins with a relatively short memory (figure 4.6b). Figure 4.6c suggests that the Meuse basin upstream of Monsin is a mixture of 'short memory' and 'long memory' basins. The summer baseflow index shows some correlation to both winter and summer precipitation indices. A more detailed characterisation of the 'hydrological response' of the different sub-catchments will be given in section 4.4.
The above mentioned analyses clearly show that the precipitation in the previous winter influences the length of the low flow period in the summer. This means that at the end of the
winter (April) one can estimate the chance in a long lasting low flow period in the Meuse for the coming summer. Appendix 1 gives an example of what such a 'low flow forecasting' methodology could look like.
Figure 4.5 November-April precipitation index (top), and May-October (bottom) precipitation index ‘Ardennes record’ (black, 1st y-axis) versus the duration of the low flow period in the Meuse (grey, 2nd y-axis)
These two graphs are used to analyse the relation between seasonal precipitation volumes and the length of the low flow period
0 0.5 1 1.5
1910 1920 1930 1940 1950 1960 1970 1980 1990
Index Precipitation Nov-Apr (-)
0 100 200 300
Q Meuse-Monsin < 60 m3/s (number of days)
0 0.5 1 1.5
1910 1920 1930 1940 1950 1960 1970 1980 1990
Index Precipitation May-Oct (-)
0 100 200 300
Figure 4.6 Scatterplot of precipitation (left graph November to April, and right graph May to October) and baseflow indices (May to October). Each point represents a year/season.
a Sub-catchment with a relatively long memory (Molignée 1969-1998)
b Sub-catchment with a relatively short memory (Amblève 1968-1998)
c A mixture of different sub-catchments (Meuse basin upstream of Monsin 1911-1998)
2.0 2.0 0.0 0.5 1.0 1.5 2.0 0.0 0.5 1.0 1.5 2.0
Index Precipitation (Nov-Apr)
Index Baseflow (May-Oct)
0.0 0.5 1.0 1.5 2.0 0.0 0.5 1.0 1.5 2.0
Index Precipitation (May-Oct)
Index Baseflow (May-Oct)
0.0 0.5 1.0 1.5 2.0 0.0 0.5 1.0 1.5 2.0
Index Precipitation (Nov-Apr)
Index Baseflow (May-Oct)
0.0 0.5 1.0 1.5 2.0 0.0 0.5 1.0 1.5 2.0
Index Precipitation (May-Oct)
4.4 Statistical analysis of 23 discharge time series
Does the sensitivity to low flows and floods differ between sub-catchments of the Meuse basin?
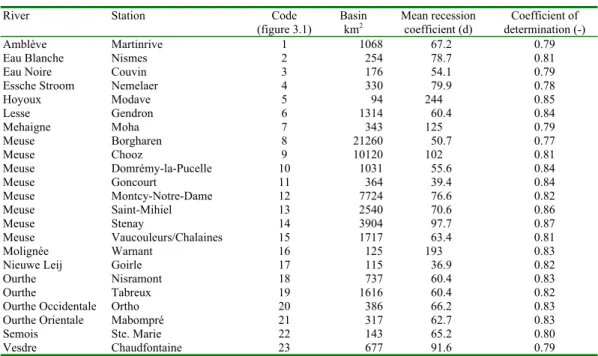
The Meuse basin covers a wide range of landscapes (see chapter 2). These different landscapes have different hydrological characteristics. This implies that the sensitivity to both low flows and flooding differ between the geographical regions. In order to plan preventive measures and mitigate the impacts of drought, one needs to know which sub-catchments of the Meuse basin are most sensitive with regard to low flows and floods. This chapter presents the results of a statistical analysis of the discharge data, aiming at an identification of discharge characteristics of different sub-catchments of the Meuse basin. A complete description of the statistical analysis of the discharge data is given in Uijlenhoet et al. (2001), here only the major findings are presented. The analysis covers all stations listed in table 3.1, except for station Monsin (nr. 24).
Statistical analysis of the discharge data
If the discharge time series are regarded as realisations of stationary stochastic processes, two aspects of their variability need to be distinguished: the magnitude of their fluctuations and the speed of their fluctuations. In order to assess the sensitivity of the various sub-catchments to low flows and floods, both aspects require quantification.
The magnitude of the daily discharge fluctuation has been dealt with through identification of the mean daily discharges and the standard deviation. If the standard deviations are normalised by dividing them by the corresponding means, the coefficients of variation (CV) are obtained. The CV values are a measure of the magnitude of the variability. A small CV value indicates little fluctuation of the discharge, whereas a large CV value indicates a large fluctuation of the discharge. The mean daily discharge, standard deviation, and CV values for all 23 stations are presented in table 4.3.
Recession coefficients are a measure for the speed of flow recession. The calculation of the recession coefficients is based on exponentially decaying hydrograph tails (consistent with the
linear reservoir model). The recession coefficients were only calculated for dry spells (see Uijlenhoet et al., 2001). The criteria used to calculate the recession coefficients were:
• the length of a recession period, defined as the length of the interval between the beginning of a dry spell and the day with the minimum discharge during a dry spell, has to be at least 60 days;
• the correlation coefficient between the logarithm of the discharges during the recession period and the corresponding day numbers has to be negative;
• the coefficient of determination of a linear regression between the logarithm of the discharges during the recession period and the corresponding day numbers (i.e. the square of the correlation coefficient) has to be at least 0.7.
Table 4.4 presents the estimated recession coefficients and the estimated coefficients of determination. Large recession coefficients indicate slow discharge recession, and small recession coefficients indicate fast discharge recession.
Table 4.3 Magnitude of discharge fluctuation: Coefficient of variation
River Station Code
(figure 3.1) Basinkm2 discharge (mMean daily3s-1) Standard deviation(m3s-1) Coefficient ofvariation (-)
Amblève Martinrive 1 1068 18.6 20.7 1.11
Eau Blanche Nismes 2 254 3.1 4.5 1.44
Eau Noire Couvin 3 176 3.1 5.1 1.64
Essche Stroom Nemelaer 4 330 3.1 2.8 0.92
Hoyoux Modave 5 94 1.1 0.6 0.52 Lesse Gendron 6 1314 17.4 21.8 1.25 Mehaigne Moha 7 343 2.5 2.4 0.96 Meuse Borgharen 8 21260 227 268 1.18 Meuse Chooz 9 10120 147 151 1.03 Meuse Domrémy-la-Pucelle 10 1031 11.1 18.1 1.64 Meuse Goncourt 11 364 4.3 7.8 1.83 Meuse Montcy-Notre-Dame 12 7724 100 94.7 0.95 Meuse Saint-Mihiel 13 2540 29.7 41.2 1.39 Meuse Stenay 14 3904 46.7 52.1 1.12 Meuse Vaucouleurs/Chalaines 15 1717 21.4 33.3 1.56 Molignée Warnant 16 125 1.4 1.1 0.81
Nieuwe Leij Goirle 17 115 0.9 1.2 1.33
Ourthe Nisramont 18 737 13.0 16.0 1.23
Ourthe Tabreux 19 1616 22.2 27.0 1.22
Ourthe Occidentale Ortho 20 386 6.9 8.1 1.17
Ourthe Orientale Mabompré 21 317 5.3 6.5 1.22
Semois Ste. Marie 22 143 2.4 3.4 1.40
Vesdre Chaudfontaine 23 677 10.3 11.5 1.12
Table 4.4 Speed of discharge recession: recession analysis
River Station Code
(figure 3.1)
Basin
km2 Mean recessioncoefficient (d) determination (-)Coefficient of
Amblève Martinrive 1 1068 67.2 0.79
Eau Blanche Nismes 2 254 78.7 0.81
Eau Noire Couvin 3 176 54.1 0.79
Essche Stroom Nemelaer 4 330 79.9 0.78
Hoyoux Modave 5 94 244.0 0.85 Lesse Gendron 6 1314 60.4 0.84 Mehaigne Moha 7 343 125.0 0.79 Meuse Borgharen 8 21260 50.7 0.77 Meuse Chooz 9 10120 102.0 0.81 Meuse Domrémy-la-Pucelle 10 1031 55.6 0.84 Meuse Goncourt 11 364 39.4 0.84 Meuse Montcy-Notre-Dame 12 7724 76.6 0.82 Meuse Saint-Mihiel 13 2540 70.6 0.86 Meuse Stenay 14 3904 97.7 0.87 Meuse Vaucouleurs/Chalaines 15 1717 63.4 0.81 Molignée Warnant 16 125 193.0 0.83
Nieuwe Leij Goirle 17 115 36.9 0.82
Ourthe Nisramont 18 737 60.4 0.83
Ourthe Tabreux 19 1616 60.4 0.82
Ourthe Occidentale Ortho 20 386 66.2 0.83
Ourthe Orientale Mabompré 21 317 62.7 0.83
Semois Ste. Marie 22 143 65.2 0.80
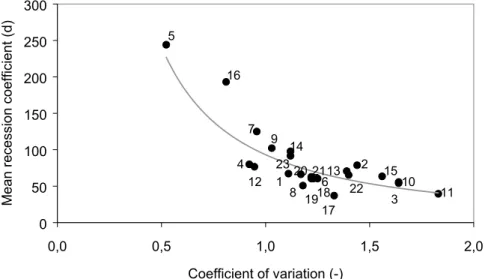
Figure 4.7 shows a scatterplot of the CVs and recession coefficients. Not surprisingly, these two derived variables do correlate. This implies that one can distinguish between sub-catchments with a relatively small discharge variability and a slow discharge recession, and sub-catchments with a relatively large discharge variability and a fast discharge recession.
Figure 4.7 Scatterplot of magnitude (Coefficient of Variation) and speed (Recession Coefficient) of discharge fluctuation. Numbers correspond to monitoring stations (table 3.1).
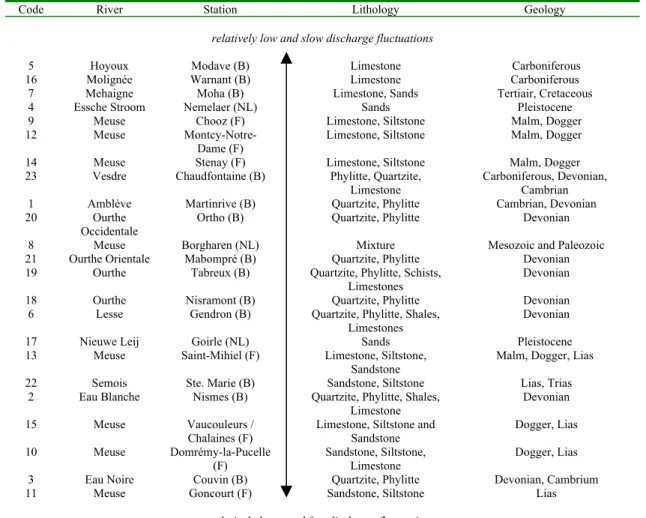
It appears that the magnitude and speed of the discharge fluctuations bare little or no correlation to the size of the upstream drainage areas (tables 4.3 and 4.4). This is somewhat surprising, one would expect that the fluctuations average out when moving to larger catchments. This implies that other catchment characteristics are also distinctive. Based on figure 4.7 the discharge stations were ordered from 'small and slow' discharge fluctuations to 'large and fast' discharge fluctuations. This ordering was done 'by eye' and the sequence is shown in table 4.5. This table also gives a rough characterisation of the lithology and geology in the upstream basins. This rough characterisation has been derived from BRGM (1996) and
0 50 100 150 200 250 300 0,0 0,5 1,0 1,5 2,0 Coefficient of variation (-)
Mean recession coefficient (d)
5 16 8 20 1 23 14 9 7 4 12 11 10 3 15 13 22 17 18 19 6 21 2
17). The relatively fast and large fluctuations of the catchment of the Nieuwe Leij (17), have most probably to be addressed to characteristics other than lithology. Striking are also the relatively large and fast fluctuations in the catchments located in the Lias formation (11, 10, 15, 22). A possible explaination may be that, compared to the Malm and Dogger formations (sub-catchments 9, 12-15), the Lias formation consists of less permeable rock types. Based on the rough lithological and geological characterisations presented in table 4.5, one cannot distinguish between the different sub-catchments in the Ardennes Massif.
Table 4.5 Rough characterisation of discharge fluctuation, lithology and geology of the sub-basins
Code River Station Lithology Geology
relatively low and slow discharge fluctuations
5 Hoyoux Modave (B) Limestone Carboniferous
16 Molignée Warnant (B) Limestone Carboniferous
7 Mehaigne Moha (B) Limestone, Sands Tertiair, Cretaceous
4 Essche Stroom Nemelaer (NL) Sands Pleistocene
9 Meuse Chooz (F) Limestone, Siltstone Malm, Dogger
12 Meuse
Montcy-Notre-Dame (F) Limestone, Siltstone Malm, Dogger
14 Meuse Stenay (F) Limestone, Siltstone Malm, Dogger
23 Vesdre Chaudfontaine (B) Phylitte, Quartzite, Limestone
Carboniferous, Devonian, Cambrian 1 Amblève Martinrive (B) Quartzite, Phylitte Cambrian, Devonian
20 Ourthe
Occidentale
Ortho (B) Quartzite, Phylitte Devonian
8 Meuse Borgharen (NL) Mixture Mesozoic and Paleozoic
21 Ourthe Orientale Mabompré (B) Quartzite, Phylitte Devonian 19 Ourthe Tabreux (B) Quartzite, Phylitte, Schists,
Limestones Devonian
18 Ourthe Nisramont (B) Quartzite, Phylitte Devonian
6 Lesse Gendron (B) Quartzite, Phylitte, Shales, Limestones
Devonian
17 Nieuwe Leij Goirle (NL) Sands Pleistocene
13 Meuse Saint-Mihiel (F) Limestone, Siltstone, Sandstone
Malm, Dogger, Lias 22 Semois Ste. Marie (B) Sandstone, Siltstone Lias, Trias
2 Eau Blanche Nismes (B) Quartzite, Phylitte, Shales, Limestone
Devonian
15 Meuse Vaucouleurs /
Chalaines (F)
Limestone, Siltstone and Sandstone Dogger, Lias 10 Meuse Domrémy-la-Pucelle (F) Sandstone, Siltstone, Limestone Dogger, Lias 3 Eau Noire Couvin (B) Quartzite, Phylitte Devonian, Cambrium
11 Meuse Goncourt (F) Sandstone, Siltstone Lias
relatively large and fast discharge fluctuations
Catchments with small and slow discharge fluctuations suggest a dominance of slow runoff components (groundwater flow), whereas catchments with large and fast discharge fluctuations suggest a dominance of fast runoff components ('overland flow'). The latter are more vulnerable with respect to both floods and low flows. The analysis presented here can be used to get a rough picture of the vulnerability of the sub-catchments in the river Meuse basin.
Vulnerable catchments seem to be located in the regions that consist of rocks from the Lias formation (southern part of the French Meuse, and eastern upper part of the Chiers and Semois), and in the central part of the Ardennes (the upper Ourthe, Lesse, Vesdre and Amblève). Flood prevention at the source will be most effective in these regions.
Less vulnerable catchments seem to be located in the Carboniferous limestones of the Condroz region and the Mesozoic limestones in the French part of the Meuse basin and north of the Ardennes. The groundwater reservoirs in these regions need to be protected in order to maintain a minimum water flow in the Meuse during dry periods.
Besides lithology and basin size there are many other characteristics that influence the discharge patterns, e.g. vegetation, relief, and human interference in the form of dams, weirs and/or sluices. A complete analysis of these characteristics and their influence on the discharge is beyond the scope of the analysis presented here.
5 MODEL SIMULATIONS
5.1 Climate change scenarios
What climate change is predicted for the Meuse basin?
Human activities are causing an increase in the atmospheric concentrations of greenhouse gases and aerosols. Together these changes are projected to change regional and global climate and climate-related parameters such as temperature, precipitation, and sea level (IPCC, 1995). Climate change will lead to an intensification of the global hydrological cycle and can have major impacts on regional water resources. Changes in total amount of precipitation and its frequency and intensity directly affect the magnitude and timing of runoff and the intensity of floods and droughts; however, at present specific regional effects are uncertain (IPCC, 1995). Global Climate Models also known as General Circulation Models (GCMs), are the tools used to perform climate change experiments from which climate scenarios (possible representations of how the climate will evolve) can be constructed. GCMs are the most complex of climate models, since they attempt to represent the main components of the climate system in three dimensions. It is widely acknowledged that the direct outputs of climate change simulations from GCMs are inadequate for assessing land-surface impacts on regional scale. This is primarily for two reasons: first, because the spatial resolution of GCMs (typically 50 000 km2, see figure 3.3) is often larger than that required for input to impacts models; and second, because of doubts about the reliability of some GCM output variables (particularly those, like precipitation, that are critically dependent on sub-grid-scale processes such as those involving clouds) (Wilby and Wigley, 1999). This mismatch between what the climate impacts community requires and what the GCMs are able to supply, has been a confounding issue affecting the confidence placed in impacts scenarios at the basin scale (Hostetler, 1994). Unfortunately this mismatch also deeply affects the analysis presented in this study. The climate scenarios used for the Meuse basin are derived from GCM output. Here, the outputs of different GCMs are compared in order to get an idea of the uncertainties involved.
GCM outputs for the Meuse basin
Figures 5.1 and 5.2 give derived outputs for a number of GCMs (see table 3.3) for average precipitation and temperature changes in the Meuse basin. It should be noted that the scenarios used in this study do not cover the entire range of climate change scenarios. The scenarios presented in figures 5.1 and 5.2 all assume the same emission scenario (doubling of CO2 emissions by the end of the 21th century). Various social, economic and technological developments have a strong impact on emission trends, and may lead to different emission scenarios. The emission scenario used as input for the GCM runs in figures 5.1 and 5.2 is more or less in the middle of the total range of emission scenarios reported by the IPCC (IPCC, 2001).
There are large differences in the GCM predictions for the Meuse basin (figures 5.1 and 5.2), but all GCMs simulate an increase of temperature, an increase of winter precipitation, and a decrease of summer precipitation.