Feasibility study for the use of old coal mines
for energy storage by the flow of heavy liquids
Cedric Burggraeve, Lukas Messelis
Student numbers: 01508768, 01504376
Supervisors: Prof. dr. ir. Herman Peiffer, Prof. dr. ir. Antoon Beyne, Prof. dr.
ir. Tom De Mulder
Counsellor: Dr. Benny Malengier
Master's dissertation submitted in order to obtain the academic degree of Master of Science in Civil Engineering
Feasibility study for the use of old coal mines
for energy storage by the flow of heavy liquids
Cedric Burggraeve, Lukas Messelis
Student numbers: 01508768, 01504376
Supervisors: Prof. dr. ir. Herman Peiffer, Prof. dr. ir. Antoon Beyne, Prof. dr.
ir. Tom De Mulder
Counsellors: Dr. Benny Malengier
Master's dissertation submitted in order to obtain the academic degree of Master of Science in Civil Engineering
PREFACE
A lot of research is already performed with respect to the storage of energy, but the demand for alternative systems rises due to the transition to more renewable energy sources. The opportunities in Belgium for storing energy is not studied in detail, this is why it motivated us to perform a feasibility study about a new concept of large capacity energy storage.
Although this is not a classical master dissertation regarding civil engineering, this topic is closely related to our major in offshore and dredging. The development of renewables was for both of us one of the main reason to start this specialization, this made the research into a new energy storage facility the more interesting.
We want to thank the promotors prof. dr. ir. Herman Peiffer, ir. Antoon Beyne and prof. dr. ir. Tom De Mulder for the academic advice and the opportunity to study this topic . For the more daily questions, we could rely on the advice of Dr. Benny Malengier and guided us through the difficulties of this topic. In particular, we would like to thank our parents, family and friends who were there to celebrate in good times and to support us in difficult.
PERMISSION OF USE ON LOAN
The authors give permission to make this master dissertation available for consultation and to copy parts of this master dissertation for personal use. In all cases of other use, the copyright terms have to be respected, in particular with regard to the obligation to state explicitly the source when quoting results from this master dissertation.
Ghent, 31st of May 2020 The authors,
FEASIBILITY STUDY FOR THE USE OF OLD COAL MINES FOR ENERGY
STORAGE BY THE FLOW OF HEAVY LIQUIDS
By Cedric Burggraeve & Lukas Messelis
Master’s dissertation submitted in order to obtain the academic degree of Master of Science in Civil Engineering
Supervisors: Prof. dr. ir. Herman Peiffer, Prof. dr. ir. Antoon Beyne, Prof. dr. ir. Tom De Mulder Counsellor: Dr. Benny Malengier
Department of Civil Engineering Chair: Prof. Peter Troch
Faculty of Engineering and Architecture Ghent University, Belgium Academic year 2019-2020
Abstract
With the current developments in renewable energy there is an increasing need for large energy capacity storage. These energy storage facilities are a main component regarding the stabilisation of an electricity grid, due to the variability in power delivery by renewable energy sources. There are already different existing large capacity energy storage systems, nevertheless the search for alternative systems continues. This study concerns an energy storage facility in the old coal mines by the flow of heavy liquids.
Determining the feasibility of such an energy storage facility requires research on different levels. The first topic defines the requirements, which a heavy liquid needs to meet regarding the implementation in such an energy storage system. One of the main complexities of this type of energy system is the implementation of the theoretical concept on an existing coal mine network. An in depth research of the layout of a typical Belgian coal mine is performed, to determine the consequences of a tunnel network on the theoretical concept and the energy storage capacity. This energy storage concept relies on a two- liquid flow of a heavy liquid and water. To investigate the influence of the tunnel network on the two-liquid flow, numerical simulations are used to gain insight in the flow behaviour. Furthermore, the implementation of the concept requires different structural adaptions, these are proposed at the end of the study with the concerning design requirements.
Feasibility study for the use of old coal mines
for energy storage by the flow of heavy liquids
Cedric Burggraeve & Lukas Messelis Ghent University, Belgium
Supervisors: Herman Peiffer, Antoon Beyne, Tom De Mulder Counsellor: Benny Malengier
Abstract- With the current developments in renewable energy, there is an increasing need for large energy capacity storage. This research focuses on an energy storage concept, which uses the flow of heavy liquids to store energy in the abandoned coal mines of Belgium. In the study, several topics are studied, such as the requirements related to the heavy liquid. The layout of a typical coal mine is investigated with the view to implement the concept. The implementation of the concept in combination with a two-liquid flow analysis pointed out some required interventions, which are needed to apply the theoretical concept on a complex network of mining tunnels. The possibilities and feasibility of these interventions are discussed at the end of the study.
Keywords- Energy storage, Coal mines, Heavy liquids, Flow analysis
I. INITIAL CONCEPT ENERGY STORAGE IN OLD COAL MINES
A. Background
Due to the growing environmental and global warming concerns, the transition to renewable energy happens faster and faster. The energy production by wind and sun is very unreliable and unpredictable, which results in an unstable electric grid. To accommodate this transition from gas turbine power plants to more renewable energy sources, the need for large energy storage capacity grows.
In Belgium, there are three main types of electrical energy production: Nuclear power plants, gas power plants and wind turbines. The base load in Belgium consists of nuclear energy production together with the unreliable wind energy production. To meet the peaks in the energy demand, gas turbine power plants are used to react fast on the changing demand. In the transition to more renewable energy production, the production by gas must disappear. This means that the grid stabilizer disappears and has to be replaced. Therefore, the need for large capacity storage plants is required to stabilize the grid. The aim is to store energy from the renewables when they work at full capacity and deliver energy to the grid in times of idle energy production.
Belgium wants to play a leading role in this energy transition and therefore must find ways to store the surplus of produced energy. Up till now, Belgium has only one large energy storage plant, a pumped hydropower storage (PHS) plant in Coo. Such type of storage plant has an enormous spatial impact and requires a certain elevation difference between both reservoirs. Although the PHS is the most used large capacity storage plant, the environmental criteria result in difficulties regarding the implementation of this system in a flat and densely populated
country like Belgium. Therefore, the search for alternative large capacity energy storage plants continues [1-3].
B. Initial concept
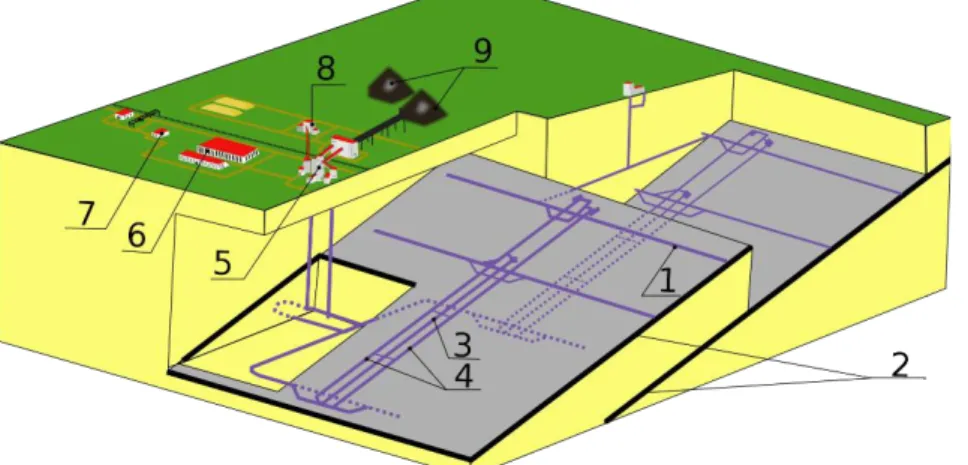
The initial concept for energy storage in old coal mines by the flow of heavy liquids is introduced in this paragraph. In Figure 9-1, a sketch of the initial concept of energy storage in an old coal mines by the flow of heavy liquids is displayed. The characteristic composition of a traditional coal mine is directly visible (the two shafts and sloped tunnels on different levels).
Figure 9-1: Sketch initial concept of an energy storage system
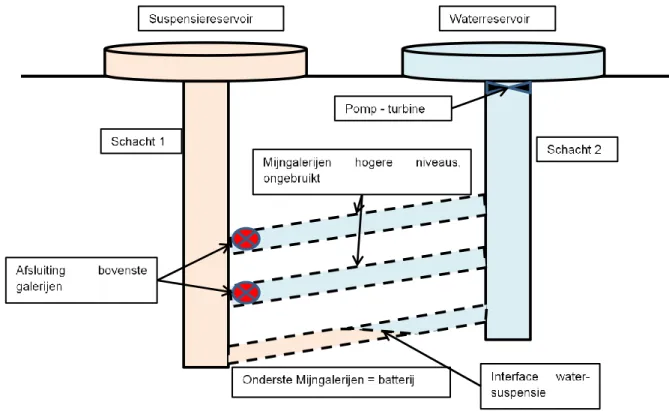
The working principle of the system is presented shortly underneath. The system consists of two liquids, water and a yet unspecified heavy liquid, which has the importance of creating additional head for the system. By the movement of the interface between both liquids in the mine, energy is stored and produced. When there is a surplus of energy, water from a reservoir above shaft 2 is pumped into the mine. By adding water, the heavy liquid is displaced towards shaft 1 and evacuated into its respective reservoir, which is filled with heavy liquid. By doing this the system gains more potential energy. The additional pressure head at the turbine of shaft 2 corresponds with the stored energy. Due to this unbalance the heavy liquid wants to flow back into the direction of shaft 2. This results in a flow of water back into reservoir 2. When doing this, it passes a turbine which generates power. The storage system consists of a cycle of energy generation and consumption. The system is in fact a net energy consumer, since driving the pumps consumes more energy, than it gains during turbining. This is because of the efficiency of the pump and turbine and friction head losses in the system.
C. Objectives
The study’s aim is to investigate the feasibility of this energy storage concept and to determine the potential storage capacity if this system would be applied to an abandoned Flemish coal mine, Zwartberg. In addition, the practical implications when implementing the system should be determined together with the requirements for the heavy liquid.
II. EXISTING ENERGY STORAGE SYSTEMS
The idea of finding ways to store energy is not something new. There are already numerous existing (concept) technologies for large capacity energy storage. In this chapter, the most relevant system is introduced, the pumped hydropower storage, which has some important similarities with the studied concept. A. The working principle
The pumped hydropower storage (PHS) is not a new concept of energy storage. Since the second world war, this system was installed in various countries to meet peak demand. Up till now the PHS is responsible for around 94% of the world’s energy storage capacity and is the most cost-efficient large-scale energy storage system [4].
The PHS consists of two reservoirs at different levels connected by penstocks and a powerhouse as illustrated in Figure 9-2. This system has two working modes. The first one is the production mode, the plant works like a conventional hydropower facility. Water from the upper reservoir flows through the penstocks and the turbine to the lower reservoirs to generate electricity. During the pumping mode the system is reversed, electrical energy from the grid is used to pump water from the lower reservoir to the upper reservoir to store as potential energy.
Figure 9-2: Principle sketch PHS system [5]
B. The storage capacity
The storage capacity of the PHS system depends on two factors. The first factor is the pressure head, which is the level difference between the top reservoir and the turbine at the bottom reservoir. The second factor is the total volume of water that can be stored in the upper reservoir and flow downwards during production. The real amount of energy produced depends also on the efficiency of the turbine unit. The energy storage capacity is defined as follows:
𝐸 [𝑘𝑊ℎ] =𝜂𝜌𝑔𝑉𝐻𝑛𝑒𝑡
3.6∙106 (1)
With H the head, V the volume stored in the upper reservoir, g the gravitational constant. For the actual energy storage capacity, the theoretical head has to be reduced with the head losses due to friction. This equation is also used to determine the storage capacity of the studied concept.
C. Similarities to the studied concept
There are different principles from the PHS system similar to the studied concept. The system consists also of two reservoirs in connection with each other by pump-turbine unit, but instead of level difference between the reservoirs resulting in a head at the turbine, the difference in density of the two liquids and the depth of the mine are responsible for the head at the turbine. The total volume stored is equal to the pumped volume of water as in the PHS [5, 6].
III. HEAVY LIQUIDS
The heavy liquid is an important aspect of the energy storage concept and the choice of a certain fluid has implications on the storage capacity, efficiency and feasibility of the concept. Therefore, it is important to determine the requirements and implications for the choice of the heavy liquid.
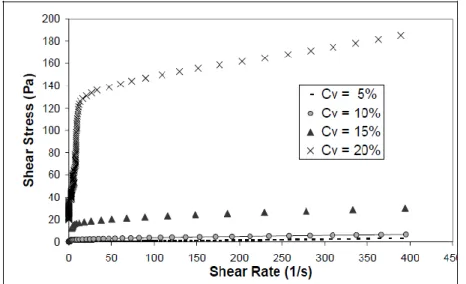
The energy storage capacity depends on the difference in density between both liquids, the higher the difference, the higher the storage capacity. The first liquid in the system is water with a density of 1000 kg/m³. The second liquid must have a density as large as possible. There are many high-density liquids, but most of them are toxic and cannot be used in this concept. The search for more natural heavy liquids leads fast to some sort of clay solution. When using clay solutions, the viscosity of the liquid increases with increasing solid concentration, which is equivalent to increasing density. Besides, the rheological behavior becomes non-Newtonian.
The increase in viscosity has a negative effect on the performance of the system, because the liquid resistance to displacement increases and influences the two-liquid flow, see chapter VI. The determination of the rheological behavior of the heavy liquid is done with Hershel-Bulkley model.
𝜏 = 𝜏𝑐+ 𝐾𝛾𝑛 (2)
The parameters in this equation depend on the solid particle concentration in the solution. The consistency factor K is related to the viscosity and if the density of the solution increases this parameter increases very fast. The Hershel-Bulkley model is chosen, since it gives the best representation of the real behavior of the kaolinite clay solutions. The knowledge of the rheological behavior is required for the flow investigation.
Other important requirements for the heavy liquid are settling behavior and stability of the interface. These requirements are not discussed in great detail, but are important to keep in mind. The stability of the solution is important, because when too much solids settle if the heavy liquid is not moving, the density will decrease, the storage volume will decrease and mixing with water will occur. The stability of the interface is also important since both liquids are supposed to stay separated during movement. No mixing of the liquids should occur [7, 8].
IV. THE COAL MINES
A. Geology
Prior to the implementation of the initial concept, it is important to gain knowledge in the layout of a typical Belgian coal mine. Therefore, information is needed regarding the geology, which defines the construction process of a coal mine. The lithosphere, in the region of interest, consists of two main components: the layer which is formed during the Carboniferous
and the overburden layer on top of the latter. The layer formed in the Carboniferous consists of alternating coal seams and sandstones, which are inclined due to orogenic forces. The overburden consists typically of loose and wet soil material.
Due to geological events only at certain locations, the lithosphere is suitable to create coal mines, because at some locations the coal layers are eroded or the coal seams are located too deep under the ground [9].
B. The layout of coal mine
After a suitable location was found, such as the Kempen, the construction of a coal mine started. The first objective was constructing a vertical shaft, through the overburden, until it reached the sandstone formed in the Carboniferous. When the hard rock was reached the construction of tunnels started, these were the highways of the mining grid. The excavation of such a tunnel continued until they reached an inclined coal seam, after which the excavation of the tunnel was put on hold. From these tunnels a gallery was constructed through and parallel with the coal seam, the same procedure happened at a lower located level. This is illustrated in Figure 9-3.
Figure 9-3: Main components and layout of a coal mine [11]
After their construction, the galleries were connected by a pillar, which is the excavation front. By excavating these pillars, the coal was mined and transported to the ground level. It needs to be mentioned that the pillars were only temporarily supported and that they collapsed when the excavation front proceeded. This excavation method gave the coal mines their typical layout with vertical shafts, tunnels, galleries and pillars [10, 11]. C. Implementation of the initial concept
Based on the theoretical layout of a coal mine in combination with specific geometrical data of the mine of Zwartberg, the initial concept is implemented. Some complications related to this implication are discussed.
The first problem is the fact that only a fraction of the envisioned volume is available for energy storage. The main reason for this is that the excavated coal seams collapsed after they were mined. This results in a significant loss of potential energy storage capacity [12].
A second problem related to the implementation is that the tunnels are slightly sloped in a downward direction towards the main shafts. Consequently, the initial concept needs to be redefined by suggesting artificial vertical shafts at the end of every tunnel, this to make the two-liquid flow possible [9].
A third setback is related to the closing procedure of the coal mines. One of the measures was the filling of the main shaft, for environmental and safety reasons. Reopening or reconstructing these shafts is accompanied by significant investments. Nevertheless, a suggestion for a system which stores energy using a two-liquid flow is made. The proposed system is illustrated in Figure 9-4 [13].
Figure 9-4: Proposed energy system based on mining grid Zwartberg
V. IMPLEMENTATION OF CONCEPT IN A MINE NETWORK
Based on the findings from the previous chapters, the implementation of the original energy storage concept is discussed and additionally the potential storage capacity for the Zwartberg mine is determined. First, the important principles for implementing the concept in a real mine network are discussed. Afterwards, these principles are applied to the example case of the mine in Zwartberg and at last the accompanying practical issues are presented. Assume an interface that is horizontal at all time and no mixing occurs between the two liquids. The tunnels are circular with diameter 3m and the walls are impermeable, so no losses for the system.
A. Principles and terminology
The first important aspect in determining the storage capacity of a mine is the stroke length. This is the length, measured along the axis, over which the interface can displace in the mine tunnels. The interface can only move between two extreme positions. From the lowest position to the highest position during the production phase and vice versa in the storage phase. These extreme positions in the tunnels are illustrated with the dashed line in Figure 9-5. From the stroke length the displaced volume can be determined, the green volume in. This displaced volume is used to determine the total storage capacity, since it is directly proportional to it, see equation (1).
Figure 9-5: Sketch theoretical extreme positions interface and stroke length
The second important parameter that needs to be determined for the system is the head at the turbine. Consider a random position of the interface in that displacement interval. If then the hydrostatic pressures at that time/at that location are determined, the resulting pressure at the turbine can be calculated according to equation (3).
𝐻(𝑡) [𝑚] =𝜌ℎ𝑙(ℎ𝑚(𝑡)+ℎ1(𝑡))−𝜌𝑤ℎ𝑚(𝑡)
𝜌𝑤 (3)
With hm(t) the depth of the interface, h1(t) the height of the free
surface in the reservoir, as illustrated in Figure 9-6.
Figure 9-6: Hydrostatic pressure distribution during the generation phase
At the start of this chapter, the assumptions were made that the tunnels are circular, but in reality a semi-permeable bed for the rails is present. This results in a reduction of the available displaceable volume in the mine tunnels. Assuming the tunnel dimensions in Figure 9-7, the reduction factor for the available volume fred=0.891. This equates to a reduction of 11% and
therefore the bedding should be removed if possible.
Figure 9-7: Dimensions main tunnel mine
In reality, the mine tunnels are not smooth and energy loss should be incorporated for the flow in the tunnels and shafts. The losses due to wall friction are determined based on the Fanning friction factor: ℎ𝐿 = 2𝑓𝑓𝐿𝑣2 𝐷∙𝑔 = 2𝑓𝑓𝐿 𝐷∙𝑔 ∙ 𝑄2 𝐴2= 𝐾𝐿𝑄 2 (4)
The friction factor ff depends on the flow type, flow rate and
the roughness of the walls of the tunnels. When calculating the friction factor and the corresponding head losses, it is directly clear that these losses are relatively low in comparison with the total theoretical head from equation (3). This was expected, because the tunnels have a large diameter of 3 m. Regardless of the small influence, these losses are incorporated in the estimation of the storage capacity [14].
B. Application on Zwartberg mine
By means of the researched data about the mine dimensions and the principles discussed in the previous section, the potential storage capacity can be determined.
The first important aspect is to quantify the available total stroke length and the corresponding displaceable volume. This is required to find the dimensions of the reservoirs and the potential storage capacity. For determining the stroke length, the levels in between which the interface can displace have to be determined. Based on the requirements in the previous section, the interface moves between -922.5 m and -750.5 m under the ground level. The displaceable volume in the mine can be determined now. The total volume is 56 550 m³, without bedding and 50 400 m³ with bedding. For the estimation of the potential storage capacity, the complete available volume is utilized.
With this information, the theoretical head can be quantified in function of the absolute volume that has passed through the turbine. In Figure 9-8, the evolution of this head is displayed, and a clear decrease in head is visible when the interface enters the internal vertical shafts.
Figure 9-8: Theoretical head at the turbine in function of the displaced volume
Assuming the friction losses, the head can be determined by decreasing the theoretical head with the head losses. The head losses are in function of the flow rate and the displaced volume. As a result, the potential head is displayed in function of time and flow rate in Figure 9-9. The same evolution can be noticed as for the theoretical head. The power output can be determined by using the following formula [6]:
𝑃 [𝑀𝑊] =𝜂𝜌𝑤𝑔𝐻(𝑡)𝐹
106 (5)
With F, the flow rate at the turbine and H the head at the turbine in function of time.
Figure 9-9: the potential head over the full turbining time
The combination of the graph above and the formula (5), results in a graph with the power output in function of time for turbine efficiency equal to 1.
The total storage capacity can be determined by calculating the area underneath the graphs, which results in a theoretical storage capacity of 35 MWh/cycle, which is equal to seven 5 MW turbines working 1hr at full capacity. The PHS in Coo, Belgium has a total daily storage capacity of 5000 MWh. So, compared to this, it is relatively low storage capacity and will be lower since the efficiency of the turbine is also lower than 1. The total efficiency of the system depends on the efficiency of the pump and turbine, because the theoretical energy input and output is approximately equal. The potential storage capacity could be increased for this case by choosing a denser heavy liquid, but this has also implications see chapter VI.
C. The practical issues regarding the implementation
For the calculation of the potential storage capacity of the system, some practical issues were disregarded. The conditions of the tunnels and main shafts are not the same as during the exploitation of the mine. There are a lot of collapsed tunnels and the shafts are closed with concrete and other materials. Besides if the tunnels would be accessible, the permeability of the walls is too high and require interventions with impermeable lining to prevent losses for the system. These issues make it doubtful, if it is even possible to install this in a closed mine. The implementation of the storage system is preferably done in a mine that is about to close. For the continuation of the study, an accessible mine is assumed.
VI. FLOW INVESTIGATION
A. Validation
The flow analysis of the energy storage system is mainly based on numerical models, the software package used for the generation of these models is Solidworks. This package allows the simulation of free surfaces, which means the simulation of two immiscible fluids is possible in this software. Before the flow analysis was executed, the software is validated to gain trust in the package. This is done by evaluating three different cases, where theoretical results are compared with the simulated ones.
The first validation was the evaluation regarding the flow development. It was verified if Solidworks made a distinction between the development of velocity profile in laminar and turbulent flow conditions [15]. The second validation evaluates the energy losses in a T-junctions, based on the theory of Idel’chick [16]. The final verification investigates a gravity current, more specific lock exchange flow. The parameter that was evaluated in this section was the propagation speed of the fluids after a lock gate is removed [17].
Based on these three validations, it was concluded that Solidworks is suited for the purposes of the flow analysis, which is rather visual.
B. Flow analysis
The flow analysis itself focusses mainly on the two-liquid flow conditions. This is done by evaluating different geometrical cases that can be found in a mining grid, such as dead-end branches or tunnels which continue beyond the connection with vertical shafts. Next to the mentioned cases, the influence of the tunnel slope and the characteristics of the heavy liquid are
investigated, more specifically the viscosity of the heavy liquid. This was done by simulations with heavy liquids with different characteristics. Based on the results and the corresponding conclusions, adaptions to the system are suggested.
From the numerical results, it can be concluded that a relatively small slope with an increasing viscosity leads to an inclined interface between the heavy liquid and water, during the generation phase. This has a negative effect on the energy storage capacity, because storage needs to be prematurely ended. The consequence of the inclined interface is visualized in Figure 9-11, where the unwanted water inflow into the vertical shaft can be seen.
Figure 9-11: Negative effect of inclined interface
The suggested solution related to this negative effect is the implementation of an inversed weir, which reduces the negative effect and will increase the energy storage.
One of the investigated geometrical cases is a junction of a continuous tunnel with a vertical shaft. The tunnel has a dead-end on one side. From the numerical simulations, it was concluded that this geometrical case has some negative effects on the flow, because it induces undesirable disturbances to the interface during the generation and storage phase. On top of that the dead-end has a limited contibution to the storage capacity.
Figure 9-12: Numerical result of generation phase in a junction of a sloped tunnel and vertical shaft
Based on the numerical results it is suggested to isolate all dead-end branches from the system by plugs and seal the unnecessary connections with other levels of the mining grid. These interventions lead to the system illustrated in Figure 9-4. Furthermore, it is advised to implement the reversed weir to increase the energy capacity.
VII. EXECUTION TECHNIQUES
The study showed that, independent from the energy capacity, a lot of adaptations need to be made to create the suggested storage system. In the final part of the study, the possibilities and feasibility related to these adaptations are investigated.
A. Plugs
The flow analysis concluded that parts of the existing mining grid need to be isolated from the energy storage system to ensure the working of the system. The design of these plugs is based on existing literate regarding the mines in the United Kingdom [19]. The main design criteria of such a plug are related to the surrounding rock material, the loading condition and the allowable pressure gradient of the plug. From the design it can be concluded that a parallel plug is the best option taking into account the expected conditions in the energy storage system.
It can be concluded that there are possibilities to construct such a plug, but the given conditions will complicate the design. For example, undesired cracks located the tunnel wall, furthermore the plug needs to be installed near a junction. These unfavorable conditions will complicate the effective design of the plug.
B. Reservoir
For the construction of the reservoirs at ground level, some requirements can be made. In addition, the feasibility of construction at Zwartberg is checked. The main requirements are: watertightness, stability and freeboard to prevent flooding. The capacity of the reservoirs is equal to the displaced volume in the mines plus a safety volume for flooding, losses and evaporation.
In Zwartberg two reservoirs with a capacity of 104 000 m³ is required. It is possible to construct these at the mine site with material (sand) that can be found on the site [21].
C. Shafts 1) Main shafts
As mentioned, the shafts of the mine in Zwartberg were filled after closure. The shafts must be opened for the concept. There are three options: reopening, new shaft or selecting a mine with open shafts. The first two options are unfeasible and require a huge investment.
2) Internal main shafts
These shafts between both levels must be constructed. This construction of internal shafts at a depth of 750 m, is challenging, due to high geo pressure, small workspace and slow working process.
The construction of such a shaft requires a lot of manpower and time, which makes the construction of these shafts not a good investment. Either one searches for a suitable mine, where these shafts are present or accept the huge investment and construction time for the project [22].
D. Lining
Through the study, the assumption was made that the tunnel walls were impermeable. In reality most mine tunnels have a certain permeability depending on the type of surrounding rock, the tunnel type and the excavation method. Therefore, it is suggested to apply some sort of lining on the tunnel walls to reduce the permeability of the walls. The problem related to this is the fact that most of the existing techniques are only suitable for newly constructed tunnels. Therefore, backgrouting is suggested for this specific situation. The working principle can be seen in Figure 9-13 [19].
Figure 9-13: Working principle of backgrouting [23]
The working principle is as such: by injecting grout into the rock material under pressure, voids and cracks would fill themselves with the injected material. This would reduce the
permeability of the rock surrounding the tunnel. Note that contrary to the figure the whole perimeter of the tunnel needs to be treated. To fill even smaller voids, it is suggested a silica sol grout instead of a cement based one [20].
VIII. CONCLUSION
This study investigates the feasibility of energy storage by means of a two-liquid flow in the Belgian coal mines. After insight was gained in this theoretical concept, restrictions regarding the suitability of the heavy liquid were proposed, which is part of the two-liquid flow.
After knowledge was gained in the typical layout of a coal mine, the theoretical concept was implemented on a specific coal mine. Based on this implementation an estimation of the potential energy storage capacity was made. From this estimation, it is concluded that the storage capacity provided by the suggested system, is rather limited when it is compared with other energy storage techniques.
Research related to the coal mines and their current condition in combination with the flow analysis pointed out that a lot of interventions are required to transform the coal mines in the suggested energy system.
In the final part of the study, the possibilities and feasibility of the required interventions were discussed. From this research, it can be concluded that for all the suggested intervention techniques exist, but in total they correspond with an enormous investment.
As an overall conclusion, the authors state that the implementation of an energy storage facility using a heavy liquid, in the investigated coal mines, is not feasible. This statement is based on the relative huge investments to create the storage facility and the relatively low storage capacity that will be created. In other words the return on investment will not be positive for such a storage facility, even with an even greater capacity, the investment would still be huge.
REFERENCES
[1] Elia, “Grid data,” Elia, [Online]. Available: https://www.elia.be/nl/grid-data. [Accessed 5 March 2020].
[2] P. T. Moseley and J. Garche, Electromechanical Energy Storage for Renewable Sources and Grid Balancing, 2015.
[3] M. Junginger and A. Louwen, Technological learning in the transition to
a low-carbon energy system, 2020.
[4] M. Rogner, N. Troja, D. Samuel and S. Law, The World's Water Battery;
Pumped Hydropower Storage, the Clean Energy Transition, 2018.
[5] P. Breeze, “Chapter 8: Pumped Storage Hydropower,” in Power System
Storage Technologies, 2018.
[6] Homer Pro, “Pumped Hydro,” Homer Pro, [Online]. Available: https://www.homerenergy.com/products/pro/docs/latest/pumped_hydro. html. [Accessed 25 November 2019].
[7] L. C. Van Rijn, “Chapter 11: Transport of Cohesive Materials,” in
Principles of Sediment Transport in Rivers, Estuaries and Coastal Seas,
1993.
[8] G. F. Maciel, H. K. D. Santos and F. O. Ferreira, Rheological Analysis of
Water Clay Compositions in Order to Investigate Mudflows developing in Canals, 2017.Homer Pro, “Pumped Hydro,”
[9] L. Slegers and A. Steegen, Steenkool in Limburg: ruimtelijke en sociale impact op verleden, heden en toekomst, 2014.
[10] F. Gullentops and L. Wouters, Delfstoffen in vlaanderen, 1996. [11] J. Schot, H. Lintsen, A. Rip and A. de la Bruhèze, Techniek in Nederland
in de twintigste eeuw, 2000.
[12] P. Vansteelandt, De Waterhuishouding in het mijnverzakkingsgebied van
[13] D. Beukel, “Afdichten mijnschachten,” [Online]. Available: http://mijnbouw.weebly.com/afdichten-mijnschachten.html. [Accessed 25 December 2019].
[14] J. R. Welty, G. L. Rorrer and D. G. Foster, “Chapter 13: Flow in Closed Conduits,” in Fundamentals of momentum, heat and mass transfer, 2015. [15] CalPolyPomona, “Developing and fully-developed flow in pipes,” [Online]. Available: https://www.cpp.edu/meonline/fluid-[16] mechanics.shtml . [Accessed 10 March 2020].
[16] I. Idel'cik, Mémento des pertes de charges, 1986.
[17] J. Shin, S. Dalziel and P. Linden, Gravity current produced by lock
exchange, 2002.
[18] U. Singh, P. Abraham, E. Bellamy and A. Swarts, The design and construction of water impounding plugs using sprayed concrete, 2012. [19] D. Buckley, P. Jenkin, “Chapter 14: Tunnels in soils-formal linings,” in
Civil engineering underground rail transport, 1990
[20] C. Sögaard and J. Funehag, Silica sol as grouting material: a
physio-chemical analysis, 2018
[21] M. Johnson, D. Ratnayaka and M. Brandt, “chapter 5: reservoirs and dams,” in Twort's Water Supply, 2009.
[22] L. Hu, T. F. X., y. Xiao and e. al., Characteristics of the microseismicity resulting from the construction of a deeply-buried shaft, 2018.
xvii
CONTENTS
CHAPTER 1: INITIAL CONCEPT FOR ENERGY STORAGE IN OLD COAL MINES ... 1
1.1 BACKGROUND ... 1
1.2 INITIAL IDEA/STUDY PROBLEM ... 3
1.3 OBJECTIVES ... 5
1.4 THESIS STRUCTURE ... 5
CHAPTER 2: EXISTING ENERGY STORAGE SYSTEMS ... 7
2.1 THE PUMPED HYDROPOWER STORAGE SYSTEM ... 7
2.1.1 The concept ... 7
2.1.2 The working principle ... 8
2.1.3 Similarities to the new energy storage concept ... 11
2.2 UNDERGROUND ENERGY STORAGE ... 11
2.2.1 Underground pumped hydropower storage ... 11
2.2.2 Gravity storage ... 13
2.2.3 Compressed air energy storage ... 19
CHAPTER 3: HEAVY LIQUIDS ... 23
3.1 HEAVY LIQUID TYPES ... 23
3.2 VISCOSITY OF HEAVY LIQUID ... 24
3.2.1 Definition ... 24
3.2.2 Determination of viscosity ... 26
3.2.3 Kaolinite clay solutions viscosity ... 27
4.2.4 Conclusion with respect to viscosity requirements ... 33
3.3 SETTLING BEHAVIOUR ... 34
3.4 STABILITY OF INTERFACE ... 36
3.5 REQUIREMENTS FOR HEAVY LIQUIDS ... 36
CHAPTER 4: THE (BELGIAN) COAL MINES ... 37
4.1 GEOLOGY... 37
4.2 LAY-OUT AND CONSTRUCTION OF BELGIAN COAL MINES ... 39
4.3 DATA ACQUISITION FROM THE COAL MINE OF ZWARTBERG ... 43
4.4 INVESTIGATE GEOMETRICAL POSSIBILITIES WITH RESPECT TO THE INITIAL CONCEPT ... 48
4.4.1 Limited volume between the shaft ... 48
4.4.2 Small inclination of the tunnels ... 50
4.4.3 Less volume than expected ... 52
4.4.4 Sealing of the shafts ... 54
4.4.5 The adapted geometry of the energy storage system ... 56
CHAPTER 5: IMPLEMENTATION OF THE CONCEPT IN A MINE NETWORK ... 59
5.1 THE U-TUBE AS SIMPLE MINE PRESENTATION ... 59
5.1.1 Equilibrium situation between two fluids ... 60
Contents xviii
5.1.3 Reservoirs ... 63
5.1.4 Energy storage capacity ... 64
5.1.5 Pumping and turbining time ... 66
5.2 THE MINE SYSTEM ... 67
5.2.1 Two branch simple mine network ... 68
5.2.2 Influence tunnel cross-section... 74
5.2.3 Influence of head losses... 76
5.3 APPLICATION TO ZWARTBERG MINE (SIX BRANCH NETWORK) ... 83
5.3.1 Dimensions mine network at Zwartberg ... 83
5.3.2 Available displaceable volume ... 85
5.3.3 Reservoirs ... 86
5.3.4 Energy storage capacity ... 86
5.3.5 Generation-storage cycle ... 91
5.3.6 Conclusion ... 95
5.4 PRACTICAL ISSUES IN (BELGIAN) COAL MINES WITH REGARD TO THE IMPLEMENTATION ... 96
5.4.1 Permeability issues ... 96
5.4.2 Inaccessible main shafts and tunnels ... 100
5.4.3 Groundwater in mine tunnels ... 100
5.4.4 Behaviour heavy liquid ... 101
5.4.5 Conclusion and opportunities ... 101
CHAPTER 6: FLOW INVESTIGATION ... 103
6.1 VALIDATION SOLIDWORKS ... 103
Flow through pipe... 103
6.1.1 T-junction with a closed pipe ... 107
6.1.2 Lock Exchange Flow ... 111
6.1.3 Conclusion ... 116
6.2 INVESTIGATION OF FLOW IN SUGGESTED ENERGY STORAGE SYSTEM MINE ... 117
6.3 TWO-LIQUID FLOWS ... 118
6.3.1 Heavy liquids ... 118
6.3.2 Numerical models ... 120
6.3.3 Influence of the sloped tunnel... 121
6.3.4 Influence of the viscosity in combination with the slope during the storage phase ... 123
6.3.5 Influence of the viscosity in combination with the slope during the generation phase ... 130
6.3.6 Connection tunnel and vertical shaft... 131
6.3.7 A dead-end tunnel connected to the system... 136
6.3.8 Junction of two tunnels ... 140
6.3.9 Connections with other levels ... 143
6.4 SINGLE-LIQUID FLOW ... 143
6.4.1 Dead-end branches ... 143
6.4.2 Connections with other levels ... 144
6.5 CONCLUSION ... 145
Contents xix
7.1 INSIGHT IN MATERIAL ... 146
7.2 TESTING OF INTERFACE BEHAVIOUR ... 151
7.3 INSIGHT IN THE INFLUENCE OF THE GEOMETRY OF THE MINE ... 153
7.4 SCALING LAWS ... 155
7.5 CONCLUSION ... 158
CHAPTER 8: EXECUTION TECHNIQUES FOR OPTIMIZATION OF MINE NETWORK ... 160
8.1 PLUGS ... 160 8.1.1 Design... 160 8.1.2 Construction ... 163 8.1.3 Remarks ... 164 8.2 RESERVOIR CONSTRUCTION ... 164 8.2.1 Embankment design ... 165 8.2.2 Reservoir design ... 167
8.3 LINING OF TUNNEL WALLS... 170
8.3.1 Main tunnel composition ... 171
8.3.2 Waterproofing methods ... 171
8.4 SHAFTS ... 172
8.4.1 Main shafts ... 172
8.4.2 Artificial internal shafts ... 173
CHAPTER 9: CONCLUSION AND FURTHER WORK ... 176
9.1 CONCLUSION ... 176
9.2 FUTURE WORK AND OPPORTUNITIES ... 177
BIBLIOGRAPHY ... 178
xxi
LIST OF FIGURES
FIGURE 1-1:BELGIAN ENERGY PRODUCTION FIRST HALF OF JANUARY 2020 ... 1
FIGURE 1-2:A FICTIVE POWER SUPPLY AND DEMAND CURVE ... 2
FIGURE 1-3:THE INITIAL CONCEPT SKETCH OF THE ENERGY STORAGE SYSTEM IN OLD COAL MINES BY IR.A.BEYNE ... 3
FIGURE 2-1:AN IMPRESSION OF THE PHS SYSTEM [6] ... 7
FIGURE 2-2:PUMPED HYDROPOWER STORAGE SYSTEM, LEFT: PUMPING MODE - RIGHT: PRODUCTION MODE [7] ... 8
FIGURE 2-3:TYPICAL LAYOUT FOR A (PUMPED) HYDROPOWER STATION [8] ... 9
FIGURE 2-4:WORKING AREAS DIFFERENT HYDRAULIC TURBINES [11] ... 10
FIGURE 2-5:UNDERGROUND PUMPED HYDROPOWER STORAGE SCHEME [14] ... 12
FIGURE 2-6:CONCEPTUAL IDEA BY GRAVITRICITY [16] ... 13
FIGURE 2-7:ENERGY CAPACITY IN FUNCTION OF THE PISTON MASS ... 14
FIGURE 2-8:WORKING PRINCIPLE OF A POWER MODULE [17] ... 15
FIGURE 2-9:ENERGY CAPACITY IN FUNCTION OF THE PISTON HEIGHT ... 16
FIGURE 2-10:MODULE SUGGESTED BY HEINDL ENERGY [19]... 17
FIGURE 2-11:SEALING TECHNIQUE SUGGESTED BY HEINDL ENERGY [19] ... 18
FIGURE 2-12:BRAYTON CYCLE APPLIED ON A GAS TURBINE [83] ... 19
FIGURE 2-13:APPLYING A CAES ON A COAL MINE [20]... 21
FIGURE 3-1:REPRESENTATION OF DIFFERENT RHEOLOGICAL BEHAVIOUR TYPES OF A LIQUID [28]... 25
FIGURE 3-2:EXAMPLES OF ROTO-VISCOMETERS [28] ... 26
FIGURE 3-3:THE RELATIVE DYNAMIC VISCOSITY AS A FUNCTION OF THE CONCENTRATION OF NATURAL MUDS IN THE NETHERLANDS [28] ... 28
FIGURE 3-4:VISCOSITY OF KAOLINITE SOLUTION IN FUNCTION OF PARTICLE CONCENTRATION, EXPERIMENTAL VS MODEL RESULTS [30] ... 29
FIGURE 3-5:INFLUENCE OF TEMPERATURE ON THE SHEAR STRESS-SHEAR RATE RELATIONSHIP [31] ... 30
FIGURE 3-6:INFLUENCE OF VOLUME CONCENTRATION 𝑐𝑣 ON THE SHEAR STRESS-SHEAR RATE RELATIONSHIP [31] ... 31
FIGURE 3-7:THE GRAPHICAL REPRESENTATION OF ACTUAL AND APPARENT VISCOSITIES [31] ... 31
FIGURE 3-8:VISCOSITY IN FUNCTION OF THE SHEAR RATE FOR 𝑐𝑣 = 10%, 15% AND 20% DETERMINED WITH THE HERSHEL -BULKLEY MODEL ... 32
FIGURE 3-9:RHEOLOGICAL BEHAVIOUR OF THE THREE DIFFERENT DENSITY MIXTURES PRESENTED BY THREE MODEL AND TEST RESULTS [31] ... 33
FIGURE 3-10:BENTONITE SOLUTIONS, LEFT:10G BENTONITE AND 100G WATER - RIGHT:36G BENTONITE AND 100G WATER... 35
FIGURE 3-11:KAOLINITE SOLUTION 10G KAOLINITE AND 100G WATER ... 35
FIGURE 4-1:ALTERNATING LAYERS OF PLANT DEBRIS AND SEDIMENTATIONS DUE TO THE EFFECT OF CYCLOTHEMS [34] ... 37
FIGURE 4-2:FORMATION OF FAULTS [84] ... 38
FIGURE 4-3:GEOLOGICAL PROFILE GOING FROM THE SOUTHWEST OF BELGIUM TO THE NORTHEAST OF THE NETHERLANDS [35] ... 38
FIGURE 4-4:RUDIMENTAL REPRESENTATION OF COAL MINE IN THE KEMPEN [33]... 39
FIGURE 4-5:DEEPENING OF A VERTICAL SHAFT [33]... 41
FIGURE 4-6:VISUALISATION OF A TUNNEL [41] ... 42
FIGURE 4-7:VISUALISATION OF RESPECTIVELY A GALLERY AND A PILLAR [41] ... 42
FIGURE 4-8:GENERAL OVERVIEW OF COAL [85] ... 43
FIGURE 4-9:VISUALISATION OF MAIN SHAFTS AND TUNNEL IN THE CARBONIFEROUS [36]... 44
List of figures xxii
FIGURE 4-11:START SCREEN OF THE RAM-SYSTEM ... 45 FIGURE 4-12:REPRESENTATION OF ZWARTBERG IN ARCMAP10 ... 46
FIGURE 4-13:THREE-DIMENSIONAL REPRESENTATION OF ZWARTBERG ... 47 FIGURE 4-14:THREE-DIMENSIONAL REPRESENTATION OF ZWARTBERG WITHOUT PANELS ... 48
FIGURE 4-15:LOCATION OF THE PANEL WITH RESPECT TO THE TUNNEL NETWORK... 48
FIGURE 4-16:SATELLITE IMAGE OF THE HEADFRAMES OF WINTERSLAG AND THE DISTANCE BETWEEN THEM [86] ... 49 FIGURE 4-17:FIRST ADAPTATION OF THE INITIAL IDEA ... 50
FIGURE 4-18:HEIGHT INDICATIONS ON THE LOWEST TUNNEL LEVEL AND THE CONSEQUENCE ON THE SYSTEM ... 51
FIGURE 4-19:SOLUTION FOR THE SLOPED TUNNEL ... 52 FIGURE 4-20:SETTLEMENT DUE TO MINING [87] ... 53
FIGURE 4-21:REPRESENTATION OF THE ‘GRENSHOEK’[42] ... 53
FIGURE 4-22:REGISTERED SETTLEMENTS IN THE REGION OF EISDEN [42] ... 53 FIGURE 4-23:FILLED UP SHAFT WITH PLUG METHOD [40] ... 55
FIGURE 4-24:SIMPLIFIED SKETCH OF THE INTENDED ENERGY STORAGE SYSTEM IN THE COAL MINES ... 56
FIGURE 4-25:DERIVED ENERGY STORAGE SYSTEM FROM THE MINING GRID OF ZWARTBERG ... 58 FIGURE 5-1:SKETCH OF EQUILIBRIUM SITUATION FOR TWO LIQUIDS WITH DIFFERENT DENSITIES IN THE SIMPLE U-TUBE ... 60
FIGURE 5-2:DEFINITION SKETCH OF STROKE LENGTH IN A SIMPLE U-TUBE REPRESENTATION ... 62
FIGURE 5-3:THEORETICAL DEFINITION SKETCH STROKE LENGTH ... 63 FIGURE 5-4:STATIC PRESSURES IN A SIMPLE U-TUBE IN A MOMENTARY SITUATION ... 65
FIGURE 5-5:3D REPRESENTATION OF THE UTILIZED MINE NETWORK IN ZWARTBERG ... 68
FIGURE 5-6:2D SIMPLIFICATION OF THE ENERGY STORAGE SYSTEM ... 68
FIGURE 5-7:SKETCH THEORETICAL EXTREME POSITIONS INTERFACE AND STROKE LENGTH IN A 2D MINE SYSTEM ... 69
FIGURE 5-8:SKETCH OF 2D MINE NETWORK WITH AN UNEQUAL LENGTH OF MINE TUNNELS AND THE EQUIVALENT VOLUME LOSS .... 70
FIGURE 5-9:SKETCH OF DISPLACED VOLUME IN SITUATION 1 ... 71
FIGURE 5-10:SKETCH OF DISPLACED VOLUME IN SITUATION 2 ... 71
FIGURE 5-11:2D SKETCH OF "CONE" SECTION DISPLACED VOLUME ... 71
FIGURE 5-12:2D SKETCH OF STROKE LENGTH 𝐿𝑠𝑡, 𝑐𝑜𝑛𝑒 IN THE CONE VOLUME ... 72
FIGURE 5-13:STATIC PRESSURE DISTRIBUTION DURING GENERATION PHASE ... 73
FIGURE 5-14:CONCRETE LINED TUNNEL CROSS-SECTION [41] ... 74
FIGURE 5-15:DIMENSIONS OF MAIN TUNNEL IN MINE ... 75
FIGURE 5-16:THE MAIN TUNNEL GENERAL DIMENSIONS ... 76
FIGURE 5-17:THE PIPE NETWORK BASED ON THE ZWARTBERG MINE,EPANET MODEL ... 78
FIGURE 5-18:PUMP-SYSTEM CHARACTERISTIC CURVE GRAPHIC SCHEME ... 82
FIGURE 5-19:PLAN VIEW OF TUNNELS AT ZWARTBERG; LEFT:2ND LOWEST LEVEL (WATER)- RIGHT: LOWEST LEVEL (TWO-LIQUID) . 83
FIGURE 5-20:LOCATION AND NUMBERING OF VERTICAL SHAFTS AT ZWARTBERG ... 84
FIGURE 5-21:THE THEORETICAL HEAD VARIANCE IN FUNCTION OF VOLUME PASSED THROUGH THE TURBINE... 87
FIGURE 5-22:POTENTIAL HEAD AT TURBINE OVER THE FULL TURBINE TIME ... 89
FIGURE 5-23:POWER OUTPUT IN FUNCTION OF TIME ... 90
FIGURE 5-24:DEFINITION SKETCH FOR HEAD DETERMINATION DURING PUMPING ... 92
FIGURE 5-25:EVOLUTION OF THE THEORETICAL HEAD DURING PUMPING IN FUNCTION OF THE ABSOLUTE DISPLACED VOLUME BY THE PUMP ... 93
FIGURE 5-26:REQUIRED HEAD IN FUNCTION OF PUMPING TIME AT DIFFERENT PUMP RATES ... 93
List of figures xxiii
FIGURE 5-28:LAYER COMPOSITION WESTPHALIAN DEPOSIT [52] ... 96 FIGURE 5-29:TYPICAL LITHOLOGY SANDSTONE FROM WESTPHALIAN ERA [53] ... 97
FIGURE 6-1:DEVELOPMENT OF A VELOCITY PROFILE [57] ... 104 FIGURE 6-2:LAMINAR AND TURBULENT VELOCITY PROFILE [57] ... 105
FIGURE 6-3:NUMERICAL SIMULATION OF LAMINAR FLOW CONDITIONS ... 106
FIGURE 6-4:NUMERICAL SIMULATION OF TURBULENT FLOW CONDITIONS ... 107 FIGURE 6-5:SKETCH OF INVESTIGATED SITUATION ... 107
FIGURE 6-6:VISUALISATION OF USED MODEL SETUP... 108
FIGURE 6-7:THEORETICAL AND SIMULATED LOSSES IN FUNCTION OF THE VELOCITY ... 110 FIGURE 6-8:INITIAL CONDITION OF LOCK EXCHANGE PROBLEM [59]... 111
FIGURE 6-9:GRAVITY BASED FLOW DUE TO LOCK EXCHANGE [60] ... 112
FIGURE 6-10:SETUP TO VALIDATE THEORETICAL VELOCITY ... 113 FIGURE 6-11:FIRST ATTEMPT ON NUMERICAL MODEL ... 113
FIGURE 6-12:THE ADJUSTED NUMERICAL MODEL WITH LID ... 114
FIGURE 6-13:VELOCITY IN INDICATED POINT, HEIGHT 0.2 M ... 115 FIGURE 6-14:VELOCITY IN INDICATED POINT, HEIGHT 0.3 M ... 115
FIGURE 6-15:GEOMETRICAL CASES IN SINGLE-LIQUID FLOW CONDITION ... 117
FIGURE 6-16:GEOMETRICAL CASES IN TWO-LIQUID FLOW CONDITION ... 118 FIGURE 6-17:FIRST METHOD TO DEFINE A LIQUID, BY MEANS OF A VISCOSITY TABLE ... 119
FIGURE 6-18:SECOND METHOD TO DEFINE LIQUID, BY HERSCHEL-BULKLEY MODEL ... 120
FIGURE 6-19:IDEALLY BEHAVIOUR OF THE INTERFACE ... 121
FIGURE 6-20:TUNNEL UNDER 15° IN THE STORAGE PHASE ... 122
FIGURE 6-21:TUNNEL UNDER 5° IN THE STORAGE PHASE ... 122
FIGURE 6-22:TUNNEL UNDER 2.5° IN THE STORAGE PHASE ... 123
FIGURE 6-23:TUNNEL UNDER 5°, WITH FOUR DIFFERENT HEAVY LIQUIDS ... 123
FIGURE 6-24:VARYING SLOPE 15°,5° AND 2.5° WITH K12 ... 125
FIGURE 6-25:EFFECT OF INCLINED INTERFACE ... 126
FIGURE 6-26:SKETCH OF NARROWING WHICH INCREASES STORAGE CAPACITY ... 126
FIGURE 6-27:SUPPORTING SKETCH FOR OPTION 1 ... 127
FIGURE 6-28:INDICATION OF VINC ... 128
FIGURE 6-29:SUPPORTING SKETCH SOLUTION 2 ... 129
FIGURE 6-30:SIMULATION OF THE GENERATION PHASE UNDER 5° ... 130
FIGURE 6-31:VISUALISATION OF DEAD-END NEAR VERTICAL SHAFT DURING THE STORAGE PHASE ... 132
FIGURE 6-32:VISUALISATION OF THE FLOW LINES AT THE MOMENT THE WATER LAYER REACHING THE DEAD-END ... 133
FIGURE 6-33:VISUALISATION OF DEAD-END NEAR VERTICAL SHAFT DURING THE STORAGE PHASE ... 134
FIGURE 6-34:STORAGE PHASE AFTER THE DEAD-END TUNNEL IS DISCONNECTED ... 135
FIGURE 6-35:GENERATION PHASE AFTER THE DEAD-END TUNNEL IS DISCONNECTED ... 136
FIGURE 6-36:VISUALISATION OF THE MODEL DURING THE GENERATION PHASE ... 137
FIGURE 6-37:GENERATION PHASE DEAD-END BRANCH AFTER 90 S ... 137
FIGURE 6-38:GENERATION PHASE DEAD-END BRANCH AFTER 295 S ... 138
FIGURE 6-39:STORAGE PHASE DEAD-END BRANCH AFTER 235 S, SIDE VIEW ... 139
FIGURE 6-40:STORAGE PHASE DEAD-END BRANCH AFTER 195 S ... 139
List of figures xxiv
FIGURE 6-42:NUMERICAL MODEL FOR TESTING UNCTION OF TWO TUNNELS ... 141 FIGURE 6-43:TEST RESULTS OF THE NUMERICAL MODEL JUNCTION OF TWO TUNNELS ... 142
FIGURE 6-44:SKETCH IMBALANCE BETWEEN TWO TUNNEL BRANCHES ... 142 FIGURE 6-45:VISUALISATION OF THE WATER NETWORK AND SUSPENSION NETWORK ... 143
FIGURE 6-46:RESULTS OF SINGLE-LIQUID FLOW NEAR A DEAD-END BRANCH ... 144
FIGURE 6-47:THE ISOLATED SYSTEM FROM THE MINING GRID ... 145 FIGURE 7-1:VISUALISATION OF THE ANALYSED SUSPENSIONS ... 147
FIGURE 7-2:STATIC INTERFACE KAOLINITE DENSITY 1250𝑘𝑔/𝑚³ ... 147
FIGURE 7-3:SKETCHED AND REAL-LIFE SET-UP TO EVALUATE THE DYNAMIC BEHAVIOUR ... 148 FIGURE 7-4:EXECUTION PRINCIPLE TEST ... 149
FIGURE 7-5:FORMATION OF TURBULENCE DUE TO JET ... 150
FIGURE 7-6:THICKNESS OF WATER LAYER AFTER EVERY CYCLE ... 150 FIGURE 7-7:PROPOSED SETUP TO TEST DYNAMIC BEHAVIOUR ... 151
FIGURE 7-8:THE DESIGN AND PROPOSED DIMENSIONS OF THE MODEL ... 152
FIGURE 7-9:CRACKS IN THE CURED TUBES ... 153 FIGURE 7-10:REINFORCED SETUP OF T-JUNCTION ... 154
FIGURE 7-11:SKETCH OF INITIAL CONDITIONS ... 154
FIGURE 7-12:VISUALISATION OF THE INLET WITH PUMP AND OUTLET ... 155 FIGURE 7-13:RESULTS OF NUMERICAL SIMULATION PROTOTYPE (ABOVE) AND MODEL (UNDER)... 157
FIGURE 7-14:RESULTS OF THE DENSIMETRIC SCALED MODEL ... 158
FIGURE 8-1:PLUG TYPES [65] ... 160
FIGURE 8-2:LOADING CASES ... 161
FIGURE 8-3:INDICATION OF USED DESIGN PARAMETERS ... 163
FIGURE 8-4:HDPE GEOMEMBRANE FOR WATER RESERVOIR [82] ... 165
FIGURE 8-5:SEEPAGE PRINCIPLE, WITH THE RELATED SCOUR PHENOMENA [71] ... 166
FIGURE 8-6:PRINCIPLE SKETCH FOR EXCAVATION RESERVOIRS ... 167
FIGURE 8-7:SCREENSHOTS GOOGLE MAPS OF DIMENSIONS MINE SITE ZWARTBERG [86] ... 168
FIGURE 8-8:PLAN VIEW PROPOSED RESERVOIR DESIGN ... 169
FIGURE 8-9:TRANSVERSE CROSS-SECTION OF THE PROPOSED RESERVOIRS ... 169
FIGURE 8-10:STORAGE OF THE TWO LIQUIDS IN ONE RESERVOIR, AT THE BEGINNING OF GENERATION ... 170
FIGURE 8-11:STORAGE OF THE TWO LIQUIDS IN ONE RESERVOIR, AT THE BEGINNING OF THE ENERGY STORAGE ... 170
FIGURE 8-12:EXAMPLE OF A TUNNEL SEGMENT WITH GASKET [88] ... 171
FIGURE 8-13:INTENTION OF BACKGROUTING [76] ... 172
FIGURE 8-14:THE SHOTCRETE APPLICATION [80]... 174
xxv
LIST OF TABLES
TABLE 2-1:THE STORAGE CAPACITY FOR THE HEINDL POWER MODULE ... 19
TABLE 2-2:GENERAL INFORMATION ON HUNTORF AND MCINTOSH [24] ... 21
TABLE 3-1:CHARACTERISTICS OF WATER ... 23
TABLE 3-2:LIST OF TOXIC HEAVY LIQUIDS WITH THEIR SPECIFIC DENSITY AND MELTING-/BOILING POINT... 24
TABLE 3-3:EXPERIMENTAL VALUES FOR YIELD STRESS DETERMINED WITH ROTO-VISCOMETER [28] ... 28
TABLE 3-4: THE VISCOSITY FOR DIFFERENT KAOLINITE SOLUTIONS AT 20°C ... 29
TABLE 3-5:PARAMETERS USED FOR RHEOLOGICAL MODELS AT DIFFERENT VOLUME CONCENTRATIONS ... 31
TABLE 3-6:CHARACTERISTICS OF THE SOLUTION... 34
TABLE 5-1:THE FRICTION FACTOR FOR WATER WITH FLOW VELOCITY V=0.3 M/S;D=2.76 M ... 79 TABLE 5-2:THE FRICTION FACTOR FOR HEAVY LIQUID WITH FLOW VELOCITY V=0.3 M/S;𝜇 = 1.8𝑚𝑃𝑎𝑠;D=2.76 M ... 79
TABLE 5-3:HEAD LOSSES PER 1000 M TUNNEL LENGTH FOR THE TWO LIQUID TYPES V=0.3 M/S ... 80
TABLE 5-4:THE FRICTION FACTOR FOR WATER WITH FLOW VELOCITY V=0.6 M/S;D=5 M ... 80 TABLE 5-5:THE FRICTION FACTOR FOR HEAVY LIQUID WITH FLOW VELOCITY V=0.6 M/S; Μ=1.8 MPA S;D=5 M... 80
TABLE 5-6:HEAD LOSSES PER 1000 M SHAFT LENGTH FOR THE TWO LIQUID TYPES ... 81
TABLE 5-7: TUNNEL LENGTHS ZWARTBERG ON THE TWO LEVELS ... 84 TABLE 5-8:SHAFT DIMENSIONS ZWARTBERG... 84
TABLE 5-9:THEORETICAL ENERGY STORAGE CAPACITY PER CYCLE ... 90
TABLE 5-10:THEORETICAL ENERGY INPUT AT PUMP PER CYCLE ... 95 TABLE 6-1:INPUT DATA AND CORRESPONDING ENTRANCE LENGTH ... 105
TABLE 6-2:RESULTS OF ENERGY LOSSES OBTAINED BY NUMERICAL SIMULATION ... 109
TABLE 6-3:COMPARISON OF SIMULATED LOSSES WITH THEORETICAL LOSSES ... 110 TABLE 6-4:RESULT OF TESTING SENSITIVITY OF THE MESH... 111
TABLE 6-5:THEORETICAL VELOCITY IN FUNCTION OF THE HEIGHT ... 113 TABLE 6-6:CHARACTERISTICS OF USED LIQUIDS IN THE NUMERICAL MODELS... 120 TABLE 6-7:CAPACITY LOSS BY PREMATURELY STOPPING STORAGE ... 128
TABLE 6-8:CAPACITY LOSS BY IMPLEMENTING INVERSED WEIR RESPECTIVELY FOR P EQUALS 1 M AND 1.5 M ... 129 TABLE 7-1:CHARACTERISTICS OF THE ANALYSED SUSPENSIONS... 146 TABLE 8-1:DESIGN VALUE OF THE SHEAR STRENGTH [65] ... 162
xxvi
NOMENCLATURE
Acronyms
PHS Pumped hydropower storage
UPHS Underground pumped hydropower storage GPM Gravity power module
CAES Compressed air energy storage
Greek symbols 𝜌 Density [𝑘𝑔 𝑚3] 𝜂 Efficiency [-] 𝜇 Dynamic viscosity [𝑃𝑎 ∙ 𝑠] 𝜈 Kinematic viscosity [𝑚2 𝑠 ] 𝜏 Shear stress [𝑃𝑎] 𝜏𝑦 Yield stress [𝑃𝑎] 𝛾 Shear rate [𝑠−1] 𝛼 Slope tunnel [°]
𝛽 Inclination of the interface [°]
Roman symbols 𝑔 Gravitational constant [𝑚 𝑠2] 𝑉 Volume [𝑚3] 𝐻 Head [𝑚] 𝑄 Flow rate [𝑚3 𝑠 ]
𝑄𝑝 Flow rate pump [𝑚
3
𝑠 ]
𝑄𝑡 Flow rate turbine [
𝑚3 𝑠 ] 𝑣 Flow velocity [𝑚 𝑠] 𝑚 Mass [𝑘𝑔] 𝐷 diameter [𝑚] 𝑑 Depth [𝑚]
Nomenclature xxvii
ℎ Height [𝑚]
𝑟 Radius [𝑚]
𝑐 Concentration [%]
𝐾 Consistency [𝑃𝑎 ∙ 𝑠𝑛]
𝑃𝑖 Hydrostatic pressure at location 𝑖 [𝑃𝑎]
𝐴 Cross-section area [𝑚2]
𝐿𝑠𝑡 Stroke length [𝑚]
𝐿𝑒 Entrance length [𝑚]
𝑓𝑠𝑎𝑓𝑒𝑡𝑦 Safety factor [-]
𝑓𝑟𝑒𝑑 Reduction factor [-]
ℎ𝑚 Depth of the interface [𝑚]
ℎ1 Height of free surface in the heavy liquid reservoir [𝑚]
ℎ2 Height of free surface in the water reservoir [𝑚]
𝐸 Energy [𝑀𝑊ℎ]
𝑃 Power [𝑀𝑊]
𝑡 Time [𝑠]
𝑡𝑝 Time pumping [𝑠]
𝑡𝑡 Time turbining [𝑠]
𝑓𝑓 Fanning’s friction factor [-]
ℎ𝐿 Head loss [𝑚]
𝑅𝑒 Reynolds number [-]
𝐹𝑟 Froude number [-]
𝑒 Roughness pipe wall [𝑚𝑚]
𝐿 length tunnel [𝑚]
𝜁 Local head loss coefficient [-]
𝑘 permeability [𝑚2]
𝐹 Load force [𝑁]
𝑢𝑓 Filter velocity [
𝑚 𝑠]
Nomenclature xxviii Subscripts ℎ𝑙 Heavy liquid 𝑤 Water 𝑛𝑒𝑡 Net 𝑔𝑟𝑜𝑠𝑠 Gross 𝑟𝑒𝑙 Relative 𝑉 Volume 𝑚𝑎𝑥 Maximum 𝑚𝑖𝑛 Minimum 𝑟𝑒𝑠 Reservoir 𝑑𝑖𝑠𝑝𝑙 Displaced 𝑡ℎ𝑒𝑜𝑟 Theoretical 𝑒𝑞 Equivalent 𝑟𝑒𝑞 Required 𝑝𝑜𝑡 Potential 𝑘𝑖𝑛 Kinetic
1
CHAPTER 1: INITIAL CONCEPT FOR ENERGY STORAGE IN OLD
COAL MINES
1.1 B
ACKGROUND
The starting point of this master thesis is based on a conceptual idea of ir. A. Beyne. The goal of this idea is to use the existing, but abandoned structures of the old coal mines in Belgium to store energy. The idea starts with the growing need for large capacity energy storage in today’s energy market. This is the result of a changing pattern in energy production and demand. Due to growing environmental and global warming concerns, the transition to renewable energy happens faster and faster. The use of solar and wind for energy production has a major drawback, the production of energy is relatively unreliable, there are periods of idle energy production. The moment of production is not always equal to the moment of consumption. In comparison, in Belgium, nuclear energy is the stable source for production and peaks in the demand are compensated with turbine gas power plants [1]. In Figure 1-1, the generated energy is given as total load and the three major sources of power in Belgian, i.e. nuclear, gas and wind. The values are based on the data from [1]. Here it is clear that nuclear energy forms the base load for electric grid and gas is more variable as a response for peak demands. For the moment the fraction of energy produced by wind energy is still relatively low with an average 7% of the total energy produced [2].
Figure 1-1: Belgian energy production first half of January 2020
When switching to more environmentally friendly renewable energy and phasing out the gas powered turbine for energy production, the reliable source of peak compensator disappears. To compensate for a more unstable and unpredictable grid due to the idle time of solar panels and wind turbines, the need for large capacity energy storage plants becomes more important. The energy storage helps to stabilise the grid and anticipate on peak demands when the renewables do not deliver enough energy on the grid. The goal of a large energy storage capacity system is to store energy when the demand is low and the production is high. As a result, the surplus of energy can be stored in a storage system for
Chapter 1: Initial concept for energy storage in old coal mines 2
a relatively low energy cost (due to low demand). When the demand is high, peak demand and/or the renewable energy sources do not produce enough, the surplus energy that is stored in the storage system can now be put back on the grid to compensate and stabilise the grid.
First, the storage concept system and the advantage is explained. To explain the concept a fictive situation is used for the demand and production curve over 4 days. The fictive situation is based on data from supply and demand in Belgium [1], but the fraction of wind energy is increased with a factor 5 and the base load of nuclear with a factor 1.8 to represent a possible future situation. The production is only composed of a nuclear base load and variable wind source. In Figure 1-2 the energy supply and demand are displayed together in a graph. It is clear that the supply is not always equal to the demand. When the renewables work at full capacity there is a surplus of energy and when the renewables are idle then there is a shortage. During the surplus periods, the energy can be stored in a storage system and vice versa during a shortage.
Figure 1-2: A fictive power supply and demand curve
When looking at the above graph, it is clear that the demand and supply of power do not match, due to the unreliable wind energy production. The storage system aims to store most of the energy surplus and deliver when there is a shortage to stabilise. The surplus or shortage of energy in MWh is the area between the red curve and black curve in Figure 1-2. When the black line is above the red one, then there is a surplus and vice-versa for a shortage. Ideally, the storage systems installed can store the total amount of energy that is equal to the area between the graphs.
Up till now, the large storage capacity is mainly achieved by pumped hydropower storage systems (PHS). To utilize such systems, large reservoirs need to be constructed and a certain amount of head (height difference) should be available. This combination is rare in Belgium, since it is a small country with only limited height differences. The Belgian Ardennes is a possible candidate, in Coo, there is already a pumped hydropower storage installed. Nevertheless, the spatial impact is quite large and this is a large problem for the densely populated region of Belgium. As a result, the amount of potential storage capacity is not too high in Belgium for the traditional PHS. For this purpose, a search for
Chapter 1: Initial concept for energy storage in old coal mines 3
alternative high capacity storage systems is required to accommodate the transition to renewables. This master thesis is focussing on a particular concept of large capacity energy storage, the initial based on the PHS and density-driven storage installed in abandoned coal mines. Many European countries have old coal mines which are still in use, abandoned or maintained as industrial heritage. As a result, this system has the potential to be introduced in different European countries. The use of old coal mines for energy storage is not new and is already used for the introduction of underground pumped hydropower storage systems, as presented 2.2.1. The main goal of using the mines for energy storage is the lower spatial impact compared to the traditional system and the “recycling” of unused infrastructure. In this master thesis, the focus will be on the Belgian coal mine of Zwartberg but since most mines have some common characteristics, it is possible to extrapolate some calculations to other mines. As well theoretical approaches will carried out for a coal mine in general and thus not for the specific case of Zwartberg [3-5].
1.2 INITIAL IDEA/STUDY PROBLEM
In this first part, an introduction to the concept is made and the most important aspects are discussed. In Figure 1-3, the sketch of the initial study problem is displayed (note that this sketch is in Dutch).
Figure 1-3: The initial concept sketch of the energy storage system in old coal mines by ir. A. Beyne
In this sketch, the characteristic composition of a coal mine is directly visible. Two vertical shafts are starting at ground level and leading to the different coal layers under the ground. A mine has always two shafts for ventilation. The slightly tilted horizontal corridors represent the different levels of horizontal coal mine shafts. In reality, however these horizontal corridors are not just connecting both vertical shafts, but are spreading out in different directions for several kilometers depending on the mine. A more realistic mine structure will be discussed in greater detail in chapter 5.
Chapter 1: Initial concept for energy storage in old coal mines 4
Now the working principle of the storage system will be described. The system consists of two liquids: water and a heavy liquid. The working cycle of the system can be defined as follows. When there is a surplus of energy, water from a reservoir above shaft 2 is pumped into the mine. By adding water, the heavy liquid is displaced towards shaft 1 and evacuated into its respective reservoir, which is filled with heavy liquid. By doing this the system gains more potential energy. It is this potential energy that corresponds with the stored energy. Due to this unbalance the heavy liquid wants to flow back into the direction of shaft 2. This results in water flowing back into reservoir 2. When doing this, it passes a turbine which generates power. The potential energy storage of the system can be quantified by the pressure head at the turbine, which is a combination of the density difference of both liquids and the depth of the mine. There are 4 phases which form a cycle:
1) Phase 1, also called the storage phase: the water is pumped from the water reservoir into the mine shaft with a pump unit at the mine shaft entrance. By adding water the interface between both liquids is pushed further and the heavy liquid leaves the system into its respective reservoir, due to the incompressibility of the liquids. This utilized power is stored in the system. Depending on the capacity of the pump, the volume available in the mine and the energy demand and generation, the pumping time can take less or more time.
2) Phase 2: this is the phase between the storage and generation phase. A valve between the water reservoir and the shaft underneath is shut. There is a net pressure head at this location. Hence no water can flow back into the reservoir. Although there is an unbalance in the system, the system is in a static situation. The duration of this phase depends on the pumping time and demand.
3) Phase 3: when there is a high demand, the generation phase can be initiated. In this phase, the valve between the water reservoir and the shaft is opened. Due to the unbalance of the system, the water will flow back into the reservoir and will pass a turbine which generates energy. This generated energy is a fraction of the initial energy used in the storage phase. The magnitude of that fraction depends on the systems losses, these will be discussed later in this master dissertation. The pumped hydropower storage has an efficiency of approximately 70-85%, which is relatively high. This means also that a storage system is a net energy consumer. 4) Phase 4: After a period of generation the valve is shut to stop the water flow and energy production. There are different reasons to stop the production: the water level in the reservoir has reached the maximum position (risk of flooding), the energy demand is low again (which means the energy cost is low, which would make further turbining useless and one can start pumping water in the mine, for storage) and the position of the interface has reached its maximum level. This has great importance for the storage capacity of the mine system and will be discussed further in this dissertation. The time the turbine can work determines the total amount of produced energy.
At the end of phase 4, the cycle can start all over again with phase 1. The use of a storage system is important for the stabilisation of the power grid. In the times of upcoming renewable electricity, the power output is very variable and therefore a storage system can be used to stabilize the grid and react on peak demands, see the explanation above. From the foregoing explanation, it can be deduced that there is a need for a valve, turbine and pump at the entrance of the mine shaft under the water reservoir.This technology for a combined pump-turbine unit at the entrance of shaft 2 already exists
![Figure 2-2: Pumped hydropower storage system, left: pumping mode - right: production mode [7]](https://thumb-eu.123doks.com/thumbv2/5doknet/3296798.22201/36.892.111.788.360.551/figure-pumped-hydropower-storage-left-pumping-right-production.webp)
![Figure 3-3: The relative dynamic viscosity as a function of the concentration of natural muds in the Netherlands [28]](https://thumb-eu.123doks.com/thumbv2/5doknet/3296798.22201/56.892.112.782.107.484/figure-relative-dynamic-viscosity-function-concentration-natural-netherlands.webp)
![Figure 3-4: Viscosity of kaolinite solution in function of particle concentration, experimental vs model results [30]](https://thumb-eu.123doks.com/thumbv2/5doknet/3296798.22201/57.892.241.647.378.638/figure-viscosity-kaolinite-solution-function-particle-concentration-experimental.webp)
![Figure 3-5: Influence of temperature on the shear stress-shear rate relationship [31]](https://thumb-eu.123doks.com/thumbv2/5doknet/3296798.22201/58.892.223.673.446.739/figure-influence-temperature-shear-stress-shear-rate-relationship.webp)
![Figure 3-9: Rheological behaviour of the three different density mixtures presented by three model and test results [31]](https://thumb-eu.123doks.com/thumbv2/5doknet/3296798.22201/61.892.230.656.114.333/figure-rheological-behaviour-different-density-mixtures-presented-results.webp)
![Figure 4-1: Alternating layers of plant debris and sedimentations due to the effect of cyclothems [34]](https://thumb-eu.123doks.com/thumbv2/5doknet/3296798.22201/65.892.212.681.655.928/figure-alternating-layers-plant-debris-sedimentations-effect-cyclothems.webp)
![Figure 4-3: Geological profile going from the southwest of Belgium to the northeast of The Netherlands [35]](https://thumb-eu.123doks.com/thumbv2/5doknet/3296798.22201/66.892.114.782.804.1070/figure-geological-profile-going-southwest-belgium-northeast-netherlands.webp)