TRENDS IN GLOBAL CO
2
AND
TOTAL GREENHOUSE GAS
EMISSIONS
2018 Report
Jos G.J. Olivier and Jeroen A.H.W. Peters
Trends in global CO2 and total greenhouse gas emissions: 2018 Report © PBL Netherlands Environmental Assessment Agency
The Hague, 2018
PBL publication number: 3125
Corresponding author
jos.olivier@pbl.nl
Authors
Jos G.J. Olivier and Jeroen A.H.W. Peters
Acknowledgements
We thank the International Energy Agency (IEA), the U.S. Geological Survey (USGS), International Fertiliser Association (IFA) and the Global Carbon Project (GCP) for providing recent statistics. We thank the members of the EDGAR team at EC-JRC for their support in the data compilation of the CO2 Fast Track 2017 and Pieter Boot and Michel den Elzen (PBL)
and Greet Maenhout and Marilena Muntean (JRC) for their comments.
Graphics
PBL Beeldredactie
Production coordination
PBL Publishers
This publication can be downloaded from: www.pbl.nl/en. Parts of this publication may be reproduced, providing the source is stated, in the form: Olivier J.G.J. and Peters J.A.H.W. (2018), Trends in global CO2 and total greenhouse gas emissions: 2018 report. PBL
Netherlands Environmental Assessment Agency, The Hague.
PBL Netherlands Environmental Assessment Agency is the national institute for strategic policy analysis in the fields of the environment, nature and spatial planning. We contribute to improving the quality of political and administrative decision-making by conducting outlook studies, analyses and evaluations in which an integrated approach is considered paramount. Policy relevance is the prime concern in all of our studies. We conduct solicited and
Contents
SUMMARY
4
1
INTRODUCTION
7
2
TRENDS IN GLOBAL EMISSIONS
9
2.1 Introduction 9
2.2 Global trends in total greenhouse gas emissions 11
2.3 Global trends in CO2 emissions 14
2.4 Global emissions of other greenhouse gases 16
3
TRENDS IN LARGEST EMITTING COUNTRIES AND THE EU-28 20
3.1 China 23 3.2 United States 25 3.3 European Union 28 3.4 India 30 3.5 Russian Federation 33 3.6 Japan 34
APPENDICES
37
A. CO2 emissions per country, per capita, and per USD of GDP 37
B. Greenhouse gas emissions total greenhouse gas, CH4, N2O, F-gases 41
C. Recent trends in electricity production * 48
D. Recent trends in key drivers of greenhouse gas emissions * 49
REFERENCES
50
Summary
Growth in global greenhouse gas emissions resumed in 2017
The year 2017 was a remarkable year. The growth in total global greenhouse gas (GHG) emissions resumed in 2017 at an annual rate of 1.3%, reaching 50.9 gigatonnes of CO2
equivalent1 (Gt CO2 eq) after two years of virtually no growth (0.2% in 2015 and 0.6% in
2016) (Figure S.1). This happened while the 2.6% global economic growth of 2017 continued at about the average annual rate of 2.4% since 2002 (excluding the credit crunch years). Present greenhouse gas emissions are about 55% higher than in 1990 and 40% higher than in 2000. The 2017 global greenhouse gas emissions are 55.1 Gt when including the very uncertain land-use-change emissions, which are estimated at 4.2 Gt CO2 eq.
In 2017, the 1.3%, or 0.6 Gt CO2 eq, increase in global greenhouse gas emissions was
mainly due to a 1.2% increase in both global carbon dioxide (CO2) emissions and methane
(CH4) emissions, which showed almost no growth in 2015 and 2016. The emissions of nitrous
oxide (N2O) and fluorinated gases (so-called F-gases) continued to grow at rates similar to
those in 2015 and 2016. CO2 emissions are the largest source of global greenhouse gas
emissions, with a share of about 73%, followed by CH4 (18%), N2O (6%) and F-gases (3%).
The greenhouse gas growth rate of 1.3% is similar to those seen from 2012 to 2014, when the average greenhouse gas emissions growth slowed down to 1.3% per year, which coincidentally also was the average annual growth rate in the decades before 2003. The 2017 increases in CO2 and CH4 emissions are also similar to those in 2012 to 2014.
Second, 2017 was remarkable, because it was globally the third warmest year since records began in 1880, behind the record year 2016 and second warmest year on record 2015, the last two influenced by a strong El Niño. However, 2017 ranks as the warmest year on record for all the years without the occurrence of an El Niño. The average global temperature (above both land and ocean surfaces) was 0.84 °C above the 20th century average of 13.9 °C (above land, this was 1.41 °C).
Increase in greenhouse gas emissions in 2017 in largest emitting countries
and EU
Five countries and the European Union emit the largest amounts of greenhouse gas
emissions, together accounting for 63%, globally. China accounts for 27%, the United States for 13%, the European Union for 9%, India for 7%, the Russian Federation for 5% and Japan for 3%. These countries also have the highest CO2 emission levels (Figure S.1). In 2017,
most of the five largest emitting countries and the European Union showed a real increase in greenhouse gas emissions, with India (+2.9%), China (+1.1%), European Union (+1.1%), Russian Federation (+1.0%) and Japan (+0.3%) (except for the United States, where emissions remained constant, at 0.1%).
1 For CH4, N2O and the F-gases, we use the Global Warming Potential (GWP) metric for 100 years from the
Fourth Assessment Report (AR4) of the IPCC. The historical greenhouse gas emission trends from the EDGAR database are also presented in UNEP’s Emissions Gap Report 2018, but using the GWPs of the IPCC Second Assessment Report (SAR) (UNEP, 2018). In the UNEP report, the 2017 total annual greenhouse gas emissions are reported at 53.5 Gt CO2 eq, using SAR GWPs and including 4.2 Gt CO2 eq from land-use change.
Figure S.1
Global CO
2emissions increasing after a standstill of two years
The flat global CO2 emissions in 2015 and 2016 (0.0% and +0.4%) were mainly due to
declining global coal consumption, caused by three years of decreasing coal consumption in China and declines in the United States and the European Union, mainly from increased renewable power generation, in particular, wind and solar power, and fuel switching to natural gas in power plants.
In 2017, the increase in global CO2 emissions of 1.2% to 37.1 Gt CO2, which is about 65%
higher than in 1990, was mainly due to a new 0.7% rise in global coal consumption, mainly caused by a strong 4.5% increase in India (twice the rate of 2016) and increases in Turkey (+16%), South Korea (+5.4%), Indonesia (+7.1%) and China (+0.2%). In contrast, coal consumption continued to decrease in the United States and the European Union (notably in Germany and the United Kingdom) by more than 2%, and in the Ukraine by 17%.
Global consumption of oil products and natural gas continued to increase, by 1.4% and 2.6% in 2017. The increase in global oil consumption was led by China, the European Union and the United States, whereas for global natural gas consumption this concerned China (+14.8%), the European Union (+4.0%) and Iran (+6.5%).
In 2017, total energy demand increased by 2.3%, half of the increased demand was met by fossil fuels and the other half by renewables plus nuclear power. Since 2010, renewable and nuclear power increased their share in total power generation by 2.5 percentage points, to almost 35%. These figures illustrate that it may still take several years before rapidly increasing renewable energy sources, together with nuclear energy, will become the energy sources of choice for meeting all the increases in global energy demand and replace existing technology.
Global CH
4emissions increasing after two years of very slow growth
In 2017, similar to CO2, global CH4 emissions increased by 1.2% to a total of 370.5 Mt CH4
(9.3 Gt CO2 eq), which is 21% higher than in 1990. The increase in 2017 is markedly higher
than in 2015 and 2016, which saw growth rates of only 0.5% and 0.4%, but again similar to growth rates in the three years before that. Increases in CH4 emissions from coal production
(+4.2%), livestock and particularly non-dairy cattle (+1.0%), waste water (1.8%) and natural gas transmission (+3.3%) contributed the most to global methane emission changes in 2017. With a 2.1% increase in CH4 emissions, China accounts for one third of the total net
increase, followed by Iran (+7.1%), India (+1.2%), the United States (+1.0%) and the Russian Federation (+1.1%).
Global N
2O emissions and F-gas emissions continue to grow
For 2017, the growth rate of global N2O emissions is estimated at 1.4%, reaching a total of
10 Mt N2O (3.0 Gt CO2 eq), which means that emissions have remained at almost the same
level as in 2015 and 2016—years that saw growth rates of 1.1% and 1.7%. Current emissions are 30% higher than in 1990, when they were 2.3 Gt CO2 eq. Increases in
emissions from the largest sources, notably manure dropped in pastures, rangeland and paddocks (+1.5%) and the use of synthetic nitrogen fertilisers (+1.7%), contributed most to global emission changes in 2017. With a 2.6% increase, India accounts for the largest contribution to the global N2O increase, followed by the United States (+1.6%), China
(+0.8%) and the European Union (+1.1%).
F-gases, as a group, show annual global growth rates of 5.6%, on average, in the 2004– 2014 period, slowing down to 4.5% in 2016 and 4.1% in 2017. Global total F-gas emissions are estimated for 2017 at 1.6 Gt CO2 eq worldwide, which is more than four times the
emissions in 1990. HFC emissions from their use as a substitute for CFCs—as CFCs are phased out to protect the ozone layer—make up two thirds of present total F-gas emissions.
Outlook for 2018
The first monthly statistics for fossil fuel consumption in 2018 available for China (9 months) and the United States and European Union (both 7 months) suggest that, in 2018, CO2
emissions are likely to increase in China, continue to decrease, slowly, in the United States, and to decline in the European Union.
Most comprehensive data set
This is the most comprehensive report on global greenhouse gas emissions up to 2017, with detailed data on emissions of all greenhouse gases. Other reports focus on CO2 emissions
only, which make up around three quarters of total greenhouse gas emissions, and/or present shorter historical time series.
1 Introduction
This report presents recent trends, up to 2017, in greenhouse gas (GHG) emissions, for both carbon dioxide (CO2) and non-CO2 greenhouse gas emissions. We calculated these emissions
based on the new EDGAR database version 5.0 for CO2 from fossil fuel use (Muntean et al.,
2018), mainly based on the IEA energy statistics (IEA, 2017a), and version 4.3.2 for non-CO2 greenhouse gas emissions (Janssens-Maenhout et al., 2017). The EDGAR v4.3.2
database was finalised in 2017 and includes comprehensive activity and emission factor data up to 2012. For 2016 and 2017, a fast-track (FT) method was used for CO2 emissions (as
described in Olivier et al., 2017 and Muntean et al., 2018). For the methane (CH4) and
nitrous oxide (N2O) emissions from 2013 to 2017, we mainly used a fast-track method for
about 80% to 90% of global emissions. For the remainder, we used extrapolation when international statistics were not available2.
The JRC booklet by Muntean et al. (2018) shows the time series of global CO2 emissions, for
all countries around the world and for the European Union as a whole, using data from EDGAR v5.0 on 1990–2017. The CO2 emissions presented in that booklet show the trend for
individual countries from 1990 up to 2017, as compiled according to the FT method for 2017, in both Olivier et al. and Muntean et al. reports. The CO2 emissions from fossil fuel
combustion were calculated using the same fuel statistics as in IEA (2017a). For the most recent detailed CO2 emissions from fossil fuel combustion up to and including 2016, including
revisions in previous years, we refer to IEA (2018b), which was released earlier this month.
Please note that the EDGAR v4.3.2 data set does not include emissions from savannah burning (IPCC/UNFCCC subcategory 3E of the agricultural sector), because international statistics were lacking. However, the FAO has compiled emission estimates for CH4 and N2O
per country, from this source, for 1990–2016, based on the data on area burned, on a spatial grid of pixels in the GFED4.1s data set3 (Van der Werf et al., 2017) and default
emission factors from IPCC (2006). The EDGAR v4.3.2 emission data were completed to cover all sources of anthropogenic greenhouse gas emissions (except for those from land-use change) with data on CH4 and N2O emissions from savannah burning, as reported by the
FAO. The 2017 emissions from savannah burning were estimated using preliminary regional emission totals, reported by GFED4.1s. The share of these emissions in global total emissions is 1.5% for CH4 (5.6 Mt CH4 or 140 Mt CO2 eq) and 5% for N2O (0.5 Mt N2O or 149 Mt CO2
eq).
2 This analysis is based primarily on greenhouse gas emission data (CO2 from fossil fuel use and industrial
processes, CH4, N2O and fluorinated gases), but excluding CO2 from land use change using data from EDGAR
v5.0 (CO2)/v4.3.2 (non-CO2) FT2017. The largest changes compared to v4.3.2 GHG FT2016 (Olivier et al.,
2017) are in the CO2 emissions, since the IEA energy consumption data have been updated for the whole time
series to 2015 instead of 2012 (from v4.3.2 to v5.0). Furthermore, updates were included for gas flaring and cement, which also changed the data before 2012. In general, for non-CO2 sources, updated international
statistics from IEA, BP, USGS, FAO, IRRI, UNFCCC (CRF) and other sources were used to estimate the 2012– 2017 emissions of CH4 and N2O, which means data are now through 2016 or 2017, with new statistics and
several revisions to previous years (but without change in the so-called emission factors).
3 The UN Food and Agriculture Organization (FAO) has compiled data on savannah burning emissions, for 1990–
2016, using data on monthly burned area, per 0.25ox0.25o grid cell, for five land-cover types from the
GFED4.1s data set (Van der Werf et al., 2017), multiplied by biomass consumption per hectare and tier 1 emission factors from IPCC (2006), aggregated at country level. The GFED data cover the 1996–2017 period. For the years before 1996, FAO used the average of the 1996 to 2014 values. For details, see (a) Data set Information at http://fenixservices.fao.org/faostat/static/documents/GH/GH_e.pdf, (b) Metadata at
Non-CO2 emissions constitute a significant fraction of global greenhouse gas emissions. For
climate policies, this refers to methane (CH4), nitrous oxide (N2O) and the so-called F-gases
(HFCs, PFCs, SF6 and NF3). To our knowledge, this report is the first to provide estimates of
total global greenhouse gas emissions including 2017, based on detailed activity data on most of the sources for these years4.
For global net CO2 emissions from land use, land-use change and forestry (LULUCF), we used
data recently generated in the Global Carbon Project (GCP) (Houghton et al., 2012) through 2015 (Houghton and Nassikas, 2017), which include data on CO2 emissions from forest and
peat fires, from the Global Fire Emissions Database version GFED4.1s through 2017 (Van der Werf et al., 2017). Those data are inherently very uncertain and therefore typically not included in emission totals of countries (e.g. as reported by countries under the UN Climate Convention) (UNFCCC, 2011). For the comprehensive overview of all greenhouse gas emissions and removals, we included them in the main figure (Figure 2.1) to illustrate their share in overall, total global anthropogenic greenhouse gas emissions. However, discussions on emission data focus on those derived from the EDGAR database, which excludes LULUCF emissions. For more information on this subject, we refer to Global Carbon Project (2018).
In addition to the global trends, the focus of this report is also on the top 5 emitting
countries and the European Union as a whole, and on the global total and the countries that were largely responsible for the global emissions changes in 2017. Uncertainty about non-CO2 emission data is typically much larger than about CO2 emissions (excluding forest and
other land-use-related emissions, ‘LULUCF’). This is because these sources are much more diverse and emissions are determined by technological or other source-specific factors, whereas for CO2, the emission factors are mainly determined by the fossil fuel type and
carbon content of fuels and carbonates.
Chapter 2 discusses the global emission trends. Firstly, we discuss the most important variables driving the volume of the greenhouse gas sources and which of those is covered by the international statistics used for our fast-track emission estimates, for the years 2013 to 2017. Section 2.1 discusses the total greenhouse gas emissions, with a focus on CO2 and on
the group of non-CO2 greenhouse gases. Section 2.2 presents the main trends in CO2
emissions, showing key trends in the use of main fossil fuels and cement production in the largest countries. Section 2.3 discusses the main trends in non-CO2 greenhouse gas
emissions and illustrates with the recent trends in key drivers of these emissions in the largest countries. Chapter 3 provides more detailed information on the five largest emitting countries and the European Union, as a whole.
This report focuses on trend analysis and identification of the key drivers of CO2, CH4 and
N2O emissions, rather than analysing more aggregate drivers, such as Gross Domestic
Product (GDP), energy use per unit of GDP, and CO2 emissions per unit of energy. Last
year’s report provides more details on the methodology used for estimating non-CO2
emissions (Olivier et al., 2017), in particular in Box 1.1 and Appendix D of that report. The previous report also discusses the quality and completeness of CH4 and N2O emission data by
comparing emissions in the EDGAR data set with total CH4 and N2O emissions from the
officially reported national emissions.
4Other work on historical time series of anthropogenic greenhouse gas emissions, up to 2005 or 2014, includes
US Environmental Protection Agency (EPA) on global non-CO2 greenhouse gas emissions for 1990–2005 (US
EPA, 2012); the CAIT database for greenhouse gas emissions for 1990-2014, compiled by the WRI (2016); and the PRIMAP-hist data set for 1850–2014, developed at the Potsdam Institute for Climate Impact Research (PIK) (Gütschow et al., 2016).
2 Trends in global
emissions
2.1 Introduction
Our analysis focuses on the identification of key trends and the main direct drivers that determine the changes in the quantity of CO2, CH4 and N2O emissions, both globally and for
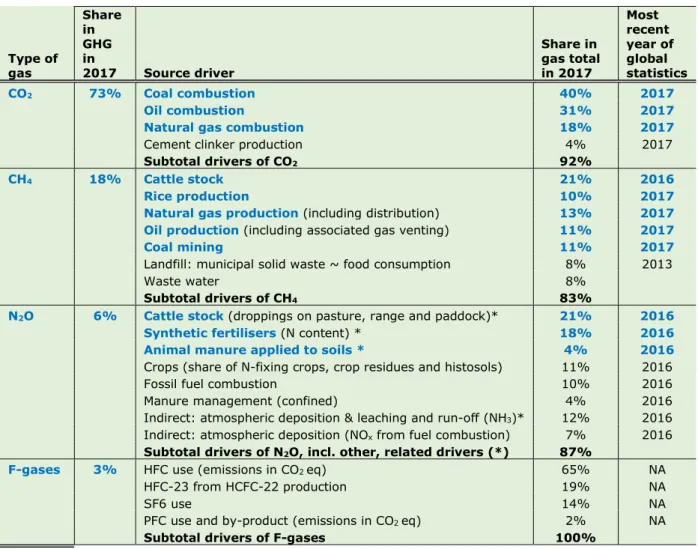
the five largest emitting countries and the European Union, as a whole. These gases, currently, contribute a respective 73%, 18% and 6% to global total greenhouse gas emissions, with F-gases accounting for the remaining 3%. Table 2.1 summarises the main drivers of emissions and their share in global emissions.
Table 2.1 Key drivers of greenhouse gas emissions and global shares of main sources Type of gas Share in GHG in 2017 Source driver Share in gas total in 2017 Most recent year of global statistics CO2 73% Coal combustion 40% 2017 Oil combustion 31% 2017
Natural gas combustion 18% 2017
Cement clinker production 4% 2017
Subtotal drivers of CO2 92%
CH4 18% Cattle stock 21% 2016
Rice production 10% 2017
Natural gas production (including distribution) 13% 2017
Oil production (including associated gas venting) 11% 2017
Coal mining 11% 2017
Landfill: municipal solid waste ~ food consumption 8% 2013
Waste water 8%
Subtotal drivers of CH4 83%
N2O 6% Cattlestock (droppings on pasture, range and paddock)* 21% 2016
Synthetic fertilisers (N content) * 18% 2016
Animal manure applied to soils * 4% 2016
Crops (share of N-fixing crops, crop residues and histosols) 11% 2016
Fossil fuel combustion 10% 2016
Manure management (confined) 4% 2016
Indirect: atmospheric deposition & leaching and run-off (NH3)* 12% 2016
Indirect: atmospheric deposition (NOx from fuel combustion) 7% 2016
Subtotal drivers of N2O, incl. other, related drivers (*) 87%
F-gases 3% HFC use (emissions in CO2 eq) 65% NA
HFC-23 from HCFC-22 production 19% NA
SF6 use 14% NA
PFC use and by-product (emissions in CO2 eq) 2% NA
Subtotal drivers of F-gases 100%
The direct drivers of CO2 are the combustion of coal, oil and natural gas, representing 89%
of global CO2 emissions, with respective shares of 40%, 31% and 18%. Calcination in
cement clinker production accounts for another 4% (Table 2.1). Fossil-fuel-related CO2
emissions can only be significantly reduced by switching to other energy sources, notably renewable sources such as hydropower, wind, solar and nuclear power and sustainably produced biofuels. Additional reductions may be achieved through energy-efficiency improvements. Furthermore, CO2 capture from flue gases and storage underground (CCS)
may contribute to reducing the seemingly ever-increasing CO2 concentrations in the
atmosphere (Global CCS Institute, 2018).
For CH4, there are three large groups of sources: agriculture, fossil fuel production and
waste/waste water. In agriculture, ruminant livestock, particularly cattle, and rice production are the largest global sources. With a share of three quarters of all ruminant-related CH4
emissions (36%), those from cattle alone are responsible for 21% of current global CH4
emissions. Rice cultivation on flooded rice fields is another agricultural source, where anaerobic decomposition of organic material produces methane, accounting for 10% of CH4
emissions. Other large CH4 sources are coal production, natural gas production and
transmission as well as oil production (including vented associated gas that consists mostly of CH4, if it cannot be utilised). Together, fossil fuel production and transmission account for
another third of global methane emissions, with each fuel having roughly equal share.
The third largest source is human waste and waste water. These are other sources where anaerobic decomposition of organic material produces methane. When biomass waste in landfill and organic substances in domestic and industrial waste water are decomposed by bacteria in anaerobic conditions, substantial amounts of methane are generated. Landfill and waste water are both estimated at shares of about 8%. For these emissions, food supply as a driver would be a good indicator; however, FAO statistics on food balances are lagging several years behind (Table 2.1).
For N2O, agricultural activities are the main emission source, with a share of almost 75%.
The animal droppings on pastures, rangeland and paddocks are by far the largest global source of nitrous oxide, with an estimated share of 21%, and the use of synthetic nitrogen fertiliser is the second-largest source, accounting for 18%, at present. Indirect N2O
emissions from agricultural activities contribute 12%. Together, these sources account for 55% of global emissions, including 4% from animal manure applied to agricultural soils as fertiliser (Table 2.1).
F-gas greenhouse gas emissions consist of emissions of HFCs, PFCs, SF6 and NF3. Emissions from the use of these gases are by far the largest source. Other sources are inadvertent
by-product emissions of HFC-23 during the by-production of HCFC-22 and PFCs emissions from
primary aluminium production. At present emissions of HFCs and SF6 are the largest global sources of fluorinated gases with shares of 84% and 13% (PFCs only 2%. Total F-gas emissions from the use of these gases, in particular HFCs, have substantially increased since 2005 with more than 4% per year, as industrialised countries show in their greenhouse gas emission trend reports through 2016 (UNFCCC, 2018). This is an important source of data for F-gases, as there are no global statistics for their use and emissions.
Other than by reducing the volumes of livestock and fertilisers used, CH4 and N2O emissions
may also be partly reduced by changes in animal feed, optimising nitrogen fertiliser use on arable land, and changes in human food preferences for meat, fish and vegetables, and reduction in losses over the entire food chain, from primary production by farmers to final consumption. Moreover, methane generated in fossil fuel production and in landfill and waste
water may be reduced by recovering CH4 and either use it as biogas for energy purposes or
by flaring it.
As we only use the fast-track methodology based on indicators of volume trends for estimating the emissions in the last five years (at maximum), we assume that these non-volume effects impacting emissions, such as changes in feed and food, are relatively small. Most of these changes are not further discussed in this report. For more information on this we refer to the detailed National Inventory Reports that are submitted annually by most industrialised countries to the UN Climate Secretariat (UNFCCC, 2018).
2.2 Global trends in total greenhouse gas emissions
The year 2017 was a remarkable year. First, the growth in total global greenhouse gas (GHG) emissions has resumed at the rate of 1.3% (±1%) per year, reaching a new greenhouse gas emission record of about 50.9 gigatonnes of CO2 equivalent56 (Gt CO2 eq)
(excluding those from land-use change), after two years of virtually no growth: 0.2% in 2015 and 0.6% in 2016 (which was a leap year and therefore 0.3% longer). This ends speculation about peaking of global emissions in 2015 and 2016.
This happened while the global economic growth of 2.6% in 2017 continued at about the average annual growth rate of 2.4% since 2002 (excluding the credit crunch years). Current greenhouse gas emissions are about 55% higher than in 1990 and 40% higher than in 2000. The 2017 greenhouse gas emissions are 55.1 Gt when including the very uncertain land-use change emissions estimated at 4.2 Gt CO2 eq.
Second, 2017 was remarkable because it was globally the third warmest year since records began in 1880, behind the record year 2016 and second warmest year on record 2015, both influenced by a strong El Niño. However, 2017 was also the warmest year on record without an El Niño present (NOAA, 2018). The average global temperature across land and ocean surface areas was 0.84°C above the 20th century average of 13.9°C (over land: 1.41°C).
Of the 10 warmest years on record, eight occurred within the last decade, and one in 2005, so also in this century, and the other in 1998. That the warmest years globally are
concentrated in recent years rather than more evenly distributed over time is also confirmed by the so-called annual number is Heating Degree Days in the United States and the
European Union, which is used as estimator of the demand for space heating (see sections 3.2 and 3.3).
Second, in 2017, the growth in global greenhouse gas emissions has resumed at the rate of 1.3% (±1%), reaching a new greenhouse gas emissions record of about 50.9 Gt CO2 eq7
(excluding those from land-use change), after two years of virtually no growth: 0.2% in
5 Unless stated otherwise, we use in this report for CH4, N2O and the F-gases the Global Warming Potential
(GWP) metric from the Fourth Assessment Report (AR4) of the IPCC (2007), which is also used by industrialised countries in their annual national emissions inventory reports submitted to the UNFCCC (so-called Annex I countries). The time horizon of the GWPs used is 100 years. Please note that developing countries officially report their emissions using GWPs from the Second Assessment Report (SAR) of the IPCC. The largest difference is in the GWP of CH4: the GWP value is 25 in the AR4 and 21 in the SAR, so almost one fifth larger.
6 The historical EDGAR GHG emission trends in this report are also presented in UNEP’s Emissions Gap Report
2018, but using the GWPs of the SAR (UNEP, 2018). The global total in 2017 is estimated at 49.3 Gt CO2 eq when using GWPs from the SAR (excluding emissions from land use change), up from 48.7 Gt CO2 eq in 2016. The global total including 4.2 Gt CO2 eq land use change is 53.5 Gt CO2 eq when using GWPs from the SAR.
7 The global total in 2017 is estimated at 49.3 Gt CO2 eq when using GWPs from the SAR (excluding emissions
from land-use change), up from 48.7 Gt CO2 eq in 2016. The SAR 2017 global total, including 4.2 Gt CO2 eq
2015 and 0.6% in 2016 (which was a leap year and therefore 0.3% longer). This ends speculation about peaking of global emissions in 2015 and 2016.
The growth rate of 1.3% is similar to those seen from 2012 to 2014, when the average greenhouse gas emission growth slowed down to 1.3% per year, and that was also the growth rate in the decades before 2003 (Figure 2.1). Since that year, the global greenhouse gas growth rate had accelerated to 2.9% per year on average, which was related to the fast industrialisation of China since it had become a member of the World Trade organization (WTO) (Figure 2.1). To capture this period of global accelerated growth in our comparison of growth rates, in subsequent analysis of greenhouse gas emissions we will compare growth in recent years (2015 to 2017) to that of the decade 2004–2014.
Figure 2.1
The slowdown of the emissions growth since 2012 had led to speculation whether global greenhouse gas emissions are now ‘plateauing’ or ‘peaking’ at around 50 Gt CO2 eq and
whether we may expect global greenhouse gas emissions to decrease soon, but now we see in 2017 the same growth rate again as we saw for decades in the years before 2003. In those three decades, the average global greenhouse gas emission increase of 1.3% per year was mainly driven by the 1.7% average annual growth in CO2 emissions. Thus, apart from
short interruptions in years of global recessions, global greenhouse gas emissions have been increasing steadily in the decades since, e.g. from 24.5 gigatonnes in CO2 equivalent (Gt CO2
eq) in 1970, via 32.9 Gt CO2 eq in 1990 to 37.1 Gt CO2 eq in 2002. Subsequently, in the next
decade global emissions accelerated growth led to 47.8 Gt CO2 eq in 2011, after which
emissions increased at a much slower rate to 50.2 Gt CO2 eq in 2016.
Note that for climate policy purposes the emissions in 1990 are relevant as it is the default base year for the UN Climate Convention, 2005 is the base year for some national targets (such as for the European Union), further 2010 (more precisely the average of 2008-2012)
was the target year for the first commitment period of the Kyoto Protocol. Further analysis may show the extent to which recent global and national greenhouse gas trends estimated in this report are in keeping with the total national greenhouse gas emission trends as expected from analyses of pledges of countries under the Paris Agreement (UNEP, 2018; Kuramochi et al., 2018; PBL, 2016).
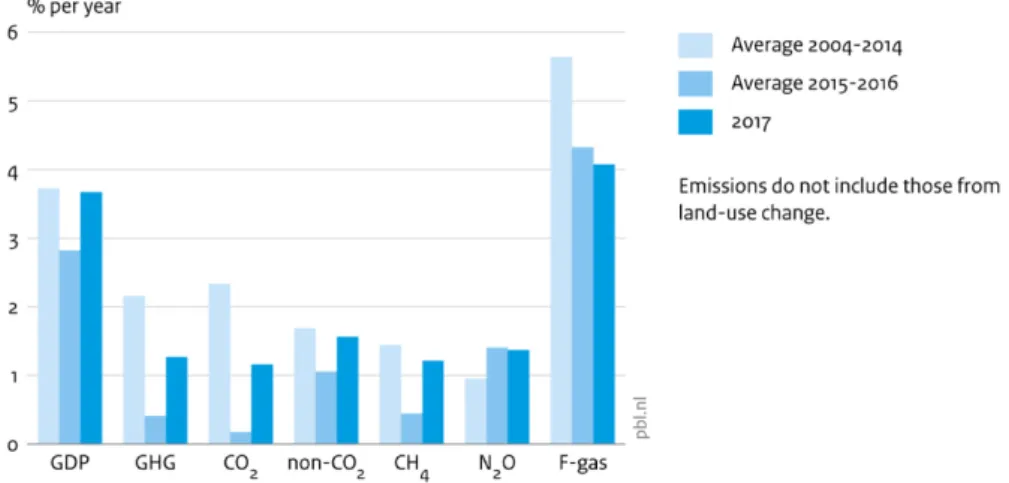
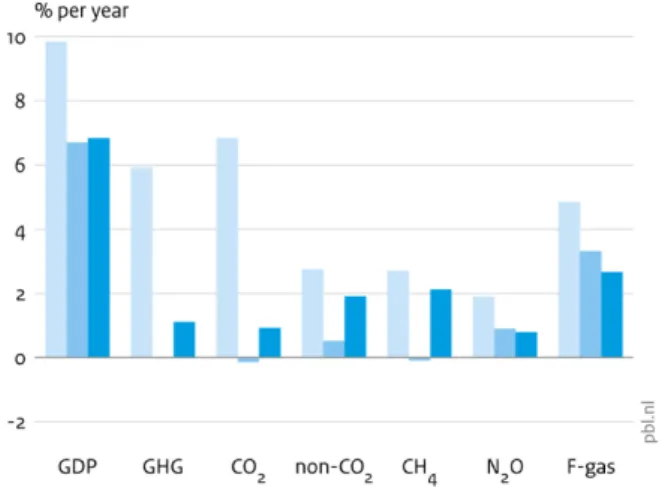
Figure 2.2 shows for the years 2004–2014, 2015–2016 and 2017 the average of annual global growth rates of Gross Domestic Product (GDP) and annual emissions of total
greenhouse gases and for each individual gas (but aggregating the fluorinated gases in one group called F-gases). It shows that, while the average growth in the world economy was fairly constant since 2002, annual growth in total greenhouse gas emissions have seen a distinct drop in 2015 and 2016 to 0.4%, on average. Moreover, although in 2017, the growth in global greenhouse gas emissions of 1.1% was larger than in the two preceding years, it was still only half of the average annual growth rate in the decade before.
Figure 2.2
When looking at the separate greenhouse gases, we can see which gases were mainly responsible for the total greenhouse gas trend in these three periods (Figure 2.2). It shows that the greenhouse gas increase in 2017 was mainly due to a 1.2% increase in global CO2
emissions, which account for about three quarters of the total greenhouse gas increase in 2017, but also non-CO2 emissions retained their average annual increase of 1.6% in 2017. In
contrast, the low greenhouse gas emission growth from 2014 to 2016 of about 0.4% per year is mainly due to the very low average CO2 growth rate of 0.2% per year in these years,
which is mainly caused by a declining global coal consumption, notably in China, the United States and the European Union.
The emissions of the other greenhouse gases CH4, N2O and F-gases increased in 2017 by
1.2%, 1.4% and 4.1%, respectively. Although most of global greenhouse gas emissions consist of CO2 (about 73%), methane, nitrous oxide and fluorinated gases (so-called
F-gases) also make up significant shares (18%, 6% and 3%, respectively) (Table 2.1). From these shares and increases in 2017 we can infer that it was CH4 that caused lower annual
growth on non-CO2 greenhouse gases in 2015 and 2016.
These percentages for the share in total greenhouse gas emissions do not include net emissions from land use, land-use change and forestry (LULUCF), which are usually accounted for separately, because they are inherently very uncertain and show large
interannual variations that reflect the periodically occurring strong El Niňo years, such as in 1997–1998 and 2015–2016, as shown by the grey area above the dashed line in Figure 2.1. When including LULUCF emissions—for 2017 estimated at about 4.2 Gt CO2 eq—estimated
global total greenhouse gas emissions come to 55.1 Gt CO2 eq.
2.3 Global trends in CO
2emissions
In the 1970–2003 period, global CO2 emissions (excluding those from LULUCF) increased by
1.7% per year on average. From 2003 to 2011 the emissions growth accelerated to 3.2% per year on average driven by China’s fast industrialisation since 2002. However, during the years 2012 to 2014 global growth slowed down to 1.4% per year. Thereafter, the global CO2
emissions have remained flat in 2015 and 2016 (±0.5%), as shown by the middle area in Figure 2.3.
However, in 2017, after these two years of almost no global CO2 emissions growth, global
CO2 emissions increased again, this time by 1.2%. This rebound is mainly due to a new rise
in global coal consumption by 0.7%, after three years of global declining coal consumption (Figure 2.3). This decline was caused by three years of decreasing coal consumption in China and declines in the United States and the European Union, mainly from fuel switching to natural gas in power plants and increased renewable power generation, in particular, wind and solar power (IEA, 2017a; BP, 2018).
The increase in global coal consumption in 2017 is mostly due to increases in China by 0.2% and India by 4.5% (twice the rate in 2016). In contrast, coal consumption in the United States and the European Union continued to decrease by more than 2% (in particular in Germany and the United Kingdom). Also, in the Ukraine, coal use continued to decline—in 2017, very substantially, by 17%. Coal-fired power plants are by far the largest user of coal. For more details on new coal plants, plants under construction, planned or retired we refer to Shearer et al. (2018a). They conclude that if current trends continue, by 2022 yearly
retirements will exceed new capacity added.
Global consumption of oil products and natural gas continued to increase, by 1.4% and 2.7% in 2017. The increase in global oil consumption was led by China, the European Union and the United States, accounting for half of the net increase. The increase in global natural gas consumption in 2017 was led by China (+14.8%), the European Union (+4.0%) and Iran (+6.5%), accounting for two thirds of the net global increase. For more details on these countries and the European Union we refer to Chapter 3.
The increase in global CO2 emissions in 2017 is closely related to the trends in primary
energy demand and energy mix. In 2017, total energy demand increased by 14 EJ, half of the increased demand was met by fossil fuels and the other half by renewable and nuclear power. Taking a somewhat longer view, total primary energy supply (TPES8) increased from
2010 to 2017 from almost 563 EJ to 629 EJ and the shares of fossil fuels decreased from 78.3% to 75.8% (down 2.6 EJ: coal -1.9, oil -1.0, natural gas +0.3 EJ)), renewables increased from 17.0% to 20.2% (up 3.2 percentage points: hydropower +0.3, biomass +0.1%, wind and solar power +2.9% percentage points), and nuclear energy decreased from 4.6% to 4.0%). However, with increasing demand, for peaking and curbing CO2
8 TPES, or Total Primary Energy Supply, is the total amount of energy consumption of a country (or the world).
It is calculated as in BP (2018): using a substitution method for nuclear, hydropower and other non-biomass renewable energy and assuming 38% conversion efficiency in all cases. This is different from the definition that the IEA uses in her publications in that they use different percentages for non-combustion power sources.
Figure 2.3
emissions, it is not enough to have higher growth rates of renewable and nuclear energy if they have small shares in total energy supply. Of the increase in electricity demand 36 EJ was met by fossils fuels, of which about one sixth by coal, almost half by natural gas and almost the other half by oil. Renewables contributed almost 32 EJ to the increase, two thirds of which from wind and solar power. However, nuclear power saw a net decrease of more than 1 EJ.
We recall that the time series data for global CO2 emissions have been revised and updated
since the 2017 report (Olivier et al., 2017). The updated estimate for total global total CO2
emissions in 2015 is now 36.5 Gt CO2, which is 2.5% higher than the estimate of 35.6 Gt
CO2 presented last year. The changes are mainly due to regular annual statistical revisions of
fuel consumption in the statistics of the International Energy Agency (IEA) and BP (for example the decrease in global coal consumption in 2015 was revised from -1.8% according to IEA statistics to -2.7% cf. BP (2018) statistics9 and the growth in natural gas consumption
9 The very latest IEA revision, according to just published IEA statistics online, is -2.1% (TPES coal and coal
in 2016 was 1.1 percentage point higher in the latest BP statistics compared to previous year) as well as revisions and some full updates. For other sources, some emission factors were also updated, such as chemical production processes, such as for ammonia and ethylene, and cement production10. The revised global CO2 emissions in are higher than in
last year’s report, from about 0.2 Gt in 1990 (+1.0%), decreasing to 0.1 Gt in 2000 (+0.4%) and increasing to 0.9 Gt in 2015 (+2.5%).
2.4 Global emissions of other greenhouse gases
As discussed in the introduction, the non-CO2 greenhouse gas emissions originate from many
different sources and are much more uncertain than CO2 emissions. Their uncertainty on a
country and global level is of the order of 30% or more, whereas for CO2 this is about ±5%
for OECD countries and ±10% for most other countries (Olivier et al., 2016). Note that due to the large diversity of the emission factors within these sources, and the lack of global statistics for F-gas production and their uses, the annual trends in the emission of CH4, N2O
and F-gases are much more uncertain than those in CO2.
Compared to the trend in global CO2 emissions, the increase in other greenhouse gas
emissions did not go down as much during the years 2015 and 2016, namely from 1.7% annual growth over the 2004–2014 period to a growth of 1.0% and 1.1% in the years 2015 and 2016. And growth resumed in 2017 by 1.6%.
Although varying per country, non-CO2 emissions constitute a significant share in total
greenhouse gas emissions. The global share of non-CO2 greenhouse gases is estimated to
have declined from 35% in 1970 to 26.6% in 2013, after which it started to increase, very slowly, to about 27% in 2017, because of the slow-down of the annual growth in global CO2
emissions since 2012.
The trend in global methane (CH4) emissions since 1990 is presented in Figure 2.4. It shows
that the largest sources are the production and transmission of coal, oil and natural gas, and livestock: when animals ruminate their feed, they emit considerable amounts of methane. Globally, cattle account for two thirds of the CH4 emitted by livestock, followed by buffalo,
sheep and goats that haves shares of about 10%, 7% and 5%, respectively. The third largest source is human waste and waste water: when biomass waste in landfill and organic materials in domestic and industrial waste water decompose by bacteria in anaerobic conditions, substantial amounts of methane are generated. Likewise, rice cultivation in flooded rice fields is another source where anaerobic decomposition of organic material produces methane.
Since the start of the 21st century global CH4 emissions started to rise again. From 2004 to
2014 they increased by 15%, which is 1.5% per year on average. Sources that contributed most to this increase were coal mining (+3.4%), livestock (+1.0%) and natural gas
production and distribution (+2.8%). Countries with the largest absolute increase over these 10 years are China, India, Brazil and Indonesia, whereas the largest decreases occurred in the European Union, Russian Federation, Nigeria and Ukraine.
In 2017, the growth rate is estimated at 1.2% to a total of 9.3 Gt CO2 eq, which is markedly
higher than in 2015 and 2016 that saw growth rates of 0.5% and 0.4% but is similar to
10 The +2.5% revision of total CO2 emissions in 2015 were due to the largest absolute increases occurring in
China (+3.2%), the United States (+2.6%), Saudi Arabia (+21%), the European Union (+2.5%), and South Africa (+22%) and Japan (+6.5%), whereas the largest decreases in 2015 were seen in India (-5.4%) and Canada (-14%).
growth rates in the three years before (2012–2014) (Figure 2.4). Present emissions are 21% higher than in 1990, when they were 7.6 Gt CO2 eq. Increases in emissions from livestock
and waste water contributed most to the global emission changes since 2014, partly
compensated by decreases seen in emissions from coal production and gas venting, such as in the United States and the European Union.
Figure 2.4
The trend in global nitrous oxide (N2O) emissions since 1990 is presented in Figure 2.5. It
clearly shows that agricultural activities are the largest sources of N2O accounting for about
75%. The main global sources of N2O emissions are from manure dropped in pastures,
rangeland and paddocks (22%) and the use of synthetic nitrogen fertilisers (18%). More than half of global N fertiliser use is urea. Somewhat smaller sources are other crop-related emissions (from N-fixing crops, crop residues left on the fields and histosols) (11%) and the indirect N2O emissions related to NH3 emissions from agriculture (12%). The largest
non-agricultural source is fuel combustion (17%, including indirect emissions of N2O from NOx
emissions), followed by waste water (7%) and the production of chemicals (4%).
In 2017, the growth rate of global N2O emissions is estimated at 1.4% to a total of 3.0 Gt
CO2 eq, so emissions have remained at almost the same level as in 2015 and 2016, which
saw growth rates of 1.1% and 1.7% (Figure 2.3). Present emissions are 30% higher than in 1990, when they were 2.3 Gt CO2 eq. Increases in emissions from the largest sources,
notably manure dropped in pastures, rangeland and paddocks and the use of synthetic nitrogen fertilisers, contributed most to the global emission changes since 2014.
Global N2O emissions of most sources generally developed rather smoothly from 1990 to
2017. An exception is N2O from the production of chemicals, such as adipic acid and nitric
acid, where from 2007 onwards N2O abatement technology has been applied in many
chemical plants, resulting in a reduction in their global N2O emissions of 40% since 1990.
From 2004 to 2014, global N2O emissions increased by 10%, which is 1.2% per year, on
average. Sources that contributed most to this increase were synthetic fertilisers (+1.9%), livestock droppings (+1.1%), other crop-related emissions (+1.7%) and indirect N2O
emissions (+2.0%). Countries with the largest increase over these 10 years are China, India, Brazil and Mexico, whereas the largest decrease occurred in the European Union.
Figure 2.6
The trend in F-gas emissions is presented in Figure 2.6. Although they make up the smallest category of the non-CO2 greenhouse gases, the group shows the strongest emission growth
with estimated annual global growth rates of 5.6% on average, in the 2004–20014 period, and slowing down somewhat to 4.5% in 2016 and 4.1% in 2017, which was estimated by extrapolating the average annual 2007–2010 trend. Using this estimation method, global total F-gas emissions amounted in 2017 to 1.6 Gt CO2 eq, worldwide, more than four times
the emissions in 1990 estimated at 0.3 Gt CO2 eq.
The main reason for this very high growth is the introduction of HFCs in the early 1990s to replace the use of CFCs as these were first phased out by industrialised countries to comply with the Montreal Protocol to protect the stratospheric ozone layer, and developing countries would follow later. This accounts for about 1.0 Gt CO2 eq of the global increase, and these
HFC emissions account now for two thirds of all F-gas emissions (Figure 2.6), and emissions of 134a , 143a and 125 make up most of them (over 90%). In addition, HFC-23 as by-product adds one fifth to total F-gas emissions. We note that these are very heterogeneous source categories, with large differences in growth rates for the different constituents, and often with very large uncertainties in emissions, at country level and per gas of the order of 100% or more.
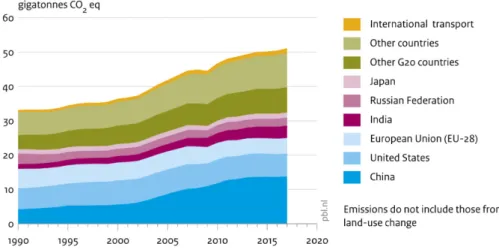
Figure 2.7 illustrates the 1990–2017 trends in total greenhouse gas emissions of the five largest emitting countries and the European Union, who collectively have a 63% share in global emissions, complemented with those in the other countries and from international transport (i.e. international marine and aviation emissions). Most of these five countries and the EU showed a real increase in greenhouse gas emissions in 2017, except in the United States, where emissions remained constant (+0.1%): China (+1.1%), India (+2.9%), European Union (+1.1%), Russian Federation (+1.0%) and Japan (+0.3%). Within the European Union, the United Kingdom, Germany and the Netherlands showed decreasing emissions whereas the largest increases in 2017 were seen in Spain and France. Together these five largest emitting countries and the European Union account for 51% of the world population, 65% of global gross domestic product (GDP) and 63% of the global total primary energy supply (TPES), accounted for 68% of total global CO2 emissions and about 63% of
total global greenhouse gas emissions.
Figure 2.7
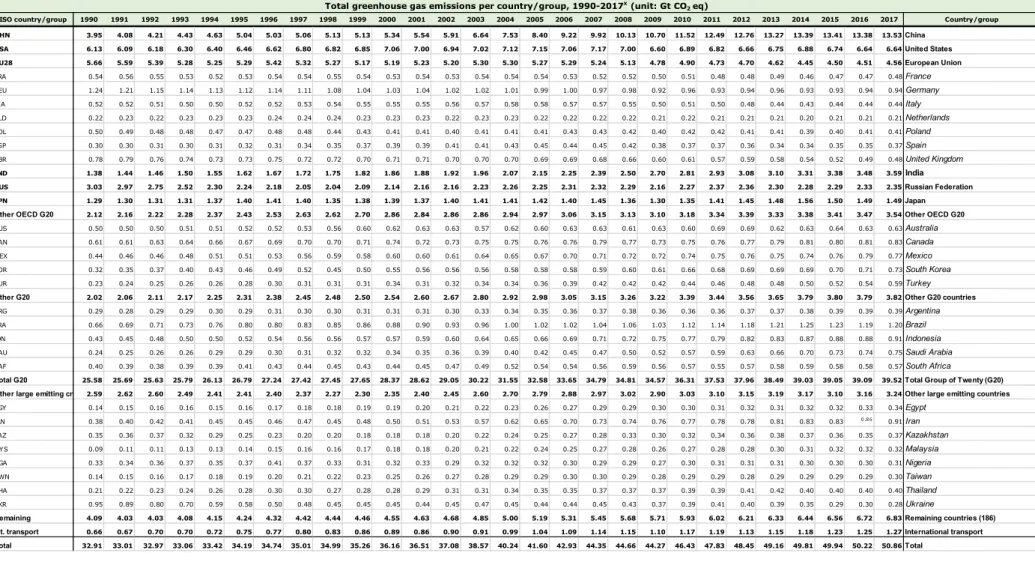
The total group of 20 largest economies (G2011), accounting for 78% of 2017 greenhouse
gas emissions, showed a 1.1% increase. The collective emissions from the rest of the world showed an 1.9% increase in 2017 (2.5% for the eight largest countries and 1.6% for remaining 186 countries). Appendix B provides more detailed tables, with the 1990–2017 greenhouse gas emission time series for the top 30 countries/regions, as well as per capita and per USD of GDP.
Following UNFCCC reporting and accounting guidelines (UNFCCC, 2011), greenhouse gas emissions from international transport (aviation and shipping) are excluded from the national total in countries’ greenhouse gas emission reports, but nevertheless constitute about 2.5% of total global greenhouse gas emissions in 2017, for which 1.2% increase was estimated.
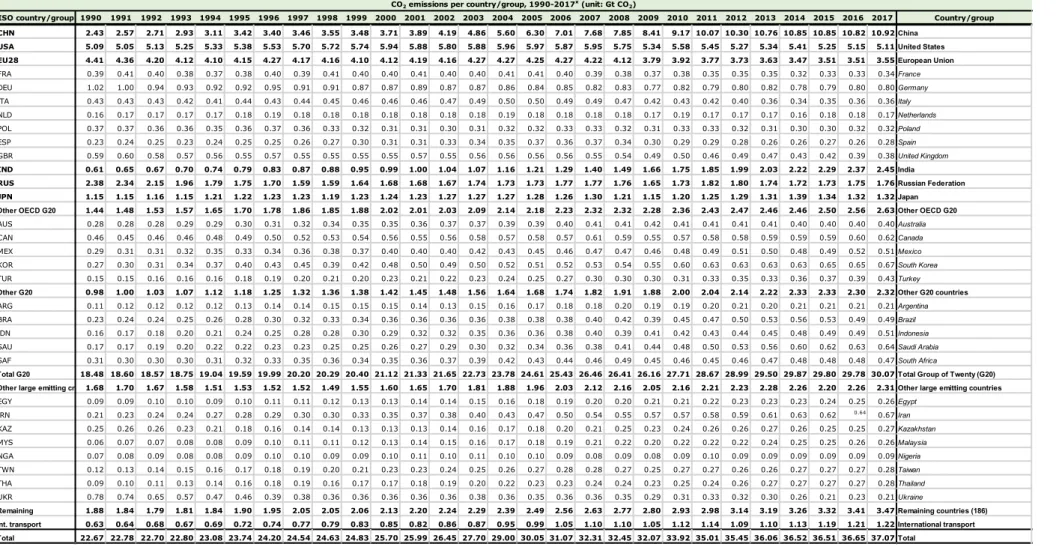
Appendix A provides tables with the 1990–2017 time series of CO2 emissions for the top 30
countries/regions, as well as per capita and per USD of GDP, whereas Appendix B provides tables with the 1990–2017 time series of total greenhouse gas emissions for these
countries/regions. as well as for their CH4, N2O and F-gas emissions, and greenhouse gas
emissions per capita and per USD of GDP.
11 Group of Twenty: 19 countries and the European Union. The 19 countries are: Argentina, Australia, Brazil,
Canada, China, France, Germany, India, Indonesia, Italy, Japan, Republic of Korea, Mexico, the Russian Federation, Saudi Arabia, South Africa, Turkey, United Kingdom, and the United States.
3 Trends in largest
emitting countries
and the EU-28
In this chapter we discuss the emission trends in the six main emitters, consisting of five large countries, being the United States, China, India, the Russian Federation and Japan, and of the European Union (EU-28) as a region. Between them there are large differences, in the share of the various greenhouse gases, and in the emission intensity of their energy use. Globally, the combined share of CH4, N2O and F-gas emissions is about 28% in total
greenhouse gas emissions (19%, 6%, and 3%, respectively), but it varies for the largest countries, from 12% for Japan to 32% for India. China’s current share is estimated at 19%, that of the United States at 23% and the European Union at 22% and the Russian Federation at 25%.
These shares reflect the relative importance of non-CO2 greenhouse gas emission sources,
such as coal, oil and natural gas production (releasing CH4), agricultural activities, such as
livestock farming (CH4 emissions from ruminants and manure), rice cultivation (wet fields
release CH4 through fermentation processes in the soil), animal manure and fertiliser use on
arable land (N2O), and landfill and wastewater practices (CH4).
Figure 3.1
As discussed in Chapter 2, the greenhouse gas emission trends of the largest countries and regions have continued or resumed to grow in 2017, although in the United States and Japan only by 0.1% and 0.3%. In absolute values, the largest emitters for CO2 and total
India, the Russian Federation, and Japan. For non-CO2 emissions only, India and the
European Union switch rank.
In 2005, after its very rapid rise in CO2 emissions caused by the fast industrialisation that
started in 2002, China surpassed the United States as the world’s largest emitting country. Since 2013, China’s CO2 emissions have been more than twice those of the United States.
Using our estimates, the same occurred in 2016 for total greenhouse gas emissions. However, for a proper perspective in comparisons between countries also the size of a country’s activities should be accounted for. Therefore, the per capita emissions, and the emissions per USD of GDP, and their trends, are presented below, which allows for better comparison of level and trends between countries because it eliminates either population size or size of the economy of a country from the equation. Apart from that, it also provides reference values to assess in what direction emissions will progress if structural changes occur in population or economy of a country (or in the rest-of-world countries as a group).
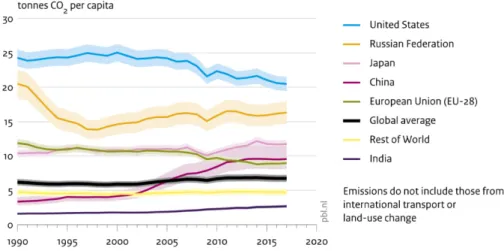
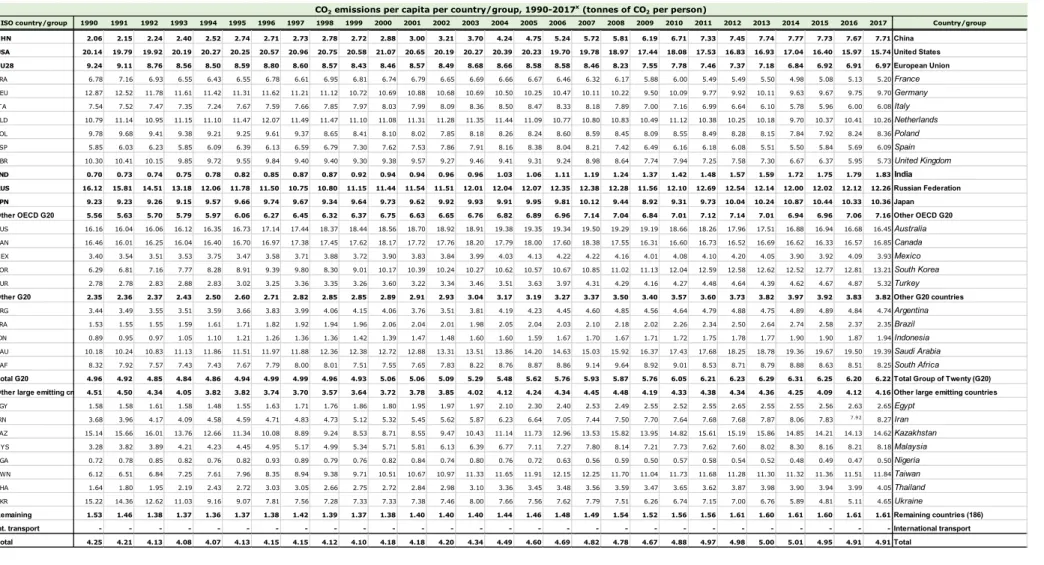
Figure 3.2 shows greenhouse gas emissions per capita for the five main emitting countries, the European Union, the rest of the world, and for the world average. Except for India, all main emitters have per capita emission levels that are significantly higher than those for the rest of the world and the world average. China, in this measure, has rank 4, rather than rank 1, which it has for absolute emissions. Although CO2 emissions in the United States have
been steadily decreasing since 2000, from 25.0 tCO2 eq/cap to about 20.5 tCO2 eq/cap by
2017, it is the highest amount among the top 5 emitting countries, but it is surpassed by three other G20 countries: Canada, Australia and Saudi Arabia. The United States, the Russian Federation, and Japan make up the top 3 greenhouse gas emitting countries, per capita, among the G20 countries.
Figure 3.2
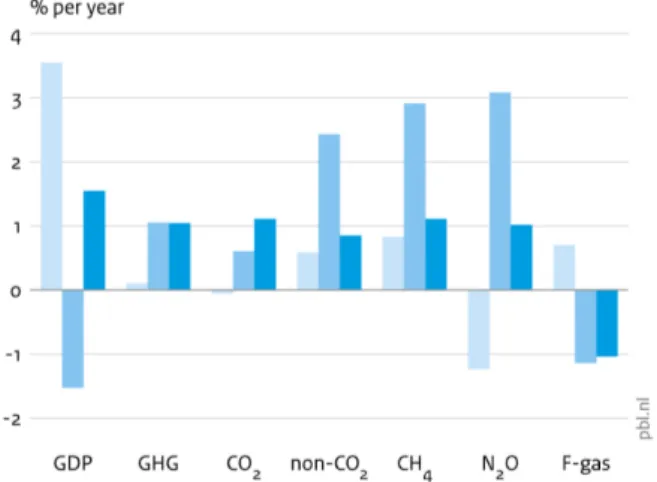
The emissions per USD of GDP (in 2011 prices and corrected for Purchasing Power Parity (PPP)) presented in Figure 3.3, show yet another image. Contrary to the per capita
emissions, the top 5 countries and the European Union are not all above the world average when it comes to emissions per USD of GDP. In the United States, emissions per USD of GDP are virtually equal to the world average, while those in the European Union are the lowest per USD of GDP worldwide, closely follow by Japan. Emissions per USD in China and the Russian Federation are the highest, and significantly higher than the world average. The trend for all countries is downward, including that for the world average, except for the Russian Federation, which emissions per USD remain flat in recent years.
Figure 3.3
Appendix A provides for the top 30 countries/regions more details with 1990–2017 time series of CO2 emissions, totals per country, per capita CO2 emissions and also a similar table
with CO2 emissions per USD of GDP. For the top 30 countries/regions, Appendix B provides
more details with 1990–2017 time series of greenhouse gas emissions, on greenhouse gas totals, CH4, N2O, F-gas and per capita greenhouse gas emissions, as well as per USD of GDP,
for the top 30 countries/regions.
In the remainder of this chapter we analyse the level and trends in emissions for the top-5 emitting countries and the European Union as in Chapter 2 for global total emissions.
3.1 China
Figure 3.4 shows that since 2015 China’s annual growth in GDP was about 3% points less than in the decade before. However, in contrast to the 6% annual increase in total greenhouse gas emissions before 2014, emissions were almost flat since 2014: +0.2%, -0.2% and +1.1% in 2015 to 2017, respectively, reaching a level of 13.5 Gt CO2 eq. This was
due to both CO2 and non-CO2 emissions showing a similar pattern (Figure 3.4). As illustrated
in Figure 3.5, although coal consumption was flat (+0.2%) and cement production declined in 2017 by 2.9% (NBSC, 2018a), the small increase of 0.9% in CO2 emissions is due to
increased oil and natural gas consumption in China of 3.7% and 14.8%, respectively. Electric power production, China’s largest source of CO2 emissions, increased by 5.9% in 2017 to 6.5
GWh. Fossil fuel power plants (95% coal) provided 70% of this total, hydropower 18% and 11% by renewable power and nuclear power (BP, 2018).
Figure 3.4
In 2017 China’s energy use was still very heavily leaning on coal: 58% of total primary energy supply (TPES) was provided by coal, 23% by oil and natural gas, 18% by renewable energy—of which nearly 8% is hydropower and 3% is biomass—and 2% by nuclear power. However, compared with 2010 (seven years ago) the share of coal has been decreased by 10 percentage points and that has been achieved by increasing shares of oil and natural gas and of wind and solar power (both by 4 percentage points). Also, the shares of hydropower and nuclear power increased by 2 and 1 percentage points, respectively (IEA, 2017a; BP, 2018).
This comparison of percentage changes in shares in TPES conceals that the absolute changes look much different: renewable and nuclear power production increased by 134 TWh in 2017 but coal power production increased by 210 TWh (BP, 2018). Similarly, of the increase in power production from 2010 to 2017 of 2300 TWh, 55% was met by fossil-fuel-fired power and 45% by renewable and nuclear power. For the increased electricity production in 2017 it was even 61% vs. 39%. A recent analysis by Coalswarm concluded that 259 Gigawatts (GW) of new coal-fired capacity is presently under development (roughly the same as the total present coal fleet of the United States), which will lead to an increase in the current coal fleet of 25% and an exceedance of the 1100 GW coal cap in China’s present Five-Year Plan
(Shearer et al., 2018b).
The increase in CH4 emissions in 2017 of 2.1% was mainly due to higher domestic
as rice production remained almost constant (IRRI, 2018). With fertilisers use declining but cattle stock increasing in 2017, which are major sources of N2O, also total N2O emissions did
not change much in 2017.
Recent monthly statistics suggest that China’s CO2 emissions are likely to increase more in
2018 than in 2017: in the first three quarters of 2018 coal production increased by 5%, cement by 1% and crude steel by 6%, compared to the first three quarters of 2017. Power production increased by 7.4% in this period. Two thirds of this increase ware produced by thermal power (mainly coal) and the other third mostly by renewable power and nuclear power (NBSC, 2018b).
3.2 United States
In 2017, the US economy grew at the same rate as in the two preceding years. However, its total greenhouse gas emissions remained almost flat in 2017 at 6.6 Gt CO2 eq (+0.1%),
which is different from the decreases in the two years before, but more like that in the preceding decade (almost nil) (Figure 3.6). This is due to the declining trend in CO2
emissions, which have steadily declined since 2005, from 6.0 Gt to 5.1 Gt CO2 in 2017, being
cancelled in 2017 by the large increase in non-CO2 emissions, which have been increasing
over time, in particular CH4 (except for 2015 and 2016) and N2O emissions.
Figure 3.6
CH4 emissions have been steadily increasing too since 2005 but have decreased in 2015 and
2016 due to increasingly downward trends in fossil fuel production, in particular coal
production has plummeted by 15% in 2015–2016 and in 2017 further by 21%. Similarly, the growth in oil and natural gas production was interrupted in 2016 and dropped by respectively 3.9% and 1.5%, however production increased again in 2017 by 5.1% and 0.7% (Figure 3.7). Although CH4 from rice production increased, this is a small source compared to
livestock and fuel production emissions. N2O increases in recent years are related mainly to
agricultural activities such as the use of synthetic and natural nitrogen fertilisers (Figure 3.7).
The 0.8% decline in CO2 emissions in 2017 was mainly due to decreases of 2.5% in coal
consumption and 1.4% in natural gas consumption in 2017, whereas oil consumption increased by 0.7% (BP, 2018) (Figure 3.7). These percentages are very close to those reported by the U.S. Energy Information Administration, when considering that their numbers include fuel used for international transport (bunkers) (EIA, 2018e).
With a share in total CO2 emissions from fossil fuels of almost a quarter, fossil fuel power
production is the United States’ second largest source of CO2 emissions with almost three
quarters from coal plants. In 2017 electricity production declined by 1.5% to 4.3 GWh. Since 2005, the power generation mix has shifted away from coal and towards natural gas and in recent years also to renewable power. However, although in 2017 coal generation fell by 2.5% from 2016, the almost continuous increase in natural gas used for power generation stopped, and natural gas consumption declined by 7.7% (EIA, 2018a).
This will also relate to the 8.6% less Cooling Degree-Days (CDD) than in 2016, indicating less demand for electricity by air conditioning in the summer months than in 2016, which had a record high 1588 CDD since 2010 when the 1400 CDD mark was surpassed, which was then the highest CDD number since 1949 (EIA, 2018d). For the first year in at least a
decade, no new coal-fired generators were added in 2017 (EIA, 2018a). In fact, utilities are expecting to accelerate shutdown dates, leading to a record retirement of coal-fired capacity in 2018 (Feaster, 2018; Shearer et al., 2018a).
Figure 3.7
In 2017 the United States’ energy use was still leaning on oil and natural gas: 36% of total primary energy supply (TPES) was provided by oil, 28% by natural gas, 15% by coal, 12% by renewable energy—of which 3% is hydropower and 4% is biomass—and 8% by nuclear power. However, compared with seven years ago the share of coal has been decreased by 7 percentage points and that has been done by increasing shares of natural gas (by 4
percentage points) and of wind plus solar (by 3 percentage points). The shares of hydropower and nuclear power saw no significant changes (IEA, 2017a; BP, 2018).
Apart from the change in CO2 emissions from the power sector, also CO2 emissions in the
transport sector have declined steadily from 2005 to 2013. However, since 2013
consumption of petrol, diesel and jet fuel, and thus sectoral CO2 emissions, started to slowly
In the residential sector the 3831 HDDs in 2017 is the lowest number of so-called Heating
Degree-Days (HDD) since 1949, which indicates that the winter months of 2017 were even a
bit milder than in 2016 that had 3879 HDDs (EIA, 2018c). This also implies that in 2017 the demand for space heating was about one quarter less than in the 1950s to 1970s. Finally, gas flaring emissions of CO2, estimated by NOAA from satellite data of intensities of gas
flares during the night, have increased from 5 Mt CO2 in 2005 before the fracking boom to 23
Mt in 2015, after which they decreased to 18 Mt CO2 in 2017 (World Bank, 2018b; Elvidge et
al., 2018).
The CDD time series shows that the 10 hottest summers since 1949 all are all-in the last two decades (i.e. after 1997) (EIA, 2018d). Conversely, of the 10 mildest summers since 1949, all but two are in the first two decades (i.e. before 1969), with one in 1974 and the other in 1976. The HDD time series from 1949 onward shows that, of the 10 coldest winters since 1949, all are before 1980. And, conversely, of the 10 mildest winters since 1949 all but one are in the last two decades (i.e. after 1997), except the one in 1990. These trends in highest and lowest HDDs and CDDs corroborate the observation by NOAA that the 10 globally warmest years on record are all in this century (NOAA, 2018).
In last years report, we wrote that, due to large uncertainties in estimating fugitive CH4
emissions from the oil and natural gas sector, the United States made several recalculations of these sources as part of their emission inventory improvement programme (Appendix D in Olivier et al., 2017). According to Lyon (2018), the US EPA has not made any significant revisions in its latest report submitted to the UN Climate Secretariat (US EPA, 2018).
In recent years, various measurement studies were made of methane emissions from oil and natural gas operations that indicate that the US national inventory misses substantial
amounts of CH4 emissions from abnormal process conditions, or super emitters.
Measurements suggest that the emissions from this sector could be 60% higher because the US EPA’s bottom-up method does not account for facility-level high-emitting malfunctioning equipment and 2% of total facilities emit half of the total emissions (Alvarez et al., 2018; Guglielmi, 2018; Zavaka-Araiza et al., 2015; Byron, 2018). These findings may also be applicable to other countries that use similar methods as the US EPA does. Recently, the US
National Academy of Sciences, Engineering, and Medicine released a comprehensive report
on anthropogenic methane emissions in the United States, with specific recommendations for EPA collaboration to improve the accuracy of emission estimates for oil and natural gas and other methane sources, such as expanded efforts to measure emissions with top-down approaches and comparison with EPA’s bottom-up methods (NAS, 2018).
Recent monthly fuel statistics for 2018 available for the first 7 months show that coal
consumption was down 4.5%, oil products up 0.7% and natural gas up 1.2%, compared with the same months in 2017 (EIA, 2018f). However, the last part of the year can significantly modify this, depending on the weather in the last four months from September to December (influencing the fuel demand for space heating, thereby also affecting the demand for coal and natural gas power). When fossil fuel consumption would change likewise in the total year then the US CO2 emissions would continue to decrease slowly in 2018.
3.3 European Union
The average annual growth rate of the EU economy was 1.1% in the decade starting in 2004. Due to the Eurozone debt crisis in the years from 2008 to 2013 the average annual GDP growth rate of the European Union was nil (0.0%). Since 2014, however, the EU’s GDP growth recovered and increased from 2.2% in 2015–2016 to 2.6% in 2017 (World Bank, 2018). In contrast to increasing GDP in the decade starting in the ‘peak year’ 2004, when greenhouse gas emissions were at their most recent highest level, the EU’s total greenhouse gas emissions declined by 1.7%, on average, from 5.3 Gt CO2 eq in 2004 to 4.5 Gt CO2 eq in
2014. Thereafter, total greenhouse gas emissions started to increase again, by 1.1% and 0.1% in 2015 and 2016 and by 1.1% in 2017 reaching 4.6 Gt CO2 eq (Figure 3.8).
The increase of 1.1% is larger than the previously estimated 0.6% reported by the European Environment Agency (EEA), which is based on greenhouse gas emissions in 2016 reported by the Member States and on proxy estimates submitted by the Member States (EEA, 2018). The percentage difference in the 2017 trend will be due to differences in the data sources and emission factors used to compile the 2016 inventory. As a result, totals and shares of emissions of the individual greenhouse gases in the total greenhouse gas emissions in 2016 will be different in the two inventories, in particular for non-CO2 gases. Also, for the 2017
estimate, countries used national statistics, whereas the EDGAR fast-track estimates rely on international statistics, which will certainly be different due to the somewhat preliminary status of these early statistics. As a result, estimated trends will be different. Since the EEA report does not provide EU totals per greenhouse gas, a more detailed comparison cannot easily be made.
Figure 3.8
The trend in total greenhouse gas emissions is mainly set by the trend in CO2 emissions,
which have similarly declined by 1.7% per year since 2004 from 4.3 Gt to 3.5 Gt CO2 in
2014; they have increased in the following years by the same percentages as total greenhouse gas emissions. In contrast, non-CO2 emissions saw in the decade starting in
2004 only very small declines of 0.4% on average, while the growth observed in the last three years is almost equal to that of CO2 and total greenhouse gas. The decreasing CH4
emissions in the last three years are more than offset by increasing N2O and F-gas emissions
(Figure 3.8). The decreasing methane emissions are mainly due to declining fossil fuel production over more than a decade, in particular coal and natural gas as shown in Figure 3.9.
The 1.1% increase in CO2 emissions of the European Union in 2017 was mainly due to
increases of 4.0% in natural gas consumption and also 1.6% in oil consumption in 2017, partly offset by coal consumption in the EU that declined by 2.2% (BP, 2018) (Figure 3.7). This increase is smaller than the early estimate of 1.8% increase reported by Eurostat based on monthly statistics of fossil fuel consumption per Member State of solids, peat, natural gas and liquids (Eurostat, 2018a). EU countries that have the largest contribution to the total greenhouse natural gas increase in the EU are Germany, Italy, Spain, the Netherlands and Romania. The countries with the largest contribution to the total EU coal use in 2017 are Germany, the United Kingdom, Italy, the Netherlands and Poland (BP, 2018). From this it appears that in Germany, Italy and the Netherlands there is a shift from coal to natural gas.
Figure 3.9
The demand for space heating in 2017 was almost equal to that in 2016, as indicated by the number of so-called Heating Degree-Days (3032 and 3025 HDD). These numbers indicate that the winter months of 2016 and 2017 are among the 10 mildest since 1974 (Eurostat, 2018b). Of these 10 mildest winters, 7 occurred in the last decade, 1 in 2000, another in 1994 and the last in 1989. It also implies that, in 2017, the demand for space heating was
![Table A.3 CO 2 emissions per USD of GDP, per country and group, 1990–2017 14 (unit: kg CO 2 per 1,000 USD of GDP [PPP, 2011 prices])](https://thumb-eu.123doks.com/thumbv2/5doknet/3227910.19503/40.1262.116.1175.152.740/table-emissions-usd-gdp-country-group-unit-prices.webp)