Report nr235802.QQ2 page 1 of 38
NATIONAL INSTITUTE OF PUBLIC HEALTH AND THE ENVIRONMENT BILTHOVEN, THE NETHERLANDS
Report nr. 235802.002
Safety evaluation of nitrate: Mathematical modeling of nitrite formation in man and its application in the risk assessment of nitrate M.J. Zeilmaker, J. Meulenbell, J.M. Kortboyer, W. Slob
July 1996
This study has been performed on the authority and for the account of the Inspectorate for Health Protection and the Directorate for Food and Product Safety in the Netherlands within the framework of project number 235802.
National Institute of Public Health and the Environment, P.O. Box 1, 3720 BA Bilthoven, The Netherlands, telephone +31(0)30 274911, telefax +31(0)30 2742971
Report nr235S02,0n2 page 2 of 38
MAILING LIST
I -5 Hoofdinspecteur Gezondheidsbescherming
6 Directie Gezondheidsbeleid, Afdeling Voeding en Veterinair Beleid 7 Directeur-Generaal Volksgezondheid
8 Dr. H. Roelfzema, VWS, VVP 9 Dr. Ir. P.C. Bragt, VWS, IGB
10 T. Staarink, VWS, IGB II Dr. Ir. G. Kleter, VWS, IGB
12 Dr. P. Doucet, Vakgroep Theoretische Biologie, VU Amsterdam 13 Dr. B. Blaauboer, RITOX, Rijksuniversiteit Utrecht
14 Depot Nederlandse Publicaties en Nederlandse Bibliografie 15 Dr. Ir. G. de Mik, Directeur Sector 4
16 Dr. A. Opperhuizen, Hoofd LEO 17 Dr. Ir. H. J.G.M. Derks, Hoofd LBO 18 Dr. W.H. Könemann, Hoofd ACT 19 Drs. A.G.A.C. Knaap, ACT
20 J.E.M, van Koten-Vermeulen, ACT 21 Dr. M.P. van Veen, LBO
22 Drs. M. Oiling, LBO
23 Drs. J.C.H, van Eijkeren, LBO 24 Dr. G.J.A. Speijers, ACT 25 Dr. A.B.T.J. Boink, LEO 26 Dr. W. Vleeming, LEO 27-30 Auteurs
31 SBDA^oorlichting en Public Relations 32 Bureau Rapportenregistratie
33-34 Bibliotheek RIVM 35-55 Bureau Rapportenbeheer 56-65 Reserve exemplaren
Report nr 235802.002 page 3 of 38 CONTENTS page Mailing list 2 Summary- 4 Samenvatting 5 1. Introduction 6 2. Concept of the model 7
3. Model calibration 10 3.1 The Wagner study — 10
3.2 The Spiegelhalder study 12 3.3 The Kortboyer study 15 3.4 The Shapiro study 16 4. Model application 20 4.1 Quantifying human nitrite exposure 20
4.2 Simulating the amount of nitrite and methemoglobin in blood 22
4.3 Studying nitrosamine formation 22
5. Concluding remarks 24
References 25 Appendices 28
1. Mathematical model for the kinetics of nitrate and nitrite in man 28
Report nr 235802.002 page 4 of 38
SUMMARY
The current risk assessment of the human exposure to nitrate is based on the evaluation of nitrate toxicity in the rat. This procedure, however, needs reconsideration. For, in man nitrite is formed by bacterial fermentation of nitrate secreted from blood into saliva. This process is absent in the rat (Tannenbaum, 1979; Til et al., 1988). As nitrite is more toxic than nitrate, the formation of nitrite may easily lead to dominance of nitrite toxicity over nitrate toxicity in man, a nitrate => nitrite conversion in the order of 2% already leading to this effect. The formation of nitrite out of ingested nitrate therefore should be incorporated in the risk assessment of human nitrate exposure.
The formation of nitrite in man consists of a complicated mechanism involving the uptake of nitrate from food and/or drinking water, the capacity of man to endogenously synthesize nitrate, the secretion of nitrate from blood to saliva, the metabolism of nitrate to nitrite by bacteria present in saliva and the reconversion of nitrite to nitrate in blood. These processes were incorporated in a human toxicokinetic model for nitrate and nitrite. Data on the toxicokinetics of nitrate and nitrite in human volunteers were used to calibrate the model (Wagner et al., 1983; Spiegelhalder et al., 1976; Shapiro et al., 1991; Kortboyer et al., 1995). The model calculated that the average adult synthesizes 121 mg nitrate per day. The model fiirthermore calculated that 32-60% of orally administered nitrate is secreted from blood to saliva and that 13-22% of the salivary nitrate is metabolized to nitrite. The nitrate => nitrite conversion in man was determined at 7-9%. The model was also used to estimate the formation of nitrite in the average adult after single and repeated (one dose every 24 hr) nitrate exposure at the level of its Acceptable Daily Intake (ADI, 3.65 mg nitrate /kg/day). This calculation resulted in a human nitrite exposure of 0.27-0.36 mg/kg/day. This exposure, which significantly exceeds the ADI for nitrite (0.06 mg nitrite/kg/day), was estimated to originate for 31-41% from endogenously synthesized nitrate.
The values of the calculated nitrite exposure have to be interpreted sensibly, i.e. within the framework of the assumptions underlying the model. In calculating the human nitrite exposure the effects of the intake of food (stimulation of salivary nitrite formation vs.
detrimental effects on nitrite in the stomach) are not incorporated. Furthermore, in calculating the human nitrite exposure a bioavailibility of 100% is assumed for the administered nitrate. It can be concluded that the risk assessment of human nitrate exposure should be based on the toxicological evaluation of the amount of nitrite formed out of ingested nitrate. The
application of the model for the improvement of the human risk assessment of nitrate is discussed.
Report nr 235802002 page 5 of 38
SAMENVATTING
De huidige risicoschatting van de blootstelling van de mens aan nitraat is gebaseerd op de evaluatie van dierexperimenteel onderzoek bij de rat. Deze procedure verdient heroverwe-ging. Bij de mens, maar niet bij de rat, wordt nitraat door bacteriële fermentatie in het speeksel omgezet in nitriet. Aangezien hitriet veel toxischer is dan nitraat kan een relatief geringe nitraat => nitriet omzetting leiden tot dominantie van nitriettoxiciteit over
nitraattoxiciteit. De vorming van nitriet uit nitraat dient derhalve in beschouwing genomen worden bij de risicobeoordeling van de blootstelling van de mens aan nitraat.
D^-vorming van nitriet uit nitraat in het speeksel van de mens is het resultaat van een ge-compliceerd proces. De volgende factoren spelen hierbij een rol: de opname van nitraat uit voedsel of drinkwater, het vermogen van de mens om zelf nitraat aan te maken, de secretie van nitraat uit het bloed naar het speeksel, het metabolisme van nitraat tot nitriet in het speeksel en de terugvorming van nitraat uit nitriet in het bloed. Om de nitrietbelasting van de mens na blootstelling aan nitraat te evalueren zijn deze processen opgenomen in een humaan toxicokinetisch model voor nitraat en nitriet. Dit model is m.b.v. experimenteel onderzoek met humane vrijwilligers (Spiegelhalder et al., 1976; Wagner et al., 1983; Shapiro et al.,
1991; Kortboyer et al., 1995) gekalibreerd.
Het model berekende dat de endogene vorming van nitraat in volwassenen gemiddeld 121 mg per dag bedraagt. Tevens berekende het model dat 32-60% van oraal opgenomen nitraat vanuit het bloed in speeksel wordt uitgescheiden. Van deze hoeveelheid wordt 13-22% omgezet in nitriet. De berekende nitraat => nitriet conversiefactor zou 7-9% bedragen. De door het model berekende dagelijkse nitriet belasting na éénmalige of herhaalde (één dosis per 24 uur) blootstelling van de mens aan nitraat op het niveau van zijn Acceptable Daily Intake (ADI, 3.65 mg nitraat/kg/dag) bedroeg 0.27-0.36 mg/kg/dag. Deze blootstelling, die aanzienlijk hoger is dan de huidige ADI voor nitriet (0.06 mg nitriet/kg/dag), werd volgens de berekening voor 31-41% veroorzaakt door de endogene synthese van nitraat.
Bij de interpretatie van de door het model berekende nitriet blootstelling moet bedacht worden dat hierbij geen rekening gehouden is met de effecten van voedselirmame op de vorming van nitriet (verhoging van het metabolisme van nitraat to nitriet in het speeksel vs. verlaging van de stabiliteit van nitriet in de maag). Verder veronderstelt het model een biobeschikbaarheid van 100% voor de opname van nitraat uit voedsel en drinkwater.
Geconcludeerd kan worden dat de risicoschatting van de blootstelling van de mens aan nitraat gebaseerd moet worden op de hierop volgende nitrietbelasting en nitriettoxiciteit. Een
methode om de risicoschatting van nitraat m.b.v. het toxicokinetische model te verbeteren wordt besproken.
Report nr 235802.002 page 6 of 38
1. INTRODUCTION
The current Acceptable Daily Intake (ADI) for nitrate is based on the extrapolation of nitrate toxicity from rats to man and is calculated by dividing the No Observed Adverse Effect Level (NOAEL) for nitrate toxicity in rats by an uncertainty factor of 100. Several observations, however, necessitate a re-evaluation of this procedure. In man nitrite is formed by bacterial fermentation of nitrate secreted from blood into the saliva, a process apparently absent in the rat (Taimenbaum, 1979; Til et al., 1988). As nitrite is more toxic than nitrate, this nitrite formation may become of significant toxicological importance: aN03' => NO2' conversion in the order of 2 % already leads to dominance of nitrite toxicity over nitrate toxicity (0.02 times the ADI of nitrate of 3.65 mg/kg results in a nitrite exposure in the order of the ADI of nitrite,
i.e. 0.06 mg/kg; JECFA, 1995; EU-SCF, 1995). Nitrite formation in man and its alleged absence in the rat thus invalidates rat experiments with nitrate as the starting point for the risk assessment of nitrate. The risk assessment of human nitrate exposure therefore should not only take nitrate toxicity into account but also the toxic risk posed by nitrite formation out of ingested nitrate. Furthermore, in the risk assessment of nitrate only exogenous nitrate
exposure (amount of administered nitrate) is taken into account. However, in man nitrate is also endogenously formed. This formation should also be incorporated into the risk
assessment of nitrate.
The formation of nitrite in humans exposed to nitrate is a complex process involving the" absorption of nitrate from food and/or drinking water, the secretion of nitrate from blood to saliva, the bacterial metabolism of nitrate to nitrite in saliva, the uptake of nitrite in blood and the reconversion of nitrite in blood to nitrate. Quantitative knowledge of these processes and the way they influence each other is necessary for the evaluation of the toxic risk associated with the formation of nitrite out of ingested nitrate. To obtain this knowledge we developed a human toxicokinetic model for nitrate and nitrite. This model was calibrated to several studies on the kinetics of nitrate and nitrite in humans. After its calibration the model was used for the calculation of the nitite exposure in humans exposed to nitrate. The application of the model for the improvement of the risk assessment of nitrate is discussed.
Report nr 235802 002 page 7 of 38
2. CONCEPT OF THE MODEL
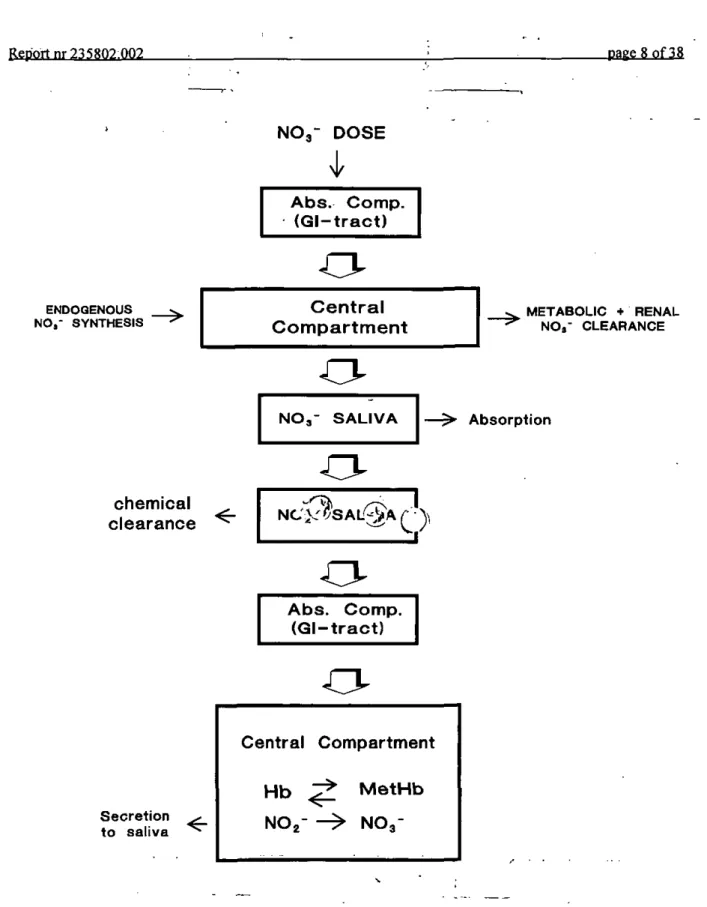
The nitrate/nitrite model (see Fig. la) describes the toxicokinetics of nitrate in the body, the formation of nitrite out of nitrate in saliva and the toxicokinetics of the formed nitrite. In the model nitrate enters the absorption compartment (stomach and lower parts of the gastro-intestinal tract) by oral intake of drinking water or food and by swallowing of salivary nitrate (see below). From the absorption compartment nitrate is taken up into the central
compartment. For this process a bioavailibility of 100% is assumed. In addition to uptake from the absorption compartment, nitrate enters the central compartment by endogenous nitrate synthesis and by conversion of nitrite in blood to nitrate (see below). Removal of nitrate from the central compartment occurs by metabolic and renal clearance and by
secretion of nitrate from blood into saliva (Spiegelhalder et al., 1976; Bartholomew and Hill, 1984; Wagner et al., 1983; Shapiro et al., 1991)rMetabolic clearance includes all mammalian processes reducing nitrate to ammonium, urea and even molecular nitrogen (Wagner et al.,
1983; Schultz et al., 1985). In the saliva nitrate is reduced to nitrite by bacteria (Taimenbaum et al., 1976; Shapiro et al., 1991). Nitrite formed in this process, as well as non-metabolized salivary nitrate, are swallowed and enter the absorption compartment. Under acid conditions nitrite may chemically decay in this compartment or be absorbed into the central compart-ment (blood).
In blood nitrite interacts with hemoglobin monomers (Kosakaetal., 1979, 1981; Spagnuolo et al., 1987). This reaction yields (in hemolysates) a one to one conversion of nitrite to nitrate and hemoglobin to methemoglobin (Kosaka et al., 1979). In our model this reaction was incorporated as a one-way reaction between nitrite and hemoglobin, or:
ks
Hb'' + ^ Hb'^ +
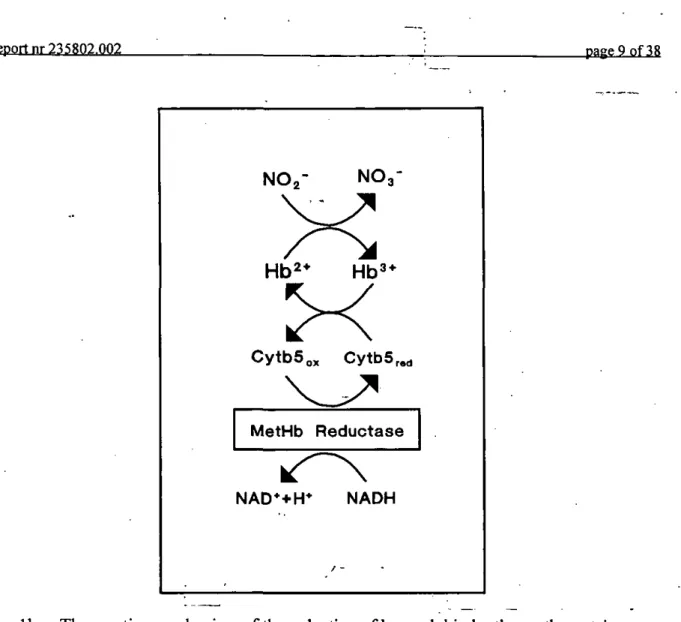
NO-The methemoglobin formed in this reaction is reconverted to hemoglobin by a series of oxydation/reduction reactions involving cytochrome b5, methemoglobin reductase and reduced nicotinamide adenine dinucleotide (NADH) (Abe et al., 1979; Hultquist et al., 1984). In the erythrocyte the reformation of hemoglobin from methemoglobin starts with the reduction of methemoglobin by (reduced) cytochrome bs, yielding hemoglobin and oxydized cytochrome b5 (see Fig lb). In a following reaction cytochrome h^ is, at the expense of NADH, reduced by the methemoglobin reductase enzyme. The model assumes that erythro-cytes effectively maintain their cytochrome h^ in its reduced state. This assumption simplifies the reduction of methemoglobin to hemoglobin depicted in Fig lb to a reaction mechanism displaying apparent first-order reaction kinetics (see Appendix 1), or:
Reiiortnr 235802:002 page 8 of38 ENDOGENOUS N O j - SYNTHESIS chemical clearance Secretion to saliva < -N O r DOSE ^ A b s . C o m p . ( G l - t r a c t )
O-C e n t r a l C o m p a r t m e n t O-N O 3 - S A L I V ACU
NC'>r?s A L ^ A r- \ ^ > A b s . C o m p . ( G l - t r a c t )43
M E T A B O L I C * RENAL NO»- CLEARANCE Absorption Central Hb NOg-Compartment < -• ^ M e t H b N O 3-Fig. la The structure of the human toxicokinetic model for nitrate and nitrite. Hb: hemoglobin; MetHb: methemoglobin
r
Report nr 2^5802.002 page 9 of38
N O g -
NO3-X
X
C y t b 5 „ CytbS r«d MetHb Reductase NAD*+H* NADHFig. lb The reaction mechanism of the reduction of hemoglobin by the erythrocyte's methemoglobin reductase. Hb : hemoglobin; Hb : methemoglobin; CytbS: cytochrome b5
Report nr 235802.002 page 10 of 38
3. MODEL CALIBRATION
The model described in section 2 contains 17 parameters (see Appendix 2). These parameters have to be supplied with reasonable values. Nine of these parameter values were obtained from the literature (see Appendix 2). Three parameter values (absorption rate constant for nitrite; the volume of the saliva compartment and the volume of distribution of nitrite) were obtained by making assumptions on their value (see Appendix 2). Five parameter values (absorption rate constant for nitrate; the elimination rate constant for nitrate; the secretion rate constant for nitrate from blood to saliva and the rate constant for salivary nitrate => nitrite conversion) were obtained by model calibration, i.e. by fitting the model to a specific experi-mental data set (see Appendix 2). For the calibration of the model we selected the following studies on the kinetics of nitrate and nitrite in man.
3.1 The Wagner study
The study performed by Wagner et al. (1983) was selected because of its properties to quantify the endogenous synthesis of nitrate in man and, hence, its contribution to the daily human exposure to nitrite. In the Wagner study human volunteers (N=12) were maintained on a low nitrate diet for 5 days (« 9 mg '"^-nitrate per day). After this period a single oral dose of '^N-nitrate was administered in drinking water. The applied dose of 220 mg (« 3.1 mg/kg) almost equals the current ADI for nitrate. Up to 48 hours after the administration of nitrate the nitrate concentration in plasma and saliva, the nitrite concentration in saliva and the excretion of nitrate in the urine were measured. Fig. 2 shows the simulation of the calibrated model of the experimental results of the Wagner study. In this simulation the model
calculated an endogenous nitrate synthesis of 121 mg per day for the average adult.
Nitrate is removed from the body by metabolism and renal clearance (see Chapter 2). As a result of the latter process nitrate is excreted in the urine. In the toxicokinetic model the renal clearance of nitrate is defined as a fraction of the total elimination of nitrate from the body. When the parameter characterizing the urinary excretion of nitrate was calibrated to the Wagner study the model described the excretion patterns of endogenously formed '"^N-nitrate and exogenously administered N-nitrate (see Fig. 3) quite well.
Report nr235S02 002 page 11 of 38 O
o
2
o
2
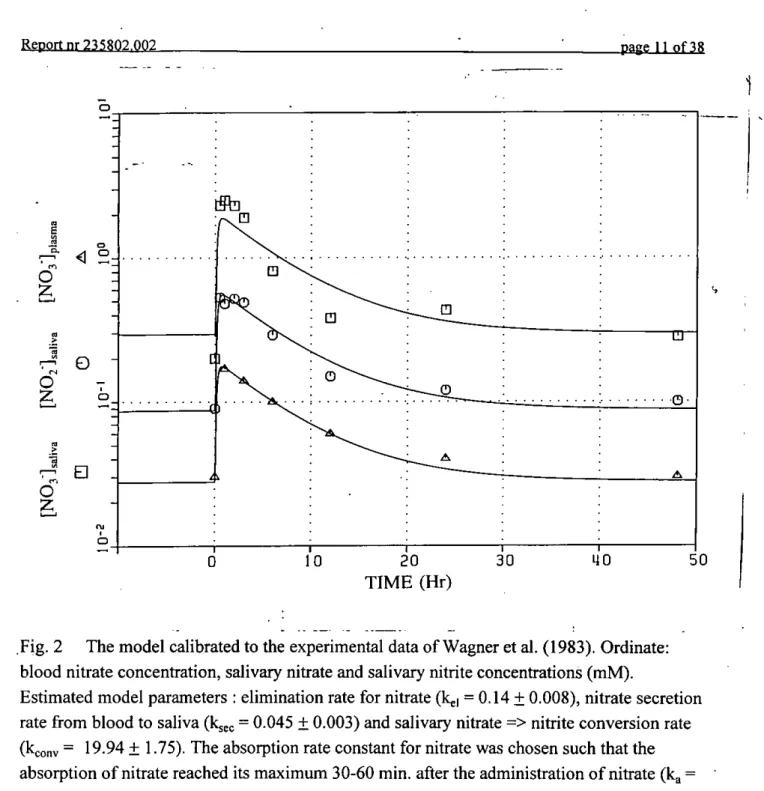
10 20 30 TIME (Hr)Fig. 2 The model calibrated to the experimental data of Wagner et al. (1983). Ordinate: blood nitrate concentration, salivary nitrate and salivary nitrite concentrations (mM).
Estimated model parameters : elimination rate for nitrate (k^j = 0.14 ± 0.008), nitrate secretion rate from blood to saliva (kjec = 0.045 ± 0.003) and salivary nitrate => nitrite conversion rate (kconv = 19.94 ± 1.75). The absorption rate constant for nitrate was chosen such that the absorption of nitrate reached its maximum 30-60 min. after the administration of nitrate (k^ = 5.35 ±1.73).
Report nr235R02 002 page 12 of 38
TIME (Hr)
Fig. 3 The model calibrated to the urinary excretion data of Wagner et al. (1983). Ordinate: Amount of nitrate cumulatively excreted in the urine (exogenous N-nitrate and endogenous
iV-nitrate). Estimated model parameter: renal clearance as fraction of total nitrate clearance (0.56 ± 0.029). Other calibrated model parameters were as described in Fig. 2.
3.2 The Spiegelhalder study
In the study performed by Spiegelhalder. et al. (1976) volunteers (N=l 1) were exposed to varying amounts of nitrate (50-550 mg) in vegetable juice (« 200-300 ml) or in spinach {^ 270 g). Up to 7 hr after the administration of nitrate saliva samples were collected at different
Report nr 235802.002 page 13 of 38
nitrite formed were calculated by multiplying the mean increase' of the concentrations of nitrate and nitrite in saliva with the amount of saliva produced during the time-interval. The latter parameter was calculated as the product of the time-interval and the (assumed) saliva flow (50 ml/hr). As shown in Fig. 4, the model calibrated on the Wagner study (with only changing the salivary flow-rate from 69 to 50 ml/hr) described the Spiegelhalder data (amount of nitrate secreted to saliva and amount of nitrite formed in the saliva) fairly well. The model however overestimated the blood => saliva secretion of nitrate and the nitrite formation in the saliva in the low-dose range. Regarding the nitrate data Spiegelhalder concluded that the blood-to-saliva secretion of nitrate showed a threshold dose of around 50 mg. However, for transport processes, whether of active or passive nature, the existence of a threshold mechanism is unlikely. For this reason we did not incorporate a threshold for the secretion of nitrate from blood to saliva in our model. The model therefore predicts salivary nitrate secretion even at zero dose, reflecting the transport of endogenously formed nitrate from blood into saliva. In Spiegelhalder's study such secretion was not found. This phenome-non was however observed in other experimental studies on human nitrate kinetics (Wagner etal., 1983; Shapiro etal., I99I; Kortboyer etal., 1995). Regarding the formation of nitrite in saliva Spiegelhalder's data might suggest the existence of a threshold for this formation. However, as nitrite formation in saliva occurs by bacterial metabolism of nitrate, a process without threshold characteristics, the existence of a threshold for nitrite formation in saliva is held unlikely. An alternative explanation for the existence of a threshold for the formation of nitrite in saliva might be that nitrite in saliva reacts with components present in saliva. When the mechanism of such a reaction shows threshold characteristics, i.e. when saliva
components effectivily take away all nitrite formed in saliva below a certain threshold, an (apparent) threshold for the formation of nitritite in saliva may experimentally be observed. The incorporation of such a reaction mechanism into our model would, especially at low nitrate exposure levels, lead to a decrease of the calculated human nitrite exposure. We however consider the existence of such a reaction as hypothetical. For the time being we therefore did not incorporate such a reaction mechanism into our model.
mean increase calculated as the mean concentration of nitrate and nitrite between two time-points minus the concentration of these compounds In saliva in the period before nitrate intake
Report nr 235809 007 page 14 of 38 O) S CO 75 (0 4) u Ü 07 m O
z
2 0 0 100UJ
^
^
'rfi^^n ^
D " • - ^ •n ^ ^
a
D D 300 600orally ingested NOg" (mg)
Fig. 4a The cumulative amount of nitrate secreted in the saliva 7 hr after a single dose of various amounts (50-500 mg) of nitrate in drinking water or food. Symbols: measured values, Spiegelhalder et al., 1976. Line: Model calculation. Model parameters were as described in Fig. 2.
3
E •DJ <U Ü , 3 | T3t O 1 . Q-1 'o
z
ou 2b 0 • ^ ^ „ . , - . - 'b ^ ^
^ ^ ^ „ . . ^' T A
^4
A _^ - " " " ^ • -A . > ^ • •^^_A-^
A ^___^ - - " " ' ' ' ^ • 300600
orally NOg" ingested (mg)
J
Fig. 4b The cumulative amount of nitrite formed in the saliva 7 hr after a single dose of various amounts (50-500 mg) of nitrate in drinking water or food. Symbols: measured values, Spiegelhalder et al., 1976. Line: Model calculation. Model parameters were as described in Fig. 2.
Report nr 235802,002 page 15 of38
3.3 The Kortboyer study
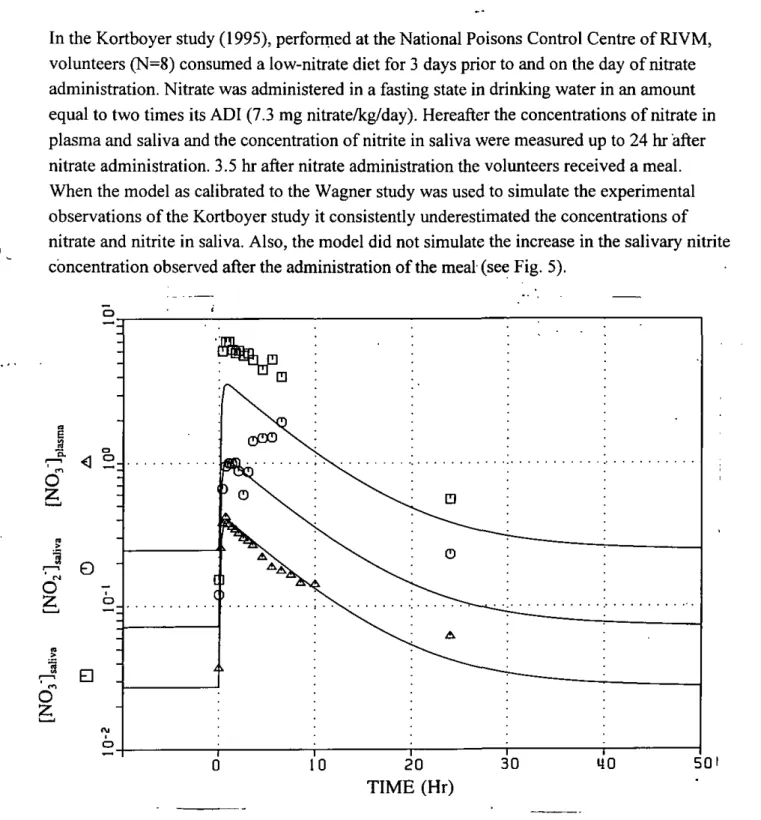
In the Kortboyer study (1995), performed at the National Poisons Control Centre of RIVM, volunteers (N=8) consumed a low-nitrate diet for 3 days prior to and on the day of nitrate administration. Nitrate was administered in a fasting state in drinking water in an amount equal to two times its ADI (7.3 mg nitrate/kg/day). Hereafter the concentrations of nitrate in plasma and saliva and the concentration of nitrite in saliva were measured up to 24 hr after nitrate administration. 3.5 hr after nitrate administration the volunteers received a meal. When the model as calibrated to the Wagner study was used to simulate the experimental observations of the Kortboyer study it consistently underestimated the concentrations of nitrate and nitrite in saliva. Also, the model did not simulate the increase in the salivary nitrite concentration observed after the administration of the meal (see Fig. 5).
TIME (Hr)
Fig. 5 The model validated on the experimental data of Kortboyer et al. (1995) Symbols: measured values (mM), Kortboyer et al., 1995. Line: Model calculation. Model parameters were as described in Fig. 2.
Report nr 235802 002 page 16 of 38
The reason for the model's inaccuracy to simulate the observations of the Kortboyer study is two-fold. First, a rather large (and unexplained) inter-study difference of salivary nitrate secretion after the uptake of nitrate from drinking water exist between the Wagner study (relatively slow nitrate secretion and decline of salivary nitrate) and the Kortboyer study (relatively fast nitrate secretion and decline of salivary nitrate). Given this rather large inter-study difference in salivary nitrate secretion it is not surprising that the model does not describe the experimental findings of both studies equally well with one fixed set of model parameter values. The inter-study difference was further examined by recalibrating the model to the Kortboyer study. In this recalibration the model parameters characterizing the processes of the secretion of nitrate from blood to saliva and the salivary metabolism of nitrate to nitrite (kggc, ^conv) were varied. As shown in Fig. 6 the recalibration of these parameters led to a considerable improvement of the description of the experimental findings found in the Kortboyer study. Up to the administration of themeal (3.5 hr) the recalibrated model gave a good description of the formation of nitrite in saliva.
The increase in the salivary nitrite concentration after the administration of the meal we hypothesize on as follows. The meal consisted of bread, cheese and milk. The latter food item provides lactose, an excellent substrate for bacterial growth. Lactose remaining in saliva after the consumption of the meal may lead to an increase of the number of nitrate reducing
bacteria in the mouth. As a result more nitrite will be formed in the saliva. The incorporation in the model of inducible bacterial metabolism of nitrate in the saliva led to a better
description of the formation of nitrite in the saliva. For the Kortboyer study a two- to three-fold increase in the capacity to form nitrite out of nitrate in the mouth was found sufficient to simulate the increased nitrite formation after the administration of the meal (see Fig. 6).
3.4 The Shapiro study
In the study reported by Shapiro et al. (1991) volunteers (N=16) consumed a low-nitrate diet for two days. After this period a nitrate dose of 5.24 mmol (« 325 mg) in 10 ml of distilled water, followed by 100 ml distilled water was consumed in a non-fasting state. Saliva was collected at 30, 60, 90 and 120 minutes after administration and salivary nitrate and nitrite concentrations were measured. During this period no food was consumed.
As with the Kortboyer study the model calibrated to the Wagner study systematically
underestimated the concentrations of nitrate and nitrite in the Shapiro study (data not shown). Again the recalibration of the parameters characterizing the secretion of nitrate from blood to saliva (kjec) ^^^ ^^e conversion of nitrate to nitrite in saliva (kconv) ^^^ to a model describing the data of the Shapiro study quite well (see Fig. 7).
Report nr 235802.002 page 17 of38 o ^ < O O
o
O D 5 10 TIME (Hr) 15 20 25Fig. 6a The model recalibrated to the experimental data of Kortboyer et al. (1995) Ordinate: blood nitrate concentration, salivary nitrate and nitrite concentrations (mM).
Estimated model parameters: nitrate secretion rate from blood to saliva (k^^^ = 0.076 ± 0.004) and salivary nitrate => nitrite conversion rate (k^onv = lOM ± 0.95). Other model
Report nr 235802.002 page 18 of 38
e? •
c \ j -r \ j oo 3 * O (_) [ 1•
1^
] \ ]•
•
\V
- . 5 10 TIME (Hr) 15 20 25Fig. 6b The model extended with inducible metabolism of nitrate in the mouth and recalibrated to the data of Kortboyer et al. (1995). Ordinate: salivary nitrite concentration (mM). Estimated model parameters: nitrate secretion rate from blood to saliva (kgec = 0.079 ± 0.004), the salivary nitrate => nitrite conversion rate (k^onv = 9.85 ± 0.92) and its food
Report nr 235802002 page 19 of38
TIME (Hr)
Fig. 7 The model recalibrated to the experimental data of Shapiro et al. (1991). Ordinate: salivary nitrate and salivary nitrite concentrations (mM). Estimated model parameters: nitrate secretion rate from blood to saliva {k^^^ = 0.084 ± 0.006) and salivary nitrate => nitrite conversion rate (k^onv = 13.08 ± 1.11). Other model parameters were as described in Fig. 2.
Report nr 235802002 page 20 of 38
4. MODEL APPLICATION
4.1 Quantifying human nitrite exposure
The model was used for the calculation of the percentage of an oral dose of nitrate that is secreted from blood to saliva, the percentage of nitrate in saliva that is metabolized to nitrite, the nitrate => nitrite conversion factor and the amount of nitrite cumulatively formed in saliva. In these calculations we made allowance for the variation in the model parameters cha-racterizing the human kinetics of nitrate and nitrite in saliva (see Chapter 3, kgec: 0.045-0.084; kconv- 10.7-19.9). The model calculated that 32-60% of orally administered nitrate was
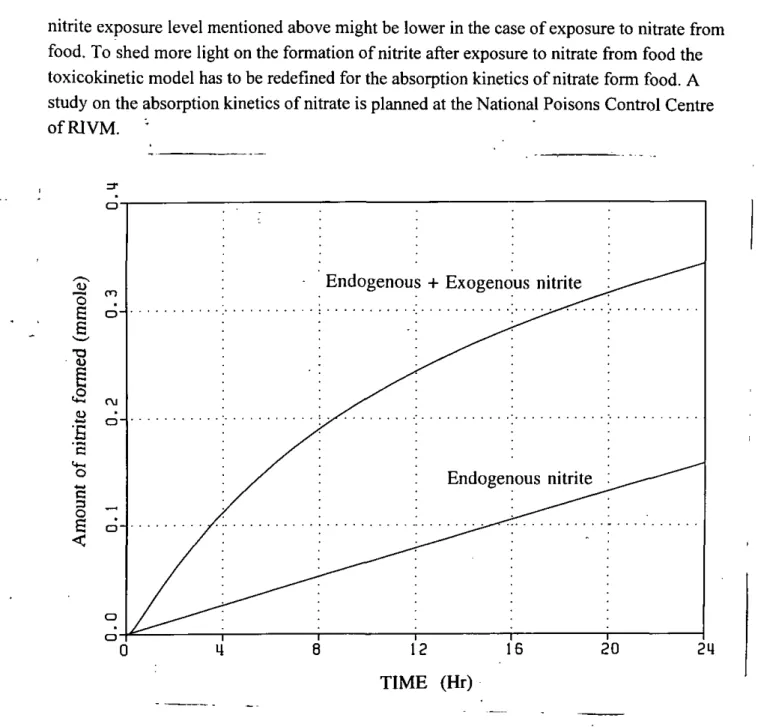
secreted from blood to saliva and that 13-22% of the salivary nitrate was converted to nitrite. A nitrate => nitrite conversion factor of 7-9% was calculated for an oral nitrate dose. The time-course of the formation of nitrite in the saliva as calculated by the model calibrated to the Wagner study is shown in Fig. 8. For this study the model calculated that the amount of nitrite cumulatively formed in saliva, 24 hr after the administration of nitrate, amounted to 0.34-0.39 mmole (15.8-18.1 mg). Of this amount 31-41% originated from the bacterial metabolism of endogenously synthesized nitrate.
The model was further used for the calculation of the exposure to nitrite for adults exposed to a single or a repeated (one dose every 24 hr) dose of nitrate at the level of its ADI. Given this variation the model calculated a 24 hr nitrite exposure of 0.27-0.36 mg/kg/day. This exposure level significantly exceeds the current ADI for nitrite (0.06 mg/kg/day).
The value of the calculated nitrite exposure needs to be interpreted sensibly, i.e within the framework of the assumptions underlying the model. In calculating human nitrite exposure the endogenous formation of nitrate is taken into account as a source significantly
contributing to the human nitrite exposure. As the ADI of nitrite is based on the evaluation of toxicity in the rat, a species believed to lack nitrite formation out of nitrate, we consider the incorporation of the endogenous nitrate synthesis in the calculation of human nitrite exposure as justified.
The model assumptions, presented in this report do not, for example, account for the
detrimental effects of food constituents on the stability of nitrite in the gastro-intestinal tract. As it was shown in vitro that food constituents may considerably attribute to the decay of nitrite in the stomach (pH < 5, Mirvish et al., 1975), neglecting this effect may lead to an overestimation of the amount of nitrite to be absorbed. On the other hand food may, as the finding in the Kortboyer study suggested, increase the capacity of salivary bacteria to form nitrite out of nitrate. Neglecting this effect may lead to an underestimation of the human nitrite exposure. For the Korboyer study we calculated that the intake of food shortly after the intake of nitrate might lead to a two-fold increase in the human nitrite exposure. Finally, the model assumes a bioavailability of 100% for the administered nitrate. Hence the calculated
Report nr235S02,00;^ Dage 21 of 38
nitrite exposure level mentioned above might be lower in the case of exposure to nitrate from food. To shed more light on the formation of nitrite after exposure to nitrate from food the toxicokinetic model has to be redefined for the absorption kinetics of nitrate form food. A study on the absorption kinetics of nitrate is planned at the National Poisons Control Centre of RIVM. • E
a
0) o c O S <Fig. 8 The time-course of salivary nitrite formation as calculated by the model calibrated to the Wagner study. Endogenous nitrite: the amount of nitrite formed out of endogenously syn-thesized nitrate; Endogenous + exogenous nitrite: the amount of nitrite formed out of endoge-nously synthesized and exogeendoge-nously administered nitrate. Model parameters were as
Report nr 235802,002 page 22 of 38
4.2 Simulating the amount of nitrite and methemoglobin in blood
In the Dutch population the daily intake of nitrate regularly exceeds the ADI (Slob et al., 1994). This, together with the situation that human exposure to nitrate at the level of its ADI leads to substantial nitrite exposure, raises the question what toxic risk could be associated with such exposure. To answer this question we have incorporated the interaction of nitrite with hemoglobin, yielding nitrate and methemoglobin, and the ensuing reduction of
methemoglobin by methemoglobin reductase into the toxicokinetic model. This makes the simulation of blood nitrite and methemoglobin concentrations in man after realistic exposure scenarios to nitrate possible. In this way the extrapolation of nitrite toxicity from animals to man may considerably be improved by basing it on a comparison of the nitrite concentration in blood and the associated toxicity observed in animals. In its current status the model assumes that the methemoglobin reduction system operates in such a way that the erythrocyte has a constant capacity to reconvert the formed methemoglobin into hemoglobin. Under these conditions the methemoglobin level in adults exposed to nitrate is expected to remain fairly low. Although this may be valid for the average adult, for specific risk groups it may not. For example, suckling infants are believed to have a reduced methemoglobin reductase activity. To assess the risk of nitrate exposure in this specific subpopulation the methemoglobin reductase activity has to be modeled in a more physiologically realistic way, i.e. as a system depending on the amount of the methemoglobin reductase enzyme in the erythrocyte and its redox status. We will therefore attempt to model the methemoglobin reductase activity in such a way that it meets the necessary physiological demands. For this purpose we will use data that have recently become available from an in vitro study on the fate of nitrite in whole human blood performed at the National Poisons Control Centre of RIVM.
4.3 Studying nitrosamine formation
In the toxicokinetic model the nitrite formed in the saliva enters the absorption compartment. In this compartment nitrite is assumed to decompose chemically or to be absorbed into the body. The amount of nitrite in the absorption compartment may be used as the starting point for simulation studies on the formation of nitrosamines after the exposure of man to nitrate and nitrosamine precursors from food. For this purpose the amount of nitrosamine precursors in food and the absorption kinetics of nitrate from food should, however, be known.
Information regarding the first issue may be obtained fromthe literature (Shephard et al., 1987). Regarding the second issue, the absorption of nitrite as incorporated in the model does not yet allow a reasonable simulation of nitrosamine formation in the gastro-intestinal tract of humans exposed to nitrate. However, the information on the absorption kinetics of nitrate from food will become available from a study which will be performed on this subject in the
Report nr 2 3 5 8 0 2 0 0 2 page 23 of 38
near fiiture at the National Poisons Control Centre of RIVM. The results of the latter study will be incorporated into the toxicokinetic model. The modified model may then be used for simulation studies on nitrosamine formation in humans exposed to nitrate from food.
Report nr 235802,002 page 24 of 38
5. CONCLUDING REMARKS
In this report we used a toxicokinetic model for the calculation of the amount of nitrite formed in humans exposed to nitrate at the level of its ADI. This calculation showed that thé exposure of man to nitrate at the level of its ADI leads to a nitrite exposure that exceeds the ADI for nitrite 4 to 6-fold. The question remains what toxic risk can be attributed to such nitrite exposure. To answer this question two types of (systemic) nitrite toxicity should be considered: nitrite toxicity in the blood itself (methemoglobin formation) and toxicity caused by the interaction of nitrite in blood with the organs. Regarding the first, the toxicokinetic model will be extended such that it is suited for the calculation of methemoglobin formation in the general population as well as in sensitive subpopulations (suckling infants).
The (extended) model could considerably improve the risk assessment of nitrate. Firstly, the (extended) model could supersede the extrapolation of methemoglobin formation from animals to man and may, for example, be used for the calculation of methemoglobin formation in suckling infants exposed to nitrate from drinking water. Secondly, the
(extended) toxicokinetic model offers the possibility of extrapolating nitrite toxicity on the basis of the internal nitrite dose, i.e. on the basis of the interaction of nitrite in blood with the organs. Data on the relationship between the concentration of nitrite in blood and the
resulting organ toxicity in animals are available (Boink et al., 1995). The (extended)
toxicokinetic model may be used to simulate this relationship in humans exposed to nitrate. In this way the nitrate exposure below which no nitrite toxicity is expected may be calculated. It should be emphasized however that this procedure still leaves uncertainty in the
extrapolation of differences in the organ sensitivity for nitrite toxicity between animals and man.
Report nr 23580? 002 page 25 of 38
REFERENCES
Abe, K. and Y. Sugita. (1979) Properties of cytochrome bj and methemoglobin reduction in human erythrocytes. European Journal of Biochemistry,10I, 423-428
Bartholomew, B. and M.J. Hill. (1984) The pharmacology of dietary nitrate and the origin of urinary nitrate. Journal of Food and Chemical Toxicology, 122, 789-795
Boink, A.B.T.J., Dormans, J.A.M.A. and G.J.A. Speijers. (1995) The role of nitrite and/or nitrate in the etiology of the hypertrophy of the adrenal zona glomerulosa of rat. In: Health aspects of nitrate and its metabolites (particularly nitrite), pp 213-227, Publishing and Documentation Service, Council of Europe Press, Strasbourg
Calabrese, E.J. (1991) Principles of Animal Extrapolation. Lewis Publishers, New York European Union, Scientific Comittee on Food. (1995) Opinion on Nitrates and Nitrites, 98th meeting of the Scientific Comittee on Food/EU
Hultquist, D.E., Sannes, L.J. and D.A. Juckett (1984) Catalysis of methemoglobin reduction. Current Topics in Cellular Regulation, 24, 287-300
Joint Expert Committee on Food Additives (JECFA). (1995) Toxicological Evaluation of Certain Food Addhives and Contaminants, WHO Food Addhives Series 36, Rome
Kortboyer, J.M., Colbers, E.H.P., Vaessen, H.A.M.G., Groen, K., Zeilmaker, M.J., Slob, W., Speijers, G.J.A. and J. Meulenbelt. (1995) A pilot-study to investigate nitrate and nitrite kinetics in healthy volunteers with normal and arficially increased gastric pH after sodium nitrate ingestion. In: Health aspects of nitrate and its metabolites (particularly nitrite), pp 269-286, Publishing and Documentation Service, Council of Europe Press, Strasbourg
Kosaka, H, Imaizumi, K., Imai, K and I. Tyuma. (1979) Stoichiometry of the reaction of oxyhemoglobin with nitrite. Biochimica Biophysica. Acta, 581, 184-188
Kosaka, H, Imaizumi, K. and I. Tyuma. (1981) Mechanism of autocatalytic oxidation of oxyhemoglobin by nitrite and intermediate detected by electron spin resonance. Biochimica Biophysica Acta, 702, 237-241
Report nr 235802002 page 26 of 3 8
Mirvish, S.S., Patil, K., Ghadiriani, P. and V.R.C. Kommineri. (1975) Disappearance of nitrite from the rat stomach: Contribution of Emptying andOther factors. Journal of the National Cancer Institute, 54, 869-875
Schultz, D.S., Deen, W.M., Karel, S.F., Wagner, D. and S. Tannenbaum. (1985) Pharma-cokinetics of nitrate in humans: role of gastrointestinal absorption and metabolism. Carcin-ogenesis, 6, 847-852
Shapiro, K.B., Hotchkiss, J.H. and D.A. Roe. (1991) Quantitative relationship between oral nitrate-reducing activity and the endogenous formation of N-nitrosoamino acids in humans. Food and Chemical Toxicology, 29, 751-755
Shephard, S.E., Schlatter, Ch. and W.K. Lutz. (1987) Assessment of the risk of formation of carcinogenic N-nitroso compounds from dietary precursors in the stomach. Food Chemical Toxicology, 25, 91-108
Spagnuolo, C , Rinelli, P., Coletta, M., Chiancone, E. and F. Ascoli. (1987) Oxidation of human oxyhemoglobin with nitrite : a reexamination. Biochimica et Biophysica Acta, 911, 59-65
Spiegelhalder, B., Eisenbrand, G. and R. Preussmaim. (1976) Influence of dietary nitrate on nitrite content of human saliva: possible relevance to in vivo formation of N-nitroso com-pounds. Food and Cosmetical Toxicology, 14, 545-548
Slob, W., Van den Berg, R. and M.P. van Veen. (1995) A statistical exposure model (STEM) applied to nitrate intake in the Dutch population. In: Health aspects of nitrate and its
metabolites (particularly nitrite), pp 75-82, Publishing and Documentation Service, Council of Europe Press, Strasbourg
Tannenbaum, S.R., Weisman, M. and D. Fett. (1976) The effect of nitrate intake on nitrite fromation in human saliva. Food Cosmetical Toxicology, 36, 549-552
Tarmenbaum, S.R. (1979) Endogenous formation of nitrite and N-nitroso compounds. In: Naturally Occurring Carcinogens-Mutagens and Modulators of Carcinogenesis (E.C. Miller, J.A. Hirono, T. Sugimuraand S. Takayama, Eds.), pp. 61-140, Japan Science Society Press, Tokyo.
Report nr 235802,002 page 27 of 38
Task Group on Reference Man. (1974) International Commission on Radiological Protection, Pergamon Press. • .
-Til, H., Falke, H.E., Kuper, C.F. and M.I. Willems. (1988) Evaluation of the oral toxicity of potassium nitrite in a 13-week drinking-water study in rats. Food Chemical Toxicology, 26, 851-859
Vining, R.F. and R.A. McGinley. (1986) Hormones in saliva. CRC Critical Reviews in Clinical Laboratory Science, 23, 95-146
Wagner, D., Schultz, D.S., Deen, W.M. Young, V.R. and S.R. Tannenbaum. (1983) Metabolic fate of an oral dose of '^N-labeled nitrate in humans: Effect of diet supplemen-tation with ascorbic acid. Cancer Research, 43, 1921-1925
Report nr 235802 002 page 28 of 38
Appendix 1
Mathematical model for the kinetics of nitrate and nitrite in man Nitrate (see Fig. U
Nitrate enters the absorption compartment (stomach + lower parts of the gastro-intestinal tract) by oral intake or by swallowing of nitrate that has been secreted from the blood into the saliva (see Fig. 1). The rate of swallowing nitrate from saliva was modeled as the nitrate concentration in saliva times the saliva production rate (B, 1/hr). Nitrate is removed from the absorption compartment by first-order uptake into the central compartment. Bacterial metabo-lism of nitrate in the parts of the gastro-intestinal tract beyond the mouth is not incorporated in the model. Thus, the amount of nitrate in the absorption compartment is given by:
at
Nitrate enters the central compartment by uptake from the absorption compartment, by endogenous nitrate synthesis and by conversion of nitrite in the blood to nitrate by the methe-moglobin reductase enzyme. Endogenous nitrate synthesis is assumed to occur at a constant rate (Kgnj, mol/hr). The conversion of nitrite into nitrate in blood by the methemoglobin reductase enzyme was modeled as a bimolecular reaction between hemoglobin (CHb2+) and nitrite (Cbio,N02~) ^^ blood. In this reaction a 1 to 1 conversion of nitrite to nitrate was assumed (Kosaka et al., 1979). Nitrate is removed from the central compartment by (the sum of)
metabolic and renal clearance and by the secretion of nitrate into the saliva. Both mechanisms were modeled as first-order processes. The amount of nitrate in the central compartment then is described by:
at
kabs.Nas Aabs.Nas ~ kel Abo<fy,fja} Kend " ftsec Ahody.NO'j k j C m ' * Chlo.Nffi ^l''»
The plasma concentration of nitrate was calculated by dividing the amount of nitrate in the central compartment by the distribution volume of nitrate (Vj ):
R e p o r t n r 2 3 5 S 0 2 0 0 2 p a g e 2 9 o f 3 8
^ _ Abody.m'i X^bloMO'i
Y d
The model assumes that nitrate in food or drinking water is completely transferred to the absorption compartment (stomach and lower parts of the gastro-intestinal tract), i.e. no nitrate is left in the saliva during the swallowing of food or drinking water. Nitrate secreted from the central compartment enters the salivary nitrate compartment with first-order rate constant kjec-Bacterial metabolism of nitrate in the saliva was modeled by first-order approximation of Michaelis-Menten kinetics (^^om ^ Vmax/Km, i.e. the salivary nitrate concentration is
assumed to be much lower than the Km for its metabolism to nitrite). The amount of nitrate in the salivary compartment then is:
, Asal.l40'i kysc Abody.SO'i - kconv Asal.NCJi ~ ^xal.f^O}
at Nitrite (see Fig U.
Like nitrate, nitrite enters the salivary compartment by secretion from the central compart-ment with first-order rate constant equal to that for nitrate (kjec)- Furthermore, in the salivary compartment nitrite may be formed by bacterial fermentation of nitrate (see above). Removal of nitrite from the salivary compartment occurs by swallowing. Swallowing of nitrite was modeled in the same way as swallowing of nitrate. The amount of nitrite in the salivary compartment then follows from:
~ Asal,NO'2 ~~ kconv Asal.NO) ~ " Csal.No'i k s c c Abody.NO'i
After swallowing, nitrite enters the absorption compartment. From this compartment it may be removed in two ways: by chemical clearance or by first-order uptake into the central compartment. The model does not incorporate bacterial metabolism of nitrite in the gastro-intestinal tract. The amount of nitrite in the absorption compartment then is modeled as:
~r~ Aabs.SCfi ~ ^•»'iN0'2 ~ kabs.fJCTi Aabs.NOi ~ k decay Aabs.SO'i
at
Nitrite enters the central compartment by absorption from the gastro-intestinal tract. It is removed from the central compartment by reaction in blood with hemoglobin to
methemoglobin and nitrate (see above) and by secretion from blood into the saliva. The amount of nitrite in the central compartment then is:
Report nr 235802002 page 30 of 38
~ Abody.Na} ~ kabs.NOi Aabs.NO'j ' k i C H b ' * Cblo.tJ<J2 V bio ~ ftsec Abody.fJO}
at
The concentration of nitrite in blood was calculated by'dividing the amount of nitrite in the central compartment by the distribution volume of nitrite. We assumed the distribution of nitrite to be equal to the distribution volume of nitrate. Hence:
_ _ Aboify.NO'2 i ^ bio, NO}
Vd
Methemoglobin reductase activity in erythrocvtes (see Fig. T\
The amount of methemoglobin in the blood was modeled as resulting from (1) a background rate of hemoglobin oxydation, (2) the reaction of nitrite and hemoglobin (Hb ) and (3) methemoglobin repair by the methemoglobin reductase enzyme. The formation of methemoglobin and nitrate out of nitrite and hemoglobin was modeled as a bimolecular reaction between nitrite and hemoglobin. The reduction of methemoglobin to hemoglobin by the methemoglobin reductase enzyme was basically modeled as a bimolecular reaction between methemoglobin and the erythrocyte's (reduced) cytochrome h^- In this reaction we however assumed that erythrocyte's permanently maintain their cytochrome h^ in its reduced status. Hence, Ccytb5,red equals C^yibs. Under this assumption the reduction of methemoglobin simplifies to an apparent first-order reaction (see Fig. 2). The concentrations of methemo-globin and hemomethemo-globin in blood then are given by:
— Cnb'* = ki Cm'* (Cbio.m; + H } " ^r Cm'* dt with : d _ d
It
^"'^
^ ' Jt ^ " '
k j — k j - Ccyib,The rate of endogenous nitrate synthesis was calculated as follows. In the study of Wagner et al. human volunteers were maintained on a low nitrate diet for 5 days ( ± 9 mg/day) before being administered a single oral dose of nitrate (« 220 mg in water).
When the endogenous nitrate synthesis and the oral uptake during the low nitrate were modeled as constant nitrate uptake rates O^nd I'ssp. lorai, background) ^^^ assuming the plasma nitrate concentration to have reached a "steady state" after 5 days on the low nitrate diet the endogenous nitrate synthesis rate was calculated as:
Report nr 235802002 page 31 of 38
i\.end ^p!asma,ss,S03 ' d Kel ' Ioraljtackgromid
N O , - D O S E ^ ^abs,nitrate 'ab8,nitrate
K
endcu
ENDOGENOUSNO3- SYNTHESIS *bodyjiitrata
-el METABOLIC + RENAL NO,- CLEARANCE 'sec
o-' sal,nitrate B,V sal 'convO
chemical c l e a r a n c e 'decay < • ' sai,nitrite B.v,^ ^ ; ^ ' abs,nitrite Absorption 'abs,nitrjteJ3
' s e c S e c r e t i o n ^ ^ to s a l i v a ^ 'Hemoglobin ^blo^itrite ^Mathemoglobin i \ k'4Report n r 2 3 ' ; s n 2 002 page 33 of 38 Glossary Ioral,N03" Aabs,N03" ^abs,N03" B Vsal Csal,N03- '•sal,N03-A body,N03" ^el CHb2+ Cblo,N02-CbIo,N03" A sal,N02" ^abs,N02" kd ecay Aabs,N02-Cblo,N02' *^Hb3+ bg k4 *-^cytb5
rate of oral nitrate intake (mmole/hr)
Amount of nitrate in the absorption compartment (mmole) Absorption rate constant for nitrate (hr"')
Saliva flow rate (1/hr)
Volume of the saliva compartment (I) Salivary nitrate concentration (mmole/l)
Amount of nitrate in the saliva compartment (mmole) Amount of nitrate in the central compartment (mmole) Rate constant for the elimination of nitrate from the central compartment (hr'') (sum of metabolic and renal elimination constants) —
Rate of endogenous nitrate synthesis (mmole/hr)
Rate constant for the secretion of nitrate and nitrite from blood to saliva (hr"')
Rate constant for the reaction of nitrite in blood with Hb (mM"' hr"')
Hb concentration in the blood (mM) Nitrite concentration in blood (mM) Blood volume (1)
Distribution volume of nitrate (1) Nitrate concentration in blood (mM)
Rate constant for the conversion of nitrate to nitrite in the saliva (hr-')
Amount of nitrite in the saliva compartment (mmole) Absorption rate constant for nitrite (hr"')
Rate constant for chemical decay of nitrite in the absorption compartment (hr")
Amount of nitrite in the absorption compartment (rrmiole) Nitrite concentration in blood (mM)
Methemoglobin concentration (mM)
Concentration of background methemoglobin reduction nitrite equivalents in blood (mM)
Rate constant for the reaction of methemoglobin and reduced cytochrome h^ (mM" hr" )
Report nr235R02002 page 34 of 3 8
Appendix 2 Model calibration and model parameter values Model calibration procedure
For the model calibration we selected the experimental data of the study of Wagner et al. (1983). In this study human volunteers (N=12) were maintained on a low nitrate diet for 5 days (w 9 mg 'V-nitrate per day) before being administered a single oral dose of '^-nitrate in drinking water. The applied dose of 220 mg («3.1 mg/kg) almost equals the current ADI for nitrate. Up to 48 hours atïer the administration of this nitrate dose the nitrate concentration in plasma and saliva and the nitrite concentration in saliva as well as the excretion of nitrate in the urine were measured.
In the calibration procedure the method of maximum likelihood (SimuSolv/ACSL simulation sofware, version 2.0, The Dow Chemical Company, Midland, Michigan) was applied. Before fitting, the data of Wagner et al. were log-transformed. The model parameters to be estimated in this way were the absorption rate constant of nitrate, the elimination rate constant for nitrate, the rate constant for the secretion of nitrate from blood to the saliva, and the rate constant for the salivary nitrate => nitrite conversion. In the fitting procedure it was found that the model parameters to be estimated were highly correlated and in fact could only be identified when the model parameters salivary flow rate and the volume of the salivary compartment were held constant. Under these conditions the elimination rate constant for nitrate, the secretion rate constant of nitrate from blood to saliva and the salivary nitrate => nitrite rate constant could be estimated. The absorption rate for nitrate however was not well determined by the data. The value for the absorption rate constant was therefore chosen in such a way that the model simulated the absorption of nitrate to reach its maximum 30-60 min after the administration of nitrate (Kortboyer et al., 1995).
Model parameter values Nitrate
The volume of distribution of nitrate was taken from the study of Wagner et al. (1983). These authors described the human plasma nitrate concentration after a single oral nitrate dose from drinking water with a one compartmental kinetics incorporating a (constant) endogenous ni-trate synthesis rate and a first-order elimination rate constant. Assuming a bioavailibility of 100% the volume of distribution of nitrate was determined at 28.5 % of the body weight in this study (Vj = 21.1 I, N=12; BW = 74.1 kg). The distribution volume for nitrate as determined by Wagner equals the sum of the central nitrate compartment and the salivary nitrate compartment in our model. As the latter volume is negligibly small compared to the
Report nr 235802.002 page 35 of 38
former volume, the volume of the central nitrate compartment in our model was set equal to the volume of distribution for nitrate as determined by Wagner.
In humans the salivary flow displays a circadian rhythm. During the morning salivary flow increases until a maximum is reached some houres after noon. Thereafter salivary flow decreases until a minimum is reached in the early moming. Vining (1986) reports the salivary flow to vary from 0.5 to 2 ml/min during waking hours (0.075 1/hr, range 0.030-0.120 1/hr) and 0.05 ml/min during sleeping time. Given a daily sleeping time of 8 hours per day a mean daily saliva flow of 1.22 I (51 ml/hr) can be calculated (range: 0.50-2.42 I/day). This value agrees reasonably well with the value reported by the The Task Group on Reference Man (0.042-0.084 1/hr, 1974). In our model we used the mean of the salivary flows during waking houres as reported by Vining and ICRP, i.e. 0.069 1/hr.
To our knowledge no relevant literature data on the volume of the salivary compartment are yet available. Preliminary experiments with human volunteers revealed a mean volume of around 1 ml for this compartment. We therefore took this value as an estimate for the volume of the salivary compartment.
Nitrite
The volume of distribution of nitrite and its rate constant for absorption from the gastro-intestinal tract were assumed to be equal to the volume of distribution of nitrate and the absorption rate constant of nitrate.
In the stomach nitrite may undergo first-order chemical degradation (Mirvish et al., 1975). The rate of this degradation depends on the pH and the gastric food content (see Fig. 1). In our model we assumed nitrite degradation in the stomach to be solely pH-dependent. The rate constant for pH dependent nitrite degradation in the stomach was obtained as follows. In the human stomach a basal pH value of ± 1.5 is found. However, this value may increase to a value up to 7 when food and/or water are consumed (M. Oiling, Laboratory of Exposure Assessment, RIVM, and J. Meulenbelt, National Poisons Control Centre RIVM, personal communications). In the rat stomach the basal pH of the rat stomach is around 4.5 (range: 3.8-5.0, Calabrese, 1991). Using the relationship between the rate constant for pH dependent nitrite degradation in the stomach as depicted in Fig. 1 rate constants of 0.667 and 0.039 hr' for the pH dependent decay of nitrite in the human and the rat stomach were calculated.
Methemoglobin reductase system
The model parameters for the methemoglobin reductase system were obtained from the study of Abe et al. (1979): 0.22E-03 mM for the concentration of cytochrome bs in the erythocyte and 22E03 mM"' hr"' for the rate constant for the (non-enzymatic) reduction of methe-moglobin by reduced cytochrome b^.
Report pr 235802 002 page 36 of 38 C4 O Citrate buffer D Food slurry
1,00
3 . 5 0 6 . 0 0pH
Fig. 1 Nitrite half-life as a function of pH
Nitrite half-life was determined by Incubating nitrite for 0-120 min. in citrate buffer or buffered (rat) food slurry {Mirvish et al., 1975). The relationship between nitrite half-life and pH (solid line) was obtained by fitting an exponential function through the obtained data points. Nitrite half-lives prevailing In the human (pH=l .5, t,/2 = 1.04 hr) and the rat (pH=4.5, ti/2 = 17.98 hr) stomach were then calculated with the exponential function fitted on the citrate buffer data.
Report nr 23^802.002 page 37 of 38
List of model parameter values
Model parameter Absorption rate constant for nitrate (kabs,N03-'hr") Absorption rate constant for nitrite (kabs,N02".hr" Salivary flow rate (B, l*hr'')
Volume of the saliva compartment (Vjai, 1)
Elimination rate constant for nitrate (kg,, hr"') Volume of distribution of nitrate (Vj, fraction of body weight) Volume of distribution of nitrite (V^, fraction of body weight)
Endogenous rate of nitrate synthesis (K, mmole*hr"') Secretion rate constant for nitrate from blood to saliva (k^^^, hr"')
Rate constant for salivary nitrate => nitrite con version (k^onv^ hr" ) Rate constant for the reaction of nitrite with Hb^^ monomers (k3,mM"'*hr"')
Source
Model calibration (see text Chapter 3)
Assumption (see text Chapter 3)
Experimental
Assumption
"Model calibration (see text Chapter 3)
Experimental
Assumption (see text Chapter 3)
Experimental
Model calibration (see text Chapter 3)
Model calibration (see text Chapter 3)
Experimental Value (range) 5.3.5 + 1.73 5,^^ 0,069(0.042-0.120) 0,001 0.14 + 0.008 0.2$5-0.329 0,28.5 0.081 0-045 + 0.003 (Wagner) 0-077+ 0.003 (Kortboyer) 0,084+ 0.006 (Shapiro) 19.94+1.75 (Wagner) 10,68+1.27 (Kortboyer) 13.08+1.11 (Shapiro) - 6.96E-01 + 4.6E-03
Report nr 235802.002 page 38 of 38
Rate constant for Cytbs catalysed Hb ^ reduction (k4,mM"'*hr'')
Rate constant for nitrite decay in an acid
envirormient (human sto-mach pH : 1.5; rat stosto-mach pH:4.5)(kdecay,hr-')
Cytbs concentration in blood (mM)
"Steady State" MetHb con-centration in blood (mM) Urinary nitrate clearance as fraction of the total body clearance Concentration of Hb monomers in blood (mM) Experimental Experimental Experimental Experimental Model calibration (see text Chapter 3)
Experimental 27000 human : 0.666 rat: 0.039 O.llE-03 0.04 0,56 10