M. Bouwknegt et al.
National Institute for Public Health and the Environment
P.O. Box 1 | 3720 BA Bilthoven www.rivm.com
Quantitative risk profile for viruses in
foods
Colophon
© RIVM 2013
Parts of this publication may be reproduced, provided acknowledgement is given to the 'National Institute for Public Health and the Environment', along with the title and year of publication.
M. Bouwknegt, LZO, RIVM/CIb
K. Verhaelen, LZO, RIVM/CIb
A.M. de Roda Husman, LZO, RIVM/CIb
S.A. Rutjes, LZO, RIVM/CIb
Contact:
Saskia Rutjes
Laboratory for Zoonoses and Environmental Microbiology
saskia.rutjes@rivm.nl
This investigation has been performed by order and for the account of Food- and Consumer Product Safety Authority, within the framework of V/330371/01/VV: viruses in food.
Abstract
Quantitative risk profile for viruses in food
Viruses, similar to bacteria, can pose a risk to human health when present in food, but comparatively little is known about them in this context. In a study aimed at the health risks posed by viruses in food products, the RIVM has inventoried both current knowledge and pertinent information that is lacking. The inventory, which is presented in this report as a so-called risk profile, focuses on three viruses that can be transmitted to humans through food consumption. These are the hepatitis A viruses in shellfish, noroviruses in fresh fruits and vegetables and hepatitis E viruses in pork. The study was
commissioned by the Dutch Food and Consumer Product Safety Authority.
General findings
The general finding is that to date it has been difficult to obtain a reliable estimation of the number of viruses in food products. This is partly due to large differences in the methodologies currently used to detect viruses in food products. However, accurate information on the number of viruses in a food product is crucial to a reliable estimate of the health risk. The probability that any one person becomes infected increases with an increasing number of contaminated products, or with an increasing number of viruses per product. The shortcomings of the methods currently used to make such estimations are identified in this report, and recommendations are made for improvements that will enable a more realistic determination.
Factors that increase the likelihood of food becoming contaminated with viruses during production or processing were also studied. For raw or fragile products, such as oysters, or fresh fruits and vegetables, viruses are not inactivated by heating because the foods are not cooked before consumption.
Specific findings on the studied viruses
With respect to fresh produce, it is important to estimate how many noroviruses come into direct contact with the fruits and vegetables through the irrigation system. Another possible but important source that needs to be characterized is the transfer of viruses from hands or tools to the food product during harvesting and/or processing. For hepatitis E virus, it is important to know how many pigs are infected at the time of slaughter as this could result in contaminated pork products. If the hepatitis E virus infection occurs months before slaughter, the pigs would likely have recovered by the time of slaughter and the products would not represent a health risk to the consumer. It is also important to determine the number of hepatitis E viruses per product. In terms of shellfish, it is relevant to know how many viruses are present in the surface waters in which they are cultured and the extent to which they remain in the shellfish up to the moment of consumption.
Keywords:
quantitative risk assessment, norovirus, hepatitis A virus, hepatitis E virus, fresh produce, shellfish
Rapport in het kort
Kwantitatief risicoprofiel voor virussen in voedsel
Net als bacteriën kunnen virussen in voedsel risico’s vormen voor de volksgezondheid. Over virussen is echter minder bekend. Het RIVM heeft daarom in kaart gebracht welke kennis beschikbaar is of juist ontbreekt om de volksgezondheidsrisico’s te kunnen schatten (risicoprofiel). Hiervoor zijn drie virussen uitgelicht die via voedsel naar mensen kunnen worden overgedragen: hepatitis A-virussen in schelpdieren, norovirussen op verse groenten en fruit, en hepatitis E-virussen in varkensvlees. De inventarisatie is in opdracht van de Nederlandse Voedsel- en Warenautoriteit gemaakt.
Algemene bevindingen
In het algemeen blijkt dat het tot nu toe lastig is om het aantal virussen op producten op een betrouwbare manier te kunnen schatten. Dit komt gedeeltelijk omdat de methoden om de virussen aan te tonen sterk verschillen. Om de gezondheidsrisico’s te kunnen inschatten is kennis over het aantal virussen juist nodig. De kans dat iemand ziek wordt is namelijk groter naarmate het aantal producten dat besmet is groter is, of wanneer het aantal virussen per product hoger is. De tekortkomingen van de methoden worden in dit rapport
aangegeven en enkele aanbevelingen worden gedaan om de berekeningen van het aantal virussen realistischer te maken.
Verder is geïnventariseerd welke factoren de kans vergroten dat voedsel besmet raakt tijdens de productie of de verwerking ervan. Bij rauwe of kwetsbare producten, zoals oesters, of verse groenten en fruit, is het immers niet mogelijk om de virussen eenvoudig onschadelijk te maken door voedsel te koken.
Bevindingen onderzochte virussen
Specifieker is het bij het norovirus belangrijk te achterhalen hoeveel virussen op groente en fruit terechtkomen via het irrigatiewater. Een andere mogelijke bron is via de handen of gereedschap tijdens de oogst en verwerking. Voor het hepatitis E-virus is het van belang te weten hoeveel varkens tijdens de slachtfase de infectie doormaken en zo besmette producten leveren. Als zij de hepatitis E-infectie eerder doormaken, is de besmetting voorbij en vormt dit geen risico meer voor de consument. Ook is inzicht nodig in de aantallen
hepatitis E-virussen per product. Wat de schelpdieren betreft, is het relevant om te weten hoeveel virussen in het oppervlaktewater zitten waarin ze worden gekweekt, en in welke mate deze virussen in de schelpdieren achterblijven. Trefwoorden:
kwantitatieve risicoschatting, norovirus, hepatitis A-virus, hepatitis E-virus, verse groenten en fruit, schelpdieren
Contents
Summary—11
1
Introduction—13
2
Hepatitis A virus in shellfish—15
2.1
Introduction—15
2.2
Components of the conceptual risk assessment model—15
2.3
Quantification of components—16
2.3.1
HAV concentration in surface water—16
2.3.2
Filtration rate of shellfish—17
2.3.3
Retention rate of HAV in shellfish—18
2.3.4
Depuration rate of HAV in shellfish—19
2.3.5
Inactivation rate of HAV in shellfish—21
2.3.6
HAV in harvested shellfish—24
2.3.7
Consumption of shellfish—27
3
Hepatitis E virus in pork—29
3.1
Introduction—29
3.2
Components of the conceptual risk assessment model—30
3.3
Component quantification—31
3.3.1
Prevalence of HEV infection in pigs at slaughter—31
3.3.2
Fraction of infected pigs that are viremic—31
3.3.3
Concentration of HEV in pig meat at slaughter—34
3.3.4
Natural inactivation rate of HEV—35
3.3.5
Heat inactivation of HEV—35
3.3.6
Other inactivation rates—36
3.3.7
Consumption of pork meat—36
3.3.8
Dose-response model—37
4
Norovirus on fresh produce—38
4.1
Introduction—39
4.2
Components of the conceptual risk assessment model—40
4.3
Component quantification—40
4.3.1
Norovirus concentration in irrigation water—40
4.3.2
Volume of irrigation water retained by fresh produce—41
4.3.3
Fraction of harvester’s hands and food handlers’ hands contaminated—42
4.3.4
Virus transfer rates—43
4.3.5
Norovirus concentration in rinsing water—43
4.3.6
Removal rate of norovirus from product due to rinsing—44
4.3.7
Persistence of norovirus on fresh produce—45
4.3.8
Consumption of fresh produce—47
4.3.9
Dose response model—47
5
General discussion and conclusions—49
5.1
General discussion—49
5.2
Discussion on HAV in shellfish—49
5.3
Discussion on HEV in pork—50
5.4
Discussion on NoV in fresh produce—51
Acknowledgements
The authors want to thank Susan Petterson (The King’s School, Paramatta, Australia) for her help in collecting and describing the data for hepatitis A virus in shellfish.
Summary
This report describes the results of a literature review that was conducted to collect quantitative data on hepatitis A virus is oysters, hepatitis E virus in pork and norovirus in fresh produce. Many studies on these virus-food combinations have been published to date. The majority of those studies focused on the food product prior to or at consumption, either in response to an outbreak or as a cross-sectional survey. A minority of those studies, however, provides data that can be used to conduct a quantitative risk assessment. For instance, studies report the number of positive samples among all examined, but do not report observed quantities of viruses in samples. If viruses were quantified, then generally the reported absolute quantifications of viruses in samples ignored the imperfection in recovery of viruses from samples and any inhibition during amplification with PCR. In addition, the multifold in detection methods, with differing sensitivities and specificities, make it difficult to compare the results between studies. In this situation, quantitative microbiological risk assessment can be a useful tool to structure available knowledge about the food production chain and use data from several points along this chain to estimate public health risks. Conceptual models were therefore generated for the three food production chains by hypothesizing the most important contamination points. Subsequently, literature was reviewed for each of the hypothesized contamination points and described quantitatively in this report. By using a quantitative microbiological risk assessment framework, the number, and spread therein, of viruses at several points in the three food production chains can be estimated. These estimates can subsequently be combined with food consumption data and representative dose-response models to assess the public health burden posed by the three virus-food combinations.
1
Introduction
Viruses are now well-recognised worldwide causative agents of foodborne outbreaks. In Europe increasing numbers of virus-associated foodborne outbreaks are reported with growing concern from EFSA (EFSA, 2011a). For those outbreaks that were verified, noroviruses (NoV) were the most frequent cause, followed by hepatitis A viruses (HAV). Shellfish, molluscs and products thereof were the most frequently implicated food items.
Contamination of food with foodborne viruses may occur through poor hygienic practices, either by food handlers or during food production (Mead et al., 1999). Both humans and animals may serve as reservoirs for foodborne viruses, leading to contaminated foods directly (e.g., contact transmission, intrinsic
contamination with zoonotic pathogens from infected animals) or indirectly through the environment. The environment only serves as a passive vehicle for the viruses, because no viral replication takes place outside warm-blooded hosts.
The levels of evidence for viral outbreaks associated with food consumption differ greatly. There may be solely epidemiological indications for a certain food item to be involved in viral disease cases. Alternatively, a specific virus type or even the same virus variant may be detected in both patient and food. However, this level of evidence has only been obtained in some cases (Craun and
Calderon, 2001; De Roda Husman et al., 2007; Tillett et al., 1998).
Due to a range of different problems, attribution of a specific virus to foodborne outbreaks in epidemiological studies is hampered. Therefore, underreporting is most likely in order. Where such epidemiological outbreak investigation and molecular tracing studies fail, quantitative viral risk assessment could aid policy makers in informed risk management decisions.
Quantitative viral risk assessment or QVRA yields a risk estimate from the numbers of infectious, human pathogenic viruses in or on a food commodity (Havelaar and Rutjes, 2008). The classical quantitative microbial risk
assessment framework entails hazard identification, hazard characterisation, exposure assessment and actual risk characterisation (ILSI, 1996). The product of the first part, hazard identification, is generally called a risk profile.
Previously, some risk profiles were conducted for foodborne viruses, such as a risk profile on Norwalk-like virus in molluscs (raw) in New Zealand (Greening et al., 2003), on foodborne norovirus infections (HPA, 2004) and for hepatitis E viruses (HEV) (Bouwknegt et al., 2009a). These risk profiles largely include qualitative data to provide evidence that specific virus – food commodity combinations may entail a public health risk. Full quantitative viral risk
assessments most likely require much greater data sets and data sets that are currently missing. This was also concluded at an international meeting of experts: undertaking a full quantitative risk assessment for FBV may be premature due to data limitations (FAO/WHO, 2008). By composing a so-called quantitative virus risk profile, the available quantitative data along the virus– food commodity production chain can be inventoried. These data can be used to estimate parameters for parts of the quantitative risk assessment model. Furthermore, data gaps will thus be identified.
Here, the three possible transmission routes for foodborne viruses were selected as a subject for a quantitative risk profile. These three were chosen for their different mechanism of transmission: 1) shellfish that accumulate the virus;
2) pork that may be intrinsically infected with virus; 3) fresh produce that may be contaminated due to unsanitary conditions by food handlers or
environmentally due to for instance contaminated irrigation water. The most representative viruses for these routes are HAV in shellfish, HEV in pork and NoV on fresh produce.
2
Hepatitis A virus in shellfish
2.1 Introduction
Hepatitis A virus (HAV), a picornavirus, is a common cause of hepatitis worldwide. Hepatitis A is endemic in developing countries, and most residents are exposed in childhood. In contrast, the adult population in developed
countries, such as the Netherlands, demonstrates falling rates of exposure with improvements in hygiene and sanitation. The export of food that cannot be sterilized, such as shellfish, from areas of high to areas with low rates of infection, is a potentially important source of infection.
Hepatitis A is a pathogenic virus for humans and susceptibility to the virus is currently reported to be exclusive for humans and several monkey species (Hollinger and Emerson, 2001). The virus can cause serious illness with
symptoms indistinguishable from other viral hepatic diseases. The transmission route for HAV is faecal-oral, which is different from most hepatitis viruses (hepatitis E virus excluded), that are transmitted via blood. After ingestion and uptake from the gastrointestinal tract, the HAV replicates in the liver and is excreted into the bile. Cellular immune responses to the virus lead to destruction of infected hepatocytes with consequent development of symptoms and signs of disease. The disease is often asymptomatic, but there may be a range of clinical manifestations from mild, anicteric infection to fulminant hepatic failure.
Management of the acute illness is supportive, and complete recovery without sequelae is the usual outcome. Vaccines are available.
HAV has been linked to the consumption of contaminated foods through outbreak studies (Petrignani et al., 2010a; Petrignani et al., 2010b; Sanchez et al., 2002; Shieh et al., 2007). In Europe, shellfish are among the most
frequently implicated food items and HAV is among the most frequent causative agent for virus outbreaks related to consumption of shellfish. Shellfish may become contaminated with viruses, such as HAV, through accumulation during the filter-feeding process in contaminated waters. Subsequent processes such as depuration and relaying do not influence the HAV numbers in shellfish
significantly which is also true for some of the other post-harvest treatment processes such as washing. Exposure to the resultant HAV by consumption of the shellfish may lead to infection and disease.
Post-harvest risk management options for shellfish contaminated with human pathogenic viruses, such as HAV, are limited to some forms of cooking,
however, often shellfish are consumed raw. To be able to estimate public health risks from consumption of contaminated shellfish by QMRA, quantitative data on virus concentrations in shellfish need to be collected. Therefore, quantitative data on HAV in the different phases of the shellfish production chain from HAV in marine waters to HAV in shellfish on the market were gathered for risk
assessments with the purpose of informing risk management.
2.2 Components of the conceptual risk assessment model
The only source of hepatitis A virus in shellfish is surface water used for culturing shellfish that is contaminated with human faecal material. This faecal material may be discharged into surface water through various routes. During heavy rainfall, wastewater treatment plants may overflow discharging untreated
wastewater. Wastewater treatment plants may discharge treated wastewater containing HAV due to the employment of treatment processes with a limited capacity to reduce viral load. Alternatively, recreation near or in these shellfish culturing waters may lead to direct contamination by bathers or sewage disposals from boats.
Subsequently, the surface water is filtered by shellfish for feeding at a certain rate, and each filtered HAV particle has a probability of being retained by the shellfish. Each particle also has a certain probability per unit time of being washed from the oyster again, a process referred to as depuration.
An important aspect for QMRA to consider is the distinction between infectious and inactivated HAV, because infectivity is the determinant of human infection given ingestion. HAV can be present in inactivated form as a certain fraction in surface water, or can become inactivated at a certain rate after being retained in shellfish. Distinction between the inactivated and the infectious form of HAV can be made by different detection techniques for HAV in water and shellfish, PCR for detection of both and cell culture for detection of infectious HAV. The total number of HAV per oyster at the moment of consumption is the expected retained number of HAV corrected for the inactivation.
The dose ingested by a human per consumption event is then the sum of the infectious HAV per shellfish and the amount of shellfish consumed. The availability of quantitative data for describing each of these components was investigated, and the suitability of these data for undertaking risk assessment was evaluated.
Since data on HAV in shellfish were limited, other important gastroenteritis viruses such as NoV were also included in the study.
2.3 Quantification of components
2.3.1 HAV concentration in surface water
HAV is excreted in large numbers by infected individuals, and occurrence of HAV in shellfish culturing waters is due to human faecal contamination. The primary site of replication for HAV is the hepatocyte, and HAV may reach the intestinal tract through the bile in substantial particle concentrations (Hollinger and
Emerson, 2001). HAV particle concentrations have been estimated up to 108 g-1
faeces. Faeces end up in sewage via toilets and sewerage pipe systems. Subsequently, human sewage is discharged either directly or indirectly to shellfish culturing waters. The concentration of HAV in shellfish culturing waters depends upon:
the incidence of infection in the contributing population;
the mechanism of faecal collection, treatment and discharge. Viral pollution of coastal waters is higher for communities with a high density of septic tanks (Griffin et al., 1999a; Lipp et al., 2001);
distance from the sewage release;
environmental conditions such as temperature, sunlight and flushing/dilution rate.
Concentration of HAV in sewage depends on the prevalence of infection in the contributing population, which varies considerably between communities, and countries. In developing countries, HAV infection is endemic and most
individuals are infected in early childhood. In the developed world, however, HAV infection is less common. Interpretation of environmental monitoring data
must take into consideration the likely prevalence rate of HAV amongst sewage contributors to the marine waters.
Prevalence rates of HAV in marine waters have been reported in the literature (Table 1). One study reported a concentration of HAV genome copies per L water of 75 – 730 (Rose et al., 2006), but concentrations of HAV in marine waters would be expected to be subject to wide fluctuations.
2.3.2 Filtration rate of shellfish
Pumping rate (PR) is the volume of water flowing out the exhalent siphon of the shellfish per unit time. Direct measurement of pumping rate is difficult, because it is challenging to measure water flow from the exhalent siphon without affecting flow rates. Direct methods have however been applied including:
physical separation of exhalant water by means of a rubber apron, and the change in volume in the exhalant water chamber is measured. When using this approach, induced hydrostatic pressure effects can influence the filtration rate (Famme et al., 1986; Jørgensen et al., 1986);
less direct, but still focused on water flow rates, several methods aimed at quantifying velocity profiles have been applied including video observation of particles, thermistor probes and impellers.
Indirect methods, based on the disappearance of particles in the water, either in a static or a flow-through system have also been applied. These methods aim to quantify the clearance rate (CR) (the volume of water cleared of particles per unit time) and when the capture efficiency of the shellfish is assumed to be 100%, then the CR is equal to the PR. These methods are the most commonly used methods for quantifying filtration rate and include:
flow-through chamber method where algal concentration is measured before and after passage through the chamber;
the suction method where algal concentration in inhaled and exhaled water is compared;
the clearance method where the change in concentration over time within a single chamber is monitored; and
the photo aquarium and the steady state methods where the algal dosing rate required to maintain a constant concentration within a fully-mixed chamber is monitored.
Riisgård (2001) reviewed the studies that had been undertaken at that time with particular attention on methodological approaches for quantifying filtration rate and uncertainties, and reported data that were based on reliable methodological approaches applied under optimal laboratory conditions (Table 2). For a full description of methodology, the reader is referred to that review. These filtration rates were developed in the laboratory under ideal conditions, and therefore are considered maximum rates. Actual rates of shellfish filtration in the environment are likely to be lower due to the influence of local fluctuating, non-ideal,
conditions. Filtration and clearance rates of shellfish are highly variable between species, populations and for individual organisms over time depending on size, reproductive state, temperature, salinity, food density and food quality. Overall, pumping rate increases with increasing gill area (Meyhöfer, 1985; Riisgård, 1988).
Depending on the type of shellfish, a regression model from the column
‘Regression’ in Table 2 can be used to estimate the average maximum filtration rate (L water per hour) based on dry mass weight (in g) or shell length (in mm).
Table 1 Reported prevalence of HAV in marine waters
Location Method N Positive Reference
Estuaries in Mexico (Huizache
Caimanero Lagunary Complex) RT-PCR 40 70% (Hernandez-Morga al., 2009) et
Venice Canals Real time
RT-PCT 9 8% (Rose et al., 2006)
Canals and near-shore waters
of the Florida Keys RT-PCR 19 63% (Griffin et al., 1999b)
Near-shore waters of
Barcelona, Spain RT-PCR 9 33% (Pina et al., 1998)
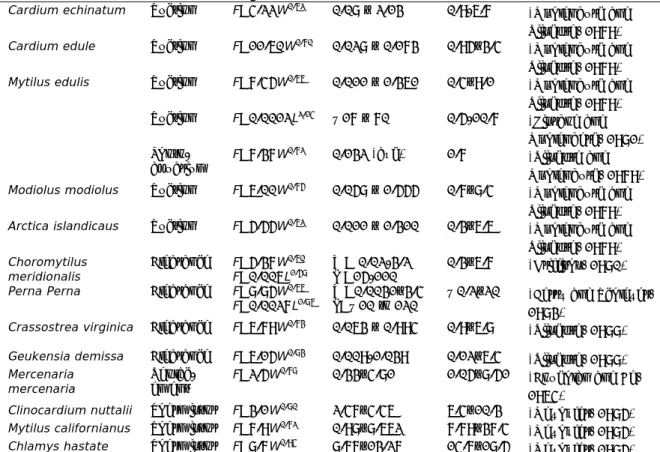
Table 2 Filtration rate (F, L per hour) data reported in the literature for a range of shellfish (modified from (Riisgård, 2001) with reference to original papers)
Shellfish Method Regression* Shellfish size* L hour-1 Reference
Cardium echinatum Suction F=4.22W0.62 0.08 – 2.13 0.9-6.7
(Møhlenburg and Riisgård, 1979)
Cardium edule Suction F=11.60W0.70 0.028 – 0.173 0.95–3.4
(Møhlenburg and Riisgård, 1979)
Mytilus edulis Suction F=7.45W0.66 0.011 – 1.361 0.4–9.1
(Møhlenburg and Riisgård, 1979) Suction F=0.0012L2.14 ~17 – 70 0.5-10.7 (Kiørboe and Møhlenberg, 1981) Photo-aquarium F=7.37W 0.72 0.132 (avg) 1.7 (Riisgård and Møhlenburg, 1979)
Modiolus modiolus Suction F=6.00W0.75 0.058 – 1.555 0.7–8.4
(Møhlenburg and Riisgård, 1979)
Arctica islandicaus Suction F=5.55W0.62 0.011 – 1.310 0.3–6.6
(Møhlenburg and Riisgård, 1979) Choromytilus meridionalis Clearance F=5.37W 0.60 F=0.006L1.58 W= 0.02-3.2 L =15-110 0.3–6.7 (Griffiths, 1980)
Perna Perna Clearance F=8.85W0.66
F=0.0027L1.86 W=0.0031–3.4 L=~10 to 120 ~0.2–20 (Berry and Schleyer,
1983)
Crassostrea virginica Clearance F=6.79W0.73 0.063 – 0.994 0.9–6.8
(Riisgård, 1988)
Geukensia demissa Clearance F=6.15W0.83
0.009-1.039 0.12–6.4 (Riisgård, 1988)
Mercenaria
mercenaria Replac-ement F=2.5W
0.78 0.33–4.81 1.05–8.51
(Coughlan and Ad, 1964)
Clinocardium nuttalii Thermistor F=3.1W0.80 2.47–4.46 6.4–10.3
(Meyhöfer, 1985)
Mytilus californianus Thermistor F=7.9W0.72 0.98–8.662 7.79–37.4
(Meyhöfer, 1985)
Chlamys hastate Thermistor F=8.7W0.94 8.77–13.27 14.7–18.5
(Meyhöfer, 1985)
* either mass dry weight (g; W) or shell length (mm; L)
2.3.3 Retention rate of HAV in shellfish
Table 3 includes a summary of the data identified from studies published in the literature on the bioaccumulation of viruses in shellfish. While a great deal of work has been undertaken on the potential for shellfish to bioaccumulate viruses, no studies were identified that related the accumulation of viruses to the shellfish pumping rate as proposed for the hazard pathway. All studies on bioaccumulation rate related the concentration of seeded virus in the water to the concentration or prevalence of viruses identified in the oyster tissue
(Table 3), without explicit quantitative consideration of virus retention efficiency of the shellfish.
The studies show that uptake of viruses occurs quickly with maximum uptake occurring within the first 24 hours (Girolamo et al., 1975); however, rates vary between virus types. Feeding activity is essential for virus accumulation and for
virus clearance (Enriquez et al., 1992). The primary site for accumulation is the digestive tissue (Girolamo et al., 1975), however results of poliovirus
accumulation reported by (Girolamo et al., 1975) suggested a diffusion of virus from the digestive region into the body of the oyster.
A study from Enriquez et al. (Enriquez et al., 1992) specifically present detailed data on the retention rate for HAV in mussels. These data were used to calculate the number of HAV per mussel and subsequently the fraction of the total HAV count in the water that is retained by a single mussel per hour of filtration. These estimations assume a constant filtration rate in time. The mean proportion retained was estimated at 0.03 (95% uncertainty interval: 0.01 - 0.20). The latter uncertainty was assessed by employing
Markov Chain Monte Carlo (MCMC) simulation using the likelihood function in the so-called Metropolis-Hastings algorithm (Gilks et al., 1996). This uncertainty distribution can be approximated by a lognormal distribution with µ=-3.244 and σ=0.775, although for a more accurate representation of the uncertainty the MCMC posterior should be used (to be obtained as text file from the
corresponding author). The most likely distribution that describes the variation in the mean proportion of HAV retained was estimated to be the Beta
distribution with α=0.289 and β=8.82.
Important limitations of the available data for this purpose however include: no studies accounted for or explicitly reported the recovery efficiency of
their detection methods in water or viruses;
often the total mass of shellfish tissue was not reported, only an inferred concentration of viruses per gram, therefore limiting a particle balance approach.
Removal of viruses from the water column during experimental conditions has been shown to also occur due to passive adsorption to the oyster tissue or shell, and the accumulation of viruses as a result of active filtration only represented approximately one half of the total removed from suspension (Bedford et al., 1978).
2.3.4 Depuration rate of HAV in shellfish
Depuration is the process of placing shellfish in clean water for several days to allow them to purge contaminants. Depuration is effective for the removal of bacteria, however studies show that it is less effective for viruses, and depurated shellfish have been associated with outbreaks of viral illness nevertheless (Grohmann et al., 1981; Le Guyader et al., 2008). Virus are suggested to be removed more efficiently from actively feeding shellfish than from those that are not (Enriquez et al., 1992).
Infectious HAV is removed by 1 Log10 unit after seven days of depuration from Mytilus chilensis, whereas poliovirus was reduced by >5 Log10 over the same
duration (Enriquez et al., 1992). Love et al. (Love et al., 2010) bioaccumulated HAV in C. virginica and estimated the daily log10 reduction of culturable HAV at
zero at 12oC and 18oC, and at 0.3 per day at 25oC. Depuration rates were not
affected by salinity, pH, algae content, and turbidity. Mcleod et al. (McLeod et al., 2009) similarly found no significant reduction in the number of HAV in C. gigas. Furthermore, Nappier et al. (2010) showed that the proportion of C. ariakensis and C. virginica oysters with HAV RNA is time-independent until at least 29 days of depuration. These data suggest that the efficiency of depuration on the number of infectious HAV or HAV RNA in oysters and mussels is minimal
Table 3 Overview of quantitative data from the literature on bioaccumulation of viruses in shellfish
Shellfish Virus Method Spike Vol. Temp Conc L-1 N Max. contamination Time Reference
Crassostrea
gigas Polio Culture 3.5 L 13 1.9 × 10
7 pfu 4-6 4.6×10³ pfu.g-1(46%-88%) 12h-48h (Girolamo et al., 1975)
Ostrea lurida Polio Culture 3.5 L 13 1.9×10⁷ pfu 10-12 8.6×10³ pfu.g-1 12h-48h (Girolamo et al., 1975)
Crassostrea
glomerata Reo III Absorb. 9×10
10 4 L 19 NR† 3 3.1× 10¹⁰ (oyster tissue) 30-40h (Bedford et al., 1978)
Mytilus edulis Polio Culture NR 13 L 15-20 5.0×10⁵-5.0×10⁶ NR 105.5 pfu.g-1 24h (Power and Collins, 1989)
Mytilus chilensis HAV Culture 1.5×10⁷ TCID
50 1 L 12 1.5×10⁷ TCID50 4 3.2 × 10⁵ TCID50 per mL‡ 24h (Enriquez et al., 1992)
Myltilus spp Rota Culture 107–108 MPNCU 4 L 21-23 8.0 ×10⁶ MPNCU 40 1.1 × 10⁴ MPUCU.g-1 (35%) 6h (Abad et al., 1997b)
Adeno Culture 107–108 MPNCU 4 L 21-23 2.5 ×10⁷ MPNCU 40 1.7 × 10⁵ MPUCU.g-1 (25%) 6h (Abad et al., 1997b)
HAV Culture 107–108 MPNCU 4 L 21-23 NR 40 (56%) data not given 6h (Abad et al., 1997b)
Polio 1 Culture 107–108 MPNCU 4 L 21-23 NR 40 (4%) data not given 6h (Abad et al., 1997b)
Crassostrea
gigas RotaVLP Absorb. 5 × 10
14 3000 L 22 1.7 × 10¹¹ 100-120 1 × 10¹² g-1 24h (Loisy et al., 2005)
RotaVLP Absorb. 5 × 10¹² 3000 L 22 1.7 × 10⁹ 100-120 1 × 10¹⁰ g_1 24h (Loisy et al., 2005)
RotaVLP Absorb. 5 × 10⁸ 3000 L 22 1.7 × 10⁵ 100-120 1 × 10⁶ g-1 24h (Loisy et al., 2005)
RotaVLP Absorb. 5 × 10⁸ 3000 L 22 1.7 × 10⁵ 100-120 1 × 10⁶ g 24h (Loisy et al., 2005)
Crassostrea
gigas NoV GII qRT-PCR 50 L 10±2 2.77±0.59 Log10 10 1.7 × 10
3 g-1 (SD=1.6×10³) 72h (Ueki et al., 2007) Fel. calici f4 qRT-PCR 50 L 10±2 2.87±0.6 Log10 10 2.2 × 10 3.g-1 (SD=1.6 × 10³) 72h (Ueki et al., 2007) Crassostrea virginica mNoV RT-PCR
** 14 L 20-23 106 pfu 45 18 positive (dig. divert.) 24h (Nappier et al., 2008)
NoV
GG1 RT-PCR 14 L 20-23 10
6 PCR units 45 7 positive (dig. divert.) 24h (Nappier et al., 2008)
HAV RT-PCR** 14 L 20-23 106 pfu 45 8 positive (dig. divert.) 24h (Nappier et al., 2008)
Polio RT-PCR** 14 L 20-23 106 pfu 45 2 positive (dig. divert.) 24h (Nappier et al., 2008)
Crassostrea
arakensis mNoV RT-PCR
** 14 L 20-23 106 pfu 54 37 positive (dig. divert.) 24h (Nappier et al., 2008)
NoV
GG1 RT-PCR 14 L 20-23 10
6 PCR units 54 30 positive (dig. divert.) 24h (Nappier et al., 2008)
HAV RT-PCR** 14 L 20-23 106 pfu 54 27 positive (dig. divert.) 24h (Nappier et al., 2008)
Polio RT-PCR** 14 L 20-23 106 pfu 54 1 positive (dig. divert.) 24h (Nappier et al., 2008)
† NR: Not reported
‡ per mL of mussel extract. Total of 8 mL extract analyzed
and therefore does not need to be included in a quantitative risk assessment model.
In addition to quantitative data, presence/absence data on depuration of viruses have been reported (Table 4). These studies have demonstrated that depuration rates do vary between shellfish species (Nappier et al., 2008) and that individual oysters can harbour and retain up to three viruses simultaneously for four weeks after the initial exposure to virally contaminated water (Nappier et al., 2008). A longer-term purification process than depuration can also be applied, and is referred to as relaying (often more than ten days). Harvested shellfish are then transferred from a contaminated area to a clean area and laid on the ocean floor in racks. The only quantitative data identified in this review on the efficacy of relaying for the removal of viruses were reported by Loisy et al. (2005) using rotavirus virus-like particles as surrogates for viruses. In that study (see Table 5) approximately 70 days were required to achieve a 4 Log10 reduction in
virus concentration. While relaying can provide effective removal of bacteria, very long durations of relaying would be required for efficient virus removal, and maintaining the integrity (free of subsequent viral contamination) of the relaying site for the required duration is a challenge.
2.3.5 Inactivation rate of HAV in shellfish
Under natural conditions inactivation of viruses in shellfish may occur at varying rates, depending on shellfish species and virus type (McLeod et al., 2009). To assess the level of virus inactivation, the ratio of infectious viral particles to the number of PCR amplifiable units was calculated in bioaccumulated pacific oysters (McLeod et al., 2009). Bioaccumulation of HAV resulted in a ratio of 0.66±0.06, indicating that most of the HAV in the oyster gut was still infectious. After a depuration period of 23 hours, a large proportion of HAV was still
infectious with a ratio of 0.44±0.03.
Thorough cooking is the most effective method for inactivating virus
contamination of food. However, for shellfish, high temperatures can affect the texture of the meat making it less palatable. In practice, cooking of shellfish is therefore often brief, and sufficient temperatures for virus inactivation may not be achieved. Bertrand et al. (Bertrand et al., 2012) estimated the temperature dependent inactivation rate for different viruses in ‘simple’ (i.e., media and water) and ‘complex’ (i.e., sewage, soil and mussels) matrices at temperatures below and above 50oC. The analyses included HAV and the results for complex
matrices are relevant for estimating inactivation rates in shellfish. Using their results, the estimated time to first log10 unit reduction (TFL) of infectious HAV at
4oC, 20oC and 56oC was 76 (95% prediction interval: 6–928), 25 (2–302) and
0.003 (0.0002–0.04) days, respectively. The estimated TFL for HAV based on RT-PCR detection mounted to 0.007 (0.001–0.09) days for exposure to a temperature of 56oC. Estimates for temperatures <50oC were not reported.
High pressure is an emerging process intervention to inactivate viruses in shellfish and to facilitate the shucking of oysters. Commercial processors use around 275 – 300 MPa of pressure for around three minutes to disinfect oysters. The advantage of the process is that the taste and texture of the shellfish are similar to the raw product, however with a partially cooked appearance. Calci et al. (2005) investigated the inactivation of HAV by high pressure treatment within oysters. Oysters that had been allowed to accumulate HAV were subsequently exposed to varying levels of pressure treatment. Similarly, Terio et al. (2010) investigated the impact of pressure treatment of mussels
contaminated with HAV. The results from those studies are summarized in Table 6. Both studies applied tissue culture assay since HAV inactivation by pressure does not appear to release the viral RNA molecule from the capsid (Kingsley et al., 2002). Using these data to estimate HAV decay with a
monophasic decay model (for details on the model see Verhaelen et al., 2012), the inactivation rate was estimated at 0.0068 (95% interval: 0.0049 – 0.0091) per MPa pressure increase within the range of 300 to 400 MPa. There was no statistically significant difference between the different experiments and time of pressure applied. The HAV concentration after exposure to pressure P for up to five min can therefore be estimated from the initial HAV concentration, C0,
Shellfish Location Virus Quantification by Initial concentration Max Log10
reduction Time (hrs) Tank details Reference
Ostrea lurida US Poliovirus Cell culture 3.4 × 10³ pfu.g-1 1.4 48 Stationary (Girolamo et
al., 1975)
Mytilus edulis Ireland Poliovirus Cell culture 105.5 pfu.g-1 1.86 52 Continuous flow (Power and
Collins, 1989)
E. coli 103.7 cfu.g-1 2.8 52 (Power and
Collins, 1989) Coliphage
ɸ A1 – 5a 10
2.2 pfu.g-1 2.16 52 (Power and
Collins, 1989)
Mytilus chilensis Chile HAV Cell culture ~ 105 TCID
50 1 168 Stationary (Enriquez et
al., 1992)
Poliovirus ~107 TCID
50 >5 3 Stationary (Enriquez et
al., 1992)
Myltilus spp Spain Rotavirus Cell culture – 96 well
– microtiter plates 1.1 × 10
4 MPUCU.g-1 1.52 96 Continuous flow (Abad et al.,
1997b)
Human Adenovirus
type 40 1.7 × 10
5 MPUCU.g-1 2.74 96 Continuous flow (Abad et al.,
1997a)
HAV data not given 1.89 96 Continuous flow (Abad et al.,
1997a)
Poliovirus 1 data not given 3 48 Continuous flow (Abad et al.,
1997a) Crassostrea
gigas France Rotavirus VLP Spectrophotometer 1 × 10
12 g dissected
tissue from ten oysters 1.5 168 Continuous flow (Loisy et al., 2005)
1 × 10¹⁰ g dissected
tissue from ten oysters 1 168 (Loisy et al., 2005)
1 × 10⁶ g dissected
tissue from ten oysters 1 168 (Loisy et al., 2005)
Crassostrea gigas
(Pacific oysters)
Japan Norovirus GII qRT-PCR Average 1.7 ×
103 copies.g-1 (SD=1.6
× 103)
0 240 Continuous flow (Ueki et al.,
2007)
Feline Calicivirus f4 qRT-PCR Average 2.2 ×
103 copies.g-1
(SD=1.6 × 10³)
3 72 Continuous flow (Ueki et al.,
2007) *Spike produced and analysed by cell-culture; oysters analysed by RT-PCR; NR: Not reported
Table 5 Reductions of numbers of VLPs in oysters under relaying conditionsa
(reproduced from (Loisy et al., 2005)) No. of days of
relaying Expt A Log10 of VLP concentration in oyster tissue for: Expt B Expt C
0 10.5 9 5 7 10 9 5 14 10 8 4.5 21 8.5 8 ND 30 ND ND 4 37 ND ND 4 41 7.5 6.5 <4 49 7 6 ND 70 ND 5 ND 82 5 <4 ND 89 <4 ND ND
aAfter 1 week of depuration, oysters were placed on the shore under the influence of tides
for a natural relaying. Samples were collected and analysed by ELISA In duplicates. ND: analysis not done.
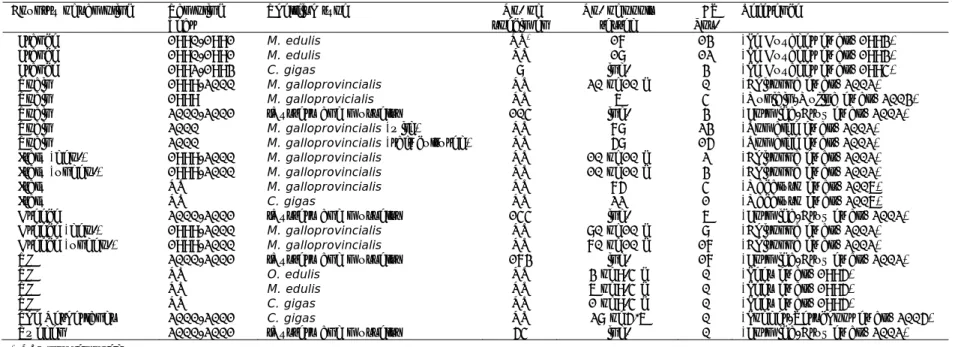
2.3.6 HAV in harvested shellfish
A large number of studies have been undertaken to assess the prevalence of HAV in mussels and oysters in Europe (see Table 7). An important aspect to consider in comparing the percentages is the different analytical methods that were used in the presented studies. These differences will lead to different estimates for the concentration when applied to the same samples. These differences are caused by different sensitivities of methods, different detection limits, and in case of real-time RT-PCR possibly different quantification methods. Furthermore, if suboptimal amplification efficiencies, e.g. due to inhibition, are neglected, then virus concentrations will be underestimated. Approaches to tackle such aspects in quantification were recently published (D'Agostino et al., 2011; Lees, 2010). The subsequent quantification ideally comprises a level of variation or uncertainty, which is currently not reported. Such information is essential to include in quantitative microbiological risk assessment and can be obtained using the raw data from the experiments. An example of including uncertainty in concentration estimates from real-time RT-PCR can be found in Verhaelen et al (2012). In this approach, the uncertainty of the standard curve is included in the uncertainty of the subsequent count derived from the Ct-value, which is more representative of the uncertainty.
Table 6. Reported efficiency of pressure treatment for virus inactivation
Pressure applied (MPa)
Time (m) 0 300 325 350 375 400 Reference
Crassostrea
virginica Logreduction 10 pfu 1 5.8 5.6 5.0 4.5 3.5 2.7 (Calci 0.2 0.8 1.3 2.3 3.2 2005) et al.,
M. edulis Log10pfu 5 6.2 6.0 5.5 4.4 3.7 3.3 (Terio et al.,
2010)
reduction 0.1 0.7 1.7 2.5 2.9
M.
Country of sampling Sampling
Year Shellfish type specimen No. of No. of pools tested HAV Pos. Reference
Retail
Switzerland 2001-2002 C. gigas/O. edulis 435 87 of 5 spec. 0 (Beuret et al., 2003)
Switzerland 1996 C. angulata and O. edulis 3 ind. 0 (Hafliger et al., 1997)
Switzerland 1996 M. edulis 3 Ind. 0 (Hafliger et al., 1997)
Italy or unknown 1999-2000 M. galloprovincialis NR* 100 of 10 g 23 (Chironna et al., 2002)
Italy NR M. edulis 89 ind. 30 (De Medici et al., 2001)
Spain 2010 M. galloprovincialis 51 ind. 0 (Diez-Valcarce et al., 2012)
Greece 2010 M. galloprovincialis 51 ind. 0 (Diez-Valcarce et al., 2012)
Finland 2010 M. edulis 51 ind. 0 (Diez-Valcarce et al., 2012)
Class A growing area
Spain 1999 M. edulis NR 2 0 (Muniain-Mujika et al., 2003)
Spain 1999 C. gigas NR 5 0 (Muniain-Mujika et al., 2003)
Italy 2005-2006 M. galloprovincialis 120 24 of 5 spec. 0 (Suffredini et al., 2008)
The Netherlands 2000-2001 C. gigas NR 28 of 5/6 spec. 0 (Lodder-Verschoor et al., 2005)
The Netherlands 2000-2001 O. edulis NR 10 of 5/6 spec. 0 (Lodder-Verschoor et al., 2005)
Class B growing area
France 1995-1998 C. gigas NR 108 0 (Le Guyader et al., 2000)
Spain 1998-1999 M. edulis NR 35 8 (Muniain-Mujika et al., 2003)
Spain 1999 C. gigas NR 10 2 (Muniain-Mujika et al., 2003)
Italy 2005-2006 M. galloprovincialis 240 48 of 5 spec. 0 (Suffredini et al., 2008)
Italy 2003-2004 M. galloprovincialis 53 ind. 2 (Croci et al., 2007)
Italy 2003-2004 Ostrea spp. 8 ind. 0 (Croci et al., 2007)
Italy NR Mytilus 36 ind. 14 (Croci et al., 2000)
Spain 2005 M. galloprovincialis NR 24 of ≥10 spec. 0 (Vilarino et al., 2009)
Portugal 2008-2009 Mytilus spp. NR 9 of ≥20 g DT 5 (Mesquita et al., 2011)
Class C or D growing area
France 1995-1998 M. galloprovincialis NR 73 6 (Le Guyader et al., 2000)
Spain 2005 M. galloprovincialis NR 12 of ≥10 spec. 0 (Vilarino et al., 2009)
Portugal 2008-2009 Mytilus spp. NR 5 of ≥20 g DT 4 (Mesquita et al., 2011)
Portugal 2008-2009 O. edulis NR 7 of ≥20 g DT 1 (Mesquita et al., 2011)
Various or unspecified
France 1992-1993 M. edulis 10 ind. 0 (Le Guyader et al., 1994)
France 1990-1991 M. edulis NR 19 12 (Le Guyader et al., 1993)
Table 7 Continued
Country of sampling Sampling
Year Shellfish type specimen No. of No. of pools tested HAV Pos. Reference
France 1990-1991 M. edulis NR* 17 13 (Le Guyader et al., 1993)
France 1990-1991 M. edulis NR 18 12 (Le Guyader et al., 1993)
France 1992-1993 C. gigas 8 ind. 3 (Le Guyader et al., 1994)
Spain 1999-2000 M. galloprovincialis NR 20 of 10 g 0 (Chironna et al., 2002)
Spain 1999 M. galloprovicialis NR 6 4 (Muniain-Mujika et al., 2003)
Spain 2000-2001 ‘Oysters and mussels’ 104 ind. 3 (Formiga-Cruz et al., 2002)
Spain 2000 M. galloprovincialis (wild) NR 78 23 (Romalde et al., 2002)
Spain 2000 M. galloprovincialis (raft cultured) NR 58 15 (Romalde et al., 2002)
Italy (dep.) 1999-2000 M. galloprovincialis NR 10 of 10 g 2 (Chironna et al., 2002)
Italy (undep.) 1999-2000 M. galloprovincialis NR 10 of 10 g 3 (Chironna et al., 2002)
Italy NR M. galloprovincialis NR 75 4 (Macaluso et al., 2006)
Italy NR C. gigas NR 22 1 (Macaluso et al., 2006)
Greece 2000-2001 ‘Oysters and mussels’ 144 ind. 6 (Formiga-Cruz et al., 2002)
Greece (dep.) 1999-2000 M. galloprovincialis NR 80 of 10 g 8 (Chironna et al., 2002)
Greece (undep.) 1999-2000 M. galloprovincialis NR 70 of 10 g 17 (Chironna et al., 2002)
UK 2000-2001 ‘Oysters and mussels’ 173 ind. 17 (Formiga-Cruz et al., 2002)
UK NR O. edulis NR 3 of 9.4 g 0 (Lees et al., 1995)
UK NR M. edulis NR 6 of 9.4 g 0 (Lees et al., 1995)
UK NR C. gigas NR 1 of 9.4 g 0 (Lees et al., 1995)
The Netherlands 2000-2001 C. gigas NR 28 of 5/6 0 (Lodder-Verschoor et al., 2005)
Sweden 2000-2001 ‘Oysters and mussels’ 54 ind. 0 (Formiga-Cruz et al., 2002)
2.3.7 Consumption of shellfish
Previous studies reported that a consumption event consists of approximately eight to ten oysters (Lowther et al., 2010). A web survey of 25 menus from Dutch restaurants showed approximately similar results, with a medium of six oysters with a range from 5 to 12 (unpublished data).
A national food consumption survey was recently conducted in the Netherlands, where people between 6 and 79 years of age were asked to register food intake during two days. Data for specific food items were not yet available when this report was finished, but are expected to become available in 2013.
3
Hepatitis E virus in pork
3.1 Introduction
Hepatitis E virus (HEV) is the aetiological agent of non-HAV enterically transmitted hepatitis recently classified in the genus Hepevirus of the family Hepeviridae. HEV has at least two distinct epidemiological profiles: (1) large outbreaks and epidemics in developing countries, usually caused by HEV genotype 1, resulting in high morbidity and mortality among pregnant women and young children, and (2) very few symptomatic cases of HEV genotype 3, most cases without symptoms or clear source(s) of infection, but frequent seroreactivity in 5%-21% of asymptomatic persons in developed countries. Though the first is largely considered to be the result of a water-borne infection, the latter is suspected to result from foodborne zoonoses.
It is generally accepted that hepatitis E is mostly self-limited and rarely progresses to chronicity. HEV infections have a higher mortality in pregnant women compared to non-pregnant individuals, where the disease condition is accentuated with the development of fulminant liver disease. Clinical
manifestations of HEV infection vary widely from asymptomatic infection to uncomplicated acute viral hepatitis and fulminant hepatic failure. No anti-HEV treatment exists but two subunit vaccines containing recombinant truncated capsid proteins of HEV have been shown to be highly effective in preventing the disease (Zhu et al., 2010); however, these are not yet commercially available (Kamili, 2011).
HEV is a pathogenic virus for humans, but susceptibility to the virus can be found among a whole range of animals, including domestic pigs (Meng, 2010). Domestic pigs are most abundantly examined from all animal species, and found to be massively infected.
In Europe, no evidence for one main transmission route of HEV infection or risk factor for hepatitis E could be identified; however, zoonotic transmission seems likely (Lewis et al., 2010). HEV has been detected in multiple animal and environmental sources with the highest prevalence in domestic pigs (Rutjes et al. 2009). Pig products such as pig livers were shown to contain HEV
(Bouwknegt et al., 2007). Also 20/39 muscle samples from pigs contact-infected by HEV in an experiment contained HEV RNA suggesting possible foodborne transmission through pork meat consumption (Bouwknegt et al., 2009b). Contamination of meat is likely a consequence of viremia, suggesting that meat obtained from pigs in the acute phase of infection at slaughter can be
contaminated by HEV (Bouwknegt et al., 2009b). Recently, the consumption of raw pig liver sausages was implicated in hepatitis E disease in patients in France (Colson et al., 2010). Previously, HEV infection was associated with the
consumption of uncooked deer meat (Tei et al., 2003) substantiated with a matched case-control study (Tei et al., 2004). HEV was also detected in a proportion of the Dutch deer and wild boar(Rutjes et al., 2010; Rutjes et al., 2009b). Consumption of uncooked meat, still practised worldwide, is generally considered a risk for infection and disease, now shown for HEV. This risk may be averted by cooking (Emerson et al., 2005; Feagins et al., 2008), but risk
management options seem to be limited. To be able to estimate public health risks from consumption of contaminated meat (products) by QMRA, quantitative
data on virus concentrations in meat need to be collected. Therefore,
quantitative data on HEV in the different phases of the meat production chain from HEV in farms to HEV in meat on the market were gathered for risk assessments with the purpose of informing risk management.
3.2 Components of the conceptual risk assessment model
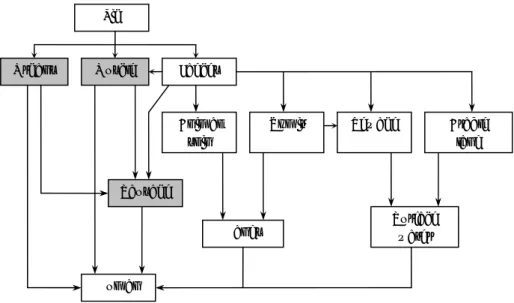
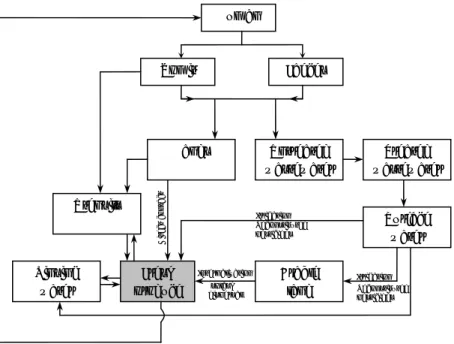
Hepatitis E virus can infect a broad range of animals and thereby provide multiple possible sources of zoonotic infection from consumption of meat and meat products. Domestic pigs have been studied most frequently of all animal species and high prevalence rates of over 50% are common on European pig farms (e.g. Rutjes et al., 2007). Furthermore, HEV spreads among pigs, and therefore pigs have the potential to be an animal reservoir (Bouwknegt et al., 2008b). Therefore the exposure to HEV will focus on pork in this QVRP. Exposure of humans to porcine HEV can occur via direct contact with pigs (Bouwknegt et al., 2008a; Withers et al., 2002), via indirect transmission (e.g., associated with water due to HEV runoff from land into surface waters after fertilization), or via consumption of pork products (Figure 2). This QVRP for HEV focuses on the latter route. Pork and pork products can become contaminated through two routes:
intrinsic contamination because a pig is systemically infected with HEV; extrinsic contamination due to cross contamination with faeces, bile or
blood.
Both routes will be considered in the conceptual model detailed below. As a result of the intrinsic HEV infection of pigs, pork meat (products) may be contaminated with HEV. Consumption of these products may lead to HEV exposure, and possibly to HEV infection and hepatitis E. The exposure of humans can be quantified as the ingested dose per consumption event, which consists of the sum of the infectious HEV per gram of final pork product and the amount of meat consumed. Sparse meat consumption data are gathered from the Dutch Food Consumption Surveys, which can be used as baseline scenarios in the risk analysis. The number of infectious HEV in the final pork product depends on the number of HEV per gram of tissue, the dilution of that amount due to mixing with negative ingredients during processing and HEV-inactivation during processing and preparation prior to consumption. The exposure related to extrinsic contamination of pork products similarly depends on the sum of the infectious HEV per gram of final pork product and the amount of product consumed. The amount of infectious HEV per gram of product depends on the HEV concentration in the contaminating substance (e.g.,
faeces), on the amount of substance transferred to the pork product and on processing factors that dilute or remove infectious HEV from the pork product (e.g., washing-off or heat inactivation).
Figure 2 Conceptual exposure pathway with the most predominant routes for HEV contaminated pork meat consumption. Blood is not included explicitly in this scheme, but is considered a source for contamination of organs and meat.
3.3 Component quantification
3.3.1 Prevalence of HEV infection in pigs at slaughter
An important determinant for the risk associated with HEV infection due to pork consumption is the prevalence of HEV infection in pigs at slaughter, when pigs are about 26 weeks of age. This prevalence depends on the epidemiology of HEV infections in pigs. At the age of two weeks, pigs can become infected and
excrete HEV faecally (Fernandez Barredo et al., 2006; LeBlanc et al., 2007). The highest prevalence of faecal HEV excretion is observed among pigs from ten weeks of age until three months (LeBlanc et al., 2007; Nakai et al., 2006; Seminati et al., 2008). This finding might indicate that HEV infection occurs soon after the onset of fattening, when pigs are about ten weeks of age. During the fattening period, the prevalence of infected pigs can reach up to 100%
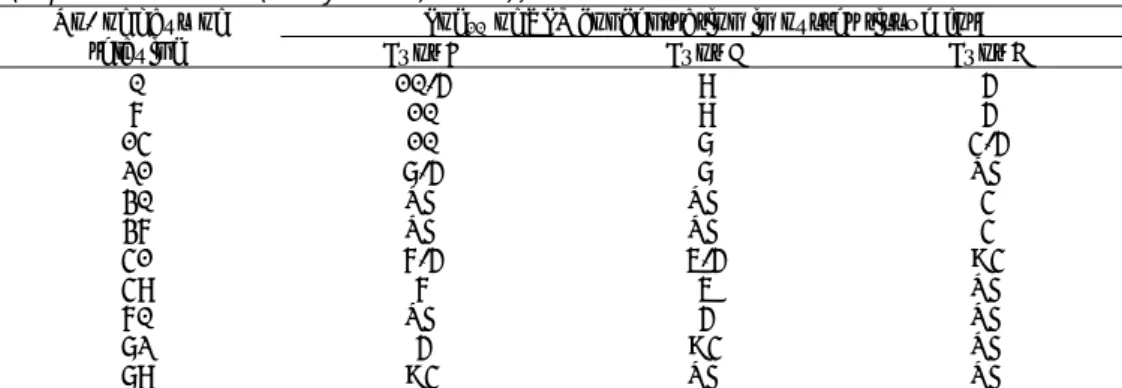
(Takahashi et al., 2003). The reported HEV prevalence at slaughter is lower again due to successful clearance of the virus by pigs during the fattening period. Table 8 lists an overview of HEV RNA prevalence at pigs of slaughter age, collected either at pig farms just prior to slaughter, or at slaughterhouses. In the European FP7 project ‘VITAL’, individual faeces, muscle and liver samples were collected from pigs in slaughterhouses in four different countries to
estimate the number of infected pigs at slaughter (Di Bartolo et al., 2012). The results are reproduced in Table 9. The data were combined to estimate the scale and shape parameter of a Beta(α, β) distribution using beta-regression
(Espinheira et al., 2008; Ferrari and Cribari-Neto, 2004). The values for the parameter of the beta distribution were estimated as part of this QVRP using Mathematica v8 (Wolfram Research Inc., USA). The estimated Beta-distribution for the variation of proportion of pigs infected with HEV at slaughter mounted to Beta(0.93, 3.6), with mean 0.20 and 95% interval from 0.01 to 0.63.
3.3.2 Fraction of infected pigs that are viremic
The contamination of meat and organs, other than the liver, is most likely the result of HEV being present in the bloodstream (i.e., when pigs are viremic), because HEV does not replicate in organs other than liver and possibly the intestines (Williams et al., 2001). HEV detection in faeces, (i.e., when pigs are
Pig
Organs Muscle Faeces
Animal skin Vomit Surface water Sausage Hands Human Arable land Sewage
excretic) is generally used to assess whether a pig is currently infected or not (presence of antibodies in serum is a measure of past infection). Only a fraction of the pigs that are found to excrete HEV faecally (here referred to as ‘excretic pigs’) are in the viremic state of infection. The period during which HEV can be detected in faeces usually spans the period of viremia (Bouwknegt et al., 2009b). When the subpopulation of examined pigs is selected randomly at or close to slaughter, then the average fraction of viremic pigs among the excretic pigs is approximately proportional to the ratio between the length of the viremic period and the excretic period. The length of the excretic period was estimated for contact-infected pigs to be 23.3 days (95% interval: 18.7 – 27.9) and the viremic period 10.5 days (8.1 – 13) (Bouwknegt et al., 2009b). The ratio between the two is therefore 10.5/23.3=0.45 (95% interval obtained by MC simulation of the fraction with 106 iterations: 0.33 – 0.61). Thus, on average
Table 8 The prevalence of HEV RNA in pigs of slaughter age sampled at farms or at slaughterhouses, based on different sample types
No. of HEV
positive Remark Reference
Country farms pigs
Faeces
Japan 3 36 3 (8%) sampled on farm; 6 months
old (Nakai et al., 2006)
Canada 1 51 21 (41%) simulated commercial farm;
sampled at slaughter (LeBlanc et al., 2007)
Spain NR* 28 2 (7%) sampled on farm (Fernandez Barredo et al., 2006)
Italy NR 20 13 (65%) 3-4 months old; sampled at
slaughter (Di Bartolo et al., 2012)
Italy NR 28 3 (11%) 9-10 months old; sampled at
slaughter (Di Bartolo et al., 2012)
Canada 1 43 6 (14%) simulated commercial farm;
sampled at slaughter (LeBlanc et al., 2010)
Spain 5 23 0 (0%) sampled at slaughter (Casas et al., 2011)
Italy NR 150 11 (7%) 9-12 months old; sampled at
slaughter (Di Martino et al., 2010)
Nether-lands 10 50 7 (14%) five pigs sampled per farm, at the slaughterhouse; three of ten farms positive
(Rutjes et al., 2009a)
Blood
Canada 1 51 6 (12%) simulated commercial farm;
sampled at slaughter (LeBlanc et al., 2007)
Canada 1 43 1 (2%) simulated commercial farm;
sampled at slaughter (LeBlanc et al., 2010)
Bile
Italy NR 19 13 (68%) 3-4 months old; at
slaughterhouse (Di Bartolo et al., 2012) Italy NR 26 10 (38%) 9-10 months old; sampled at
slaughter (Di Bartolo et al., 2012)
Brazil NR 115 11 (10%) sampled at three
slaughterhouses (Dos Santos et al., 2011)
Canada 1 43 8 (19%) simulated commercial farm;
sampled at slaughter (LeBlanc et al., 2010)
Spain 6 80 5 (6%) sampled at slaughter (Casas et al., 2011)
Liver
Japan NR 363 7 (2%) sampled at retail (Yazaki et al., 2003)
Nether-lands NR 62 4 (6%) sampled at retail (Bouwknegt et al., 2007)
United
States NR 127 14 (11%) sampled at retail (Feagins et al., 2007) United
Kingdom NR 80 0 (0%) sampled at retail (Banks et al., 2007)
Italy NR 20 6 (30%) 3-4 months old; sampled at
slaughter (Di Bartolo et al., 2012)
Italy NR 28 4 (14%) 9-10 months old; sampled at
slaughter (Di Bartolo et al., 2012)
Canada 1 43 9 (21%) simulated commercial farm;
sampled at slaughter (LeBlanc et al., 2010) France 186 3715 128 (4%) prevalence estimate
accounts for survey design (Rose et al., 2011)
China NR 114 4 (4%) sampled at slaughter (Li et al., 2009)
Spain 6 96 6 (6%) sampled at slaughter (Casas et al., 2011)
Table 9 Prevalence of HEV RNA (number positive/number examined) at slaughterhouses in four different European countries (Di Bartolo et al., 2012)
Country Faeces Liver Meat Pigs
Country A 1/40 (3%) 2/40 (5%) 1/40 (3%) 3/40 (8%)
Country B 14/34 (41%) 2/33 (6%) 2/33 (6%) 17/34 (50%)
Country C 15/39 (38%) 1/39 (3%) 0/40 15/40 (38%)
Country D 5/40 (13%) 1/40 (3%) n.d.* 6/40 (15%)
* n.d.: no data
3.3.3 Concentration of HEV in pig meat at slaughter
HEV particles are detected in samples by (RT-)PCR, which is aimed to detect specific HEV RNA from all RNA present in the sample. This method detects HEV RNA from infectious and non-infectious virus particles. This aspect is important for QMRA for viruses, because the lack of this distinction may result in
overestimation of the infection risk. Infectivity, posed by infectious HEV only, is the determinant of human infection after ingestion and thus of the infection risk. If the total HEV RNA is enumerated instead of the RNA from infectious HEV particles, then the estimated infection risk will be overestimated. Distinction between the inactivated and the infectious form of HEV cannot be made since a cell culture method for detection of infectious HEV does not exist to date. From qPCR data, assumptions can be made for QMRA regarding the fraction of infectious HEV among all HEV detected, as described previously (Bouwknegt et al., 2011).
A second difficulty in HEV quantification by RT-PCR concerns the actual absolute quantification of the initial RNA count. Two approaches for quantification exist: using a real-time RT-PCR system and relate the signal (i.e., Ct value) for samples to that of a standard curve with a presumed known genome count of a representative standard. Issues that affect the accurateness of the estimation includes amongst others the representativeness of a control sample for HEV, differences in amplification efficiency due to matrix differences (e.g. water versus faeces) and the method used for quantification of the standard. The latter is also an estimate based on some measure, such as OD, but its accurateness is poorly known.
A second approach for quantification involves an approach similar to most probable number estimation (Cochran, 1950). Based on the presence/absence detection of HEV in serial tenfold dilutions of RNA, and the assumption of homogeneous mixing, an estimate of the number of so-called PCR detectable units (PDU) is obtained. The number of HEV genomes reflected by a PDU, however, is indeterminable. In the most ideal situation, a single PDU consist of one HEV particle, but a PDU can also represent an unknown multiple of one particle. The true number of HEV particles reflected by a PDU depends on the performance of nucleic acid extraction and PCR assay, and on the test
characteristics such as sensitivity and specificity. In conclusion, both methods for quantification have their advantages and disadvantages, and the
performance of one method over the other is unknown.
The MPN approach for quantification was employed in ‘VITAL’ and the three positive meat samples from Table 10 were positive at a level of 5×10⁴ (95%
interval: 8×10³–4×10⁵) PDU, 50 (1–230) PDU and 700 (40–3200) PDU
(Bouwknegt et al., in preparation). Furthermore, meat was found positive in 20 of 39 muscle samples collected from experimentally infected pigs (Bouwknegt et
al., 2009b). The concentration of HEV in these samples was, however, not quantified. No other data on HEV concentrations in meat were found in the literature.
3.3.4 Natural inactivation rate of HEV
The infectivity of viruses is generally assessed experimentally by exposing in vitro cells with the required receptor(s) to HEV. This method is referred to as cell culture. Infectious viruses will intrude cells and replicate. This intrusion or replication is thus a measure for infectivity, and can be measured by
visualization of the infected cells using for instance immunostaining or detection of an increase in virus number. For HEV, however, no cell culture system is available that is sufficiently sensitive and practical to conduct inactivation experiments with HEV. Several studies do report successful propagation of HEV on specific cell lines or in specific culturing techniques (Berto et al., 2012; Rogee et al., 2012; Shukla et al., 2012). Further development of those systems might yield sensitive and practical cell culture systems for HEV to study its stability. Some information on the stability of HEV is available from the epidemiological studies that have been conducted. For instance, HEV of genotype 1 has been attributed to outbreaks that can last several years. Water is often the implicated source for exposure of humans to HEV (Emerson et al., 2005). Possible
explanations for prolonged outbreaks are that HEV-susceptible individuals enter the population continuously, and/or newly excreted HEV adds to the
environmental HEV source continuously. In all cases, however, HEV is unlikely to be inactivated at a large rate upon excretion by infected individuals.
3.3.5 Heat inactivation of HEV
As indicated above, the effect of temperature on the infectivity of viruses can be examined with a culture system. Such a cell culture system, however, has not been developed for HEV and robust heat inactivation studies are therefore not performed to date.
Emerson et al. (Emerson et al., 2005) showed in a cell infection experiment that the susceptibility of HEV to heat differed between HEV strains, where some were inactivated nearly completely when maintained at 56oC for 1 h (a