EU Interlaboratory comparison study
animal feed I (2008)
Bacteriological detection of Salmonella in chicken feed
Report 330604012/2009RIVM Report 330604012/2009
EU Interlaboratory comparison study animal feed I
(2008)
Bacteriological detection of Salmonella in chicken feed
A.F.A. Kuijpers C. Veenman J. van de Kassteele K.A. Mooijman Contact: A.F.A. Kuijpers
Laboratory of Zoonoses and Environmental Microbiology (LZO) angelina.kuijpers@rivm.nl
© RIVM 2009
Parts of this publication may be reproduced, provided acknowledgement is given to the 'National Institute for Public Health and the Environment', along with the title and year of publication.
Abstract
EU Interlaboratory comparison study animal feed I (2008)
Bacteriological detection of Salmonella in chicken feed
In 2008, from the 30 National Reference Laboratories (NRLs) in the European Union, 29 were able to detect high and low levels of Salmonella in chicken feed. They achieved the desired outcome at once. One laboratory was unable to produce satisfactory results neither in the follow-up test. The reasons for their failures are currently being investigated. These results were shown in the first interlaboratory comparison study on animal feed, organized by the Community Reference Laboratory (CRL) for Salmonella. The comparison study was conducted in October 2008, with the follow up in March 2009. The NRLs responsible for Salmonella detection from all European Member States are obliged to participate in this study. The CRL for Salmonella is part of the Dutch National Institute for Public Health and the Environment (RIVM).
During the study, three methods for detecting Salmonella in chicken feed were used. Two methods are standardised at international level for the detection of Salmonella in animal feed. One of those two methods was least effective as only 92 percent of the samples were found to be positive. The third, internationally prescribed method for the detection of Salmonella in veterinary samples was not
obligatory but requested by the CRL. This method gave the best results with 99 percent being positive. To perform the test, the laboratories had to follow the given instructions. Each laboratory received a package containing chicken feed and 35 gelatin capsules containing Salmonella spp. at different levels. The laboratories were instructed to spike the chicken feed with the capsules and test the samples for the presence of Salmonella.
Key words: Salmonella; CRL-Salmonella; NRL-Salmonella; interlaboratory comparison study; chicken feed; Salmonella detection methods
Rapport in het kort
EU Ringonderzoek dierenvoeder-I (2008)
Bacteriologische detectie van Salmonella in kippenvoer
In 2008 waren van de 30 Nationale Referentie Laboratoria (NRLs) in de Europese Unie er 29 in staat hoge en lage concentraties van de Salmonellabacterie in kippenvoer aan te tonen. Zij behaalden direct het gewenste niveau. Een laboratorium kon ook tijdens de herkansing niet voldoende presteren. De oorzaken van hun fouten worden nog nader uitgezocht. Dit blijkt uit het eerste ringonderzoek dat het Communautair Referentie Laboratorium (CRL) voor dierenvoeders heeft georganiseerd. Het onderzoek is in oktober 2008 gehouden, de herkansing was in maart 2009. Alle NRL’s verantwoordelijk voor Salmonelladetectie van de Europese lidstaten zijn verplicht om aan dit onderzoek deel te nemen. Het CRL-Salmonella is gevestigd bij het Nederlandse Rijksinstituut voor Volksgezondheid en Milieu (RIVM).
Tijdens de studie zijn drie analysemethodes gebruikt om de Salmonellabacterie in kippenvoer aan te tonen. Twee daarvan zijn internationaal gestandardiseerde methoden voor Salmonelladetectie in dierenvoeders. Hiervan bleek er één niet de meest effectieve methode te zijn omdat slechts in 92 procent van de monsters Salmonella werd aangetroffen. De derde, de internationaal voorgeschreven methode om Salmonella in dierlijke mest aan te tonen, is niet verplicht maar is op verzoek van het CRL uitgevoerd. Deze methode behaalde het beste resultaat met 99 procent positieven.
De laboratoria moeten de test volgens voorschrift uitvoeren. Elk laboratorium kreeg een pakket toegestuurd met kippenvoer en 35 gelatinecapsules met melkpoeder dat verschillende
besmettingsniveaus Salmonella bevatte. De laboratoria moesten vervolgens het kippenvoer en de capsules samenvoegen en onderzoeken of er Salmonella in aanwezig was.
Trefwoorden: Salmonella; CRL-Salmonella; NRL-Salmonella; ringonderzoek; kippenvoer; Salmonelladetectiemethode
Contents
List of abbreviations 9
Summary 11
1 Introduction 13
2 Participation 15
3 Materials and methods 17
3.1 Reference materials 17
3.2 Chicken feed samples 17
3.2.1 General 17
3.2.2 Total bacterial count in chicken feed 18
3.2.3 Number of Enterobacteriaceae in chicken feed 18 3.3 Design of the interlaboratory comparison study 18
3.3.1 Samples: capsules and chicken feed 18
3.3.2 Sample packaging and temperature recording during shipment 19
3.4 Methods 19
3.5 Statistical analysis of the data 20
3.6 Good performance 21
4 Results 23
4.1 Reference materials 23
4.2 Chicken feed samples 24
4.3 Technical data interlaboratory comparison study 25
4.3.1 General 25 4.3.2 Accreditation/certification 25 4.3.3 Transport of samples 25 4.3.4 Media 28 4.4 Control samples 35 4.4.1 General 35
4.4.2 Specificity, sensitivity and accuracy rates of the control samples 37 4.5 Results feed samples artificially contaminated with
Salmonella spp. 38 4.5.1 Results per type of capsule and per laboratory 38 4.5.2 Results per selective enrichment medium, capsule and
per laboratory 40 4.5.3 Specificity, sensitivity and accuracy rates of the artificially
5 Discussion 53
6 Conclusions 57
References 59 Annex 1 History of CRL-Salmonella interlaboratory comparison studies on the detection of Salmonella 61
Annex 2 Calculation of T2 65
Annex 3 Information on the media used 66 Annex 4 Protocol 68 Annex 5 Standard Operating Procedure (SOP) 71 Annex 6 Number of positive results of the control samples 76 Annex 7 Number of positive results of the artificially contaminated
chicken feed 78 Annex 8 Test report follow-up study 80
List of abbreviations
BGA (mod) Brilliant Green Agar (modified)
BPLSA Brilliant Green Phenol-Red Lactose Sucrose Agar
BPW Buffered Peptone Water
cfp colony forming particles
CRL Community Reference Laboratory
dPCA double concentrated Plate Count Agar
dVRBG double concentrated Violet Red Bile Glucose agar
ELISA Enzyme-Linked Immuno Sorbent Assay
hcmp highly contaminated milk powder
ISO International Standardisation Organisation
LDC Lysine DeCarboxylase
MKTTn Mueller Kauffmann TetraThionate novobiocin broth MLCB Mannitol Lysine Crystal violet Brilliant green agar MSRV Modified Semi-solid Rappaport Vassiliadis
NRL National Reference Laboratory
OR Odds Ratio
PCA Plate Count Agar
PCR Polymerase Chain Reaction
RIVM Rijksinstituut voor Volksgezondheid en het Milieu (National Institute for Public Health and the Environment)
RM Reference Material
RVS Rappaport Vassiliadis Soya broth
SE Salmonella Enteritidis
SM2 Salmonella Detection and Identification-2
SOP Standard Operating Procedure
SPan Salmonella Panama
STM Salmonella Typhimurium
TSI Triple Sugar Iron agar
UA Urea Agar
VRBG Violet Red Bile Glucose agar
XLD Xylose Lysine Deoxycholate agar
Summary
In October 2008 the Community Reference Laboratory for Salmonella (CRL-Salmonella) organised the first interlaboratory comparison study on bacteriological detection of Salmonella in an animal feed matrix (chicken feed). Participants were thirty National Reference Laboratories for Salmonella (NRLs-Salmonella) of the EU Member States and of Norway and candidate country Former Yugoslav Republic of Macedonia (FYROM).
The first and most important objective of the study, was to see whether the participating laboratories could detect Salmonella at different contamination levels in an animal feed matrix. To do so, chicken feed samples of 25 g each, were analysed in the presence of reference materials (capsules) containing either Salmonella (at various contamination levels) or sterile milk powder. A proposal for good performance was made and the performance of the laboratories was compared to this proposal. In addition to the performance testing of the laboratories, a comparison was made between the prescribed methods (ISO 6579, 2002) and the requested method (Annex D of ISO 6579, 2007). For the prescribed method, the selective enrichment media were Rappaport Vassiliadis Soya broth (RVS) and Mueller Kauffmann Tetrathionate novobiocin broth (MKTTn). For the requested method the selective enrichment was Modified Semi-solid Rappaport Vassiliadis (MSRV) agar. Optionally a laboratory could also use other, own media or procedures for the detection of Salmonella.
Thirty-five individually numbered capsules had to be tested by the participants for the presence or absence of Salmonella. Twenty-five of the capsules had to be examined in combination with each 25 gram of Salmonella negative chicken feed. These 25 capsules were divided over the following groups: 5 capsules contained approximately 5 colony forming particles (cfp) of Salmonella Typhimurium (STM5), 5 capsules contained approximately 50 cfp of S. Typhimurium (STM50), 5 capsules contained approximately 20 cfp of S. Enteritidis (SE20), 5 capsules contained approximately 100 cfp of S. Enteritidis (SE100) and 5 blank capsules. The other 10 capsules, to which no feed had to be added, were control samples, existing of 3 capsules STM5, 2 capsules SE20, 1 capsule SE100, 2 capsules containing approximately 5 cfp of S. Panama (SPan5) and 2 blank capsules.
On average the laboratories found Salmonella in only 92 % of the (contaminated) samples when using selective enrichment in MKTTn (prescribed food method). The method for testing veterinary samples (MSRV) gave the best results with 99 % of the positive samples, very closely followed by the other food method (RVS).
Twenty-eight out of 30 laboratories achieved the level of good performance for at least one of the prescribed methods (MKTTn or RVS). One NRL achieved the level of good performance when also the requested food method (MSRV) was taken into account. One NRL was unable to reach the level of
1 Introduction
An important task of the Community Reference Laboratory for Salmonella (CRL-Salmonella), as laid down in the Commission Regulation EC No 882/2004, is the organisation of interlaboratory comparison studies. The history of the interlaboratory comparison studies on the detection of Salmonella, as organised by CRL-Salmonella since 1995 is summarised in Annex 1. In earlier ringtrials the detection of Salmonella spp. in veterinary and food samples were studied, while this was the first study for the detection of Salmonella spp. in animal feed. The organisation of an interlaboratory comparison study on animal feed was discussed with the NRLs for Salmonella at the annual CRL-Salmonella workshop in May 2008 (Mooijman, 2008). The first and most important objective of the study, organized by the Community Reference Laboratory (CRL) for Salmonella in October 2008, was to see whether the participating laboratories could detect Salmonella at different contamination levels in an animal feed matrix. This information is important to know whether the examination of samples in the EU Member States is carried out uniformly and comparable results can be obtained by all National Reference Laboratories for Salmonella (NRL-Salmonella). The second objective was to compare the different methods for the detection of Salmonella in chicken feed.
The prescribed method for detection of Salmonella in a feed matrix is ISO 6579 (Anonymous, 2002). However, it was expected that selective enrichment on Modified Semi-solid Rappaport Vassiliadis (MSRV) could also be used as on alternative medium (Annex D of ISO 6579, Anonymous, 2007). Therefore, the participating laboratories were requested also to use MSRV for testing the chicken feed. The set-up of this study was comparable to earlier interlaboratory comparison studies on the detection of Salmonella spp. in veterinary and food samples. The contamination level of the low level capsules was just above the detection limit of the method; the level of the high level samples approximately 5-10 times above the detection limit. Ten control samples consisting of different reference materials, had to be tested without the addition of chicken feed. These reference materials consisted of 3 capsules containing approximately 5 cfp of Salmonella Typhimurium (STM5), 2 capsules containing approximately 20 cfp of Salmonella Enteritidis (SE20), 1 capsule with approximately 100 cfp of Salmonella Enteritidis (SE100), 2 capsules containing approximately 5 cfp of Salmonella Panama (SPan5) and 2 blank capsules. Twenty-five samples of Salmonella negative chicken feed (25 g each) spiked with 5 different reference materials (including blank capsules) had to be examined. The different reference materials consisted of two levels of Salmonella Typhimurium (STM5 and STM50) and two levels of Salmonella Enteritidis (SE20 and SE100).
2 Participation
Country City Institute
Austria Linz Austrian Agency for Health and Food Safety (AGES) Zentrum für Analytik und Mikrobiologie
Belgium Brussels Veterinary and Agrochemical Research Center (VAR/CODA)
Bulgaria Sophia National Diagnostic and Research Veterinary Institute
Cyprus Nicosia Ministry of Agriculture, Natural Resources and Environment Veterinary Services Laboratory for the Control of Foods of Animal Origin (LCFAO)
Czech Republic Prague State Veterinary Institute
Denmark Lyngby The Danish Plant Directorate
Laboratory for diagnostics in Plants, Seed and Fodder
Estonia Tartu Estonian Veterinary and Food Laboratory, Bacteriology-Pathology Department
Finland Helsinki Finnish Food Safety Authority Evira Research Department, Microbiology Unit
France Ploufragan L’Agence Française de Sécurité Sanitaire des Aliments (AFSSA)
Germany Berlin Federal Institute for Risk Assessment (BFR) National Reference Laboratory for Salmonella
Greece Halkis Veterinary Laboratory of Halkis Hellenic Republic Ministry of rural development and food
Hungary Budapest Central Agricultural Office, Food and Feed Safety Directorate Food Microbiological Diagnostic Laboratory
Ireland Kildare Central Veterinary Research Laboratory CVRL / DAF Department of Agriculture and Food
Italy Legnaro (PD) Istituto Zooprofilattico Sperimentale delle Venezie, OIE National Reference Laboratory for Salmonella
Latvia Riga National Diagnostic Centre (NDC)
Lithuania Vilnius Lithuania National Food and Veterinary Risk Assessment Institute
Luxembourg Ettelbruck Administration des services techniques de l’agriculture Division des laboratoires de contrôle et d’essais
Country City Institute
Poland Pulawy National Veterinary Research Institute (NVRI) Department of Hygiene of Animal Feeding Stuffs
Portugal Lisbon Laboratório Nacional de Investigação Veterinária (LNIV)
Romania Bucharest Hygiene and Veterinary Public Health Institute (IISPV)
Slovak Republic Bratislava State Veterinary and Food Institute Reference Laboratory for Salmonella
Slovenia Ljubljana National Veterinary Institute, Veterinary Faculty
Spain Madrid Algete
Laboratorio Central de Veterinaria
Sweden Uppsala National Veterinary Institute (SVA), Department of Bacteriology
United Kingdom Addlestone Veterinary Laboratories Agency (VLA) Weybridge Dept. of Food and Environmental Safety
United Kingdom Belfast Agri-Food and Bioscience Institute (AFBI) Veterinary Sciences Division Bacteriology
3 Materials and methods
3.1 Reference materials
Five batches of Salmonella reference materials were prepared. For this purpose milk, artificially contaminated with a Salmonella strain was spray-dried (In ‘t Veld et al., 1996). The obtained highly contaminated milk powder (hcmp) was mixed with sterile (γ-irradiated) milk powder (Carnation, Nestlé, the Netherlands) to obtain the desired contamination level. The mixed powder was filled in to gelatin capsules resulting in the final reference materials (RMs).
The target levels of the five batches of RMs were:
• 5 colony forming particles (cfp) per capsule for Salmonella Panama (SPan5);
• 5 and 50 colony forming particles (cfp) per capsule for Salmonella Typhimurium (STM5 and STM50);
• 20 and 100 colony forming particles (cfp) per capsule for Salmonella Enteritidis (SE20 and SE100).
Before filling all mixed powders into gelatin capsules, test batches of 60 capsules were prepared of each mixture to determine the mean number of cfp per capsule and the homogeneity of the mixture. The remaining mixed powders were stored at –20 oC. If the test batches fulfilled the pre-set criteria for contamination level and homogeneity, the relevant mixed powders were completely filled into gelatin capsules and stored at –20 oC.
The pre-set criteria were:
• mean contamination levels should lie between target level minus 30 % and target level plus 50 % (e.g. between 70 and 150 cfp if the target level is 100 cfp);
• for the homogeneity within one batch of capsules the maximum demand for the variation between capsules should be T2/(I-1) ≤ 2, where T2 is a measure for the variation between capsules of one
batch (see formula in Annex 2) and I is the number of capsules.
The contamination levels of the capsules were determined following the procedure as described by Schulten et al. (2000). In short the procedure is as follows:
• reconstitution of each capsule in 5 ml peptone saline solution in a Petri dish at (38.5 ± 1) oC for
(45 ± 5) min;
• repair of Salmonella by the addition of 5 ml molten double concentrated plate count agar (dPCA) to the reconstituted capsule solution, and after solidification incubation at (37 ± 1) oC for (4 ± ½) h; • after incubation, 10 ml of molten double concentrated Violet Red Bile Glucose agar (dVRBG) was
added as an overlayer and after solidification the plates were incubated at (37 ± 1) oC for (20 ± 2) h.
was decided to use the feed with the highest amount of background flora for the interlaboratory comparison study this was the premium poultry and waterfowl feed consisting of mixed grains (HAVENS).
Twenty five kilogram of chicken feed was bought in a shop for animals (Maarssen, the Netherlands) on 8 September 2008. The feed was tested for the absence of Salmonella following the procedure as described in Annex D of ISO 6579 (Anonymous, 2007). For this purpose 10 portions of 25 g were each added to 225 ml Buffered Peptone Water (BPW). After pre-enrichment at (37 ± 1) oC for 16-18 h,
selective enrichment was carried out on Modified Semi-solid Rappaport Vassiliadis (MSRV). Next, the suspect plates were plated-out on Xylose Lysine Deoxycholate agar (XLD) and Brilliant Green Agar (BGA) and confirmed biochemically. The chicken feed was stored at room temperature until further use.
3.2.2 Total bacterial count in chicken feed
The total number of aerobic bacteria was investigated in the chicken feed. The procedure of ISO 4833 (Anonymous, 2003) was followed for this purpose. In summary a portion of 20 gram feed was homogenized in 180 ml peptone saline solution in a plastic bag. The content was mixed by using a pulsifier (60 sec). Next tenfold dilutions were prepared in peptone saline solution. Two times one ml of each dilution was brought into 2 empty Petri-dishes (diameter 9 cm). To each dish 15 ml of molten Plate Count Agar (PCA) was added. After the PCA was solidified an additional 5 ml PCA was added to the agar. The plates were incubated at (30 ± 1) oC for (72 ± 3) h and the total number of aerobic bacteria was counted after incubation.
3.2.3 Number of Enterobacteriaceae in chicken feed
In addition to the total count of aerobic bacteria, the Enterobacteriaceae count was determined. The procedure of ISO 21528-2 (Anonymous, 2004) was used for this purpose. In summary a portion of 20 gram feed was homogenized in 180 ml peptone saline solution in a plastic bag. The content was mixed by using a pulsifier (60 sec). Next tenfold dilutions were prepared in peptone saline solution. Two times one ml of each dilution was brought into 2 empty Petri-dishes (diameter 9 cm). To each dish, 10 ml of molten Violet Red Bile Glucose agar (VRBG) was added. After the VRBG was solidified an additional 15 ml VRBG was added to the agar. The plates were incubated at (37 ± 1) oC
for (24 ± 2) h and the number of typical violet-red colonies was counted after incubation. Five typical colonies were tested for the fermentation of glucose and for a negative oxidase reaction. After this confirmation the number of Enterobacteriaceae was calculated.
3.3 Design of the interlaboratory comparison study
3.3.1 Samples: capsules and chicken feed
On 22 September 2008 (two weeks before the study) the reference materials (35 individually numbered capsules) and 700 grams of Salmonella negative chicken feed were packed with cooling devices as biological substance category B (UN 3373) and send by courier service to each participant. After arrival at the participant laboratory, the capsules had to be stored at –20 oC and the chicken feed had to be stored at +5 oC until the start of the study. Details about mailing and handling of the samples and reporting of test results can be found in the Protocol (Annex 4) and Standard Operation Procedure (Annex 5). The test report which was used during the study can be found at the CRL-Salmonella
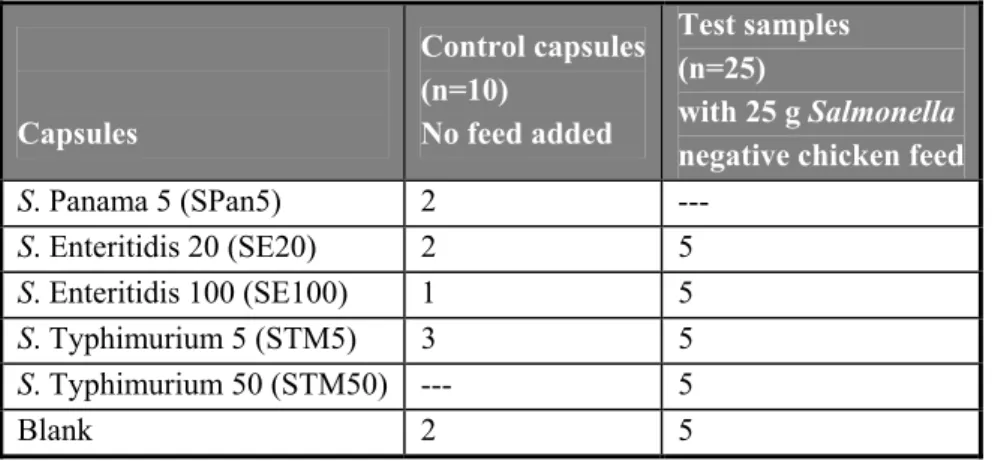
Ten control capsules had to be tested without feed (numbered C1-C10). Twenty-five capsules (numbered 1 – 25) were each tested in combination with 25 grams of chicken feed (negative for Salmonella). The types and the number of capsules and feed samples to be tested are shown in Table 1. Table 1 Overview of the types and the number of capsules tested per laboratory in the interlaboratory comparison
study. Capsules Control capsules (n=10) No feed added Test samples (n=25) with 25 g Salmonella negative chicken feed
S. Panama 5 (SPan5) 2 --- S. Enteritidis 20 (SE20) 2 5 S. Enteritidis 100 (SE100) 1 5 S. Typhimurium 5 (STM5) 3 5 S. Typhimurium 50 (STM50) --- 5 Blank 2 5
3.3.2 Sample packaging and temperature recording during shipment
The capsules and the chicken feed were packed in 2 plastic containers firmly closed with screw caps (biopacks). Both biopacks were placed in one large shipping box, together with four frozen (-20 oC) cooling devices. Each shipping box was sent as biological substances category B (UN3373) by door-to-door courier services. For the control of exposure to abusive temperatures during shipment and storage, so called micro temperature loggers were used to record the temperature during transport. These loggers are tiny sealed units in a 16 mm diameter and 6 mm deep stainless steel case. Each shipping box contained one logger, packed in the biopack with capsules. The loggers were programmed by the CRL-Salmonella to measure the temperature every hour. Each NRL had to return the temperature recorder immediately after receipt of the parcel to the CRL. At the CRL-Salmonella the loggers were read by means of the computer and all data from the start of the shipment until the arrival at the National Reference Laboratories were transferred to an Excel graphic which shows all recorded temperatures.
In summary: Pre-enrichment in:
• Buffered Peptone Water (BPW) (prescribed) Selective enrichment in/on:
• Rappaport Vassiliadis Soya broth (RVS) (prescribed)
• Mueller Kaufmann Tetrathionate novobiocin broth (MKTTn) (prescribed) • Modified semi-solid Rappaport Vassiliadis agar (MSRV) (requested) • Own selective enrichment medium (optional)
Plating-out on:
• Xylose lysine desoxycholate agar (XLD) (prescribed) • Second plating-out medium for choice (obligatory) • Own plating-out medium (optional)
Confirmation of identity:
• Confirmation by means of appropriate biochemical tests or by reliable, commercial available identification kits and serological tests. Follow the instructions of ISO 6579.
3.5 Statistical analysis of the data
The specificity, sensitivity and accuracy rates were calculated for the control samples, and the artificially contaminated samples with chicken feed (negative for Salmonella spp.). The specificity, sensitivity and accuracy rates were calculated according to the following formulae:
Specificity rate: samples negative (expected) of number Total results negative of Number x 100 % Sensitivity rate: samples positive (expected) of number Total results positive of Number x 100 % Accuracy rate: negative) and (positive samples of number Total negative) and (positive results correct of Number x 100 %
Mixed effect logistic regression (Venables and Ripley, 2002) was used for modelling the binary outcomes as a function of a fixed effect part, consisting of the capsules, enrichment media and isolation media, and a random effect part, consisting of the different laboratories. Differences between media and capsules are shown as odds ratios and were calculated by stratification by medium. The overall performance of each laboratory is also given as an odds ratio, but is compared to the mean of all laboratories, i.e. the outcomes as predicted based on the fixed effects only. 95 % confidence limits and p-values are provided as well.
An odds ratio can be interpreted as an effect size and is the ratio of the odds of detecting Salmonella in one group to the odds of detecting it in another group. Groups are for instance two different media, or one laboratory compared to the mean. Results were analyzed using the statistical software R (R Development Core Team, 2008). The lme4 package was used for the mixed effect logistic regression (Bates et al., 2008).
3.6 Good performance
Proposal for criteria testing ‘good performance’
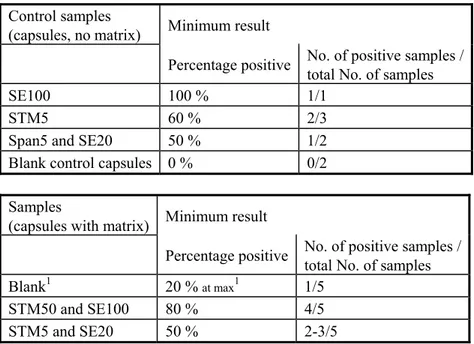
The criteria used for testing good performance in this study are given in Table 2. For determining good performance per laboratory all combinations of selective enrichment media and isolation media used by the laboratory were taken into account. For example if a laboratory found for the STM5 capsules with matrix 3/5 positive with RVS/XLD, but no positives with MKTTn or any other selective enrichment medium or isolation medium this was still considered as good result. For the blank capsules also all combinations of media used per laboratory were taken into account. If for example a laboratory found 2/5 blank capsules positive with MKTTn/BGA but no positives with the other media, this was still considered as a ‘no-good’ result.
Table 2 Used criteria for testing for good performance in the Feed-I study (2008).
Control samples
(capsules, no matrix) Minimum result
Percentage positive No. of positive samples / total No. of samples
SE100 100 % 1/1
STM5 60 % 2/3
Span5 and SE20 50 % 1/2
Blank control capsules 0 % 0/2 Samples
(capsules with matrix) Minimum result
Percentage positive No. of positive samples / total No. of samples
Blank1 20 % at max1 1/5
STM50 and SE100 80 % 4/5
STM5 and SE20 50 % 2-3/5
1: All should be negative. However, as no 100 % guarantees about the Salmonella negativity of the matrix can be given, 1 positive out of 5 blank samples (20 % pos.) will still be considered as acceptable.
4 Results
4.1 Reference materials
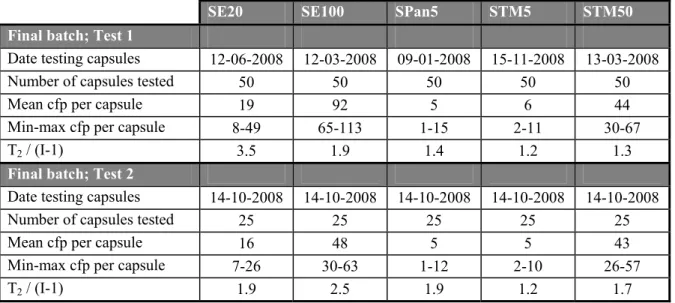
The level of contamination and the homogeneity of the final batches of capsules are presented in Tables 3A and 3B. All batches met the pre-set criteria as stated in section 3.1. The enumerated minimum and maximum levels within each batch of capsules are also given in the table. The final batches were tested twice: firstly immediately after preparing the batch and secondly at the time of the interlaboratory comparison study. At the first date of testing the mean contamination level of all batches fulfilled the pre-set-criteria as stated in section 3.1. However, the variation between the SE20 capsules was high. At the second date of testing the mean contamination level of both batches SE capsules were decreased, especially for the SE100 capsules. The reason for this decrease was not clear. Although the mean contamination level of the SE100 capsules was decreased under the minimum target level it was still considered useful for the cause of this study.
Table 3A Level of contamination and homogeneity of SE, SPan and STM capsules.
SE20 SE100 SPan5 STM5 STM50 Final batch; Test 1
Date testing capsules 12-06-2008 12-03-2008 09-01-2008 15-11-2008 13-03-2008
Number of capsules tested 50 50 50 50 50
Mean cfp per capsule 19 92 5 6 44
Min-max cfp per capsule 8-49 65-113 1-15 2-11 30-67
T2 / (I-1) 3.5 1.9 1.4 1.2 1.3
Final batch; Test 2
Date testing capsules 14-10-2008 14-10-2008 14-10-2008 14-10-2008 14-10-2008
Number of capsules tested 25 25 25 25 25
Mean cfp per capsule 16 48 5 5 43
Min-max cfp per capsule 7-26 30-63 1-12 2-10 26-57
T2 / (I-1) 1.9 2.5 1.9 1.2 1.7
cfp = colony forming particles; min-max = enumerated minimum and maximum cfp; formula T2 see Annex 2; I is number of capsules; Demand for homogeneity T2 /(I-1) ≤ 2
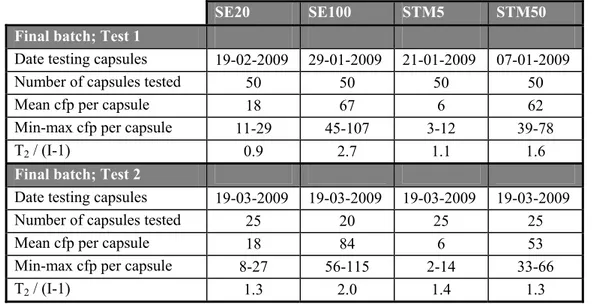
Table 3B Level of contamination and homogeneity of SE and STM capsules used in the follow up study
SE20 SE100 STM5 STM50 Final batch; Test 1
Date testing capsules 19-02-2009 29-01-2009 21-01-2009 07-01-2009
Number of capsules tested 50 50 50 50
Mean cfp per capsule 18 67 6 62
Min-max cfp per capsule 11-29 45-107 3-12 39-78
T2 / (I-1) 0.9 2.7 1.1 1.6
Final batch; Test 2
Date testing capsules 19-03-2009 19-03-2009 19-03-2009 19-03-2009
Number of capsules tested 25 20 25 25
Mean cfp per capsule 18 84 6 53
Min-max cfp per capsule 8-27 56-115 2-14 33-66
T2 / (I-1) 1.3 2.0 1.4 1.3
cfp = colony forming particles; min-max = enumerated minimum and maximum cfp; formula T2 see Annex 2; I is number of capsules; Demand for homogeneity T2 /(I-1) ≤ 2
4.2 Chicken feed samples
The chicken feed was tested negative for Salmonella and stored at room temperature. On Monday 22 September 2008 the chicken feed was mailed to the NRLs. After receipt the NRLs had to store the chicken feed at 5 °C.
The number of aerobic bacteria and the number of Enterobacteriaceae were tested twice; firstly at the day the chicken feed arrived at the CRL (9/9/2008) and secondly at the planned date (7/10/2008) of the interlaboratory comparison study. The results are shown in Table 4.
Most of the laboratories (twenty-eigth) performed the study in week 41, starting on 6 October 2008. One laboratory (labcode 22) performed the study one week earlier and one laboratory (labcode 5) performed it one week later.
Table 4 Number of aerobic bacteria and the number of Enterobacteriaceae per gram of chicken feed.
Date Aerobic bacteria cfp/g Enterobacteriaceae cfp/g
9 September 2008
stored at 20-24 °C 2.4*106 8.4*103 7 October 2008
4.3 Technical data interlaboratory comparison study
4.3.1 General
In this study 30 NRLs participated: 28 NRLs from 27 EU Member States, 1 NRL from a European Economic Area country and 1 NRL from an European candidate country.
4.3.2 Accreditation/certification
Twenty-five laboratories mentioned to be accredited for their quality system according to ISO/IEC 17025 (Anonymous, 2005) (labcodes 1, 2, 3, 4, 7, 8, 9, 11, 12, 14, 15, 16, 17, 18, 19, 20, 21, 22, 23, 25, 26, 27, 28, 29 and 30 ). Four laboratories (labcodes 5, 6, 12, 24) are planning to become accredited or certified in the near future and for one laboratory (labcode 10) the accreditation is already in process. The NRLs without accreditation needs to take into account that according to EC Regulations No. 882/2004 each NRL should be accredited for their relevant work field before 31 December 2009 (EC Regulation No. 2076/2005).
4.3.3 Transport of samples
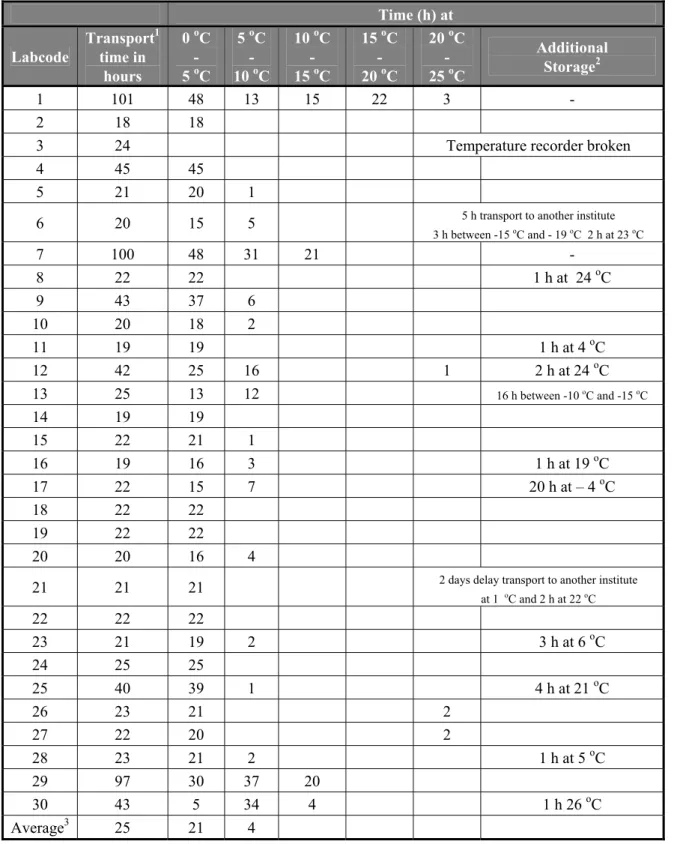
An overview of the transport times and the temperatures during transport of the parcels is given in Table 5. The temperature recorders were returned immediately after receipt to CRL-Salmonella by all NRLs. The temperature recorder of laboratory 3 was broken when it arrived at the CRL, it was therefore not possible to read the results. The majority of the laboratories received the materials within 1-2 days. However, the parcels of three laboratories (labcodes 1, 7 and 29) were delayed for more than 5 days because of problems with the courier service. The parcels returned at the CRL Salmonella in Bilthoven at 29/9/2008 and a new set of materials was sent the same day to those laboratories. The total transport time of those latter three parcels was 5 days. Only the transport time of the second mailing for the laboratories 1, 7 and 29 are indicated in Table 5. When those latter parcels are not taken into account, the average transport time was 25 hours. For twelve parcels the transport temperature did not exceed 5 oC and for thirteen other parcels the temperature was only for a few hours above 5 oC but did not exceed 10 oC. The transport time of the parcel of laboratory 30 was relatively long, but most of the time the temperature did not exceed 10 oC. The delayed parcels of the laboratories 1, 7 and 29 were kept for the majority of the transport time below 10 oC.
For twelve NRLs the time of transport recorded on the test report did not correspond with the time reported by the courier. For two NRLs (labcode 6 and 21) this was due to the fact that the parcel was forwarded to another institute. Presumably the other parcels arrived at the time reported by the courier at the Institute, but due to internal logistics at the Institute the parcel arrived later at the laboratory of the NRL. In general this delay was only short (1-4 h). Only in one laboratory the delay was longer (20 h, labcode 17). However, no negative effect of this delay was expected as the parcel had been stored at – 4 oC.
Table 5 Overview of the transport time and of the temperatures during shipment of the parcels to the NRLs. Time (h) at Labcode Transport1 time in hours 0 oC - 5 oC 5 oC - 10 oC 10 oC - 15 oC 15 oC - 20 oC 20 oC - 25 oC Additional Storage2 1 101 48 13 15 22 3 - 2 18 18
3 24 Temperature recorder broken
4 45 45
5 21 20 1
6 20 15 5 5 h transport to another institute
3 h between -15 oC and - 19 oC 2 h at 23 oC 7 100 48 31 21 - 8 22 22 1 h at 24 oC 9 43 37 6 10 20 18 2 11 19 19 1 h at 4 oC 12 42 25 16 1 2 h at 24 oC 13 25 13 12 16 h between -10 oC and -15 oC 14 19 19 15 22 21 1 16 19 16 3 1 h at 19 oC 17 22 15 7 20 h at – 4 oC 18 22 22 19 22 22 20 20 16 4
21 21 21 2 days delay transport to another institute
at 1 oC and 2 h at 22 oC 22 22 22 23 21 19 2 3 h at 6 oC 24 25 25 25 40 39 1 4 h at 21 oC 26 23 21 2 27 22 20 2 28 23 21 2 1 h at 5 oC 29 97 30 37 20 30 43 5 34 4 1 h 26 oC Average3 25 21 4
1 transport time according the courier
Table 6 Media combinations used per laboratory. Labcode Selective enrichment media Plating-out Media Labcode Selective enrichment media Plating-out Media 1 RVS XLD 16 RVS XLD MKTTn MSRV Hektoen Rambach MKTTn MSRV BGAmod 2 RVS XLD 17 RVS XLD
MKTTn BGAmod MKTTn BPLSA
MSRV MSRV 3 RVS XLD 18 RVS XLD MKTTn MSRV BGAmod MKTTn MSRV BPLS Rambach 4 RVS MKTTn XLD Rambach 19 RVS MKTTn XLD Rambach MSRV MSRV 5 RVS XLD 20 RVS XLD MKTTn SM2 MKTTn XLT4 MSRV MSRV BGA* 6 RVS XLD 21** RVS XLD MKTTn SM2 MKTTn BGAmod MSRV MSRV Rambach 7 RVS XLD 22 RVS XLD MKTTn Rambasch MKTTn Rambach MSRV MSRV 8 RVS XLD 23 RVS XLD MKTTn MSRV BGAmod MKTTn MSRV BGAmod Rambach 9 RVS XLD 24 RVS XLD MKTTn MSRV Rambach MKTTn MSRV BGAmod MLCB 10 RVS MKTTn MSRV XLD XLT4 25** RVS MKTTn MSRV XLD BGAmod 11 RVS MKTTn MSRV XLD BGAmod 26 RVS MKTTn MSRV XLD BGA 12 RVS MKTTn MSRV XLD BPLS Rambach 27 RVS MKTTn MSRV XLD Rambach 13 RVS MKTTn XLD BPLS 28 RVS MKTTn XLD BGAmod
4.3.4 Media
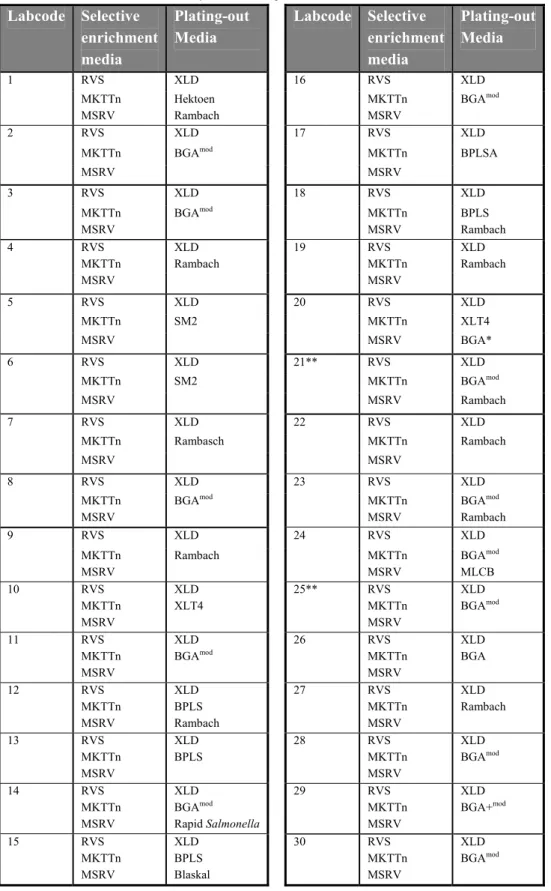
Each laboratory was asked to test the samples with the prescribed (ISO 6579) and the requested (AnnexD of ISO 6579) methods. All laboratories used the selective enrichment media RVS, MKTTn and MSRV with the plating out medium XLD and a second plating out medium of own choice. The media used per laboratory are shown in Table 6. Eight NRLs (labcodes 1, 14, 15, 18, 20, 21, 23 and 24) used a third plating out medium. Two NRLs did not confirm Salmonella suspected colonies from all used plating out media (labcodes 21 and 25).
Details on the media which are not described in ISO 6579 are given in Annex 3.
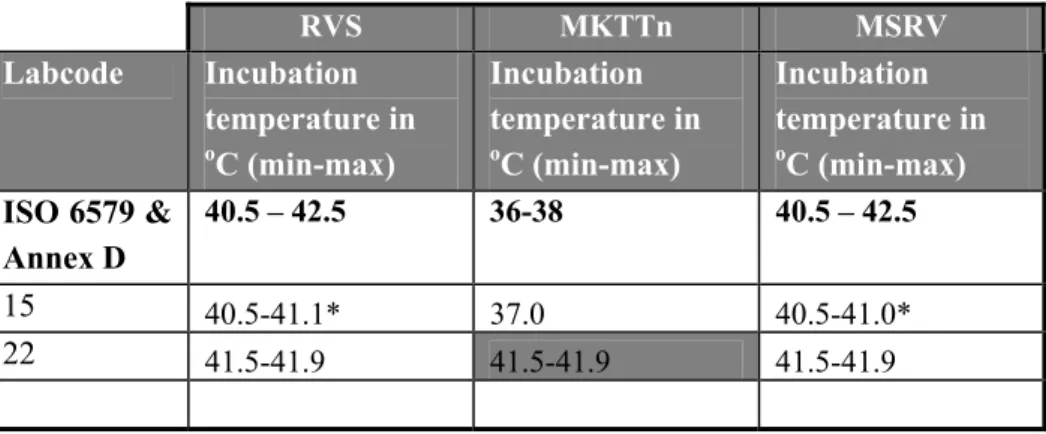
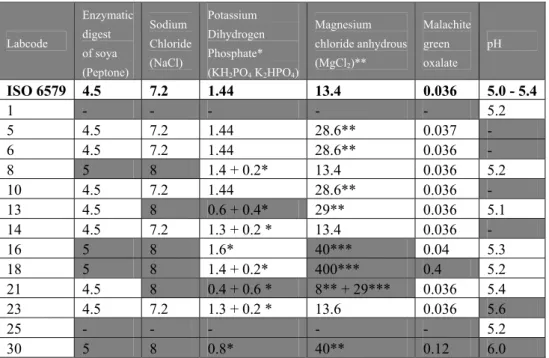
In Tables 7-13 information is given on the composition of the media which were prescribed and ‘requested’ and on incubation temperatures. In these tables only the laboratories are indicated who reported deviations. Laboratory 6 and 25 did not mention the pH for most of the used media. Four laboratories (labcodes 1, 18, 22 and 25) did not mention de composition of all the media used. Two laboratories incubated the selective enrichment media at deviating temperatures (labcodes 15 and 22). A second plating-out medium for choice was obligatory. Seventeen laboratories used BGA (modified) or BPLS (ISO 6579, 1993) as a second plating-out medium and one laboratory used BPLSA (Merck) this is almost similar to BGA. Eleven laboratories used Rambach, two laboratories used SM2 agar and two laboratories used XLT4. The following media were used only by one laboratory: MLCB, Hektoen, Rapid Salmonella, BGA and Blaskal.
The use of an extra plating agar between the ‘isolation’ and the ‘confirmation’ steps was optional. A total of 16 laboratories performed this extra culture step on many different media (e.g. Nutrient agar (ISO 6579, 2002), Mac Conkey, Imuna and Bromcresol purpur agar).
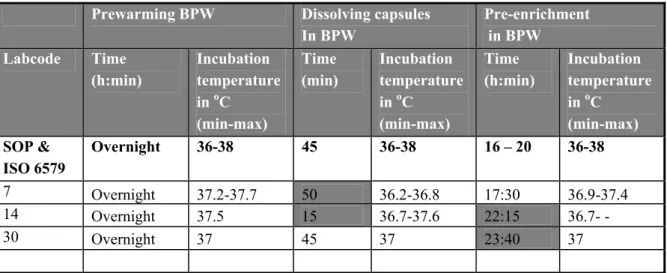
Table 7 Incubation time and temperature of BPW.
Prewarming BPW Dissolving capsules In BPW Pre-enrichment in BPW Labcode Time (h:min) Incubation temperature in oC (min-max) Time (min) Incubation temperature in oC (min-max) Time (h:min) Incubation temperature in oC (min-max) SOP & ISO 6579 Overnight 36-38 45 36-38 16 – 20 36-38 7 Overnight 37.2-37.7 50 36.2-36.8 17:30 36.9-37.4 14 Overnight 37.5 15 36.7-37.6 22:15 36.7- - 30 Overnight 37 45 37 23:40 37
Grey cell : deviating times and temperatures - = no information
Table 8 Composition (in g/L) and pH of BPW medium. Labcode Enzymatic digest of casein (Peptone) Sodium Chloride
(NaCl)
Disodium hydrogen Phosphate dodecahydrate(Na
2HPO
4.12H
2O)
Potassium dihydrogen phosphate(KH
2PO
4)
pH ISO 6579 10 5 9 1.5 6.8 – 7.2 2 10 5 9 1.5 - 6 10 5 9 1.5 - 10 10 5 3.5* 1.5 - 11 10 5 3.5* 1.5 7.3 14 10 5 3.5* 1.5 - 24 10 5 3.6* 1.5 7.1 25 - - - - 7 28 10 5 3.5* 1.5 7.4Grey cell: deviating from ISO 6579 - = no information
* = 3.5 g Disodium hydrogen phosphate (anhydrous) is equivalent to 9 g disodium hydrogen phosphate dodecahydrate
Table 9 Incubation temperatures of selective enrichment medium RVS, MKTTn and MSRV.
RVS MKTTn MSRV Labcode Incubation temperature in oC (min-max) Incubation temperature in oC (min-max) Incubation temperature in oC (min-max) ISO 6579 & Annex D 40.5 – 42.5 36-38 40.5 – 42.5 15 40.5-41.1* 37.0 40.5-41.0* 22 41.5-41.9 41.5-41.9 41.5-41.9
Grey cell: deviating times and temperatures
Table 10 Composition (in g/L) and pH of RVS. Labcode Enzymatic digest of soya (Peptone) Sodium Chloride (NaCl) Potassium Dihydrogen Phosphate* (KH2PO4 K2HPO4) Magnesium chloride anhydrous (MgCl2)** Malachite green oxalate pH ISO 6579 4.5 7.2 1.44 13.4 0.036 5.0 - 5.4 1 - - - - - 5.2 5 4.5 7.2 1.44 28.6** 0.037 - 6 4.5 7.2 1.44 28.6** 0.036 - 8 5 8 1.4 + 0.2* 13.4 0.036 5.2 10 4.5 7.2 1.44 28.6** 0.036 - 13 4.5 8 0.6 + 0.4* 29** 0.036 5.1 14 4.5 7.2 1.3 + 0.2 * 13.4 0.036 - 16 5 8 1.6* 40*** 0.04 5.3 18 5 8 1.4 + 0.2* 400*** 0.4 5.2 21 4.5 8 0.4 + 0.6 * 8** + 29*** 0.036 5.4 23 4.5 7.2 1.3 + 0.2 * 13.6 0.036 5.6 25 - - - - - 5.2 30 5 8 0.8* 40** 0.12 6.0
Grey cell: deviating from ISO 6579 - = no information
*= 1.4 g/L Potassium dihydrogen phosphate (KH2PO4) + 0.2 g/L Di-potassium hydrogen phosphate (K2HPO4) gives a final concentration of 1.44 g/L KH2PO4 K2HPO4
** = 13.4 g MgCl2 (anhydrous) is equivalent to 28.6 g MgCl2 hexahydrate. *** Magnesium chloride hexahydrate (MgCl2.6H2O)
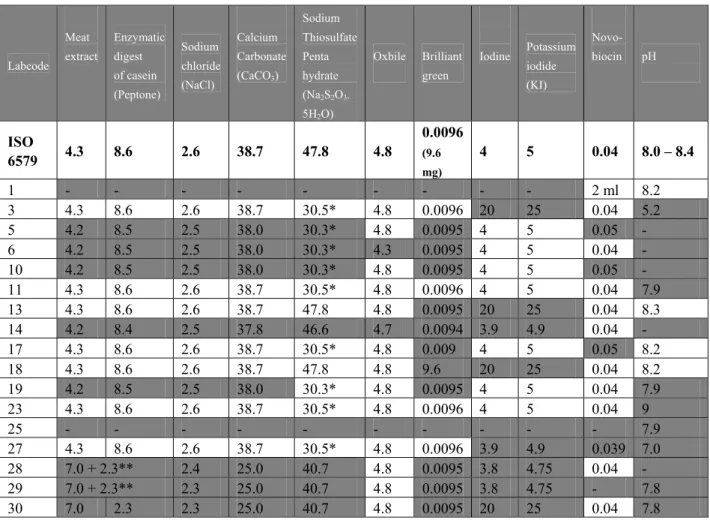
Table 11 Composition (in g/L) and pH of MKTTn. Labcode Meat extract Enzymatic digest of casein (Peptone) Sodium chloride (NaCl) Calcium Carbonate (CaCO3) Sodium Thiosulfate Penta hydrate (Na2S2O3. 5H2O) Oxbile Brilliant green Iodine Potassium iodide (KI) Novo- biocin pH ISO 6579 4.3 8.6 2.6 38.7 47.8 4.8 0.0096 (9.6 mg) 4 5 0.04 8.0 – 8.4 1 - - - - 2 ml 8.2 3 4.3 8.6 2.6 38.7 30.5* 4.8 0.0096 20 25 0.04 5.2 5 4.2 8.5 2.5 38.0 30.3* 4.8 0.0095 4 5 0.05 - 6 4.2 8.5 2.5 38.0 30.3* 4.3 0.0095 4 5 0.04 - 10 4.2 8.5 2.5 38.0 30.3* 4.8 0.0095 4 5 0.05 - 11 4.3 8.6 2.6 38.7 30.5* 4.8 0.0096 4 5 0.04 7.9 13 4.3 8.6 2.6 38.7 47.8 4.8 0.0095 20 25 0.04 8.3 14 4.2 8.4 2.5 37.8 46.6 4.7 0.0094 3.9 4.9 0.04 - 17 4.3 8.6 2.6 38.7 30.5* 4.8 0.009 4 5 0.05 8.2 18 4.3 8.6 2.6 38.7 47.8 4.8 9.6 20 25 0.04 8.2 19 4.2 8.5 2.5 38.0 30.3* 4.8 0.0095 4 5 0.04 7.9 23 4.3 8.6 2.6 38.7 30.5* 4.8 0.0096 4 5 0.04 9 25 - - - 7.9 27 4.3 8.6 2.6 38.7 30.5* 4.8 0.0096 3.9 4.9 0.039 7.0 28 7.0 + 2.3** 2.4 25.0 40.7 4.8 0.0095 3.8 4.75 0.04 - 29 7.0 + 2.3** 2.3 25.0 40.7 4.8 0.0095 3.8 4.75 - 7.8 30 7.0 2.3 2.3 25.0 40.7 4.8 0.0095 20 25 0.04 7.8
Grey cell: deviating from ISO 6579 - = no information
* 30.5 g Sodium thiosulphate (anhydrous) is equivalent to 47.8 g Sodium thiosulphate pentahydrate ** 7.0 g Tryptone + 2.3 g Soya Peptone
Table 12 Composition (in g/L) and pH of MSRV. Labcode Enzymatic digest of casein (Tryptose) Casein hydro-lysate
S
odium chloride (NaCl) Potassium Dihydrogen Phosphate (KH2PO4 K2HPO4) Magnesium chloride anhydrous (MgCl2) Malachitegreen oxalate Agar Novo biocin pH Annex D ISO 6579 4.6 4.6 7.3 1.5 10.9 0.04 2.7 0.01 (10mg/L) 5.1-5.4 1 - - - 2 ml 5.2 3 4.6 4.6 7.3 1.5 10.9 0.04 2.7 10 5.5 6 4.6 4.6 7.3 1.5 10.9 0.04 2.7 0.01 - 7 4.6 4.6 7.3 1.5 10.9 0.04 2.7 0.02 5.4 8 4.6 4.6 7.3 1.5 10.9 0.04 2.7 0.02 5.1 11 4.6 4.6 7.3 1.5 10.9 0.04 2.7 0.02 5.2 13 4.6 4.6 7.3 1.5 10.9 0.04 2.7 0.05 5.7 14 4.6 4.6 7.3 1.5 10.9 0.04 2.7 0.01 - 18 - - - - 5.2 21 4.6 4.6 7.3 1.5 10.9 0.04 2.7 0.02 5.3 22 - - - - 5.4 24 2.3+2.3* 4.6 7.3 1.5 10.9 0.04 2.5 0.01 5.4 25 - - - 5.6 27 4.6 4.65 7.3 1.5 10.9 0.04 2.5 0.01 5.2 28 4.6 4.6 7.3 1.5 10.9 0.04 2.7 0.01 5.5 29 4.6 4.6 7.3 1.5 10.9 0.04 2.7 0 5.2
Grey cell: deviating from Annex D of ISO 6579 - = no information
Table 13 Composition (in g/L) and pH of XLD. Labcode Xylose L-lysine Lact ose Sucrose (Sac char ose) Sodium chloride (NaCl) Yeast Extract Phenol red Agar Sodium desoxy- cholate (C24H39 NaO4) Sodium thio- sulphate (Na2S2O3) Iron (III) Ammo nium Citrate (C6H8O7· nFe·nH3N) pH ISO 6579 3.75 5 7.5 7.5 5 3 0.08 9-18 1 6.8 0.8 7.2 – 7.6 1 - - - - 7.4 3 3.75 5 7.5 7.5 5 3 0.08 13.5 2.5 6.8 0.8 7.6 4 3.5 5 7.5 7.5 5 3 0.08 13.5 2.5 6.8 0.8 7.4 6 3.5 5 7.5 7.5 5 3 0.08 13.5 2.5 6.8 0.8 - 10 3.75 5 7.5 7.5 5 3 0.08 12.5 1 6.8 0.8 - 14 3.75 5 7.5 7.5 5 3 0.08 13.5 1 6.8 0.8 - 18 - - - - 7.4 23 3.5 5 7.5 7.5 5 3 0.08 13.5 2.5 6.8 0.8 7.3 25 - - - - 7.4 30 3.5 5 7.5 7.5 5 3 0.08 15 2.5 6.8 0.8 7.4
Grey cell: deviating from ISO 6579 - = no information
Most of the laboratories used both biochemical and serological tests for confirmation of Salmonella. Three laboratories (labcode 17, 23 and 24) did not use a biochemical test but used serological tests only. Seven laboratories did not use a serological test (labcodes 2, 3, 5, 6, 12, 26, 28) but used biochemical tests only. The used confirmation media or tests are summarised in Tables 14 and 15.
Table 14 Biochemical confirmation of Salmonella.
Labcode TSI UA LDC Gal VP Indole Kit Other
1 + + + - + + - -
2, 5, 12, 29 + + + - - - - -
3, 8 + + + - - + - -
4 + + + - - - Api (Rapid) 20E
BBL BD Crystal E/NF
PCR*
6 - - - Api ID32E, Api 32GN Vidas SLM
7, 9, 20, 26 + + + + + + - - 10 - - - Api 20E PCR 11 - + - - - - 13 + + + - - + - Mini Vidas 14 + - + - - - - Sorbitol Imobility Agar 15, 22 + + + - - - Api 20E - 16, 18 + + + + - + - - 17 - - - PCR 19 - - + - - - Api 10S -
21 + - - - Api 20E Lysine iron agar
Oxidase Elisa Tecra
23, 24 - - - -
25 - - - ID 32E Biomerieux -
27 + + - - - - Api 20E
Api Rapid 20E
ID 0571 MOBIS Salmonella test cards
28 + + + - - - - PCR
30 + - - - GN-ID A Panel
Microgen Bioproducts - - = Not done/mentioned Explanations of the abbreviations are given in the ‘List of abbreviations’ * Results are not reported in testreport
Table 15 Serological confirmation of Salmonella.
Labcode Serological Other
O antigens Vi antigens H antigens 1, 7, 9, 14, 16, 18, 19, 30 + - - 2, 3, 5, 6, 12, 26, 28 - - - 4, 8, 10, 11, 13, 17, 20, 22, 23, 24, 25, 29 + + - 15, 27 - - - Salmonella Omnivalent A-67
4.4 Control samples
4.4.1 General
None of the laboratories isolated Salmonella from the procedure control (C11: no capsule/no feed) nor from the feed control (C12: no capsule/negative feed). Thirteen laboratories scored correct results for all the control capsules containing Salmonella. In Annex 6 the results are given of all control samples (capsules without feed) per laboratory and per selective enrichment medium in combination with the isolation medium that gives the highest number of positives. In Table 15 the highest number of positive isolations found with all combinations of selective enrichment media and isolation media are given per laboratory.
Blank capsules without addition of feed (n=2)
The blank capsules contained only sterile milk powder. For the analyses no feed was added.
Laboratory 6 found both blank capsules positive on all media used by this laboratory. Possible causes for finding a blank sample positive may be cross-contamination, mixing up positive and negative samples or limited confirmation or misinterpretation of confirmation results. This laboratory is advised to check their procedures.
Salmonella Panama 5 capsules (SPan5) without addition of feed (n=2)
Twenty-nine laboratories isolated Salmonella from both Span5 capsules. One Laboratory (labcode 15) could not detect Salmonella Panama (SPan5) in one control capsule. When using the selective enrichment media RVS and MKTTn they missed both the capsules but they found one positive with the selective enrichment on MSRV inoculated from the same BPW.
Salmonella Typhimurium 5 capsules (STM5) without addition of feed (n=3)
Twenty-eight laboratories tested all the three capsules containing STM5 positive. Two laboratories (1 and 19) could not detect Salmonella (STM5) in one control capsule with all the three selective enrichment media. These capsules contained STM at a low level (approximately 5 cfp/ capsule). Due to the variation between capsules one out of two capsules containing STM5 may occasionally be negative. Salmonella Enteritidis 20 capsules (SE20) without addition of feed (n=2)
All laboratories isolated Salmonella Enteritidis from both SE20 capsules. Salmonella Enteritidis 100 capsules (SE100) without addition of feed (n=1) All participating laboratories tested the capsule containing SE100 positive.
Table 16 Total number of positive results of the control samples (capsule without feed) per laboratory.
Labcode all combinations of selective enrichment media and isolation mediaThe highest number of positive isolations found with Blank n=2 SPan5 n=2 STM5 n=3 SE20 n=2 SE100 n=1 Good Performance 0 ≥ 1 ≥ 2 ≥ 1 1 1 0 2 2 2 1 2 0 2 3 2 1 3 0 2 3 2 1 4 0 2 3 2 1 5 0 2 3 2 1 6 2 2 3 2 1 7 0 2 3 2 1 8 0 2 3 2 1 9 0 2 3 2 1 10 0 2 3 2 1 11 0 2 3 2 1 12 0 2 3 2 1 13 0 2 3 2 1 14 0 2 3 2 1 15 0 1 3 2 1 16 0 2 3 2 1 17 0 2 3 2 1 18 0 2 3 2 1 19 0 2 2 2 1 20 0 2 3 2 1 21 0 2 3 2 1 22 0 2 3 2 1 23 0 2 3 2 1 24 0 2 3 2 1 25 0 2 3 2 1 26 0 2 3 2 1 27 0 2 3 2 1 28 0 2 3 2 1 29 0 2 3 2 1 30 0 2 3 2 1
Bold numbers: deviating results
4.4.2 Specificity, sensitivity and accuracy rates of the control samples
In Table 17 the specificity, sensitivity and accuracy rates for the control capsules without the addition of feed are shown. The rates are calculated for the different selective enrichment media (RVS, MKTTn and MSRV) and plating-out medium XLD. These rates were as expected or even better. For the low and high level SE capsules the rates were 100 %. For the low level materials SPan5 and STM5 the rates were close to 97 %. There was no difference between rates of EU members and the two non-EU members. In Table 17 the rates of all participants are given.
Table 17 Specificity, sensitivity and accuracy rates of the control samples (capsules without the addition of feed) n=29 *.
Control capsules RVS/XLD MKTTn/XLD MSRV/XLD
Blank No. of samples 58 58 58
No. of negative samples 56 56 56
Specificity in % 96.6 96.6 96.6
SPan5 No. of samples 58 58 58
No. of positive samples 56 56 57
Sensitivity in % 96.6 96.6 98.3
STM5 No. of samples 87 87 87
No. of positive samples 85 85 85
Sensitivity in % 97.7 97.7 97.7
SE20 No. of samples 58 58 58
No. of positive samples 58 58 58
Sensitivity in % 100 100 100
SE100 No. of samples 29 29 29
No. of positive samples 29 29 29
Sensitivity in % 100 100 100
All capsules with Salmonella No. of samples 232 232 232 No. of positive samples 228 228 229
4.5 Results feed samples artificially contaminated with Salmonella spp.
4.5.1 Results per type of capsule and per laboratory
General
The results of the Salmonella negative chicken feed samples artificially contaminated with capsules per selective enrichment medium in combination with the isolation medium giving the highest number of positives are summarised in Annex 7. In Table 18 the highest number of positive isolations found with all combinations of selective enrichment media and isolation media are given per laboratory.
Blank capsules with negative chicken feed (n=5)
Twenty-eigth laboratories correctly did not isolate Salmonella from these blank capsules with the addition of negative feed. Two laboratories (6 and 21) found 1 positive blank with the addition of negative chicken feed.
Laboratory 6 had found one blank capsule positive on all media. Laboratory 21 found only one positive blank after selective enrichment on MSRV. With the other media RVS and MKTTn they correctly found no positive blanks.
All blanks should be tested negative. However, as no 100 % guaranty about the Salmonella negativity of the matrix can be given, 1 positive out of 5 blank samples (80 % negative) is still considered acceptable.
S. Typhimurium 5 capsules (STM5) with negative chicken feed (n=5)
Twenty-five laboratories isolated Salmonella from all the five capsules containing Salmonella Typhimurium at a level of approximately 5 cfp/ capsule in combination with chicken feed when using RVS, MKTTn or MSRV. Five laboratories 2, 13, 21, 29 and 30 found one capsules negative with all three selective enrichment media. This is well acceptable as due to change some of the capsules may be negative in a batch of capsules at such low mean contamination level of 5cfp/capsule.
S. Typhimurium 50 capsules (STM50) with negative chicken feed (n=5)
All laboratories isolated Salmonella from all five capsules containing Salmonella Typhimurium at a level of approximately 50 cfp/ capsule in combination with chicken feed with the selective enrichment medium MSRV. Six laboratories 8, 15, 23, 24, 25 and 27 found one or more capsules negative when using MKTTn and laboratory 21 found one capsule negative when using RVS.
S. Enteritidis 20 capsules (SE20) with negative chicken feed (n=5)
Twenty-nine laboratories isolated Salmonella from all the five capsules containing Salmonella Enteritidis at a level of approximately 20 cfp/ capsule in combination with chicken feed at least with one of the used selective enrichment media RVS, MKTTn or MSRV. Laboratory 1 found one capsule negative when using RVS and MKTTn and they found two capsules negative when using MSRV.
Table 18 Total number of positive results of the artificially contaminated chicken feed samples per laboratory.
The highest number of positive isolations found with all combinations of selective enrichment media and isolation media Labcode Blank n=5 STM5 n=5 STM50 n=5 SE20 n=5 SE100 n=5 Good performance
≤
1 ≥ 2 ≥ 4 ≥ 2 ≥ 4 1 0 5 5 4 5 2 0 4 5 5 5 3 0 5 5 5 5 4 0 5 5 5 5 5 0 5 5 5 5 6 1 5 5 5 5 7 0 5 5 5 5 8 0 5 5 5 5 9 0 5 5 5 5 10 0 5 5 5 5 11 0 5 5 5 5 12 0 5 5 5 5 13 0 4 5 5 5 14 0 5 5 5 5 15 0 5 5 5 5 16 0 5 5 5 5 17 0 5 5 5 5 18 0 5 5 5 5 19 0 5 5 5 5 20 0 5 5 5 5 21 1 4 5 5 5 22 0 5 5 5 5 23 0 5 5 5 5 24 0 5 5 5 5 25 0 5 5 5 5 26 0 5 5 5 5 27 0 5 5 5 5 28 0 5 5 5 5 29 0 4 5 5 5 30 0 4 5 5 5S. Enteritidis 100 capsules (SE100) with negative chicken feed (n=5)
All laboratories isolated Salmonella from all the five capsules containing Salmonella Enteritidis at a level of approximately 100 cfp/ capsule in combination with chicken feed with the selective enrichment medium MSRV. Laboratory 25 found one capsule SE100 negative with selective enrichment medium RVS. Seven laboratories (labcode 1, 7, 14, 24, 27 and 28) found one or two capsules negative with selective enrichment medium MKTTn.
The results of all artificially contaminated chicken feed samples were compared with the definition of ‘good performance’ (see section 3.6) and all laboratories full filled these criteria.
4.5.2 Results per selective enrichment medium, capsule and per laboratory
In the Figures 1, 2, 3 and 4 the number of positive isolations per type of artificially contaminated feed sample is given per laboratory after pre-enrichment in BPW, selective enrichment in RVS, MKTTn and on MSRV, followed by isolation on selective plating agar XLD. For determining good performance per laboratory, all combinations of selective enrichment media and isolation media used by the laboratory were taken into account. In the figures the combination of selective enrichment medium and isolation medium giving the highest number of positives is indicated as ‘x’. Laboratory 21 did not confirm the isolations from XLD, therefore in the figures the results are given from Rambach.
The results of all artificially contaminated chicken feed samples were compared with the definition of ‘good performance’ (see section 3.6). In the Figures 1-4 the border of good performance is indicated with a black horizontal line.
The majority of the laboratories found the highest number of positive isolations when XLD was used as isolation medium. Five laboratories found differently when using MKTTn as selective enrichment medium. The laboratories 1, 7, 14, 15 and 27 found one sample more positive after isolation on either Rambach, Hektoen Enteric, Rapid Salmonella or Blaskal agar, when compared to isolation on XLD, after selective enrichment in MKTTn.
STM 5 0 1 2 3 4 5 1 2 3 4 5 6 7 8 9 10 11 12 13 14 15 Labcode Nu m b er o f p os it ive i sol at io n s RVS M KTTn M SRV x STM 5 0 1 2 3 4 5 16 17 18 19 20 21 22 23 24 25 26 27 28 29 30 Labcode N u m b er of p os it ive i sol at io n s RVS MKTTn MSRV x
STM50 0 1 2 3 4 5 1 2 3 4 5 6 7 8 9 10 11 12 13 14 15 Labcode N u m b er of p os it iv e i sol at ion s RVS MKTTn MSRV x STM50 0 1 2 3 4 5 16 17 18 19 20 21 22 23 24 25 26 27 28 29 30 Labcode N u m b er of p os it ive is ol at ions RVS MKTTn MSRV x
Lab 21 isolation results on Rambach instead of XLD
─
= border of good performanceFigure 2 Results of chicken feed samples artificially contaminated with STM50 capsules (n=5) after selective enrichment in RVS, MKTTn and on MSRV followed by isolation on selective plating agar XLD. The highest number of positive isolations found with all combinations of selective enrichment media and
SE20 0 1 2 3 4 5 1 2 3 4 5 6 7 8 9 10 11 13 14 15 Labcode N umb er of p os it ive is ol at io ns RVS MKTTn MSRV x SE20 0 1 2 3 4 5 16 17 18 19 20 21 22 23 24 25 26 27 28 29 30 Labcode N umb er of p os it ive is ol at ion s
SE100 0 1 2 3 4 5 1 2 3 4 5 6 7 8 9 10 11 12 13 14 15 Labcode N u m b er o f p os it ive is ol at ions RVS MKTTn MSRV x SE100 0 1 2 3 4 5 16 17 18 19 20 21 22 23 24 25 26 27 28 29 30 Labcode N umb er of p os it ive i so lat ion s RVS M KTTn MSRV x
Lab 21 isolation results on Rambach instead of XLD
─
= border of good performanceFigure 4 Results of chicken feed samples artificially contaminated with SE100 capsules (n=5) after selective enrichment in RVS, MKTTn and on MSRV followed by isolation on selective plating agar XLD. The highest number of positive isolations found with all combinations of selective enrichment media and
The differences in the number of positive isolations after 24 and 48 hours of incubation of the selective enrichment media are given in Table 19. XLD showed the highest number of positive isolations compared to other plating out media, independent on the selective enrichment medium used. The majority of the laboratories used BGA as the second plating out medium (see Table 5).
The choice of plating out medium does not seem to have a large effect on the number of positive isolations. Only when MKTTn is used for selective enrichment, XLD gave 6 % more positive results than other plating-out media.
The difference in the number of positive isolations after 24 h and 48 h of incubation of the selective enrichment media was the highest for MKTTn (Table 17), 6-8 % more positive isolations were found after 48 h of incubation. For RVS and MSRV the difference between the two incubation times was only 2-3 %.
Table 19 Mean percentages of positive results of all participating laboratories after selective enrichment in RVS, MKTTn and on MSRV, incubated for 24 and 48 hours and followed by incubation on different plating out media, when analyzing the artificially contaminated chicken feed samples.
Plating-out medium Selective enrichment medium RVS MKTTn MSRV
24 / 48 h 24 / 48 h 24 / 48 h
XLD 97 / 99 % 86 / 92 % 95 / 98 %
Other (most often BGA) 95 / 98 % 78 / 86 % 95 / 98 %
In Tables 20 and 21 differences between selective enrichment media and isolation media per capsule are shown as odds ratios (OR). In addition the 95 % confidence intervals and p-values are given. An odds ratio equal to "∞" means that it is very large. Usually this occurs when the odds of detecting Salmonella for the reference medium is zero or near zero. An odds ratio of zero means that the odds of detecting Salmonella for the other medium is zero. Laboratory 21 did not confirm isolations from XLD, so that these results could not be taken into account for the calculations.
The interpretation of Table 20 is as follows: given a selective enrichment medium the odds of finding a positive isolation with the different plating out media are compared. For instance the odds of finding Salmonella from the SE20 samples after selective enrichment in RVS is for XLD as isolation medium a factor 5.6 (OR) higher than for media other than XLD. If MKTTn is used as selective enrichment medium, XLD shows significantly more positive results. In general for MSRV and RVS the odds are also higher, but not significant. Laboratory 25 did not confirm isolation media other than XLD, so that these results could not be taken into account for the calculations.
Table 20 Number of positive isolations found with XLD compared to the number of positive isolations found with other isolation media, given a selective enrichment medium.
Samples : chicken feed, artificially contaminated with Salmonella positive capsules.
Selective
enrichment medium
Compared
isolation media Capsule Odds Ratios 95 % lower 95 % upper p-value
STM5 1.054 0.204 5.445 0.950 STM50 ∞ 0 ∞ 0.998 SE20 5.610 0.864 36.401 0.071 SE100 1.540 0.010 234.420 0.866 all SE 3.66 0.795 16.86 0.096 all STM 1.365 0.304 6.117 0.684 RVS XLD compared to other than XLD all capsules 2.232 0.845 5.896 0.105 STM5 1.969 0.981 3.952 0.057 STM50 2.333 0.988 5.513 0.053 SE20 2.843 0.998 8.097 0.050 SE100 1.941 0.735 5.125 0.180 all SE 2.385 1.185 4.800 0.015 all STM 2.136 1.240 3.681 0.006 MKTTn XLD compared to other than XLD all capsules 2.070 1.384 3.096 0.0004 STM5 1.247 0.315 4.930 0.753 STM50 1 0 ∞ 1 SE20 0.881 0.142 5.468 0.891 SE100 1 0 ∞ 1 all SE 0.892 0.170 4.687 0.893 all STM 1.223 0.320 4.675 0.769 MSRV XLD compared to other than XLD all capsules 1.083 0.407 2.881 0.873 STM5 1.490 0.8978 2.474 0.123 STM50 1.999 0.9514 4.199 0.067 SE20 2.662 1.243 5.700 0.012 SE100 1.704 0.708 4.099 0.234 all SE 2.220 1.265 3.897 0.005 all STM 1.636 1.081 2.477 0.019 All enrichment media XLD compared to other than XLD all capsules 1.828 1.316 2.539 0.0004
Table 21 Number of positive isolations found with a selective enrichment medium compared to the number of positive isolations found with another selective enrichment medium, given that the isolation is on XLD.
Samples : chicken feed, artificially contaminated with Salmonella positive capsules.
Compared selective enrichment media
Isolation
medium Capsule
Odds
Ratios 95 % lower 95 % upper p-value
STM5 0.141 0.041 0.487 0.002 STM50 2E-08 0 ∞ 0.992 SE20 0.310 0.046 2.090 0.229 SE100 0.113 0.010 1.259 0.076 all SE 0.187 0.046 0.760 0.019 all STM 0.083 0.026 0.265 2E-05 RVS compared to MKTTn XLD
all capsules 0.123 0.053 0.287 1E-06
STM5 0.766 0.157 3.748 0.743 STM50 1 0 ∞ 1 SE20 0.402 0.051 3.153 0.386 SE100 ∞ 0 ∞ 0.998 all SE 0.718 0.132 3.901 0.701 all STM 0.785 0.167 3.679 0.759 RVS compared to MSRV XLD all capsules 0.767 0.255 2.306 0.636 STM5 0.176 0.056 0.551 0.003 STM50 2E-08 0 ∞ 0.994 SE20 0.619 0.132 2.90 0.543 SE100 3E-08 0 ∞ 0.995 all SE 0.249 0.071 0.871 0.030 all STM 0.106 0.037 0.302 3E-05 MSRV compared to MKTTn XLD
all capsules 0.160 0.075 0.342 2E-06
Figure 5 shows the performance of each laboratory as odds ratios compared to the mean of all laboratories for the artificially contaminated samples. The blank capsules are not used in this calculation. The mean (= 1) is defined as the odds of detecting Salmonella based on the fixed effects only (capsule, enrichment medium and isolation medium). Laboratories below the mean have a lower odds to detect Salmonella. Ten laboratories 1, 2, 3, 9, 13, 15, 23, 24, 25 and 27 found significant lower number of positive results compared to the mean of all laboratories.
0.01 0.1 1 10 100 1 2 3 4 5 6 7 8 9 10 11 12 13 14 15 16 17 18 19 20 21 22 23 24 25 26 27 28 29 30 Labcode O dds ratio
■ significant lower number (p < 0.05)
■ not significant number (p > 0.05)
Figure 5 Performance of each laboratory compared to the mean of all laboratories for the artificially contaminated feed samples (without blanks).
4.5.3 Specificity, sensitivity and accuracy rates of the artificially contaminated feed
samples
The specificity, sensitivity and accuracy rates for all types of capsules added to the chicken feed are shown in Table 22. The results are given for the different medium combinations: BPW followed by selective enrichment in RVS, MKTTn and on MSRV and isolation on selective plating agar XLD. It was expected that the blank capsules and the high level materials scored close to 100 % and the low level materials scored a minimum of 75-80 %. The rates showed the expected or even better results. The specificity rates (of the blank capsules) were for all three selective enrichment media 99 %. For all capsules containing Salmonella, the sensitivity rates found with MSRV and RVS were higher than the rates of MKTTn. The sensitivity rates of the high level materials scored close to 100 % and the low level materials close to 97 % (found with MSRV and RVS).
There was no difference between the rates of EU Member States and the two non-EU Member States. In Table 22 the rates of all participants are given.