Netherlands Environmental Assessment Agency (MNP), P.O. Box 303, 3720 AH Bilthoven, the Netherlands; Tel: +31-30-274 274 5; Fax: +31-30-274 4479; www.mnp.nl/en
MNP Report 550033002/2007
India 2050: scenarios for an uncertain future
H.J.M. de Vries, A. Revi, G.K. Bhat, H. Hilderink, P. Lucas Contact:
Bert J.M. de Vries MNP-IMP
© MNP 2007
Parts of this publication may be reproduced, on condition of acknowledgement: 'Netherlands Environmental Assessment Agency, the title of the publication and year of publication.'
Rapport in het kort
India 2050: scenario’s voor een onzekere toekomst
India vervult een steeds belangrijker rol in de wereldeconomie – en daarmee samenhangend in grondstoffengebruik en uitstoot van stoffen. Het modelinstrumentarium om de kansen en bedreigingen voor India en voor andere delen van de wereld als gevolg van deze ontwikkelingen conceptueel te verkennen is echter beperkt. Dit rapport verkent de mogelijkheden om hierin verbetering te brengen, met name met het oog op de grote heterogeniteit in India die moeilijk in geaggregeerde gegevens tot uiting komt.
Modelgebaseerde berekeningen wijzen op een bevolking van meer dan 1,5 miljard mensen rond 2050; deze groei van met name jongere en beter opgeleide bevolkingsgroepen is één van de aandrijvers van de economische groei. Vooruitberekeningen met het demografisch model PHOENIX en het IFs Economy model laten zien dat een dergelijke gelijktijdige groei van bevolking en welvaart kan plaatsvinden mits er voldoende en tijdig wordt geïnvesteerd in gezondheidszorg en onderwijs. Uit aanvullende berekeningen, onder meer met het TIMER energiemodel, blijkt tevens een niet geringe kans op ecologische en sociaal-economische beperkingen voor een dergelijk ontwikkelingspad. Een werkelijke verbetering van het welzijn van een groot deel van de Indiase bevolking zal dan ook afhangen van het tijdig realiseren van de benodigde investeringen in gezondheidszorg en onderwijs en het duurzaam ontwikkelen van India’s hulpbronnen (land, water, energie) – met visionair en krachtig overheidsbeleid als onmisbaar onderdeel.
Contents
Summary...6
1 Introduction ...9
2 India – trends and plans ...13
2.1 India – an emerging force in the world...13
2.2 Major long-range trends for 21st century India ...13
2.3 Medium-Range Planning in India: past and present ...15
2.4 Rationale for an India 2050 model...17
3 India: important trends 1950–2000 ...19
3.1 Population ...20
3.2 Land/food ...22
3.3 Economy ...24
3.4 Derived demands: energy, transport and water...29
3.4.1 Energy...30
3.4.2 Transport...32
3.4.3 Water ...33
4 India 2020–2050: forward projections...35
4.1 General considerations...35
4.2 Scenarios on population, food, water and energy ...36
4.2.1 Population: PHOENIX-model simulations ...36
4.2.2 The economy: production and consumption ...43
4.2.3 Food and water ...48
4.2.4 Energy...52
5 India 2050: forward projections with the IFs model...59
5.1 The IFs model ...59
5.2 IFs simulations for India ...61
5.3 Key issues in the IFs implementation for India ...66
5.3.1 Population...67
5.3.2 Economy...67
5.3.3 Food-Energy-Water ...68
Conclusion ...69
Annex A Project proposal ...75
Annex B Acronyms ...76
Annex C India 1950–2000 trends...77
Annex D Demographic projections ...93
Annex E Input-output (I-O) classification...96
Annex F Food and water projections ...100
Annex G Energy projections...104
Summary
In the last decades, there have been large demographic and economic changes in India, a country where one out of every six people in the world live. The major long-term trends identified in this and other reports project an increasing role for India in the global economy and, correspondingly, in resource use and emissions. However, the tools to explore the opportunities and threats for India and for other parts of the world as a consequence of this development suffer from conceptual limitations, which are particularly evident in terms of the large heterogeneity of India, which is difficult to capture in aggregate average data. This report explores options for improvement.
Among trends shown in India during the second half of the 20th century, the most important are: a declining but still large rate of population growth; a successful improvement of the food situation with constraints emerging for further expansion; a rapid but unbalanced and unequal economic growth since the 1990s; a rapid growth in energy and water demand that can only partially be met.
The official projections for India expect a slowly stabilizing population and a sustained high rate of economic growth for the next three to five decades. Model-based simulations suggest a population of over 1.5 billion people by 2050, with an increase in the size of the younger and better educated population being one of the drivers of economic growth. These projections presume adequate investments in health care, water and sanitation and education – hence, also an adequate tax base and governance and institutional context. These expectations imply a significant increase in the average level of the standard of living.
Forward calculations with the demographic model PHOENIX and the International Futures (IFs) Economy model show that such developments of population and income are possible, provided that sufficiently and timely investments in health care and education take place. Additional model simulations, among others with the TIMER energy model, indicate that ecological and socio-economic constraints might bar these positive developments and drive the country into other directions. Of particular importance in this respect are the reliable provisions of sufficient food, water and energy of sufficient quality. Another important challenge is to appropriate livelihoods and incomes that enable poor agrarian populations to access these basic amenities in an increasingly market-linked economy. A real increase in well-being for a large part of the Indian population will therefore depend on appropriate and timely investments in education and health and on sustainable management of India’s resources (land, water, energy) – with visionary and strong government policy initiatives being necessary to achieve this.
An exploratory analysis of a number of future developments in India with the Ifs-model shows that a stabilization in the population at an income level comparable to that of present-day Western Europe is in principle possible. The analysis also indicates, however, that a number of possible feedbacks from the environment (pollution of air and water, climate change) and preconditions to be met in the areas of taxation and governance are so uncertain, that the conclusions of the available model outcomes should be considered with caution. It
turns out that even in these optimistic forward projections the aspirations expressed in the Millennium Development Goals (MDGs) are (too) high.
The conclusion drawn in this report is that more (model-based) research is needed and that this research should focus on the nature of the (aspired) economic growth, on the required size and nature of investments in health, education and other (land, water, energy, transport) infrastructure and on the potential feedbacks and impacts from the environment. Only by adopting this approach will tools become available which have the potential to form the basis for carrying out meaningful long-term assessments of the developments in this – in global terms – increasingly important country.
Acknowledgement
We would like to acknowledge the input from Barry Hughes and Haider Khan of the University of Denver, both during and after the workshop at MNP in June 2006. Many thanks to Arindam Mandal who helped process and validate the I-O data set for India that was used in this analysis. The discussions with researchers at the Indian Institute of Science in Bangalore, at the Indira Gandhi Institute of Development Research in Mumbai and with members of the Balaton Group during the Annual Meetings have deepened our insights. We thank Detlef van Vuuren and Morna Isaac for the permission to use the recent energy scenarios and Bas van Ruijven for the shared travel experiences and discussions in the spring of 2006.
1
Introduction
The Netherlands Environmental Assessment Agency (MNP) supports national and international policymakers by analysing the impacts of societal trends and policies on the environment. Within this framework, one of the major aims is to construct regionalized sustainability models to assist the research and policymaking processes related to Climate and Global Sustainability (Klimaat en Mondiale Duurzaamheid, KMD). This effort should use the existing models at MNP as a starting point, notably the population model PHOENIX, the energy model TIMER and the land-use, land-cover and emission/climate model IMAGE. The product should be a Global Integrated Sustainability Model or GISMO. This report presents the preliminary work that has been carried out in terms of context and outline for such a model of a major the world region: India. It is based on a small project conducted between September 2005 and June 2006 by Aromar Revi (TARU Delhi) and Bert de Vries (MNP) and on a 3-day workshop in Bilthoven in June 2006 with participants from the University of Colorado (Barry Hughes and Haider Khan), TARU (Aromar Revi, G K Bhat) and MNP (Henk Hilderink, Tom Kram, Ton Manders, Paul Lucas and Bert de Vries) (compare Appendix A). Both the project and the meeting were financed by MNP.
Global Change models. The objective of this report is to explore options and pitfalls in using
Global Change models for an exploration of the future of the India region 1. Since the
construction of the first world model to explore the consequences of exponentially growing human populations and activities – the World3-model published in the Limits to Growth report to the Club of Rome (Meadows et al. 1972, 1991) – a suite of Global Change models have been constructed and used (see, for example, De Vries 2006). Several, such as the TARGETS-model (Rotmans and De Vries 1997), and the GUMBO-model (Boumans et al. 2002) resembled the World3-model in treating the world as a single aggregate system. Others focused instead on the regional dynamics and on the interactions of a region with the 'rest of the world'. Such a disaggregation was usually still rather crude, although the increasing availability of satellite data and Geographic Information System (GIS) software packages led to a rapid increase in spatial land-use land-cover descriptions and, in some places, land-use change processes. An example is the IMAGE-model (Alcamo et al. 1998; www.mnp.nl/image).
In terms of more complex developments, such as economic development, the dynamics of technological innovations and socio-political processes, formal modelling was understandably less advanced. One early attempt was the Globus-model, which attempted to capture the dynamics of political conflict (Bremer et al. 1987). This has been expanded in the subsequent years into the IFs-model (Hughes 2001; http://www.ifs.du.edu/). Another
1 In the previous IMAGE-TIMER version, the region South-Asia includes India, Pakistan and Bangladesh. In the most recent
direction was to develop national models in rather large detail, within a largely exogenous 'world development' context. A prime example is the Threshold-21 (T21) model collection (Barney/Millennium Institute; http://www.threshold21.com/).
GISMO. The MNP has adopted the strategy to develop a modelling integration tool called the
GISMO-project with the aim of being able to address sustainability issues in a broad, integrated approach, with the durability and distribution of quality of life or human well-being as one of the major outcomes of sustainability. GISMO aims at:
1) Integration of the sustainability domains to gain insights in underlying dynamics of sustainable development make interactions between various domains visible (feedbacks, trade-offs between now and here to then and there, and co-benefits);
2) Positioning of, and integration with, the institutional domain; 3) Exploration of different scenarios and policy interventions.
As part of this endeavour, a workshop was organized at MNP in June 2006 with involvement of the MNP Global Change modellers (PHOENIX, IMAGE, TIMER), of the IFs team of the University of Colorado and of TARU New Delhi. Among the models used in this GISMO-project and discussed in this report are: the population and health model PHOENIX, the IFs Economy Module which uses (parts of) the IFs-model and the TIMER energy model, the land component of the IMAGE model and a water impact module.
Why India? Desaggregation in global change models had a natural tendency to rely on the
data, trends and mechanisms observed in the 'developed' countries of the Organization for Economic and Co-operation Development (OECD). Such an inherent globalizing-world bias led to the representation of less developed regions being as much a reflection – if not more so – of the OECD-societal values and institutions than those actually existing in the less developed regions. This was partly due to the overwhelming complexity of the increasingly interconnected world system, which often resulted in the easiest and most tractable approach being acceptance of the assumption that India, China and other large countries such as Brazil, Indonesia and Nigeria were all going to experience rapid economic growth – and in the process become more and more 'modern' in the Western sense of the word. The models were then used to assist multilateral institutions in issues of economic (under)development, trade and transboundary pollution. Indeed, these models do have generic modules (e.g. demographic, agriculture, international trade and finance) that have wider applicability than the context in which they were developed. Nevertheless, a large number of the central concerns of a developing nation (e.g. equity, employment, urbanization) undergoing a moderately fast economic transition and a slow but dramatic social transformation remain unaddressed 2.
2 This bias was quite obvious during the construction of the emission scenarios for the Intergovernmental Panel on Climate Change
Thus, although there is quite a large set of Global Change models available, they continue to have serious shortcomings, in particular for use in non-OECD-countries. The goal of the small-scale project, the outcome of which is presented here, is to:
• Explore some key trends, in some quantitative and qualitative detail, occurring in India over the past decades;
• Review a few dynamic national and global models and scenarios that have the potential to guide the development of a modelling framework:
o for long-range planning for India as a complement to existing macro-economic approaches, and
o for integration in KMD-MNP’s Global Sustainability work in the form of a tested part of the GISMO;
• To undertake exploratory model simulations in order to determine the shortcomings in data and deficiencies in concepts, to trace potentially dangerous and risk-prone development paths and to confront outcomes with expert views.
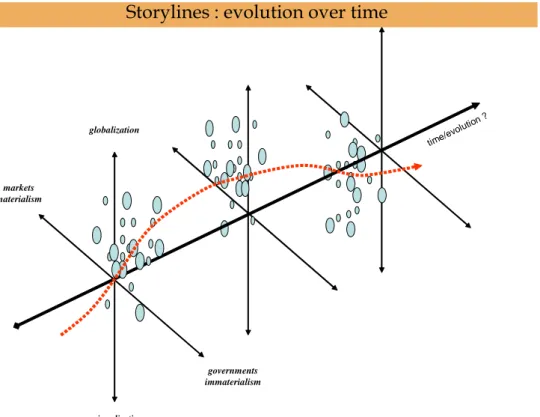
To this end, we present a number of preliminary model simulations in order to determine shortcomings in data and deficiencies in concepts, to trace potentially dangerous and risk-prone development paths and to confront outcomes with expert views. The system dynamics diagrams presented below are a shorthand representation of our aim. The upper part of the graph indicates the mental map behind most of the desired and expected projections of (high) economic growth for India over the next decades. The lower part of the graph additionally shows the forces which may obstruct such growth in economic activity and/or reduce the improvements in the quality of life expected from it.
Population
Income
(GDP/cap)
Desired
family size
Health care,
sanitation etc.
Capital stocks
Savings &
(foreign)
investments
Education
Labour
productivity
Economic
output (GDP)
+
-+
+
±
Population
Income
(GDP/cap)
Desired
family size
Health care,
sanitation etc.
Capital stocks
Savings &
(foreign)
investments
Education
Labour
productivity
Economic
output (GDP)
+
-+
+
±
Population Income (GDP/cap) Desired family size Health care, sanitation etc. Capital stocks Savings & (foreign) investments Education Labour productivity Economic output (GDP) +
-+ + Income inequality Unequal access Unemployment, wealth inequality Cultural resistance Environmental feedbacks Population Income (GDP/cap) Desired family size Health care, sanitation etc. Capital stocks Savings & (foreign) investments Education Labour productivity Economic output (GDP) + -+ + Income inequality Unequal access Unemployment, wealth inequality Cultural resistance Environmental feedbacksIn more concrete terms, the focus in this report is on the following items:
• a qualitative analysis of the major socio-economic and political trends which have shaped India over the past 40 years (Chapter 2);
• a quantitative analysis of the major trends in the last 40 years in population, agriculture and economy and the derived inputs energy and water (Chapter 3);
• a brief overview of the projections of key variables in India’s development over the next 20–100 years, based on MNP models and others (Chapter 4);
• an analysis of the projections of key variables for India in the 21st century with the Ifs-model (Chapter 5).
A series of Annexes presents more detailed information, on historical trends and forward projections for key variables, on input-output tables constructed for India for several years since 1978 and on some insights gained from discussions with experts.
2
India – trends and plans
2.1
India – an emerging force in the world
It should be a matter of considerable international concern that India – with the world’s second largest population and fourth largest economy (in purchasing power parity (PPP) 3
terms), the largest concentration of poor people in history (over 270 million) and weaponised nuclear power – has no systematic analytical framework by which to explore long-range economic and resource management options. In spite of having a long history of economic planning and a large pool of talented economic and planning professionals, India’s development focus is typically on the short-term (1–5 years) and at most on the medium-term (10–20 years) time horizon.
Given the dramatic demographic, economic, geo-political, resource and climate-related changes that are expected in the first half of the 21st century, the lack of a structured dialogue on key long-term challenges ranging from cross-border migration, fossil fuel scarcity and the potential conflicts between current and future Great Powers to the transition to renewables within India should be a matter of great concern.
This is not only a question of international development that should be relegated to the United Nations (UN), multinational finance institutions and OECD country development assistance and foreign affairs departments. India’s future is a central question that will impact all peoples across the world because of its large future population (1.5 billion by 2050), large economic size (possibly the third largest economy in real terms by 2040) with a primarily poor population (per capita gross domestic product (GDP) in 2002 of 2,365 Indian Rupee (INR) of 1995), massive market size, severe resource constraints (land, water, liquid fossil fuels and biomass) and huge potential to contribute to greenhouse gas (GHG) emissions and transboundary pollution. With greater global interconnectedness and potentially greater insecurity, the future of the Indian people, its markets and its polity will become an important strategic concern for most OECD nations and, indeed, humankind.
2.2
Major long-range trends for 21st century India
A broad-brush look at India in the first half of the 21st century suggests the following, incomplete list of 18 trends:
1. Indian population grows from 1,000 million to over 1,500 million;
2. Ecosystem and land-cover changes take an ever larger share of Net Primary Production (NPP), with an increase in food production and urban land area;
3. Water-resource preemption and development for agricultural, industrial, energy and urban use;
4. Development of non-renewable (coal, oil, gas and nuclear) and renewable (biomass and wind) sources, technologies and infrastructure to meet increasing shortage in energy supply;
5. Slow urbanization led by large metropolitan growth with large informal settlements, poor infrastructure and declining living and working conditions;
6. Slow rural-agrarian transition to secondary and tertiary economic sectors, with the collapse of artisanal production, growth of non-farm rural livelihoods, informal urban services and public employment, ‘jobless’ growth and informalization in the industrial sector and rapid growth in organized services;
7. Expansion of the Indian ‘state’, with increasing democratic participation; political conflict between forward and backward castes, ethnic and linguistic groups for dominance, entitlements and patronage in the process of social and economic transformation;
8. Growth of the ‘black economy’, decay of public institutions, corruption and the massive increase in public programmes and spending in aid of special interest groups;
9. Increased life expectancy and slow growth in the quality of human development with the expansion of education, health and human services accompanied by a low growth in efficiency and a more informal and private provisioning of low quality despite large public investments and expenditure;
10. Development of new entrepreneurial institutions and classes in the private, cooperative and social/non-profit arena;
11. Slow decline in poverty, with increases in some regions; more rapid increases in differential wealth creation by new entrepreneurial classes, urban elites and entrenched dominant caste and trading groups;
12. Growth of knowledge-based services and industries and enclaves of excellence and globalization-linked wealth creation;
13. Growth and transformation of capital and commodity markets and formal financial systems and monetary and financial regulation, increasing penetration into the informal economy and inflow of international financial capital;
14. Development of strategic nuclear and missile capacity; ongoing low to medium-level conflicts along western and north-eastern borders; massive expansion of paramilitary and internal security forces with slow modernization of conventional military;
15. Increase in passenger and goods mobility and network coverage, with a shift towards road and personal vehicles and away from rail and water-borne transport accompanied by poor infrastructure quality, bottlenecks and high social costs;
16. Growth of religious intolerance, pockets of fundamentalism and new spiritual and social movements;
17. Increasing seasonal and permanent migration out of arid, semi-arid and strife torn regions to cities, and the emigration of skilled manpower to create a wealthy diaspora that has increasing influence on investment, entrepreneurship and politics;
18. The mobilization of lower-caste (Dalit) groups and of women in Indian society, with significant consequences for the social and political dynamics.
This list is neither complete nor unique. We do believe, however, that it covers most of the relevant items in the context of this report. In the next chapter, we discuss some subtrends and their proximate determinants over the 2nd half of the 20th century which are at the basis of this qualitative prospective (see also Annex C). The major data sources have been the TERI-TEDDY 2003-2004 dataset and the World Bank World Development Indicators 2004. The
TERI database also provides for each subsector a brief overview of major trends and prospects.
2.3
Medium-range planning in India: past and present
Medium-term (10–20 years) planning has been a feature of Indian national development processes since the 1930s with the creation of the Planning Committee of the Indian National Congress that was headed by Jawaharlal Nehru, later India’s first Prime Minister. This created the core economic and developmental vision that underpinned the Constitutional settlement of 1947–1950. Running almost concurrently with this was the ‘Bombay Plan’, the vision of the national ‘private sector’ which – to the great surprise of many observers – maintained a very similar emphasis: a state-lead in economic development, public sector-led development of the core sector and moderate to high levels of regulation, among others. Based on these ‘vision’ documents and the success of the Soviet Union’s growth trajectory of the post-World War (WW)II era, India launched on its own a series of Five-Year Plans in the mid-1950s, with an emphasis on developing a planned mixed economy. A non-statutory body, the Planning Commission was created to lead and anchor this process in 1950, and the process itself was underpinned by the Mahanalobis-model (five-sector Input-Output (I-O)-model) that provided the growth and investment structure for the Second Plan (1957–1962). Under the influence of Mahanalobis and leading econometricians and operations research (OR) specialists of that era, subsequent Plans were based on an expanding the I-O-framework and eventually on Social Accounting Matrices (SAM) in order to estimate the economic and sectoral growth rates, sectoral investment shares and employment potential that would be generated. This was typically undertaken over a 5-year cycle with a mid-term appraisal of progress made under the Plan.
This process continued even after a period of liberalization (early 1990s), at which time the first- (1991–1996) and second-generation (2001–current) economic reforms occurred. The role and the centrality of the Planning Commission declined over the 1990s with the increasing influence of the Ministry of Finance on economic and development policy, the greater political decentralization of India’s 28 states and the lower public financing of the Annual Development Plans. However, the planning process has been making a strong comeback since the late 1990s, with an increasing emphasis on decentralized planning in the 0.6 million villages, 5,500-odd urban settlements and 600-odd districts of India’s 30 states. The Planning Commission’s new role of investment mobilization for the national economy is also slowly developing with a more market-driven approach since 2004.
The medium-range (10–20 years) planning has been very broad-brush, through the vehicle of the Perspective Plan that typically provides context to each Five-Year Plan at the national level. Very few States have undertaken this exercise as they work within a fairly constrained economic envelope that is partially dictated by India’s federal structure and resource transfers
from the central government. Perspective Plans have typically been ‘vision’ documents that are not strictly linked to an economic model. The most recent effort was the development of a series of India 2020 visions, propelled by the work of the current President of India to make India a ‘developed nation by 2020’ (Planning Commission 2002). These exercises at both the national and state level are drawn from the strategic planning tradition more than strict economic or development planning. Typically produced by committees, they often contain contradictory omnibus statements of intent.
The Five-Year Plans continue to be analytically supported by three interrelated, but not necessarily integrated analytical processes:
• a population forecast based on a cohort population model; • a national and sectoral econometric growth forecasting model;
• a national and sectoral investment estimation model (based on the growth model and derived via estimates of Incremental Capital Output Ratios (ICORs). This focuses on estimating public investment with private firm and household investments as the residual;
• a recent broad-brush econometric employment potential estimation model.
No attempt has been made to link these multiple analytical exercises into an integrated single or multilevel model that links population, resources and economic development. The closest attempts at integration have been the development of larger I-O-models to specifically examine the impact of energy policy and technical change in the 1980s. Some linkage to medium-scale Computable General Equilibrium (CGE) models have been developed by research institutions and academics.
With the decline in the importance of planning in the 1990s, few attempts at building independent national models for the Indian economy have been made publicly available. The most widely used are the CGE-models utilized by the World Bank (RMSM and its derivatives) and the International Monetary Fund (IMF) to develop their country growth forecasts and Country Development Plans 4. The Energy and Resources Institute, formerly the
Tata Energy Research Institute (TERI), has attempted to develop an India-centric long-range energy forecast, known as GREEN 2047 (TERI 2001), and independent academics have prepared independent medium-range forecasts. In keeping with the short-term view of much of the economic development currently taking place, especially in this post-liberalization era, the primary focus of economic, monetary and sectoral policy continues to be one of the short term.
4 It should be noted that India has refused to participate in the World Bank Group-led Poverty Reduction Strategy Paper (PRSP)
process..Nevertheless, the initial framework for the World Bank’s analysis of poverty has been strongly influenced by extensive Indian work on this question (Alhuwalia, et. al., 1979)
2.4
Rationale for an India 2050 model
It is a matter of concern that a country such as like India, which is so large in terms of people and economic activities, has hardly any integrative analytical framework with which to explore long-range economic and resource management opportunities and constraints in the context of the aspiration for a sustainable long-term development path. Given contemporary trends of increasing uncertainty, processes of moderate economic growth, technological and social transformation and massive population pressures combined with resource conflicts and weakening governance, an analytical framework could provide a common platform for dialogue on options – if it is constructed to respond to the more important contemporary policy and development questions and debates.
At the same time, it is essential for the work on global sustainability at MNP being carried out for, among others, the United Nations Environment Programme (UNEP) (GEO-IV) to work towards an integration of the existing, rather detailed land-use land-cover and climate model (IMAGE), population model (PHOENIX) and energy model (TIMER). If an adequate Regional Integrated Sustainability Model (RISMO) can be constructed for a region like India, it can serve as a template for the other regions in the IMAGE–PHOENIX–TIMER modelling framework. It can also be used to test the use of an overarching I-O-framework (as used in IFs and/or based on the Global Trade Analysis Project (GTAP) as a relatively simple and straightforward approach to evaluate sustainability goals – such as the Millennium Development Goals (MDGs) – with the capital, resource and other constraints.
This project is an initial first step to help define such a framework and to test it in a rudimentary manner against time-series data using a few broad-brush scenarios. Subsequent steps may include attempts at a more in-depth study of the approach along with the development of a two-level model (one for the Centre: All India, and one for the States) along with the integration of GIS-based geographically explicit models as well as attempts to link the approach with more detailed bottom-up resource, population and economic models that operate at the district and lower levels of aggregation. This would enable the linkage with geographically explicit global resource and economic development models.
3
India: important trends 1950–2000
In this chapter we briefly discuss some trends in population, land/food, economy and energy and water in the second part of the 20th century. The framework for this is the sectoral disaggregation as used in Global Change models such as TARGETS (Rotmans and De Vries 1997) and IFs (Hughes and Hillebrand 2006), which will be discussed in detail in a subsequent section.
One research problem is that comprehensive data are often available only at the aggregate All India level. At the more disaggregate level of states, districts and cities and towns, the available data appear to be rather patchy and awaiting analysis. This is understandable: at the more desaggregate level one has to incorporate the geographical, economic and socio-cultural heterogeneity which still exists in India and which may – for certain development pathways – be rather crucial. On the other hand, several projects – for instance, those on available biomass (compare Annex I) – are remarkable in their level of detail and width, so it may also be a matter of limited access and/or communication. In any event, serious forward projections for energy – but also for food and water – cannot rely on trend extrapolations for All India. They have to use the more desaggregate data and phenomena, if only because the opportunities and tensions emerging over the next decades will vary significantly. Although a significant body of data does exist, analysis of the long-term trends at the state level are rare. In our analysis we find that a district-level description of demographic trends appears possible in terms of data. However, given the complexities of rural–urban migration, it is preferable to start at the state level. For economic activities, the situation is more difficult: even if state-level sectoral I-O-matrices become available, it will be hard to track the interactions with the increasing interstate fluxes of goods and people. In fact, it may be better to desaggregate in terms of characteristic economic zones. There are large and detailed data bases available for food that allow, in principle, a fairly rigorous analysis at the district level. The agro-ecological zone and soil maps can provide essential background features. The same holds for water, for which at least four subregions are to be distinguished. Here, the climate and precipitation data and the occurrences of ground water form necessary background data. The energy system has a natural scale element for sources such as hydropower, wind, biomass and solar-PV. However, an increasing part of the energy system consists of fossil fuels, for which transport is rather easy – here, the position of coal fields is an important element if only because of the large amounts of ash in Indian coal.
Scales. The modelling framework to deal with (un)sustainable development issues, including climate change and development goals, covers various scales in space and time. Causes and consequences of global environmental change are, in these models, simulated in process chains, mostly in the form of material stocks and flows. In addition to data availability, the appropriate scale is also set by the nature of the processes and the objectives of the model experiments. Descriptions that are too fine-grained will have a huge data demand and possibly end in more,
and not less, uncertainty. Descriptions that are too coarse-grained omit details which may be essential to understanding the nested dynamics involved or necessary to delivering meaningful policy messages.
A second aspect of the issue is the divide between the engineering ‘bottom-up’ approach and the (macro-) economic ‘top-down’ approach of modelling socio-ecological systems. This is partly a matter of conceptual simplification: the absence of humans in the engineering system and the extreme simplification of humans as economic-rational actors with perfect foresight in the economic system. Novel approaches in economic science, associated with the emerging branches of ecological and evolutionary economics, are advancing more realistic and heterogeneous descriptions of human behaviour. In the engineering sciences, there are continuing attempts to formulate a framework in which thermodynamic principles and units are merged with economic ones and in which material balance and process analyses are linked to economic I-O-frameworks and data.
3.1
Population
The Indian subcontinent has been for hundreds of years near its carrying capacity, in the sense that its population was so high that disturbances in the form of natural catastrophes or foreign invasions could easily lead to
large-scale disruption. Figure 1 indicates the frequency of famines in the regions of the Indian subcontinent (De Vries and Goudsblom 2002), which is one indicator of the rather precarious food situation in pre-Independence India. Whatever the causes were, the food situation has dramatically improved in the second half of the 20th century.
Figure 1 Famine years in India in the past (De Vries and Goudsblom 2002)
Figure 2 Population growth rate versus income (with and without PPP correction) 1960–2000 (WDI).
Since independence from British rule in 1947, India has undergone huge changes in population size, in the size and patterns of its economic activity, in its interactions with the rest of the world and in its regional and global use of resources and the environment. A first Pop-growth vs. Income: India 1960-2000
0 0,5 1 1,5 2 2,5 0 500 1000 1500 2000 2500 Income (cap/yr) P o p -gr ow th ( % /y r)
GDP per capita (constant 1995 US$) GDP per capita, PPP (constant 1995 i t ti l $) Famine in India: occurrence in regions 0 15 30 45 1750-1800 1800-1850 1850-1900 1900-1950 1750-1950 pe riod % o f fa m in e ye ar s in t o ta l year s west south north central east
important point to note is that the Indian population has passed through the second stage of the demographic transition: its population increased between 1960 and 2000 from about 450 million to over 1 billion people. Death rates have steadily declined and seem to have stabilized somewhere between 8–9 per thousand. Life expectancy at birth has risen from 45 to 65 years. Birth rates have also declined, as shows up in the large decline in the fertility rate from over six live births per woman to about three. However, the difference between (average) death and birth rate is only slowly decreasing, and population growth is expected to continue for at least another 50 years.
The assumption of population growth rate being a parabolic function of income is not borne out by the trends since 1960. With the exception of 1960 and 1961, annual population growth has been declining with rising income (both in USD and INR) (Figure 2). However, the rise in income must be considered to be a major co-phenomenon that has permitted other important drivers to bring significant improvements in the food situation and medical and physical infrastructure since 1960, leading to (Annex C):
• a decline in child malnutrition, although it is still high;
• a gradual rise in the use of contraceptives and in birth attendance by skilled health staff;
• a significant increase in immunization programs and improvements in access to clean water sources, although a much slower access to sanitation;
• an increase in health expenditures as a fraction of income, showing up in the higher number of physicians and hospital beds per inhabitant, among others.
All these developments form part of what has been called the health transition, during which the emphasis shifts from environment-related causes of disease and death to more welfare-related causes (Niessen and Hilderink 1997). In the background, other developments have coincided and probably also been instrumental in this process, notably education. Spending on education has been on the rise, albeit with ups and downs, and the general level (literacy rate, school completion rate) of educations appears to be increasing as a long-term trend (Annex C).
An important aspect of population is its distribution, a first crude measure of which is often the urbanization rate. Although there are various definitions, the process of urbanization – that is, the more or less permanent migration of people to urban high-density areas – is occurring throughout the world – and India is no exception. The benefits of more income earning opportunities and better access to food and other amenities are, among others, major drivers. These may at some point no longer offset the disadvantages of living in ever more crowded urban metropolis. It is hard to say when this will happen, but there are signs that it may not be in the not-too-distant future in India. Perceptions and policies play an important but ambiguous role. During the past century the population density has increased throughout India, but this has not led to significant concentration at the state level (Figure 3).
Although numbers may be unreliable and give a distorted view of the reality behind it, it is clear that Indian society has experienced ‘modernization’ in a widespread and deeply
significant way. For large and increasing important aspects of Indian society, it may also be argued that this success has led to such a population increase that Indian society at large is now in an equally or more precarious situation than in the past. This will be explored in subsequent chapters.
Figure 3 Population density in Indian states for four years since 1880 (Klein Goldewijk 2005).
3.2
Land/food
5Land and its characteristics are the first and foremost resource for human beings. According to official statistics, there has hardly been a change in land use in India since 1960 (Annex C). India’s total land area is 300 million ha, of which about 23% is reported to be forest (including some cropping and grazing) and some 14% is reported to be unavailable for cultivation (urban areas, mountains, deserts…). The remaining area of about 195 million ha is largely used for agriculture – including land under fallow and tree crops. Pastures and other grazing lands comprise only about 10 million ha. Based on reports compiled over time, only the forested area has increased in size.
These statistics clearly indicate that India has only managed to feed its growing population by significant intensification. Since the 1960s the food situation has improved dramatically, commonly associated with the success of the Green Revolution in part of north-western India. Although the All-India results provide an inaccurate picture as they hide the disparities across the region, they still give an impression of the important transition which has been going on during the last four decades. Agricultural intensification has caused a 2.5-fold increase in crop production, with almost no extension in arable land – reflecting a large increase in crop yield. This was made possible by:
• the rapid increase in the use of yield-improving inputs, notably including – in addition to increased knowledge and skills – tractors (from almost none to some 2 million), fertilizers (from near-zero in 1960 to over 50 kg/ha in 1985 and to >90 kg/ha since then) and pesticides (from almost zero to over 0.4 kg/ha in 1988) 5;
• a concomitant rise in irrigated cropland from 15% to 30% of cropland (World Development Indicators (WDI) 2004) and in gross terms from 17% in 1951 to 39% in 2000 (IndiaStat);
5 These high-yielding varieties (HYV) are varieties of seeds which have been developed scientifically with the help of plant
breeding. Their area has increased from 9% of gross sown area in 1970 to 41% in 2000 – a remarkable increase indeed. As to the use of N+P+K fertilizers, IndiaStat gives a 240-fold increase of 0.7 mln tonnes in 1950 to 167 mln tonnes in 2000.
Population density: states in India 1880-2000 0 200 400 600 800 1000 West Beng al Kerala Uttar Prades h Punja b Goa Jhark hand Assa m Andh ra Prad esh Oriss a Madh ya P radesh state p eo p le /k m 2 1880 1921 1961 2001
• a rise in multicropping: the ratio of total cropping area and net area sown has increased from 1.11 to 1.32.
As a consequence and in line with political objectives, there has been a decline in food imports: India is now largely self-sufficient in terms of providing food for its people. The environmental consequences of this intensification process are less clear, though some regions in Punjab and Haryana are reporting salinization and soil erosion. With the prospect of a steadily increasing population, the intensification has to continue – which makes the question of environmental sustainability as well as the success of new (bio-)technologies of great importance. Yet, there is room for choice and change. For example,, there is a tendency for fertilizer use to decline, and pesticide use has declined by over one third between 1988 and 2002.
In the post-independence period, agriculture and water management were characterized by several developments:
• Food shortages in the pre-1960 period led to large-scale investments in water resource development, specifically in the form of large- and medium-sized dams;
• During the 1950s and 1960s, key events were the construction of dams and the Green Revolution. The accent was on high-yielding varieties (HYV) with a neglect of millets and other semi-arid crops;
• Fom the 1970s onwards, the major developments were the expanding use of ground water and the availability of subsidized electricity at close to no cost;
• There was also an expansion and a shift to cash crops like sugarcane and cotton, driven by groundwater technologies;
• The 1990s saw growing differentials spatially and ground water droughts; around the year 2000 key issues were the reform of the electric power sector and the increasing distress of farmers in the semi-arid tropic (SAT) regions.
In terms of the growth potential of agriculture and, in particular, irrigated agriculture, it is to be noted that the potential for expansion of the net sown area (NSA) is very minimal and that the growth in gross sown area (GSA) is tenuous and very slow (1%/yr, with negative growth during drought years). Since the 1990s, the growth in gross irrigated area (GIA) has largely been driven by groundwater availability. There has been a decay of traditional water harvesting tanks (reduction from 4 to 3 Mha during the 1971–1991 period). Investments in surface water development since the 1990s have been low and the land area irrigated by canals is declining due to poor maintenance. Food grain yields and production have peaked in most regions in recent years.
What are the constraints for agricultural and irrigation development in India? There are a number of constraints related to the agro-ecological resource base, whereas others are interwoven with the institutions and policies which have shaped the present situation. Important constraints are:
• state boundaries are not compatible with natural resource zones;
• Government investments are drying up in irrigation – the poor returns are not even matching the running costs;
• The option of constructing large dams has mostly been exhausted, except in the high biodiversity and fragile Himalayan region, and interstate river basin conflicts are growing;
• In many areas there is a high population density and a high reliance on agriculture, with a shrinking land/person ratio;
• This, in turn, causes a set of related barriers to change, such as:
o small holdings preventing growth and reinvestment in agriculture; o limited choices for water resource development;
o optimal solutions at watershed/basin level are very difficult to negotiate between stakeholders;
• Co-existence of shifting agriculture, dry land farming and Green Revolution practices provides high diversity but also problems of interfacing with a market-based economy; • A mentality of resignation among farmers due to prolonged poverty situations and
natural calamities;
• High accessibility to information coupled with it low use has led to reactive solution; • Soft state with long-delayed responses.
The economic importance of agriculture has steadily declined from almost 50% of the GDP in the 1960s to about 20% in 2000. Official employment in agriculture has declined from 70% in 1990 to 63% in 2002. It is typical for the structural change phenomenon: the growth is GDP stems largely from the rapidly growing industrial/manufacturing sector, although in India, the service sector also also contributed significantly, as will be discussed in the following section. A possibly important element in the future of agriculture is land-for-energy: large-scale energy plantations and other ways of using biomass to produce fuels or electricity are a promising avenue of income/resource.
3.3
Economy
Although India’s economic development is taking shape within a very different context that is assumed by conventional macro-economic models used for OECD-country economies, these same models still provide a basic framework with which Indian economists also work. One such framework consists of a static description of the monetary transactions in the economy in the form of an I-O-matrix, an extension with details on the income distribution and final demand in the form of a Social Accounting Matrix (SAM) and a more or less detailed (neo-classical) economic growth model.
As part of this project, we have collected I-O-data on the Indian economy for the periods 1978–79, 1983–84, 1989–90, 1993–94 and 1998–99. Pradhan et al. (2006) provided extensive data on the SAM for India. The data presented in the following sections are based on the sources provided by these authors and the statistics from IndiaStat and the WDI (see Annex C).
Income and expenditures. Income per capita rose slowly from the 1950s to the mid-1980s:
roughly a doubling in 40 years (compare Annex B). Some refer to the ‘Hindu rate of growth’. Since the transition to a more market-oriented development in the early 1990s, economic growth has accelerated in certain sectors. However, per capita GDP is still at the low average level of 500 1995USD/cap/yr, and household expenditures are still less. However, expressed in international dollars – i.e. with a correction for PPP – income is considerably higher – more in the order of 2500 1995INR/cap/yr.
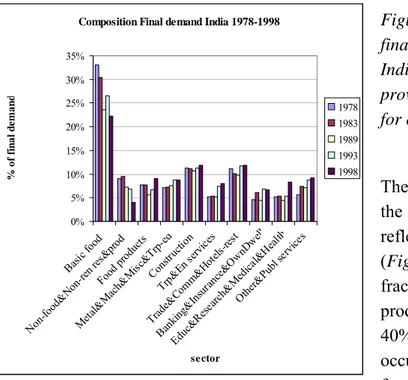
Figure 4 Change in the composition of final demand in the official economy in India 1978–1998. The data sets are provisional; they still have to be checked for errors.
The I-O-matrices give an impression of the structural change in the economy as reflected in the shift in final demand (Figure 4). Between 1978 and 1989, the fraction of expenditures on agricultural products in final demand declined from 40% to 30%, after which an increase occurred – more processed and quality food came in. Significant increases, up to 80%, occurred in this period in the fraction spent on transport and energy services and almost all services (e.g. financial, education and medical). However, one has to be careful with numbers. The National Accounts cover only part of economic activity: according to one estimate, non-taxed/registered Value-Added (VA) creating activities (‘black’ or clandestine labour) constituted 22.4% of the GDP as of 1989-90 (Schneider and Enste 2000). It is most likely that the size of the ‘shadow economy’ is much larger, certainly if we are to include all the non-market food transactions and ‘illegal’ transactions.
Employment. Agricultural employment was and still is dominant, declining from 70% of total
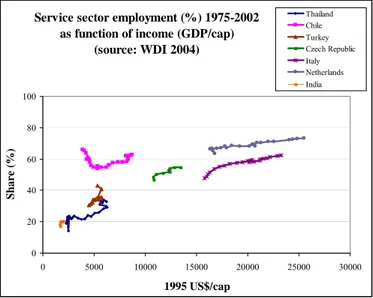
employment in the 1970s to about 60% nowadays according to the official WDI (2004) statistics. Its slow decline coincides with an increase of employment in services. Employment in manufacturing and industrial production remained remarkably constant between 1990 and 1995 – the only data available. If India’s service sector follows the trend of most other countries in terms of employment share, there will be a further gradual increase in the service sector employment share with rising income (Figure 5).
Value-Added. With respect to VA, the situation is quite different (Figure 6). Whereas in the
1960s and 1970s the contribution of agriculture was roughly constant at 45–50%, its share
Composition Final demand India 1978-1998
0% 5% 10% 15% 20% 25% 30% 35% Basic f ood No n-food& Non-ren r es&p rod Food prod ucts Metal &Ma ch& Misc &Trp -eq Cons truc tion Trp& En se rvice s Trade &Co mm& Hotels -rest Bank ing& Insu rance &Own Dwell Educ &Res earch& Med ical&He alth Other &Publ serv ices se ctor % o f f ina l de m a n d 1978 1983 1989 1993 1998
has declined steadily to less than 25% in 2000. Simultaneously, the VA generation in non-manufacturing industries and especially that in services has risen, from 6% and 34% to 11% and 51%, respectively. This suggests the importance of large-scale industry and information and communications technology (ICT)-based international services in the pattern of economic growth in India in the last few decades. The 'stylized fact' of structural change – a rising share of first industry/manufacturing and later services in GDP with income – apparently started in the early 1970s but did not continue.
Figure 5 Employment in the service sector as a fraction of total official employment versus income for India and six other countries (WDI).
Figure 6 Sectoral shares of Value-Added in India 1960–2003(WDI).
Income distribution and rural/urban – male/female distribution of employment and wages. Data collected by Pradhan et al. (2006) provide the
opportunity for a closer look into the nature of employment. In 1994–1995, 334 million people are list in the SAM as being formally employed; this represents about 36% of the population in that
period 6. Estimates on these people are available in terms of their background (urban/rural,
male/female), educational level (six classes) and the economic sector in which they were employed.
Table 1 shows the distribution of all people employed and all illiterate people employed in India in 1994–1995 broken down into urban/rural and male/female categories across the three
6 Using an urbanization rate of 26%, the fraction employed would be 31% for urban and 38% for rural regions. This may indicate an
overestimation of the urbanization rate.
Service sector employment (%) 1975-2002 as function of income (GDP/cap)
(source: WDI 2004) 0 20 40 60 80 100 0 5000 10000 15000 20000 25000 30000 1995 US$/cap Sh a re (% ) Thailand Chile Turkey Czech Republic Italy Netherlands India
India: Sectoral shares in Value Added as % of GDP 1960-2002 (WDIU 2004) 0% 10% 20% 30% 40% 50% 60% 70% 80% 90% 100% 1960 1965 1970 1975 1980 1985 1990 1995 2000 year % o f G D P
Services, etc., value added (% of GDP) Manufacturing, value added (% of GDP) Industry non-manufacturing, value added (% of GDP) Agriculture, value added (% of GDP)
largest economic sectors: agriculture, industry and services. The numbers show that rural agriculture workers constitute the core of the illiterate workforce – one third of the total – and that male urban and rural service sector employees constitute the core of the educated workforce – one fifth of the total. There is a large and growing divide between the poor and illiterate on the one hand and the wealthy and educated on the other.
Table 1 Statistics on employment (expressed in millions of people) in India in 1998–1999 (Pradhan et al. 2006).
all employed urban male urban female rural male rural female
agriculture 4 2 124 70
industry 14 3 14 7
services 43 9 37 6
illiterate (level 1) employed urban male urban female rural male rural female
agriculture 1 2 57 54
industry 2 1 4 4
services 6 3 9 3
The data indicate that (Table 1 and Annex C):
• of the 61 million males and 14 million female employed in urban areas, almost 50% worked in only two sectors, the wholesale, retail trade etc. and community, social, personal services etc.; this underscores the service character of the urban economy; • education was highest among male workers in the finance, insurance, real estate etc.
and community, social, personal services etc. sectors;
• the majority of the officially employed people in urban areas in agriculture, manufacturing and construction have a low educational level (less than secondary school); these ‘illiterate urban workers’ amount to 20 million people in total;
• of the 175 million males and 83 million females employed in rural areas, 62% (male) and 82% (female) have low levels of education (less than secondary school) and are working in agriculture.
It is often assumed that the income gradient between the urban and rural areas is the main driving force of the urbanization process. The estimates of the VA suggest a significant and rapidly growing wage differential between the agricultural sector, which dominates the rural areas, and the manufacturing and, even more, the service sector, which prevail in the urban areas. The data suggest between 1960 and 2002 a threefold and fourfold increase in VA per capita (USD 1995) in industry and services, respectively, against a 1.6-fold increase in agriculture (Annex C).
The SAM data (Pradhan et al. 2006) also provide information on the status of workers – self-employed, regular or casual – and average weekly earnings. The data suggest that in 1993– 1994 almost two out of three workers in rural areas were self-employed, predominantly in agriculture, in comparison to 0.4 in urban areas, predominantly in wholesale and retail trade. These data also indicate a broad income disparity, ranging from a low of 73 for illiterate rural women in agriculture to a high of 1501 for well-educated urban males in the community, social, personal services sector.
Economic structure. The I-O-matrices provide, despite their probable errors and ambiguities,
an indication of the structure of the Indian economy and the changes it has undergone during the last decades. An important cluster of the economy had to do with the land: food crops, cash crops, plantation and other crops, animal husbandry, forestry and logging and fishing. The composition of this cluster has not much changed since the 1970s, but its importance in the economy as a whole has declined. A second important cluster that increasingly dominates the formal economy, is manufacturing – with an important role for agro-processing – and services. Of particular importance here are trade and banking and other services. However, it remains difficult to interpret precisely just what is occurring in these sectors (see e.g. Dasgupta and Singh 2005).
Figure 7 The technical coefficients of the input-output (I-O) matrix for India 1998–1999. The height of cell (i,j) indicates the fraction of the total output of sector i (row)that is delivered to sector j (column). (Data source: Pradhan et al. 2006)
Since the change to a more open economy, trade and in particular trade in other products than goods has increased significantly – from about 15% of the GDP in the 1980s to 30% around 2000 (Annex C). The monetary fluxes given as intra-India trade have grown enormously, which is a sign of an increasing specialization and differential growth in the economy. Broadly speaking, there are four regional dynamics which can be distinguished, although they are highly interrelated via population migration and other exchange processes. India’s western seaboard from Gujarat and Maharashtra via Karnataka and Kerala is set to
Fo o d Cro ps P lantatio n Cro ps
Milk a nd Milk P ro ducts F is hing Fo o d pro ce s s ing
Indus tria l ma nufac turing
sectors (row elements) sectors (column elements) India I-O 1998-99 0,30-0,35 0,25-0,30 0,20-0,25 0,15-0,20 0,10-0,15 0,05-0,10 0,00-0,05
experience extensive growth as manufacturing and trade expand, and the Konkan railway, new ports and energy hubs provide opportunities for growth. Other smaller regions along the eastern coast, specifically eastern Tamil Nadu, the Krishna and Godavari delta regions and enclaves in coastal Orissa and West Bengal, will also integrate with the global economy along with service sector centres such as Bangalore and the region surrounding the National Capital Region of Delhi. Agro-based and mineral-based growth can be expected in north-western India, specifically Punjab, Haryana, north-western UP, parts of Rajasthan and Madhya Pradesh. Large industrial concentrations around energy and mineral resources in eastern India, specifically Jharkhand, Orissa, Chhattisgarh and Madhya Pradesh, can be expected. The rest of India, especially the villages of north, eastern and north-eastern India, will be significantly challenged to integrate into a rapidly changing economic landscape.
3.4
Derived demands: energy, transport and water
Any economic activity requires primary inputs: (skilled) labour, capital goods and the financial system to provide these, material process inputs (such as wood, stone and metals) and energy derived from renewable sources or fossil fuels. In addition, there is the need for land for agriculture and land for ecosystem services. All of these provisions require infrastructure investments for their growth and maintenance and represent some form of utilization – i.e. welfare extraction. This inevitably causes pressures on the natural resources base and the ecosystem services provided. Many of these are related to a few subsystems: food provision (including logging and fisheries), water and energy provision systems and the transport of goods and people. Food has been discussed; we now turn briefly to energy, transport and water.
What is the dynamics behind energy and water use? Most economists (read economic models) treat energy as an exogenous input to a production process with capital and labour as the two key production factors. During the 1970s, with its two oil crises, both energy and materials were also considered as relevant inputs for production – the so-called KLEM production function approach. Water has hardly entered the formal analyses – ‘its monetary value is so small that it can be neglected in macro-economic analyses’, as a prominent economist once stated. Yet, this neoclassical economic approach has been increasingly criticized for its abstraction from the physical world with its laws of thermodynamics.
Evidently, economic growth depends on labour productivity growth, which can only be accomplished (in agriculture and manufacturing) by substituting commercial energy (fuels/electricity) for manual labour, with capital as a compliment (see e.g. Ayres 2003, 2005). It has been estimated that the persistent electricity shortage during certain periods of the year has caused India’s GDP to be several percentage points
The demand-supply equilibrating loop
Resource input
Capital expansion (manufacturing plant) Labour input
(pers-yr)
Demand for Good G (units) Price of Good G (€/unit) Cost to produce Good G (€/unit) Supply of Good G (units) + + + + + -Land expansion (cultivated/irrigated area)
-lower than were it to have an adequate supply. Secondly, energy is a crucial factor in the provision of services and in consumption activities via a large variety of 'energy services', such as the transport of goods and passengers, space cooling and heating, food preparation and preservation, communication, among others. In these situations energy is only partly a production factor per se: it allows people to do all kinds of activities, and without it a large part of economic life would come to a standstill.
To the best of our knowledge, a good conceptual model of economic growth which takes into account the combined role of technical change and resource use/degradation has not yet been developed for India. One growth dynamic is the loop shown in the scheme (De Vries 2006). With an increase in demand for a good or service, the input of capital – and land/space – will increase. The combined effect of economies of scale and innovations will lead to a downward pressure on the costs (read price of the good or service), even after rewarding capital (profits) and labour (wage rate increase). Demand will then tend to increase, with a further rise in the inputs of physical inputs: land/space, energy, water. As a result, it is hard to predict – with any reliability – the long-term trends in energy- and water-intensity, that is, the amount of energy and/or water used per unit of economic output (GDP) or VA. The tendency for energy is that energy use per person tends to stabilize and energy use per unit of GDP tends to decline. This is partly based on intersectoral shifts – from agriculture to manufacturing to services (see above) – and partly based on the fact that within each economic sector, the energy input per unit of VA will decline as the product incorporates more and higher-skilled labour and knowledge-incorporating capital goods which make up the larger part of the cost (read price). For water, such analyses are not yet available.
3.4.1 Energy
It has only been in the last few decades that energy use in India started to grow; prior to this time, it was more or less constant, with the larger part being provided in the form of traditional fuels (fuelwood, dung etc.) for residential use. In the 1970s All India energy use (in this case, Production) was roughly the same as that in the Netherlands around 1975. Although it is hard to obtrain reliable statistics, the following broad trends can be determined the period 1950–2000 (Annex C and e.g. Reddy and Balachandra 2000, 2005):
Until the end of the 20th century, Indian society was still characterized by a large use of biomass-based energy sources and, to an increasing extent, indigenous coal;
Although crude oil and natural gas deposits were discovered in the 1970s and exploited since that time, production has hardly expanded and does not exceed 1970s coal production levels;
The exponentially rising energy demand has been met increasingly from two sources: coal and imported oil;
Total energy imports – mostly crude oil – have increased to some 20% of commercial energy use, and this causes, with rising and fluctuating world market prices, fuel imports to be in the range of 20–30% of all merchandise imports;
As in most countries, electricity use has been growing fastest; the share of hydropower in electricity generation has more than halved since 1970 (to about 8%), whereas the share of coal has gone up from 50% to 80%;
Although the energy intensity (GJ/INR) has continued to decline, partly as a result of the rather strong growth of the service sector, the increase in energy demand is growing in pace with population and income growth.
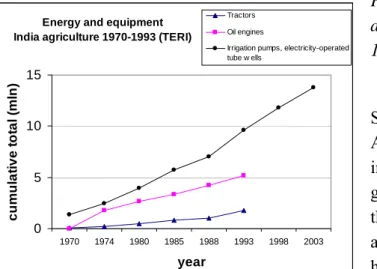
A few graphs can illustrate these points. First, agriculture. As Figure 8 shows, the 'Green Revolution' leap forward in food production has been made possible by an enormous increase in the use of agricultural machinery – tractors, oil engines, irrigation pumps – the operation of which which depends on diesel and electricity. It is one example of the development process in which labour is substituted by two complementary production factors: capital and energy. Both tend to be scarce in rural India, but their ratio will also reflect the relative cost (in this case, price) of capital and fuel/electricity, respectively. Such a development process starts in agriculture and necessarily involves a roughly proportional increase of energy per person with income.
Figure 8 Use of tractors, oil engines and irrigation pumps in India 1970– 1993/2003 (Data source: TERI).
Secondly, the electricity sector (see Annex C). As in most countries, growth in electricity use has exceeded GDP-growth. To satisfy this rapid demand, the system of State Electricity Boards and All India government organizations has responded with a rapid expansion in coal-based large-scale electric power generation plants. With liberalization, slow changes seem to be emerging in the operation and planning of the electricity system. However, important problems remain:
• Serious shortages in power supply in urban regions. Key states such as Gujarat, Uttar Pradesh, Madhya Pradesh and Maharashtra had peak power deficits in the range of 17– 25% and annual energy deficits between 7% and 20% (Planning Commission 2005). The resulting low reliability has lead to investment in decentralized generation options which may well be suboptimal (IIR 2006). The brown- and black-outs resulting from electric power shortages also reduce manufacturing output – some analyses estimate a loss of 2– 3% GDP;
• A still very low level of electricity service availability in rural areas, despite the large electrification programmes. The reason is not only the existence of tens of thousands of villages which are hard to reach, but also the low investments in village electrification in the villages formally connected to the grid. In addition, electricity in rural areas is heavily subsidized, hence costs are not recovered, and many electricity companies face severe debts.
Thirdly, biomass-derived energy. The so-called non-commercial traditional fuels constituted 34% of total energy use in India in 1996–1997. Even today in rural India, domestic energy use is dominated by fuelwood, crop residue and dung cake. Apart from local air pollution and
Energy and equipment India agriculture 1970-1993 (TERI)
0 5 10 15 1970 1974 1980 1985 1988 1993 1998 2003 year c u m u la ti v e t o ta l (m ln ) Tractors Oil engines
Irrigation pumps, electricity-operated tube w ells