RIVM report 230011004/2005
First ISNS Reference Preparation for Neonatal Screening for thyrotropin, phenylalanine and 17α-hydroxyprogesterone in blood spots LH Elvers, JG Loeber, JL Dhondt1), M Fukushi2), WH Hannon3), T Torresani4), D Webster5)
1 Hôpital Saint Philibert, Lille, France
2 Sapporo City Institute of Public Health, Sapporo, Japan
3 Centers for Disease Control and Prevention, Atlanta, GA, USA 4 Universitäts Kinderklinik, Zürich, Switzerland
5 National Testing Center, Auckland, New Zealand
Contact: L.H. Elvers
Diagnostic Laboratory for Infectious Diseases and Perinatal Screening bert.elvers@rivm.nl
This investigation has been performed on request of and financed by the Directorate Prevention and Public Health within the framework of project Perinatal Screening, no 230011.
National Institute for Public Health and the Environment (RIVM), P.O. Box 1, 3720 BA Bilthoven, the Netherlands. Telephone: +31 - 30 - 274 91 11; telefax: +31 - 30 - 274 29 71
Rapport in het kort
Het eerste ISNS Referentie Preparaat voor Neonatale Screening op thyrotropine, fenylalanine and 17α-hydroxyprogesteron in bloedvlekken
Bij screening van pasgeborenen voor aangeboren stofwisselingsziekten wordt in een bloedmonster, verkregen via de hielprik en opgevangen op filtreerpapier, een aantal bloedcomponenten gemeten. Veelal wordt gebruik gemaakt van commercieel verkrijgbare reagentiasets. De fabrikanten kalibreren hun reagentiasets vaak met hun eigen kalibratoren. Bovendien zijn er in de wereld meerdere filtreerpapiersoorten in gebruik, met verschillen in specificaties. Door deze beide oorzaken zijn de uitslagen van verschillende screeningslaboratoria vaak niet goed vergelijkbaar. Dit bemoeilijkt de evaluatie van zulke screeningsprogramma’s.
De International Society for Neonatal Screening (ISNS) heeft eerder goede ervaringen opgedaan met het laten bereiden van referentiematerialen in filtreerpapierbloed en het overreden van fabrikanten om deze materialen te gebruiken als maatstaf. In 2004 heeft de ISNS aan het RIVM verzocht om een gecombineerd referentiemateriaal te maken voor filtreerpapierbloed met bekende concentraties aan thyrotropine, 17α-hydroxyprogesteron, en phenylalanine, merkstoffen die van belang zijn voor de screening op stoornissen in de schildklier, bijnier, respectievelijk eiwitmetabolisme.
In dit rapport is de bereiding en evaluatie van dit referentiemateriaal beschreven. Trefwoorden: pasgeborenen; hielprik; screening; ags; pku; cht; referentie preparaat
Abstract
First ISNS Reference Preparation for Neonatal Screening for thyrotropin, phenylalanine and 17α-hydroxyprogesterone in blood spots.
Many countries have a screening programme for newborns for congenital metabolic disorders. For this screening several components are measured in dried blood spots collected by a heel stick on filter paper. Most laboratories use commercially available reagent sets for the measurements. Manufacturers of these reagents often calibrate their reagent sets against own calibrators. Moreover several types of filter paper, each with different specifications are in use all over the world. These factors make it difficult to compare results from different screening laboratories and to evaluate such screening programmes.
In the past the International Society for Neonatal Screening (ISNS) has been able to persuade manufacturers to use previously prepared dried blood spot reference materials as calibration standards. Having run out of stock, in 2004 the ISNS asked the RIVM to produce a combined reference preparation in filter paper blood with known concentrations of thyrotropine, 17α-hydroxyprogesterone and phenylalanine, being the markers of interest for screening on disorders of the thyroid gland, the adrenal gland and amino acid metabolism, respectively.
This report describes the production and evaluation of this reference preparation.
Summary
Introduction
Neonatal screening for congenital disorders is generally performed in dried blood spots on filter paper. The analytes of interest for phenylketonuria (PKU), congenital hypothyroidism (CH) and congenital adrenal hyperplasia (CAH) are phenylalanine, thyroid stimulating hormone (TSH) and 17α-hydroxyprogesterone (17OHP), respectively. Analyses are usually carried out with commercial kits containing blood spot calibrators on filter paper. Differences in the way these materials are produced and calibrated lead to differences in results for neonatal samples between and among screening laboratories. Another variable is the type of filter paper: Schleicher & Schuell #903, Whatman BFC180 or Toyo Roshi 545.
Existing reference materials for blood spots on filter paper are available for phenylalanine and also for TSH, but this material has expired recently. There is no reference material for 17OHP. The International Society for Neonatal Screening (ISNS) recognised the need for a combined reference material for the three analytes on the three types of filter paper. This ‘1st ISNS Reference Preparation for Neonatal Screening for TSH, phenylalanine and 17OHP in blood spots’ (1st ISNS-RPNS) has been prepared by the RIVM (Bilthoven).
Results
The number of filter paper cards with blood spot calibrators prepared was 480, 42 and 69 for Schleicher & Schuell #903, Whatman BFC180 and Toyo Roshi 545, respectively. Each filter paper card has two sets of six calibrators; the volume of blood dispensed was 50 µL. The range of concentrations is for TSH: 1 – 121 mIU/L blood, for phenylalanine: 65 – 865 µmol/L blood and for 17OHP: 2.2 – 302 nmol/L blood. The linearity of the blood spot calibrators and the homogeneity of the batch (only tested for Schleicher & Schuell) were good. The differences between the three filter papers were small: the potency of the ISNS-RPNS on Whatman and Toyo Roshi in terms of Schleicher & Schuell varied between 0.98 and 1.09 for the three analytes.
The calibrators of the 1st ISNS-RPNS were analysed as ‘routine neonatal samples’ in 22 neonatal screening laboratories using different methods. The overall recovery (mean ± SD) was 96 ± 15%, 100 ± 10% and 92 ± 11% for TSH, phenylalanine and 17OHP, respectively
Conclusion
The 1st ISNS-RPNS for TSH, phenylalanine and 17OHP is suitable as formal reference preparation and serves as a source for (re)calibrating kit calibrators.
C
ONTENTS
1. Introduction 6
2. Materials and methods 7
2.1 Preparation of the 1st ISNS-RPNS 7
2.2 Assessment of TSH, phenylalanine and 17OHP in basal and
enriched plasma 7
2.3 Assignment of TSH, phenylalanine and 17OHP in basal and
enriched blood 7
2.4 Evaluation of the 1st ISNS-RPNS in neonatal screening laboratories 7 2.5 Homogeneity of the batch on filter paper S&S #903 8 2.6 Comparison of 1st ISNS-RPNS on three different filter papers 8
2.7 Stability 8
3. Results 9
3.1 Number of sets calibrators prepared 9
3.2 Concentration of TSH, phenylalanine and 17OHP in basal and
enriched plasma 9
3.3 Assignment of the concentration in basal and enriched blood 12 3.4 ISNS-RPNS in QC-programme for neonatal screening 12 3.5 Homogeneity of the batch on S&S #903 16
3.6 Comparison filter papers 19
3.7 Comparison ISNS-RPNS for TSH with CRM-TSH (1999) 23 3.8 Comparison ISNS-RPNS for phenylalanine with EWS-PHE-03
and AARM 24
3.9 Stability study 26
4. Discussion 27
Acknowledgements
References 31
Appendix 1 Detailed description of the preparation of the 1st ISNS-RPNS 32 Appendix 2 Individual results in plasma A-F per laboratory for
TSH, phenylalanine and 17OHP 36
1. Introduction
Neonatal screening for congenital disorders like phenylketonuria (PKU), congenital hypothyroidism (CH) and congenital hyperplasia (CAH) is generally performed in dried blood spots on filter paper. For use in neonatal screening special filter papers are on the market and the ones most often used are Schleicher & Schuell, type #903, Whatman type BFC180 and Toyo Roshi, type 545. These filter papers have to fulfil certain criteria, one of the most important being serum absorption volume, which has been formulated by the NCCLS (now: CLSI) [1]. Kits intended for use in neonatal screening usually have blood spot calibrators on filter paper. Ideally, these calibrators are made in such a way that they match with neonatal samples as far as possible, i.e. same matrix (human blood), spot size (11-12 mm) and filter paper. In practice, manufacturers of kits use different matrices, while there is also a variety in spot size. Other sources of variation are the ‘standard’ material which is used for preparation of the calibrators, and the way the concentration of the calibrators is assigned. All these factors lead to differences between sets of calibrators and finally in results for neonatal samples obtained with these calibrators. Differences between kits and even between lots of calibrators from the same kit are clearly demonstrated by results from external quality assessment programmes.
For the determination of analytes in neonatal screening no standard methods are available. So manufacturers of kits can not revert to such methods for a proper calibration of their calibrators. An alternative for manufacturers of kits is the availability of ‘reference materials for blood spots on filter paper’. In 1996 the ‘first European Working Standard for phenylalanine in blood spots’ had been prepared by the RIVM [2,3]. This EWS-PHE-01 was available for manufacturers of kits and for organizers of quality control programmes and was followed by the EWS-PHE-02 in 1999 and the EWS-PHE-03 in 2003. Also in 1996 the ‘Amino Acid Reference Material’ (AARM) had been prepared by the CDC [4]. In 1999 a certified reference material for thyrotropin (CRM-TSH) was prepared by CDC on request of the Standard Committee on Quality Assurance (SCQA) of the International Society for Neonatal Screening (ISNS). For 17α-hydroxyprogesterone, which is a parameter for screening on congenital hyperplasia (CAH), no such material is available yet. For this reason and due to the fact that CRM-TSH expired in December 2004, the ISNS decided to make a combined reference material for thyrotropin, phenylalanine and 17α-hydroxyprogesterone (17OHP) in blood spots. This ‘First ISNS Reference Preparation for Neonatal Screening for thyrotropin, phenylalanine and 17α-hydroxyprogesteron in blood spots’ has been prepared by the RIVM in November 2004. The 1st ISNS-RPNS, prepared on Schleicher & Schuell #903, Whatman BFC180 and Toyo Roshi 545, is available for manufacturers of kits for neonatal screening and for organisers of quality assessment schemes. This report describes in detail the production and the results of the evaluation of this 1st ISNS-RPNS.
2. Materials and methods
The procedure for the preparation of the 1st ISNS-RPNS is described in detail in Appendix 1. Here we confine ourselves to the procedure in general.1
2.1 Preparation of the 1st ISNS-RPNS
Blood was collected from a healthy donor, adjusted to 50% hematocrit and divided into six portions. These portions were enriched with TSH 81/565 (proposed 3rd IRP for TSH, NIBSC, London; range: 0 – 120 mIU/L blood), phenylalanine (product no 78019, Fluka, Switzerland; range: 0 – 800 µmol/L blood) and 17α-hydroxyprogesterone (product no 56240, Fluka, Switzerland; range: 0 – 300 nmol/L blood). The portions were homogenised on a roller bank for five hours. Blood spots were prepared on filter paper Schleicher & Schuell type #903, Whatman type BFC180 and Toyo Roshi type No 545. On each filter paper card two 50 µL spots from each calibrator A – F were spotted; for a limited number filter paper cards S&S #903 the volume was 100 µL. After overnight drying in the dark at room temperature, the cards were packed individually in a laminated aluminium bag with dessicant and stored at -20 oC.
2.2 Assessment of TSH, phenylalanine and 17OHP in basal and enriched plasma Plasma and a 5-sulfosalicylic acid extract were prepared from basal and enriched blood and frozen immediately. For each analyte 0.6 mL portions of the plasmas were sent to three laboratories for the assessment of TSH, phenylalanine and 17OHP. One of these laboratories measured phenylalanine in plasma and in 5-sulfosalicylic extracts. The laboratories selected for measurement of phenylalanine were: Hôpital d’Enfants, Laboratoire de Biochimie Spécialisée, Dyon, France (Dr. S. Ewing); Hôpital Necker-Enfants maladies, Department Laboratoire de Biochemie B, Paris, France (Dr D. Rabier); Hôpital Universitaire des Enfants, ULB-Laboratoire de Pédiatrie, Brussels, Belgium (Prof. P. Bourdoux). The laboratories for TSH and 17OHP were: UMC-Utrecht, Laboratory for Endocrinology, Utrecht, The Netherlands (Dr. E. Lentjes); UMC-St Radboud, Laboratoy for Experimental Endocrinology, Nijmegen, The Netherlands (M.F.G. Segers); AMC, Laboratory for Endocrinology, Amsterdam, The Netherlands (Dr. E. Endert).
2.3 Assignment of TSH, phenylalanine and 17OHP in basal and enriched blood The concentration of TSH, phenylalanine and 17OHP in basal blood was based on the determinations in basal plasma (see 2.2). The concentration of the analytes in the enriched blood was based on the concentration in basal blood and the amount of the analytes added to the blood.
2.4 Evaluation of the 1st ISNS-RPNS in neonatal screening laboratories
The 1st ISNS-RPNS was sent to 18 laboratories participating in the RIVM QA-scheme for TSH, phenylalanine and 17OHP. These laboratories analysed the calibrators A-F with their routine neonatal screening methods. The 1st ISNS-RPNS was also analysed by all members of the Standard Committee on Quality Assurance of the ISNS.
1 Note: use of trade names is for identification only and does not imply endorsement by the
National Institute for Public Health and the Environment (RIVM) or the International Society for Neonatal Screening.
2.5 Homogeneity of the batch on filter paper S&S #903
The homogeneity of the ISNS-RPNS on filter paper S&S #903 was tested. Filter paper cards coming from 1%, 25%, 50%, 75% and 100% of the batch were analysed in quadruplicate for TSH and 17OHP and in triplicate for phenylalanine. A second experiment was carried out for TSH and phenylalanine, but only for calibrator F. The homogeneity for the batches on Whatman BFC180 and Toyo Roshi was not tested, because these batches were relative small.
2.6 Comparison of the 1st ISNS-RPNS on three different filter papers
The batches of the 1st ISNS-RPNS on S&S #903, Whatman and Toyo Roshi were compared by determination of TSH, phenylalanine and 17OHP in 3-5 laboratories (all members of the Standard Committee on Quality Assurance of the ISNS).
2.7 Stability
Forty cards from S&S#903, each with five 50 µL spots from calibrator D, were prepared for a stability study. These cards were placed at -80 oC, -20 oC, 4 oC, 22 oC and 37 oC. After 1, 2, 4, 8, 12, 18 and 24 months cards from the temperatures -20 oC, 4 oC, 22 oC and 37 oC have been or will be transferred to -80 oC. At the end of the period all samples will be analysed in quadruplicate for TSH, phenylalanine and 17OHP.
3. Results
3.1 Number of sets calibrators prepared
The following numbers of filter paper cards, each with two series of calibrators, were prepared: S&S #903: N=480; Whatman BFC180: N=42; Toyo Roshi 545: N=69. For these cards the volume of blood dispensed was 50 µL. A total of 20 cards, all S&S #903 were withdrawn from the batch because of irregular spot size, or blood migrated partly under the label. Fourteen cards of S&S #903 were prepared with two series of calibrators and ‘spot size’ 100 µL. These cards were intended for comparison with the CRM-TSH preparation (1999) with the same spot size. Figure 1 shows the final layout of the ISNS-RPNS on filter paper S&S #903.
Figure 1. 1st ISNS RP-NS for TSH, phenylalanine and 17OHP on S&S #903.
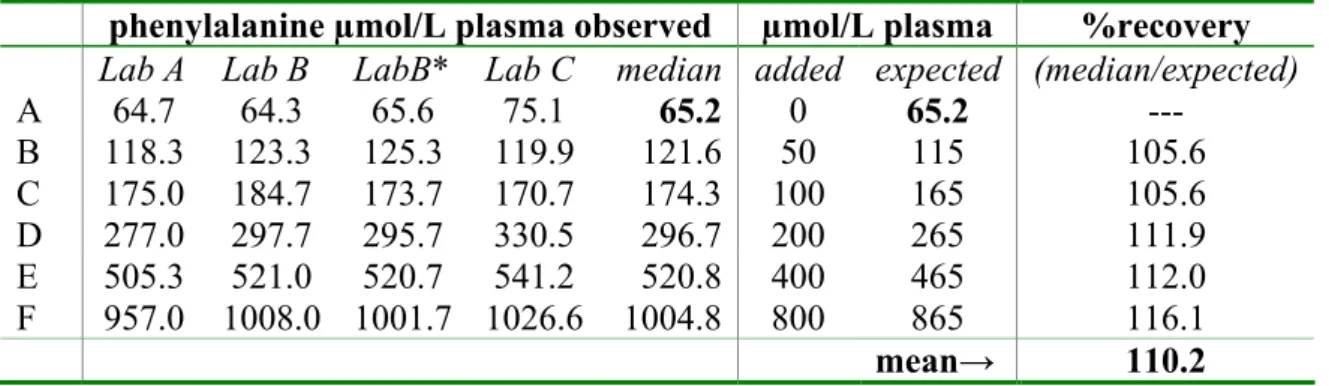
3.2 Concentration of TSH, phenylalanine and 17OHP in basal and enriched plasma TSH, phenylalanine and 17OHP were determined in plasma, prepared from basal and enriched blood, by three laboratories. These laboratories were asked to determine the analytes in triplicate. This appeared not always to be possible due to the amount of plasma available and the fact that samples had to be re-analysed after dilution. The mean measured concentration per laboratory and per analyte is summarised in Table 1a-c. See Appendix 2, Table 1 for the individually measured concentrations.
The variation between laboratories in the measured concentration for plasma A was for 17OHP and TSH very well within the limits which may be expected for the methods used.
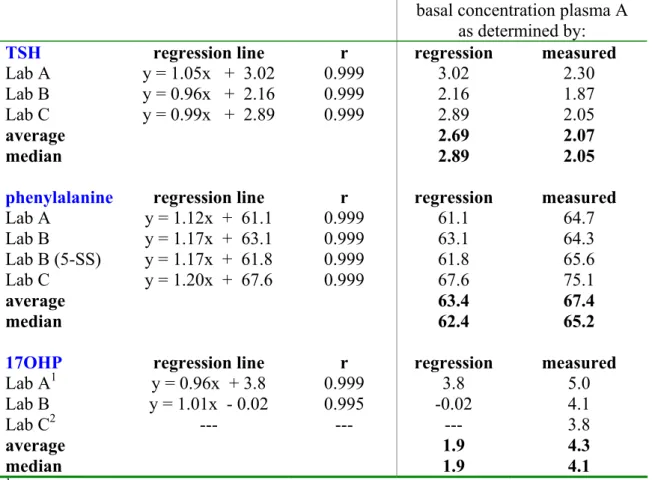
For phenylalanine the concentration in plasma A as measured by laboratory C was relatively high compared to the other laboratories; there was also a larger difference between the ‘measured’ and ‘calculated’ concentration for this laboratory (see below). The basal concentration of TSH, phenylalanine and 17OHP in plasma A was also assessed as the intercept of the regression line for plasma A-F for each laboratory. Table 2 shows the parameters for the formula of the regression lines and the concentration for plasma A derived from both methods: ‘measured’ and ‘calculated from the intercept’. For TSH and phenylalanine the differences between the results of both methods were small relative to the additions. For 17OHP the regression line could be calculated for only two laboratories; the intercept for both lines was quite different; no explanation was found.
It was decided to use the ‘mean measured’ concentration for plasma A for TSH and 17OHP and the ‘median measured’ concentration for phenylalanine as basal concentration for plasma A and finally for blood A. Based on the ‘basal’ concentration for plasma A, the expected concentrations for plasma B-F were assessed (basal + added). The mean recovery for each analyte for plasma B-F is given in Table 1a-c. The overall recovery in plasma was 99% for TSH, 110% for phenylalanine and 87% for 17OHP.
Table 1a. Mean concentration (mIU/L plasma) and recovery (%) of TSH in basal and enriched plasma as measured by three laboratories. Methods: Lab A: Architect (Abbott); Lab B: Delfia (PerkinElmer) and Lab C: Centaur (Bayer).
TSH mIU/L plasma observed mIU/L plasma %recovery
Lab A Lab B Lab C mean added expected (mean/expected)
A 2.3 1.9 2.0 2.0 0 2.0 --- B 14.8 12.3 13.7 13.3 12.5 14.5 93.4 C 28.6 24.8 26.9 27.2 25 27 99.1 D 55.4 51.3 54.2 53.3 50 52 103.1 E 113.0 102.3 104.0 106.7 100 102 104.3 F 253.5 231.0 238.5 241.3 240 242 99.6 mean→ 99.9 Table 1b. Median concentration (µmol/L plasma) and recovery (%) of phenylalanine in basal and enriched plasma as measured by three laboratories. Method: Lab A (amino acid analyser); Lab B (amino acid analyser) and Lab C (MS/MS). Laboratory B analysed both plasma and 5-sulfosalicylic acid extract.
phenylalanine µmol/L plasma observed µmol/L plasma %recovery Lab A Lab B LabB* Lab C median added expected (median/expected)
A 64.7 64.3 65.6 75.1 65.2 0 65.2 --- B 118.3 123.3 125.3 119.9 121.6 50 115 105.6 C 175.0 184.7 173.7 170.7 174.3 100 165 105.6 D 277.0 297.7 295.7 330.5 296.7 200 265 111.9 E 505.3 521.0 520.7 541.2 520.8 400 465 112.0 F 957.0 1008.0 1001.7 1026.6 1004.8 800 865 116.1 mean→ 110.2 * results in 5-sulfosalicylicacid extract
Table 1c. Mean concentration (nmol/L plasma) and recovery (%) of 17OHP in basal and enriched plasma as measured by three laboratories. Method: Lab A: RIA (DPC), Lab B: RIA (in house) and Lab C: paper chromatography → RIA (in house). Lab C analysed only basal plasma A.
17OHP nmol/L plasma observed nmol/L plasma %recovery
Lab A Lab B Lab C mean added expected (mean/expected)
A 5.0 4.1 3.8 4.3 0 4.3 --- B 27.9 22.7 --- 25.3 25 29.3 86.3 C 49.0 45.7 --- 47.3 50 54.3 87.2 D 101.0 103.5 --- 102.3 100 104.3 98.0 E 170.3 > --- 170.3 200 204.3 83.4 F 481.3 > --- 481.3 600 604.3 79.7 mean→ 86.9
Table 2. Parameters for the formula of the regression line (Y=aX+b) and coefficient of correlation (r) for TSH, phenylalanine and 17OHP in plasma as determined by three
laboratories. Phenylalanine was determined by Lab B in plasma as well as in a 5-sulfosalicylic acid extract.
basal concentration plasma A as determined by:
TSH regression line r regression measured
Lab A y = 1.05x + 3.02 0.999 3.02 2.30
Lab B y = 0.96x + 2.16 0.999 2.16 1.87
Lab C y = 0.99x + 2.89 0.999 2.89 2.05
average 2.69 2.07
median 2.89 2.05
phenylalanine regression line r regression measured
Lab A y = 1.12x + 61.1 0.999 61.1 64.7 Lab B y = 1.17x + 63.1 0.999 63.1 64.3 Lab B (5-SS) y = 1.17x + 61.8 0.999 61.8 65.6 Lab C y = 1.20x + 67.6 0.999 67.6 75.1 average 63.4 67.4 median 62.4 65.2
17OHP regression line r regression measured
Lab A1 y = 0.96x + 3.8 0.999 3.8 5.0
Lab B y = 1.01x - 0.02 0.995 -0.02 4.1
Lab C2 --- --- --- 3.8
average 1.9 4.3
median 1.9 4.1
1 calculated for range 0 -100 nmol/L plasma 2 laboratory C measured only basal plasma A
3.3 Assignment of the concentration in basal and enriched blood
The assignment of the concentrations of the calibrators A-F was based on i) the basal concentration in blood spot A and ii) the TSH, phenylalanine and 17OHP added to the blood. The results in units/L blood and units/L serum (for TSH and 17OHP) and some conversion factors are summarised in Table 3a-c.
Table 3a. TSH, phenylalanine and 17OHP-concentration for calibrator A – F of the ISNS-RPNS expressed as units/L blood.
Analyte A B C D E F Units
TSH 1.0 7.25 13.5 26.0 51.0 121 mIU/L blood Phenylalanine 65 115 165 265 465 865 µmol/L blood 17OHP 2.2 14.6 27.2 52.2 102 302 nmol/L blood
Table 3b. TSH and 17OHP concentration for calibrator A – F of the ISNS-RPNS expressed as units/L serum.
Analyte A B C D E F Units
TSH 2.0 14.5 27.0 52.0 102 242 mIU/L serum
17OHP 4.3 29.3 54.3 104.3 204.3 604.3 nmol/L serum
Table 3c. Conversionfactors for phenylalanine and 17OHP
Analyte Conversion factors
Phenylalanine (MW=165.2) 1 µmol/L blood = 0.0167 mg/dL blood OHP (MW=330.5) 1 nmol/L blood = 0.33 ng/mL blood
1 nmol/L blood = 0.66 ng/mL serum 3.4 ISNS-RPNS in QC-programme for neonatal screening
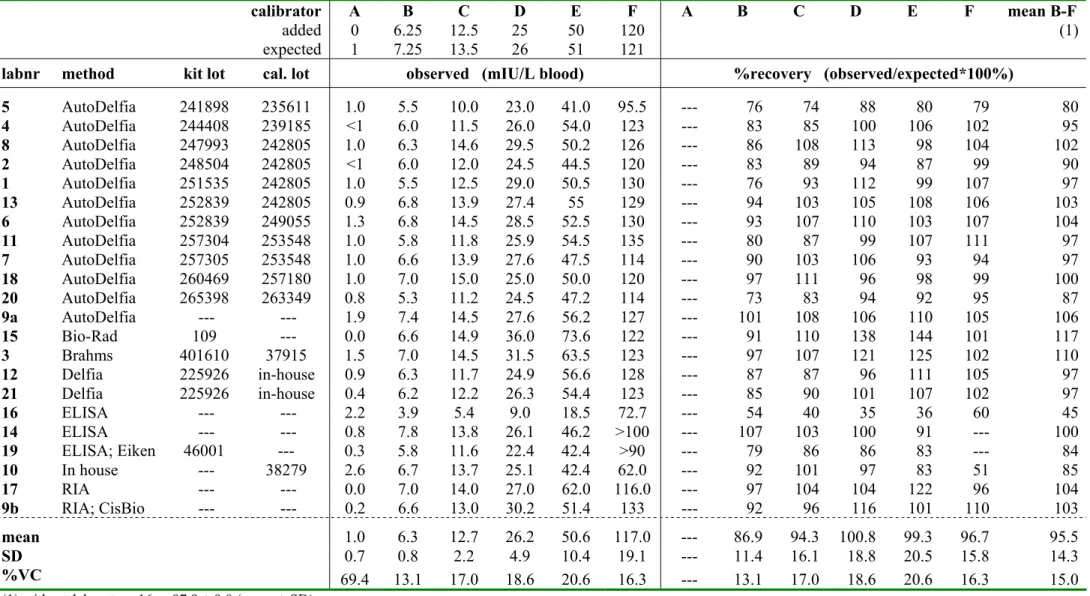
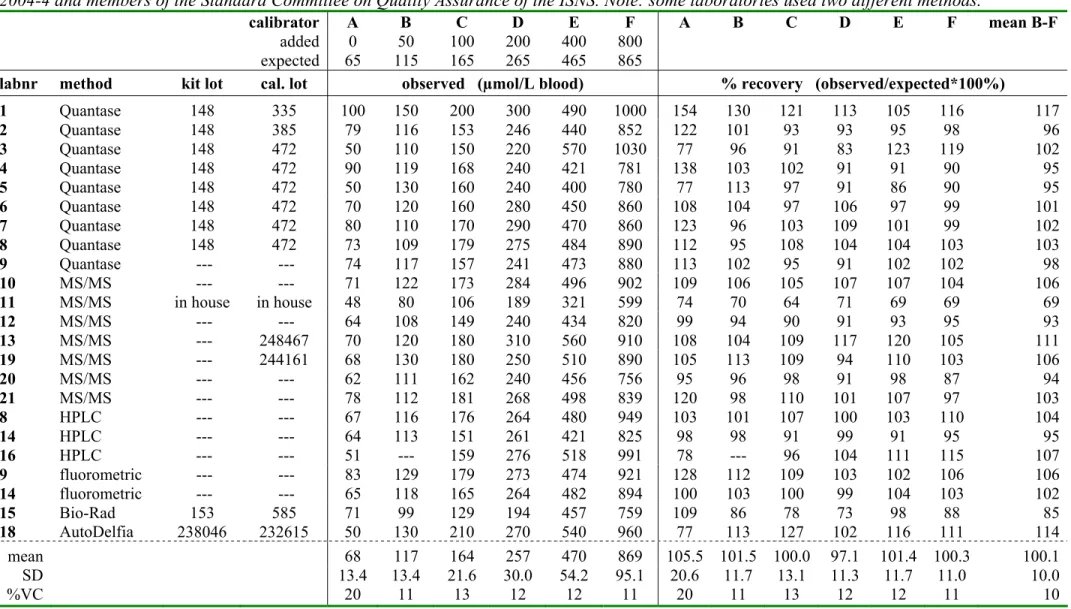
The RIVM organizes a neonatal screening QC-programme for screening laboratories in The Netherlands, Belgium and Luxembourg. Furthermore some individual laboratories in other countries and manufacturers of kits for neonatal screening participate. In RIVM survey 2004-4 the ISNS-RPNS was sent to all participating laboratories (TSH: N=17; phenylalanine: N=14; 17OHP: N=13). These laboratories analysed the calibrators A – F according to their routine methods in singlicate (N=12) or in duplicate (N=5). The ISNS-RPNS was also analysed by the members of the SCQA of the ISNS, some of them using two different methods per analyte. The number of replicates for these laboratories varied from 2 – 8. The mean measured concentration and recovery (%) for each laboratory are summarised in Table 4a-c. For 17OHP and TSH the recovery was calculated only for calibrator B-F, because the concentration of calibrator A was often reported to be lower then the limit of detection.
TSH: the overall recovery for all laboratories was 95.5 ± 14.3% (mean ± SD) and 97.9 ±
9.0% without laboratory 16, having a recovery of only 45%; the mean recovery was between 85-115% for 18 out of 22 laboratories
Phenylalanine: the overall recovery for all laboratories was 100.1 ± 10.0% (mean ± SD)
and 101.5 ± 7.4% without laboratory 11, having a recovery of only 69%; the mean recovery was between 85-115% for 21 out of 23 laboratories.
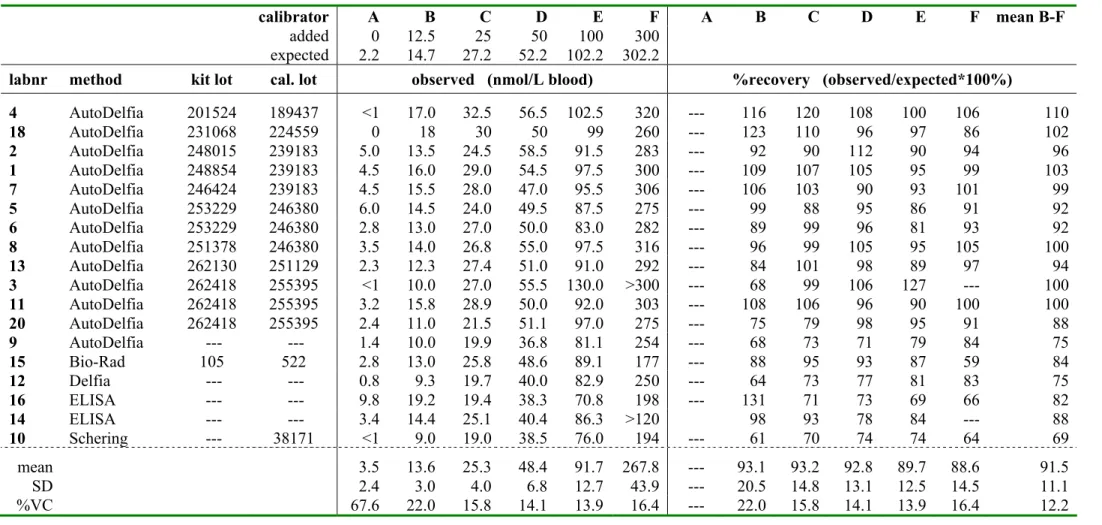
OHP: the overall recovery for all laboratories was 91.5 ± 11.1% (mean ± SD) and 93.2 ±
10.1% without laboratory 10, having a recovery of only 69%; the mean recovery was between 85-115% for 13 out of 18 laboratories.
Tabel 4a. TSH concentration (mIU/L blood and % recovery) for the ISNS-RPNS as measured by participants in RIVM-survey 2004-4 and members of the Standard Committee on Quality Assurance of the ISNS (N=22).
calibrator A B C D E F A B C D E F mean B-F
added 0 6.25 12.5 25 50 120 (1)
expected 1 7.25 13.5 26 51 121
labnr method kit lot cal. lot observed (mIU/L blood) %recovery (observed/expected*100%)
5 AutoDelfia 241898 235611 1.0 5.5 10.0 23.0 41.0 95.5 --- 76 74 88 80 79 80 4 AutoDelfia 244408 239185 <1 6.0 11.5 26.0 54.0 123 --- 83 85 100 106 102 95 8 AutoDelfia 247993 242805 1.0 6.3 14.6 29.5 50.2 126 --- 86 108 113 98 104 102 2 AutoDelfia 248504 242805 <1 6.0 12.0 24.5 44.5 120 --- 83 89 94 87 99 90 1 AutoDelfia 251535 242805 1.0 5.5 12.5 29.0 50.5 130 --- 76 93 112 99 107 97 13 AutoDelfia 252839 242805 0.9 6.8 13.9 27.4 55 129 --- 94 103 105 108 106 103 6 AutoDelfia 252839 249055 1.3 6.8 14.5 28.5 52.5 130 --- 93 107 110 103 107 104 11 AutoDelfia 257304 253548 1.0 5.8 11.8 25.9 54.5 135 --- 80 87 99 107 111 97 7 AutoDelfia 257305 253548 1.0 6.6 13.9 27.6 47.5 114 --- 90 103 106 93 94 97 18 AutoDelfia 260469 257180 1.0 7.0 15.0 25.0 50.0 120 --- 97 111 96 98 99 100 20 AutoDelfia 265398 263349 0.8 5.3 11.2 24.5 47.2 114 --- 73 83 94 92 95 87 9a AutoDelfia --- --- 1.9 7.4 14.5 27.6 56.2 127 --- 101 108 106 110 105 106 15 Bio-Rad 109 --- 0.0 6.6 14.9 36.0 73.6 122 --- 91 110 138 144 101 117 3 Brahms 401610 37915 1.5 7.0 14.5 31.5 63.5 123 --- 97 107 121 125 102 110 12 Delfia 225926 in-house 0.9 6.3 11.7 24.9 56.6 128 --- 87 87 96 111 105 97 21 Delfia 225926 in-house 0.4 6.2 12.2 26.3 54.4 123 --- 85 90 101 107 102 97 16 ELISA --- --- 2.2 3.9 5.4 9.0 18.5 72.7 --- 54 40 35 36 60 45 14 ELISA --- --- 0.8 7.8 13.8 26.1 46.2 >100 --- 107 103 100 91 --- 100 19 ELISA; Eiken 46001 --- 0.3 5.8 11.6 22.4 42.4 >90 --- 79 86 86 83 --- 84 10 In house --- 38279 2.6 6.7 13.7 25.1 42.4 62.0 --- 92 101 97 83 51 85 17 RIA --- --- 0.0 7.0 14.0 27.0 62.0 116.0 --- 97 104 104 122 96 104 9b RIA; CisBio --- --- 0.2 6.6 13.0 30.2 51.4 133 --- 92 96 116 101 110 103 mean 1.0 6.3 12.7 26.2 50.6 117.0 --- 86.9 94.3 100.8 99.3 96.7 95.5 SD 0.7 0.8 2.2 4.9 10.4 19.1 --- 11.4 16.1 18.8 20.5 15.8 14.3 %VC 69.4 13.1 17.0 18.6 20.6 16.3 --- 13.1 17.0 18.6 20.6 16.3 15.0
Tabel 4b. Phenylalanine concentration (µmol/L blood and % recovery) for the ISNS-RPNS as measured by participants in RIVM-survey 2004-4 and members of the Standard Committee on Quality Assurance of the ISNS. Note: some laboratories used two different methods.
calibrator A B C D E F A B C D E F mean B-F
added 0 50 100 200 400 800
expected 65 115 165 265 465 865
labnr method kit lot cal. lot observed (µmol/L blood) % recovery (observed/expected*100%)
1 Quantase 148 335 100 150 200 300 490 1000 154 130 121 113 105 116 117 2 Quantase 148 385 79 116 153 246 440 852 122 101 93 93 95 98 96 3 Quantase 148 472 50 110 150 220 570 1030 77 96 91 83 123 119 102 4 Quantase 148 472 90 119 168 240 421 781 138 103 102 91 91 90 95 5 Quantase 148 472 50 130 160 240 400 780 77 113 97 91 86 90 95 6 Quantase 148 472 70 120 160 280 450 860 108 104 97 106 97 99 101 7 Quantase 148 472 80 110 170 290 470 860 123 96 103 109 101 99 102 8 Quantase 148 472 73 109 179 275 484 890 112 95 108 104 104 103 103 9 Quantase --- --- 74 117 157 241 473 880 113 102 95 91 102 102 98 10 MS/MS --- --- 71 122 173 284 496 902 109 106 105 107 107 104 106 11 MS/MS in house in house 48 80 106 189 321 599 74 70 64 71 69 69 69 12 MS/MS --- --- 64 108 149 240 434 820 99 94 90 91 93 95 93 13 MS/MS --- 248467 70 120 180 310 560 910 108 104 109 117 120 105 111 19 MS/MS --- 244161 68 130 180 250 510 890 105 113 109 94 110 103 106 20 MS/MS --- --- 62 111 162 240 456 756 95 96 98 91 98 87 94 21 MS/MS --- --- 78 112 181 268 498 839 120 98 110 101 107 97 103 8 HPLC --- --- 67 116 176 264 480 949 103 101 107 100 103 110 104 14 HPLC --- --- 64 113 151 261 421 825 98 98 91 99 91 95 95 16 HPLC --- --- 51 --- 159 276 518 991 78 --- 96 104 111 115 107 9 fluorometric --- --- 83 129 179 273 474 921 128 112 109 103 102 106 106 14 fluorometric --- --- 65 118 165 264 482 894 100 103 100 99 104 103 102 15 Bio-Rad 153 585 71 99 129 194 457 759 109 86 78 73 98 88 85 18 AutoDelfia 238046 232615 50 130 210 270 540 960 77 113 127 102 116 111 114 mean 68 117 164 257 470 869 105.5 101.5 100.0 97.1 101.4 100.3 100.1 SD 13.4 13.4 21.6 30.0 54.2 95.1 20.6 11.7 13.1 11.3 11.7 11.0 10.0 %VC 20 11 13 12 12 11 20 11 13 12 12 11 10
Tabel 4c. 17OHP concentration (nmol/L blood and % recovery) for the ISNS-RPNS as measured by participants in RIVM-survey 2004-4 and members of the Standard Committee on Quality Assurance of the ISNS.
calibrator A B C D E F A B C D E F mean B-F
added 0 12.5 25 50 100 300
expected 2.2 14.7 27.2 52.2 102.2 302.2
labnr method kit lot cal. lot observed (nmol/L blood) %recovery (observed/expected*100%)
4 AutoDelfia 201524 189437 <1 17.0 32.5 56.5 102.5 320 --- 116 120 108 100 106 110 18 AutoDelfia 231068 224559 0 18 30 50 99 260 --- 123 110 96 97 86 102 2 AutoDelfia 248015 239183 5.0 13.5 24.5 58.5 91.5 283 --- 92 90 112 90 94 96 1 AutoDelfia 248854 239183 4.5 16.0 29.0 54.5 97.5 300 --- 109 107 105 95 99 103 7 AutoDelfia 246424 239183 4.5 15.5 28.0 47.0 95.5 306 --- 106 103 90 93 101 99 5 AutoDelfia 253229 246380 6.0 14.5 24.0 49.5 87.5 275 --- 99 88 95 86 91 92 6 AutoDelfia 253229 246380 2.8 13.0 27.0 50.0 83.0 282 --- 89 99 96 81 93 92 8 AutoDelfia 251378 246380 3.5 14.0 26.8 55.0 97.5 316 --- 96 99 105 95 105 100 13 AutoDelfia 262130 251129 2.3 12.3 27.4 51.0 91.0 292 --- 84 101 98 89 97 94 3 AutoDelfia 262418 255395 <1 10.0 27.0 55.5 130.0 >300 --- 68 99 106 127 --- 100 11 AutoDelfia 262418 255395 3.2 15.8 28.9 50.0 92.0 303 --- 108 106 96 90 100 100 20 AutoDelfia 262418 255395 2.4 11.0 21.5 51.1 97.0 275 --- 75 79 98 95 91 88 9 AutoDelfia --- --- 1.4 10.0 19.9 36.8 81.1 254 --- 68 73 71 79 84 75 15 Bio-Rad 105 522 2.8 13.0 25.8 48.6 89.1 177 --- 88 95 93 87 59 84 12 Delfia --- --- 0.8 9.3 19.7 40.0 82.9 250 --- 64 73 77 81 83 75 16 ELISA --- --- 9.8 19.2 19.4 38.3 70.8 198 --- 131 71 73 69 66 82 14 ELISA --- --- 3.4 14.4 25.1 40.4 86.3 >120 98 93 78 84 --- 88 10 Schering --- 38171 <1 9.0 19.0 38.5 76.0 194 --- 61 70 74 74 64 69 mean 3.5 13.6 25.3 48.4 91.7 267.8 --- 93.1 93.2 92.8 89.7 88.6 91.5 SD 2.4 3.0 4.0 6.8 12.7 43.9 --- 20.5 14.8 13.1 12.5 14.5 11.1 %VC 67.6 22.0 15.8 14.1 13.9 16.4 --- 22.0 15.8 14.1 13.9 16.4 12.2
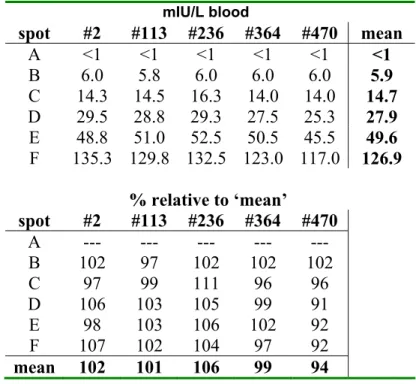
3.5 Homogeneity of the batch on S&S #903
Homogeneity of the batch was tested for S&S #903 by analysing card numbers: 2 and 4, 113 and 124, 224 and 236, 360 and 366, 458 and 470 coming from respectively 1%, 25%, 50%, 75% and 100% of the batch. The cards were analysed in quadruplicate with the AutoDelfia method for TSH and 17OHP and in triplicate with the Quantase method (BioRad) for phenylalanine. The data were analysed in a ‘linear mixed effect model; S-plus; Dr. A.L.M. Dekkers, RIVM)’. Tables 5a-c show the mean concentration and percentage recovery in terms of the ‘mean concentration’ per calibrator and per card for the three analytes.
TSH
The batch was homogeneous for all calibrators except for calibrator F. For calibrator F a small but significant (p<0.01) decrease was observed at the end of the batch. The variation between replicates was higher for calibrator F as compared with the other calibrators. This was possibly due to the fact that the level of this calibrator was at the end of the calibration curve. In a separate experiment homogeneity was tested only for spot F. In this experiment extra cards were taken from the beginning and the end of the batch; the following card numbers were used 25, 31, 32, 95, 185, 327, 458, 459 and 460. In this experiment there was still a small decline (p=0.01) but this was due to the last samples (card 458, 459 and 460) of the batch. After combination of both experiments the batch was homogeneous (p=0.045) for calibrator A-F when the last cards were omitted. This conclusion applies for cards 1-366. Figure 2 shows the combined results of both experiments. homogeneity forTSH experiment 1+2 0 20 40 60 80 100 120 140 160 180 200 0 100 200 300 400 500 card number T S H m U /L blood B C D E F
Figure 2. Homogeneity for TSH; combined results from experiment 1 and 2. Phenylalanine
The batch was homogeneous for calibrator A-E (p=0.28). For calibrator F a small increase phenylalanine was observed at the end of the batch. In a separate experiment homogeneity was tested for only calibrator F. Extra cards were taken from the beginning and from the end of the batch; the following card numbers were used 25, 31, 32, 95, 185, 327, 458, 459
and 460. In this second experiment the batch was found to be homogeneous (p=0.62) and this was also the case when the results from both experiments were combined (p=0.29). See figure 3. Homogeneity phenylalanine experiment 1+2 0 200 400 600 800 1000 1200 1400 0 100 200 300 400 500 card number phe ny la la ni ne ( µ m ol /L bl oo d A B C D E F
Figure 3. Homogeneity for phenylalanine. 17OHP
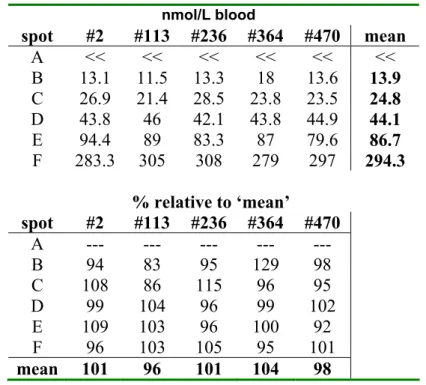
The batch was homogenous for 17OHP (p=0.86). See figure 4. Homogeneity for OHP
0 50 100 150 200 250 300 350 0 100 200 300 400 500 card number OHP ( n m ol/L b lo od ) B C D E F
Table 5a. Homogeneity for TSH for card numbers 2, 113, 236, 364 and 470 of the batch on filter paper S&S #903. Each concentration is the mean of a quadruplicate.
mIU/L blood spot #2 #113 #236 #364 #470 mean A <1 <1 <1 <1 <1 <1 B 6.0 5.8 6.0 6.0 6.0 5.9 C 14.3 14.5 16.3 14.0 14.0 14.7 D 29.5 28.8 29.3 27.5 25.3 27.9 E 48.8 51.0 52.5 50.5 45.5 49.6 F 135.3 129.8 132.5 123.0 117.0 126.9 % relative to ‘mean’ spot #2 #113 #236 #364 #470 A --- --- --- --- --- B 102 97 102 102 102 C 97 99 111 96 96 D 106 103 105 99 91 E 98 103 106 102 92 F 107 102 104 97 92 mean 102 101 106 99 94
Table 5b. Homogeneity for phenylalanine for cardnumbers 4, 124, 224, 366 and 458 of the batch on filter paper S&S #903. Each concentration is the mean of a quadruplicate.
µmol/L blood spot #4 #124 #224 #366 #458 mean A 62 75 50 80 67 67 B 105 118 96 132 103 111 C 196 173 187 182 192 186 D 296 265 295 260 288 281 E 491 456 458 517 511 487 F 880 850 883 933 954 900 % relative to ‘mean’ spot #4 #124 #224 #366 #458 A 93 112 74 119 101 B 95 106 86 119 93 C 105 93 100 98 103 D 105 94 105 92 103 E 101 94 94 106 105 F 98 94 98 104 106 mean 100 99 93 106 102
Table 5c. Homogeneity for 17OHP for card numbers 2, 113, 236, 364 and 470 of the batch on filter paper S&S #903. Each concentration is the mean of a quadruplicate.
nmol/L blood spot #2 #113 #236 #364 #470 mean A << << << << << << B 13.1 11.5 13.3 18 13.6 13.9 C 26.9 21.4 28.5 23.8 23.5 24.8 D 43.8 46 42.1 43.8 44.9 44.1 E 94.4 89 83.3 87 79.6 86.7 F 283.3 305 308 279 297 294.3 % relative to ‘mean’ spot #2 #113 #236 #364 #470 A --- --- --- --- --- B 94 83 95 129 98 C 108 86 115 96 95 D 99 104 96 99 102 E 109 103 96 100 92 F 96 103 105 95 101 mean 101 96 101 104 98
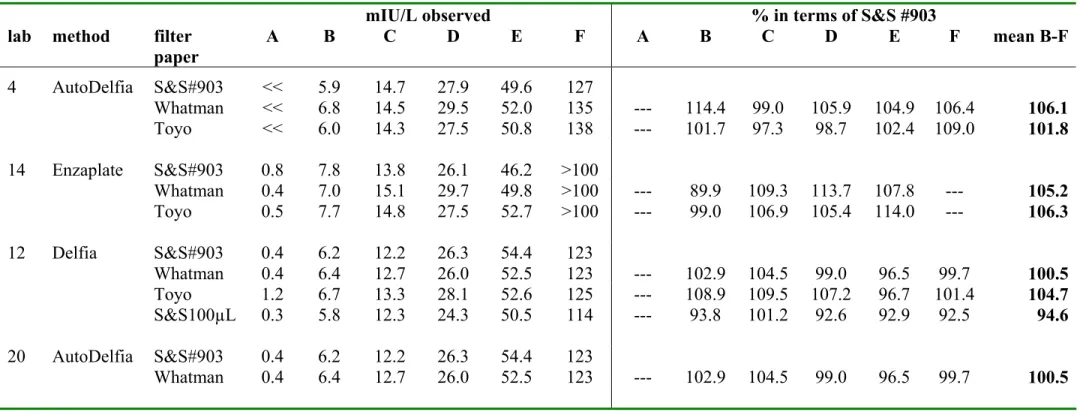
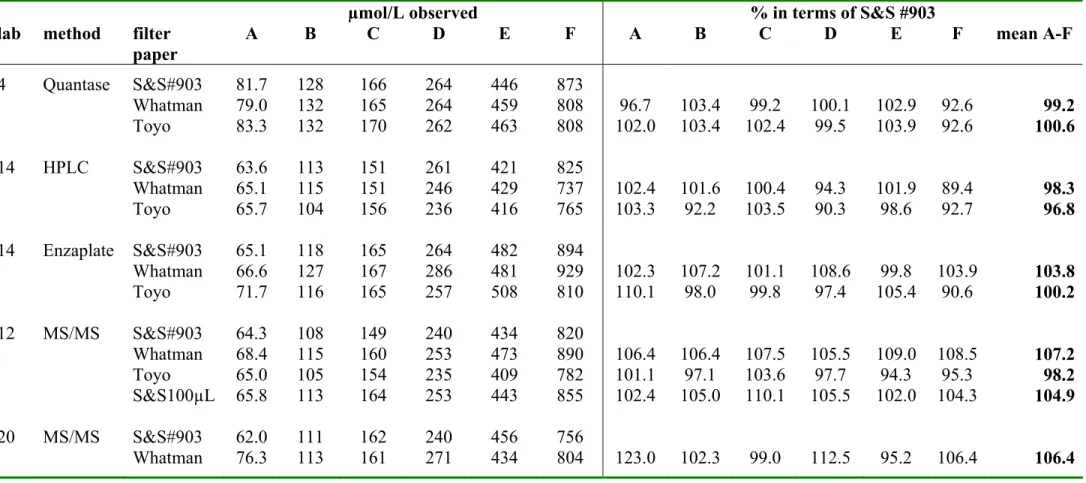
3.6 Comparison filter papers
The ISNS-RPNS on the three filter papers S&S903, Whatman BFC180 and Toyo Roshi 545 were compared for each analyte by 3-5 laboratories. One of the laboratories also analysed the 100 µL spots on S&S#903. The number of replicates per calibrator and per analyte varied for the laboratories (laboratory 9, 14 and 20: duplicates; laboratory 4: quadruplicate; laboratory 12: four runs in duplicate). The mean concentration per laboratory, per calibrator and per filter paper is summarised in Table 6a-c for TSH, phenylalanine and 17OHP, respectively. These tables also show the measured concentration for Whatman BFC180, Toyo Roshi 545 and S&S-100µL, expressed as percentage recovery against the measured concentration for S&S #903. Data were statistically evaluated in a ‘linear mixed effect model’(S-plus) (Dr. A.L.M. Dekkers, RIVM). Table 7 shows the potency (95% confidence limits and p-value) for the three analytes for Whatman BFC180 and Toyo Roshi 545 in terms of S&S #903. The differences between the filterpapers were very small; nevertheless there was a significant difference (p<0.05) between Whatman BFC180 and S&S #903 for phenylalanine, between Toyo Roshi 545 and S&S #903 for TSH and 17OHP and between 50µL and 100 µL spots on S&S #903 for phenylalanine.
Tabel 7. The potency (95%-range; p-value) per analyte in terms of S&S #903 for Whatman BFC180, Toyo Roshi 545 and S&S #903-100µL spots.
Whatman BFC180 Toyo Roshi 545 S&S 100µL TSH 1.02 (0.99-1.05; 0.12) 1.04 (1.00-1.07; 0.03) 0.97 (0.93-1.02; 0.27) Phenylalanine 1.04 (1.02-1.06; <0.01) 0.99 (0.97-1.01; 0.18) 1.05 (1.02-1.08;<0.01) 17OHP 0.98 (0.94-1.03; 0.47) 1.09 (1.04-1.14;<0.01) 1.00 (0.93-1.08; 0.68)
Table 6a. Mean TSH concentration (mIU/L blood) per spot and per filter paper as measured by 3 laboratories using 3 different methods. Lab 12 also compared 50 µL and 100 µL spots on S&S #903.For Whatman BFC180, Toyo Roshi 545 and S&S-100µL the measured concentration was also expressed as a percentage of the measured concentration in S&S #903 (50 µL spots).
mIU/L observed % in terms of S&S #903
lab method filter
paper A B C D E F A B C D E F mean B-F 4 AutoDelfia S&S#903 << 5.9 14.7 27.9 49.6 127 Whatman << 6.8 14.5 29.5 52.0 135 --- 114.4 99.0 105.9 104.9 106.4 106.1 Toyo << 6.0 14.3 27.5 50.8 138 --- 101.7 97.3 98.7 102.4 109.0 101.8 14 Enzaplate S&S#903 0.8 7.8 13.8 26.1 46.2 >100 Whatman 0.4 7.0 15.1 29.7 49.8 >100 --- 89.9 109.3 113.7 107.8 --- 105.2 Toyo 0.5 7.7 14.8 27.5 52.7 >100 --- 99.0 106.9 105.4 114.0 --- 106.3 12 Delfia S&S#903 0.4 6.2 12.2 26.3 54.4 123 Whatman 0.4 6.4 12.7 26.0 52.5 123 --- 102.9 104.5 99.0 96.5 99.7 100.5 Toyo 1.2 6.7 13.3 28.1 52.6 125 --- 108.9 109.5 107.2 96.7 101.4 104.7 S&S100µL 0.3 5.8 12.3 24.3 50.5 114 --- 93.8 101.2 92.6 92.9 92.5 94.6 20 AutoDelfia S&S#903 0.4 6.2 12.2 26.3 54.4 123 Whatman 0.4 6.4 12.7 26.0 52.5 123 --- 102.9 104.5 99.0 96.5 99.7 100.5
Table 6b. Mean phenylalanine concentration (µmol/L blood) per spot and per filter paper as measured by 4 laboratories (lab 14 used two different methods). Lab 12 also compared 50 µL and 100 µL spots on S&S #903. For Whatman BFC180, Toyo Roshi 545 and S&S-100 µL spots the measured concentration was also expressed as a percentage of the measured concentration in S&S #903 (50 µL spots).
µmol/L observed % in terms of S&S #903
lab method filter paper A B C D E F A B C D E F mean A-F 4 Quantase S&S#903 81.7 128 166 264 446 873 Whatman 79.0 132 165 264 459 808 96.7 103.4 99.2 100.1 102.9 92.6 99.2 Toyo 83.3 132 170 262 463 808 102.0 103.4 102.4 99.5 103.9 92.6 100.6 14 HPLC S&S#903 63.6 113 151 261 421 825 Whatman 65.1 115 151 246 429 737 102.4 101.6 100.4 94.3 101.9 89.4 98.3 Toyo 65.7 104 156 236 416 765 103.3 92.2 103.5 90.3 98.6 92.7 96.8 14 Enzaplate S&S#903 65.1 118 165 264 482 894 Whatman 66.6 127 167 286 481 929 102.3 107.2 101.1 108.6 99.8 103.9 103.8 Toyo 71.7 116 165 257 508 810 110.1 98.0 99.8 97.4 105.4 90.6 100.2 12 MS/MS S&S#903 64.3 108 149 240 434 820 Whatman 68.4 115 160 253 473 890 106.4 106.4 107.5 105.5 109.0 108.5 107.2 Toyo 65.0 105 154 235 409 782 101.1 97.1 103.6 97.7 94.3 95.3 98.2 S&S100µL 65.8 113 164 253 443 855 102.4 105.0 110.1 105.5 102.0 104.3 104.9 20 MS/MS S&S#903 62.0 111 162 240 456 756 Whatman 76.3 113 161 271 434 804 123.0 102.3 99.0 112.5 95.2 106.4 106.4
Table 6c. Mean 17OHP concentration (nmol/L blood) per spot and per filter paper as measured by 3 laboratories using 3 different methods. Lab 12 also compared 50 µL and 100 µL spots on S&S #903. For Whatman BFC180, Toyo Roshi 545 and S&S-100 µL the measured concentration was also expressed as a percentage of the measured concentration in S&S #903 (50 µL spots).
nmol/L observed recovery (%) in terms of S&S #903
lab method filter
paper A B C D E F A B C D E F mean B-F 4 AutoDelfia S&S#903 3.9 14.0 27.4 47.8 100.0 340 Whatman 3.4 15.0 25.8 52.1 105.0 370 --- 107.1 94.1 109.2 105.0 108.7 104.8 Toyo 3.8 14.6 30.3 55.9 117.6 376 --- 104.5 110.5 117.0 117.6 110.5 112.0 14 Enzaplate S&S#903 3.4 14.4 25.1 40.4 86.3 >120 Whatman 3.9 14.3 22.3 41.1 77.8 >120 --- 99.2 88.8 101.7 90.1 --- 94.9 Toyo 4.1 14.3 25.5 43.7 83.8 >120 --- 99.4 101.4 108.1 97.1 --- 101.5 12 Delfia S&S#903 0.8 9.3 19.7 40.0 82.9 250 Whatman 1.0 8.7 19.4 41.6 73.5 237 --- 93.0 98.3 104.1 88.7 94.7 95.8 Toyo 5.8 22.5 22.8 41.3 79.3 242 --- 241.0 115.5 103.4 95.6 96.5 102.81 S&S100µL 0.4 10.6 19.2 35.0 84.9 277 --- 113.8 97.1 87.6 102.4 110.6 102.3 20 AutoDelfia S&S#903 2.4 11.0 21.5 51.1 97.0 275 Whatman 1.3 11.2 23.5 53.7 106.1 298 --- 101.4 109.6 105.2 109.4 108.4 106.8 1 without calibrator B
3.7 Comparison ISNS-RPNS for TSH with CRM-TSH (1999)
On request of the ISNS a certified reference material for TSH (CRM-TSH) had been prepared in 1999 by the CDC on different filter papers and 50µL and 100µL ‘spot size’. ISNS-RPNS on S&S #903 was compared with CRM-TSH on S&S #903 (50 µL ‘spot size’) using the AutoDelfia Neonatal TSH method. Table 8 gives the results for CRM-TSH in terms of the ISNS-RPNS. The formula for the linear regression line for calibrator B-F was: y = 0.96x -0.73; r = 0.999 (x= ISNS-RPNS; y=CRM-TSH). The mean ± SD recovery for CRM-TSH was 93 ± 4.5%. Figure 5 shows both reference preparations as read on the calibrators of the kit.
Table 8. CRM-TSH (mIU/L blood; %recovery) in terms of ISNS-RPNS.
observed expected
mIU/L blood mIU/L blood recovery (%)
x1 x2 x1 x2 A 0 <1 <1 --- --- B 7.5 7 7 93 93 C 15 12 14 80 93 D 25 24 25 96 100 E 50 45 46 90 92 F 75 71 74 95 99 mean: 93 ± 4.5% Comparison ISNS-RPNS vs CRM-TSH (AutoDelfia) y = 0.95x + 0.15 r = 0.995 y = 1.05x - 0.69 r = 0.999 0 20 40 60 80 100 120 140 160 0 20 40 60 80 100 120 140 160
TSH expected (mIU/L blood)
TS H obs e rv e d (m IU /L bl ood ) ISNS-RPNS CRM-TSH
3.8 Comparison ISNS-RPNS for phenylalanine with EWS-PHE-03 and AARM On request of the European branch of the ISNS the European Working Standard for phenylalanine in blood spots had been prepared by RIVM. The first batch was produced in 1996 [3] and the latest batch EWS-PHE-03 was produced in 2003. CDC prepared in 1996 the ‘Amino Acids Reference Materials’ (AARM), a reference material for, amongst others, phenylalanine [4]. The EWS-PHE-03 and AARM were compared with the ISNS-RPNS in an enzymatic/colorimetric method in triplicate (Quantase; laboratory 4). Figure 6 shows the mean absorbance (570/690 nm) for the three preparations. The regression lines for the three preparations nearly coincided. Table 9 gives the mean concentration and recovery in terms of the ISNS-RPNS. The mean recovery for EWS-PHE-03 and AARM against ISNS-RPNS was 111 ± 8% and 108 ± 6% respectively.
Table 9. Phenylalanine (µmol/L; %recovery) for EWS-PHE-03 and AARM in Quantase with ISNS_RPNS as calibrators.
EWS-PHE-03 AARM
expected observed recovery (%) expected observed recovery (%)
A 50 61 123 73 71 98 B 170 192 113 315 333 106 C 290 326 112 557 630 113 D 530 558 105 799 852 107 E 770 793 103 1041 1172 113 F 1283 1430 111 Mean 111 ± 8% 108 ± 6%
Comparison ISNS-RPNS, EWS-PHE-03 and AARM for phenylalanine in Quantase
y = 0.234x + 9.00 r = 0.999 y = 0.240x + 11.95 r = 0.999 y = 0.262x + 6.81 r = 0.999 0 50 100 150 200 250 300 350 400 0 200 400 600 800 1000 1200 1400
phenylalanine (µmol/L blood)
ab s o rb an c e ( 5 70/ 69 0 n m ) ISNS EWS AARM
Figure 6. ISNS-RPNS, EWS-PHE-03 and AARM in Quantase for phenylalanine.
The ISNS-RPNS and EWS-PHE-03 were also analysed in one run in triplicate by MS/MS by two laboratories (laboratory 10 and 21). The mean concentration and recovery are
summarised in Table 10. Figure 7 shows the regression lines for both preparations and both laboratories. Although the recovery for laboratory 10 is rather high for both preparations, it can be concluded that for both laboratories ISNS-RPNS and EWS-PHE-03 do not differ significantly.
Table 10. Phenylalanine (µmol/L; %recovery) in ISNS-RPNS and EWS-PHE-03, analysed with MS/MS in laboratory 10 and 21.
observed (µmol/L) recovery (%) calibrator expected
(µmol/L) lab-10 lab-21 lab-10 lab-21
ISNS-A 65.2 82.3 78.0 126 120 -B 115 142 112 123 98 -C 165 201 181 122 110 -D 265 302 268 114 101 -E 465 577 498 124 107 -F 865 1027 839 119 97 mean 121 105 SD 4.4 8.7 EWS-A 50 75.7 51.7 151 103 -B 170 185 170 109 100 -C 290 356 292 123 101 -D 530 726 488 137 92 -E 770 993 712 129 93 mean 130 98 SD 16 5
Figure 7. Phenylalanine in ISNS-RPNS and EWS-PHE-03 analysed in laboratory 10 and 21 with MS/MS.
phenylalanine in ISNS-RPNS and EWS-PHE-03 with MS/MS (lab 10) y = 1.19x + 3.68 r = 0.999 y = 1.32x - 12.02 r = 0.999 0 200 400 600 800 1000 1200 0 200 400 600 800 1000 1200 expected (µmol/L blood)
o b se rv ed ( µ m o l/ L bl o od) ISNS EWS
phenylalanine in ISNS-RPNS and EWS-PHE-03 with MS/MS (lab 21) y = 0.91x + 14.5 r = 0.9998 y = 0.97x + 16.72 r = 0.998 0 200 400 600 800 1000 0 200 400 600 800 1000 expected (µmol/L blood)
o b se rv ed ( µ m o l/ L bl o od) ISNS EWS
3.9 Stability study
A stability study is started with extra blood spots from calibrator D on filter paper cards S&S #903. These cards will be stored at -80, -20, +4, +20, and +37 oC for 0, 1, 2, 4, 8, 12, 18 and 24 months. At the end of this period all cards will be analysed in quadruplicate for the three analytes. The expiry date for ISNS-RPNS is stated on December 2007, i.e. 3 years after the preparation. This period was based on experience with EWS-PHE-01 [3] and CRM-TSH (results not published).
4. Discussion
In planning the production of the 1st ISNS-RPNS decisions had to be made about amongst others: types of filter paper to be used, the number and layout of the cards to be produced, matrix, spot size, analytes to be included in this combined preparation, range of concentrations for the diverse analytes and finally how to assess the concentrations for the calibrators both in basal and spiked blood.
Filter paper
Until the end of 1999 Schleicher & Schuell marketed two types of filter paper for neonatal screening: #2992 mainly used in Europe and #903 used in Australia, Canada and USA. The most important difference between both papers was the absorption capacity per unit area: #903 absorbed 20% more serum then #2992. In October 1999, Schleicher & Schuell decided only to promote #903 for neonatal screening. To date, most European countries switched to #903. Besides this filter paper, Whatman BFC180 is used in a few countries just like Toyo Roshi type 545, the last one being used only in Japan. It was therefore decided to prepare the majority of the cards with the 1st ISNS-RPNS on Schleicher & Schuell #903 and a limited number on Whatman and Toyo Roshi.
Number of cards
Since 1996 three reference materials for neonatal screening in blood spots had been prepared: i) the European Working Standard for Phenylalanine in blood spots (EWS-PHE-01 in 1996; EWS-PHE-02 in 1999; EWS-PHE-03 in 2003; prepared by RIVM), ii) Amino Acid Reference Material (AARM in 1996; prepared by CDC) and the ISNS Certified Reference Material for TSH (CRM-TSH in 1999; prepared by CDC). The number of cards of the 1st ISNS-RPNS to be prepared was based on an inventory of shipments of CRM-TSH and EWS-PHE-03 (see Appendix 3). Furthermore we decided that the number of cards had to be prepared with blood from only one donor. This limited the maximum numbers of cards. Finally, the following numbers of filter paper cards, each with two series of calibrators, were prepared: S&S #903: N=480; Whatman BFC180: N=42; Toyo Roshi: N=69.
Spot size
During the collection of the blood on a filter paper card there is piling of blood cells in the centre of the blood spot and migration of serum to the outer side of the spot. Due to this ‘chromatography effect’ a punch taken from the centre of the spot contains less serum and thus analyte, as compared to a punch taken from the outer side of the spot. This difference increases with an increasing size of the blood spot and is more pronounced for analytes which are mainly in the serum-compartment of the blood. It is therefore important that calibrators have the same spot size as routine neonatal samples. On average the spot size for neonatal samples on S&S #903 is 11-12 mm, which corresponds with 45-50 µL. For this reason we decided to use 50 µL for the 1st ISNS-RPNS
Matrix
The matrix of blood spot calibrators preferably resembles the matrix of neonatal samples as much as possible. This is particularly important for a ‘reference material’ which is intended for use in all types of assays (ELISA, IRMA, colorimetric assays, fluorimetric assays, MS/MS etc). We therefore decided to use fresh heparinised human blood from one healthy donor and to manipulate it as few as possible. That meant that besides the addition of analytes the only manipulation would be the adjustment to 50% hematocrit, if necessary. It is well known that EDTA and citrate blood might affect some assays often used for neonatal screening. We therefore decided to use heparin as anti-coagulant.
Analytes
In most so called developed countries of the world neonates are screened for phenylketonuria (PKU) and congenital hypothyroidism (CH) and often also for congenital adrenal hyperplasia (CAH). The analytes of interest for these diseases are phenylalanine for PKU and 17α-hydroxyprogesterone (17OHP) for CAH. For CH however the situation is more complicated. Most countries use thyrotropin (TSH) as the primary analyte of interest. In some states of the USA and in The Netherlands the screening is primarily based on the measurement of thyroxin (T4). From this point of view it would be practical to include T4 in the combined preparation. Inclusion of T4 would have meant however considerable manipulation of blood to remove the endogenous T4 (treatment of plasma with charcoal or resin) and it is likely that this would have had also implications for the other analytes. Another analyte of interest is immunoreactive trypsinogen (IRT) which is used for neonatal screening for cystic fibrosis (CF). Although there is a rising interest in screening on CF and therefore for a ‘reference material’, we decided not to include IRT in the 1st ISNS-RPNS, because at this moment, we had insufficient experience with IRT to be sure to make a reliable reference material. So, we finally decided to produce a combined reference material for TSH, phenylalanine and 17OHP.
Range of concentrations
The intended concentration range for the three analytes was assessed after consultation of experts in the field of neonatal screening and manufacturers of kits for neonatal screening. Furthermore an inventory of cut off values by CDC [5] was taken into account. We decided to use SI-units, for example for phenylalanine ‘µmol/L blood’ instead of ‘mg/dL blood’.
Assignment of the concentration of the calibrators
The concentration of the analytes in plasma, prepared from basal and spiked blood, was measured by three laboratories (see table 1a-c). Linear regression lines were calculated between the amounts of analyte added and the amounts of analyte observed. The linearity appeared to be excellent, the coefficient of correlation being ≥ 0.999 for nearly all laboratories. The basal concentration in plasma A was calculated as the mean measured concentration and also as the intercept of the regression lines for the plasma A-F. For TSH and phenylalanine there was a close agreement between the ‘measured’ and the ‘calculated’ concentration of the basal plasma. For 17OHP the regression line could be calculated for only two laboratories and the intercept for both lines differed too much to combine them. The observed differences for the measured concentration in basal plasma between the laboratories were very well within limits which might be expected for the type of methods used. It was therefore decided to base the assignment of the concentration of the calibrators on the measured basal concentration in unspiked blood and the amounts of the analytes added to the spiked blood.
Comparison with other ‘reference’ materials
For 17OHP no reference material is available. With respect to phenylalanine the 1st ISNS-RPNS was compared with i) the European Working Standard for phenylalanine in blood spots (EWS-PHE-03) in three laboratories and ii) the Amino Acid Reference Material (AARM) in one laboratory. The difference between the preparations within one laboratory was always <10%. For TSH the 1st ISNS-RPNS was compared with the ‘Certified Reference Material for TSH’ (CRM-TSH). The mean recovery for CRM-TSH in terms of the 1st ISNS-RPNS was 93%. This relative low recovery is no problem taken into account that the CRM-TSH was prepared in 1999 and that 10% difference between two batches of blood spot calibrators is quite normal.
It was concluded that the observed differences between these reference materials are quite acceptable.
Homogeneity of the batch
Two experiments were carried out to check whether the batch on filter paper S&S #903 was homogeneous. From the statistical analysis of the data from the first experiment it was concluded that the batch was homogeneous for 17OHP and also for calibrators A – E for TSH and phenylalanine. For calibrator F a slight decrease was observed for TSH and a slight increase for phenylalanine. From the results of the second experiment, which was focused on calibrator F only, it could be concluded that the batch was homogeneous for phenylalanine and this was also the case for calibrator A – F when the results of both experiments were combined. For TSH, again a slight but significant decrease was observed, although the batch was homogeneous if the last cards were omitted from the evaluation. We have no explanation for this discrepancy. The portions blood for calibrator A – F were treated all identical, while the time between start and end of the actual spotting of calibrators A – F was also equal. There is no reason why calibrator F would behave different from the other calibrators. Furthermore, a decrease was found for TSH, an increase for phenylalanine and no difference for 17OHP. The variation between replicates was larger for calibrator F in comparison with the other calibrators. This is probably due to the fact that the concentration of calibrator F is at or below the highest calibrator of the methods used. It was therefore decided to disregard the small changes in calibrator F and to consider the batch to be homogeneous.
Comparison filter papers
The results from the comparison of the three filter papers show that the differences between the filter papers are small. With the exception of 17OHP on Toyo Roshi (1.09) all other potencies in terms of S&S #903 were between 0.95 – 1.05. Differences of this magnitude can also been found for different batches of filter paper from the same manufacturer.
The1st ISNS-RPNS in routine neonatal screening
The calibrators of the 1st ISNS-RPNS were analysed as ‘routine neonatal samples’ in 22 neonatal screening laboratories using different methods. The overall recovery (mean ± SD) for the three analytes was 96 ± 15%, 100 ± 10% and 92 ± 11% for TSH, phenylalanine and 17OHP respectively. For most laboratories the overall recovery is between 85 – 115%. The recovery for calibrator A - F was for most laboratories fairly constant, which involves parallelism between kit calibrators and the ISNS-RPNS.
In conclusion
The 1st ISNS-RPNS for TSH, phenylalanine and 17OHP is suitable as formal reference preparation and serves as a source for (re)calibrating kit calibrators. It is available to manufacturers for a small handling charge and to EQAS organizers for free.
Acknowledgements
We thank Schleicher & Schuell, Whatman and Toyo Roshi for making available the filter paper cards. We thank Guido Diependaal, Idder Belmouden and Mark Jonker (RIVM; LIS) for their assistance by the preparation of the 1st ISNS-RPNS and Dr. A.L.M. Dekkers (RIVM; IMA) for the statistical analyses. We thank the following laboratories for the assessment of TSH, phenylalanine and 17OHP in basal and enriched plasma: Dr. S. Ewing (Hôpital d’Enfants, Laboratoire de Biochimie Spécialisée, Dyon, France); Dr D. Rabier (Hôpital Necker-Enfants maladies, Department Laboratoire de Biochemie B, Paris, France); Prof. P. Bourdoux (Hôpital Universitaire des Enfants, ULB-Laboratoire de Pédiatrie, Brussels, Belgium; Dr. E. Lentjes (UMC-Utrecht, Laboratory for Endocrinology, Utrecht, The Netherlands; Ing. M.F.G. Segers (UMC-St Radboud, Laboratoy for Experimental Endocrinology, Nijmegen, The Netherlands); Dr. E. Endert (AMC, Laboratory for Endocrinology, Amsterdam, The Netherlands).
References
1. Hannon WH, Baily CM, Barthoshesky LE, Davin B, Hoffman GL, King PP, et al. Blood collection on filter paper for newborn screening programs. Fourth edition, approved standard. Wayne (PA): NCCLS; 2003 NCCLS Document LA4-A4.
2. Elvers LH, Loeber JG, Dhondt JL. Preparation of the first European working standard for phenylalanine in dried blood spots: EWS-PHE-01. RIVM report 199003047; 1996. 3. Dhondt JL, Loeber J, Elvers LH, Paux E. Preparation of the first European working
standard for phenylalanine determination in dried blood spots. J.Med.Screen 1998;5:63-66
4. Chace DH, Adam BW, Smith SJ, Alexander JR, Hillman SL, Hannon WH. Validation of accuracy-based amino acid reference materials in dried-blood-spots by tandem mass spectrometry for newborn screening assays. Clin Chem;1999; 45: 1269-77. 5. CDC Newborn Screening Quality Assurance Program. 2003 Annual Summary
Appendix 1
Detailed description of the preparation of the 1
stISNS-RPNS
Note: use of trade names is for identification only and does not imply endorsement by the National Institute for Public Health and the Environment (RIVM) or the International Society for Neonatal Screening.
Materials and methods
1. Materials
1.1 Filter paper cards, dimension 7.5 x 12.5 cm, were obtained free of charge from a) Schleicher & Schuell, type #903, lot W031, 600 cards, b) Whatman, type BFC180, lot 145475; 40 cards and c) Toyo Roshi Kaisha Ltd, type 545, lot 40921511, 100 cards
1.2 Thyroid stimulating hormone, proposed 3rd IRP for TSH, code 81/565; 11.5 mIU/ampoule; NIBSC, London
1.3 L-phenylalanine, M=165.2, product no 78019, purity ≥ 99%, lot 438863/2 11104103; Fluka, Switzerland
1.4 17α-hydroxyprogesterone, M=330.5, product no 56240, lot 2006994; Fluka, Switzerland
1.5 Saline (sterile), product no p250.65.0100, lot 20040200631, exp date 2006-02-25; Tritium Microbiologie BV, Veldhoven, The Netherlands
1.6 Ethanol abs., product no 1.00983, lot K31218583; Merck, Darmstadt, Germany 1.7 Blood pack unit without anticoagulant, code R0002; Baxter
1.8 Sodium Heparine, 5000 IU/mL, Leo BV, Weesp, The Netherlands 1.9 5-Sulfosalicylic acid, product no 5021; VEL BV, The Netherlands 1.10 Minipax sorbent (2 gram); Multisorb Technologies, Buffalo, New York
1.11 Lamigrip, aluminium bags, 120x180 mm, code 352, Minigrip BV, the Netherlands 1.12 QC-materials: TSH lot 411-413; 17OHP lot 351-353; phenylalanine lot 421-424
and AminoAcidsReferenceMaterial (AARM); CDC, Atlanta, USA
2. Stock solutions
Before use, the analytical balance was calibrated with a certified weight (Mettler; 200 mg) On 27-10-2004 the following stock solutions were prepared:
2.1 TSH 81/565; 10 mIU/mL
Needed for enrichment: 0.08*(6.25+12.5+50+120)+0.09*25 = 17.35 mIU. The contents of 2 ampoules was reconstituted in 1.15 mL saline per ampoule. The contents of both ampoules was combined → 10 mIU/mL code: TSH-0 2.2 Phenylalanine; 0.10 mol/L
1.652 gram phenylalanine was weighed on an analytical balance and dissolved by warming ~40 oC in a volumetric flask in 100.0 mL saline → 0.10 mol/L code: PHE-0
2.3 OHP; 33.33 nmol/mL
330.5 mg 17OHP was weighed on an analytical balance and dissolved in 100 mL ethanol in a volumetric flask → 10 mmol/L code OHP-0 0.333 mL 17OHP-0 + 99.67 mL saline → 33.33 nmol/mL code OHP-1 2.4 5-sulfosalicylic acid, 5%
2 gram 5-sulfosalicylicacid was dissolved in 20 mL distilled water
3. Methods
3.1 Preparation of the filter paper cards
Figure 1 shows the intended layout for filter paper card for S&S #903); dimensions filter paper card 12.5 x 7.5 cm; 2 series of calibrators per card; spot size: 50 µL. A label (Avery 5261; 10.16x 2.54 cm) was attached to the filter paper card, showing type and lot of filter paper. All cards were numbered uniquely on the back.
Figure 1. Proposed layout 1st ISNS RP-NS.
3.2 Basal blood (49.5-50.5%HT) code: B-0 On 28-10-2004 1.5 mL LEO heparine (5000 IU/mL) was injected via the middle inlet of a blood pack unit; 540 mL blood from an healthy male volunteer (JGL) was collected. Hematocrit was determined in duplicate by the microcentrifugal method (Standard Operation Procedure TOX/286, Laboratory for Toxicology, Pathology and Genetics, RIVM). %HT was 49.5% and needed no further adjustment. The blood was tested and found to be negative for hepatitis B surface antigen, anti-hepatitis C and anti-HIV 1 and 2 antibodies.
3.3 Enrichment of blood with TSH, 17OHP and phenylalanine.
100 mL blood was weighed in a volumetric flask: 105.21 gram. Based on this, six portions blood B-0 were prepared in glass bottles by weighing: code: A – F
International Society for Neonatal Screening
1st ISNS RP-NS for TSH, phenylalanine and 17OHP
S&S #903 Lot W031 expiry: 12-2007
A
B C
D E
F
calibrator A, B, C, E and F : 84.17 gram = 80 mL
calibrator D : 94.69 gram = 90 mL (extra blood for stability study)
The portions blood were mildly centrifuged for 10 minutes, 1400 rpm (800 g) at room temperature (Beckman centrifuge). Plasma was removed and saline, TSH, 17OHP and phenylalanine were added, using calibrated pipetting devices, according to table 1.
Table 1. Preparation of calibrators A-F.
Cal. Blood mL Remove serum µL TSH-0 (10 mIU/mL) µL Phe-0 (0.10 mmol/mL) µL OHP-1 (33.33 nmol/mL) µL Saline µL A 80 2320 0 0 0 2320 B 80 2320 50 40 30 2200 C 80 2320 100 80 60 2080 D * 90 2610 225 180 135 2070 E 80 2320 400 320 240 1360 F 80 2320 960 640 720 0
* extra blood D for stability study The following Eppendorf pipets were used:
25-100 µL pipette # 2501 for: 30µL OHP-1 and 40 µL Phe-0
50-200 µL pipette #1912 for: 50, 100, 225, 400 µL TSH-0; 80, 180, 320 µL Phe-0; 60, 135, 240 µL OHP-1 100-1000 µL pipette #1930 for: 960 µL TSH-0; 640 µL Phe-0; 720 µL 17OHP
500-2500 µL pipette #2362 for: all volumes >1000 µL
3.4 Basal/enriched plasma for analysis of TSH, 17OHP and phenylalanine The enriched blood was homogenised on a roller bank for 5 hours at room temperature. For each calibrator 16 mL blood was centrifuged for 10 minutes, 2400 rpm (1200 g) at room temperature. Plasma was divided in 10 portions of 600 µL for determination of TSH, 17OHP and phenylalanine in plasma and stored until shipment at -20 oC.
3.5 5-Sulfosalicylic acid extract for analysis of phenylalanine
A 5% (w/v) sulfosalicylicacid solution (SSA) was prepared by dissolving 2 gram 5-sulfosalicylic acid in 40 mL distilled water. Two 600 µl portions of basal and enriched plasma were treated with an equal volume of 5-SSA, and vortex-mixed for 10 seconds. After 2 minutes the tubes were centrifuged for 10 minutes and 1600 g at room temperature. The clear supernates were transferred to polypropylene tubes, frozen immediately and stored until shipment at -20 oC.
3.6 Preparation of blood spots
Five hours after the enrichment of the blood, blood spots were prepared using a Matrix Impact2 pipette (Matrix Technologies Corp; Hudson, NH, USA). Two 50 µL blood spots (~ 12 mm spot size) per calibrator were pipeted on the filter paper cards. On 14 cards two 100 µL blood spots were pipeted for comparison with an earlier prepared ISNS-TSH reference preparation. On 40 filter paper cards from S&S #903 five 50 µL spots from calibrator D were pipeted for a stability study. The total time needed for the preparation of the blood spot cards was 75 minutes. During the preparation of the cards the remainder of the blood was homogenised on a roller bank. The cards were prepared in the following ranking: Whatman 1-42, S&S #903 (50 µL) 1-100, S&S #903 (100 µL) 1-14, S&S #903 (50 µL) 101-400, Toyo Roshi 1- 69 and S&S #903 (50 µL) 401-480.
3.7 Storage of the filter paper cards
After overnight drying at room temperature in the dark the filter paper cards were sealed in PE-laminated aluminium sachets with dessicant. For S&S #903 the batch was divided in 10 series, coded 001 – 010 (series 001: cards 001-048, series 002: cards 049-096 etc.) A label was attached to each sachet showing the same information as was on the label on the filter paper card and for S&S #903 also the series number.
3.8 Effect of storage conditions on TSH, phenylalanine and 17OHP
To study the effect of storage conditions 36 filter paper cards were prepared on S&S #903, each with five 50 µL spots of calibrator D. After overnight drying the cards were sealed in aluminium sachets with dessicant and a humidity indicator (MS20003-2). Cards will be stored at different temperatures: -80 oC, -20 oC, +4 oC, +22 oC and +37 oC for 1, 2, 4, 8, 12, 18 and 24 months. Determination of TSH, phenylalanine and 17OHP in quadruplicate is planned after one year and after two years.
3.9 Analysis in basal and enriched plasma
Basal end enriched plasma was sent by ordinary mail to three laboratories in The Netherlands for analysis of TSH and 17OHP. Plasma and/or 5SS-extracts were sent on dry-ice to three laboratories in France and Belgium for analysis of phenylalanine.