A.F.A Kuijpers | J. van de Kassteele |
K.A. Mooijman
EU Interlaboratory comparison study
animal feed III (2014)
Detection of Salmonella in chicken feed RIVM Report 2015-0080
Colophon
© RIVM 2016
Parts of this publication may be reproduced, provided acknowledgement is given to: National Institute for Public Health and the Environment, along with the title and year of publication.
This is a publication of:
National Institute for Public Health and the Environment
P.O. Box 1│3720 BA Bilthoven the Netherlands
www.rivm.nl/en
A.F.A. Kuijpers (author), RIVM
J. van de Kassteele (author), RIVM
K.A. Mooijman (author), RIVM
Contact:
Angelina Kuijpers
Centre for Zoonoses and Environmental Microbiology (cZ&O) Angelina.Kuijpers@rivm.nl
This investigation has been performed by order and for the account of the European Commission, Directorate-General for Health and Consumer Protection (DG-Sanco), within the framework of RIVM project number E/114506/14/RO European Union Reference Laboratory for Salmonella 2014
Publiekssamenvatting
EU Ringonderzoek diervoeder III (2014)
Detectie van Salmonella in kippenvoer
In 2014 waren 32 van de 34 Nationale Referentie Laboratoria (NRL’s) in de Europese Unie in staat om hoge en lage concentraties Salmonella in
kippenvoer aan te tonen. Twee NRL’s behaalden een matig resultaat als gevolg van een rapportagefout. Vanwege herhaaldelijk slechte prestaties is een van deze NRL tijdens een herkansing bezocht door het overkoepelende orgaan EURL-Salmonella Daarbij zijn enkele verbeterpunten aangereikt, waarna er een goed resultaat is bereikt. In totaal hebben de laboratoria in 97 tot 100 procent van de besmette monsters Salmonella aangetoond. Dit blijkt uit het derde diervoederringonderzoek dat is georganiseerd door het referentielaboratorium van de Europese Unie voor Salmonella
(EURL-Salmonella).
Ringonderzoek verplicht voor Europese lidstaten
Het onderzoek is in september 2014 gehouden, de herkansing was in februari 2015. Alle NRL’s van de Europese lidstaten die verantwoordelijk zijn voor de opsporing van Salmonella in diervoeder, zijn verplicht om aan het onderzoek deel te nemen. Het EURL-Salmonella is gevestigd bij het Nederlandse Rijksinstituut voor Volksgezondheid en Milieu (RIVM). De laboratoria toonden de Salmonella-bacterie in kippenvoer aan met behulp van de drie internationaal erkende analysemethoden (RVS, MKTTn en MSRV). Elk laboratorium kreeg een pakket toegestuurd met kippenvoer dat ofwel besmet was met Salmonella Senftenberg in twee verschillende concentraties, of geen Salmonella bevatte. De laboratoria dienden volgens een protocol te onderzoeken of de monsters Salmonella bevatten. Uit de studie blijkt dat het gebruik van meerdere analysemethodes zijn nut heeft, aangezien het aantal monsters waarin Salmonella is aangetroffen per methode significant verschilt.
Monsterbereiding
In eerdere studies zijn voedsel (gehakt) en dierlijke mest op het laboratorium van het EURL-Salmonella kunstmatig besmet met een verdunde cultuur van Salmonella. In deze studie is voor het eerst
kippenvoer kunstmatig besmet en is bewezen dat ook diervoeder geschikt is voor deze nieuwe werkwijze.
Kernwoorden: Salmonella, EURL, NRL, ringonderzoek, kippenvoer,
Synopsis
EU Interlaboratory comparison study animal feed III (2014)
Detection of Salmonella in chicken feed
In 2014, it was shown that 32 out of 34 National Reference Laboratories (NRLs) in the European Union were able to detect high and low levels of
Salmonella in chicken feed. Two laboratories made a reporting error, which
led to their performance being rated as ‘moderate’. Due to its consistently poor performance, one NRL was visited by the EURL-Salmonella (a central coordinating body) during a follow-up study. Some points of improvement were given, after which the NRL reached the level of good performance. The laboratories detected Salmonella in 97% to 100% of the contaminated samples. These are some of the conclusions of the third EU Interlaboratory Comparison Study of Animal Feed Samples, which was organised by the European Union Reference Laboratory for Salmonella (EURL-Salmonella).
Interlaboratory comparison study obligatory for EU Member States
The study was conducted in September 2014, with a follow-up study in February 2015. Participation was obligatory for all EU Member State NRLs that are responsible for the detection of Salmonella in animal feed samples. EURL-Salmonella is part of the Dutch National Institute for Public Health and the Environment (RIVM).
The laboratories used internationally accepted analysis methods (RVS, MKTTn and MSRV) to detect the presence of Salmonella in chicken feed. Each laboratory received a package of chicken feed contaminated with two different concentrations of Salmonella Senftenberg or containing no
Salmonella at all. The laboratories were required to analyse the samples for
the presence of Salmonella in accordance with the study protocol. This study underscores the benefits of using different analysis methods, as a significant difference was observed in the number of positive results between the methods.
Preparation of samples
In this study for the first time, animal feed samples were used that had been artificially contaminated with a diluted culture of Salmonella at the laboratory of the EURL-Salmonella. The results showed that this way of contaminating, which had been used and tested in earlier studies involving food matrices and products of the primary production stage, could also be used for animal feed.
Keywords: Salmonella, EURL, NRL, interlaboratory comparison study,
Contents
Summary — 9 1 Introduction — 11 2 Participants — 13
3 Materials and methods — 15
3.1 Chicken feed — 15
3.1.1 General — 15
3.1.2 Total bacterial count in chicken feed — 15
3.1.3 Number of Enterobacteriaceae in chicken feed — 15
3.2 Artificial contamination of chicken feed samples —16
3.2.1 Pre-tests for the preparation of contaminated chicken feed samples — 16 3.2.2 Determination of contamination level in chicken feed samples by MPN — 16
3.3 Design of the interlaboratory comparison study — 17
3.3.1 Chicken feed samples — 17
3.3.2 Shipment of parcels and temperature recording during shipment — 17
3.4 Methods — 18
3.5 Statistical analysis of the data — 19
3.6 Good performance — 19
4 Results — 21
4.1 Chicken feed, mixed meal for laying hens — 21
4.2 Artificial contamination of chicken feed samples — 21
4.2.1 Pre-tests for the preparation of chicken feed samples — 21
4.2.2 Contamination level of artificially contaminated chicken feed samples — 24
4.3 Technical data: interlaboratory comparison study — 24
4.3.1 General — 24 4.3.2 Accreditation/certification — 24 4.3.3 Transport of samples — 25 4.3.4 Media — 25 4.4 Control samples — 28 4.4.1 General — 28
4.4.2 Correct scores of the control samples — 30
4.5 Results of chicken feed samples artificially contaminated with Salmonella — 30 4.5.1 Results for each level of Salmonella and each laboratory — 30
4.5.2 Results for each selective enrichment medium, each level of contamination and each laboratory — 32
4.5.3 Specificity, sensitivity and accuracy rates of the artificially contaminated samples — 37 4.6 PCR (own method) — 38 4.7 Performance of the NRLs — 39 4.7.1 General — 39 4.7.2 Follow-up study — 40 5 Discussion — 43 6 Conclusions — 47
List of abbreviations — 49 References — 51
Annex 1 Number of positive results of the control samples at each laboratory, for each selective enrichment medium and each
isolation medium — 54
Annex 2 Number of positive results of the artificially contaminated chicken feed samples at each laboratory, for each selective
Summary
In September 2014, the European Union Reference Laboratory for
Salmonella (EURL-Salmonella) organised the third interlaboratory
comparison study on the detection of Salmonella in animal feed. The matrix of concern was mixed meal for laying hens.
The participants were 34 National Reference Laboratories for Salmonella (NRLs-Salmonella): 30 NRLs from the 28 EU Member States (EU-MS), 4 NRLs from third countries within Europe (EU candidate MS or potential EU candidate MS and members of the European Free Trade Associations
(EFTA)) and one NRL from a non-European country.
The main objective of the study was to test the performance of the
participating laboratories with respect to detecting Salmonella at different contamination levels in animal feed. For this purpose, chicken feed samples of 25 grams that had been artificially contaminated with Salmonella
Senftenberg (SSE) at various contamination levels were analysed. The performance of the laboratories was compared with criteria of good
performance. In addition, a comparison was made between the prescribed method (ISO 6579: Anonymous, 2002), using selective enrichment in Rappaport Vassiliadis Soya broth (RVS) and Mueller Kauffmann
Tetrathionate novobiocin broth (MKTTn), and the requested method (Annex D of ISO 6579: Anonymous, 2007), using selective enrichment on Modified Semi-solid Rappaport Vassiliadis (MSRV) agar.
The samples consisted of chicken feed artificially contaminated with a diluted culture of Salmonella Senftenberg (SSE) at a low level
(approximately 15-20 CFU/25 g of feed), at a high level (approximately 50-100 CFU/25 g of feed) and with no Salmonella at all (blank samples). The samples were artificially contaminated at the laboratory of the
EURL-Salmonella, which was a new procedure for an animal feed study. Before
the start of the study, several experiments were carried out to make sure that the samples were fit for use in an interlaboratory comparison study (e.g. choice of Salmonella serovar, stability at different storage
temperatures, influence of background flora).
Eighteen individually numbered blind samples of chicken feed had to be tested by the participants for the presence or absence of Salmonella. These samples consisted of six blank samples, six samples with a low level of SSE (inoculum 20 CFU/sample) and six samples with a high level of SSE
(inoculum 61 CFU/sample). Additionally, three control samples had to be tested: two blank control samples (procedure control (BPW) and matrix control sample (chicken feed)) and one own (NRL) positive control sample (with Salmonella).
The laboratories found Salmonella in almost all the (contaminated)
samples, resulting in a sensitivity rate of 97-100%. A comparison between the different media was made. Isolation on Xylose Lysine Deoxycholate agar (XLD) gave a significantly higher chance of finding Salmonella Senftenberg in chicken feed than did isolation on other isolation media (most often Brilliant Green Agar – BGA or Rambach). The difference was 3-7% and was independent of the selective enrichment medium used (RVS,
MKTTn or MSRV). There was a slightly higher chance of finding Salmonella after selective enrichment on MSRV compared with RVS and MKTTn, but this was not significant (difference only 1%). Longer incubation (two times 24 h) of MSRV gave 2-3% more positive results.
For the positive control, the majority of the participants (20 laboratories) used a diluted culture of Salmonella. The Salmonella serovars most
frequently used for the positive control sample were S. Enteritidis (15) and
S. Typhimurium (9). The concentration of the positive control varied from an
8 to 109 CFU/sample. For the positive control, it is advisable to use a
concentration close to the detection limit and to use a Salmonella serovar not often isolated from routine samples.
PCR was used as their own method by seven participants, five of which found the same results that were produced using the bacteriological culture method. Most of them used a Real-Time PCR. Two NRLs used a PCR method based on the presence of an InvA gene but, as this gene was absent in the strain used in this study, those PCR results were negative in contrast to the prescribed culture method (RVS, MKTTn and MSRV).
Thirty-two out of 34 laboratories achieved the level of good performance. One NRL reported a false positive result for a blank procedure control sample and another NRL reported a false negative result for their own positive control sample. Both laboratories showed correct results for the samples with animal feed contaminated with Salmonella. Those latter results, however, are not reliable when deviations are found in the positive or negative control samples at the same time. The results of these two laboratories were therefore indicated as ‘moderate performance’. One of them showed repeated moderate performance in food and animal feed studies. The EURL staff visited this NRL during a follow-up study organised in February 2015. The laboratory scored all samples correctly in this follow-up study and achieved a good performance. The EC, DG-Sanco, was
informed accordingly.
This study, in which animal feed samples artificially contaminated with a diluted culture of Salmonella were used for the first time at the laboratory of the EURL-Salmonella, was successful. It showed that this method of preparing interlaboratory comparison samples – used and tested in earlier studies with food matrices and products of the primary production stage (chicken faeces) – is also possible for relatively dry samples such as animal feed.
1
Introduction
An important task of the European Union Reference Laboratory for
Salmonella (EURL-Salmonella), as laid down in the Commission Regulation
EC No 882/2004 (EC, 2004), is the organization of interlaboratory comparison studies to test the performances of the National Reference Laboratories (NRLs) for Salmonella. The history of the interlaboratory comparison studies on the detection of Salmonella, as organized by
EURL-Salmonella (formerly called CRL-EURL-Salmonella) since 1995, is summarized on
the EURL-Salmonella website (EURL-Salmonella, 2015).
The objective of the current study, organised by the EURL for Salmonella in October 2014, was to see whether the participating laboratories could detect
Salmonella in chicken feed at different contamination levels. This information
is important in order to know whether the examination of samples in the EU Member States (MS) is being carried out uniformly and whether comparable results can be obtained by NRLs-Salmonella. Additionally, the different methods used for the detection of Salmonella in chicken feed were compared.
The prescribed method used to detect Salmonella in a feed matrix is ISO 6579 (Anonymous, 2002). Yet, because there have been good experiences with selective enrichment on Modified Semi-solid Rappaport-Vassiliadis (MSRV) for the detection of Salmonella spp. in animal faeces (Annex D of ISO 6579: Anonymous, 2007), as well as for the detection of
Salmonella in food and animal feed samples, participating laboratories were
also asked to use MSRV for testing the chicken feed.
The set-up of this study was comparable to the interlaboratory comparison studies organised in 2013 on the detection of Salmonella in minced chicken meat (Kuijpers et al. 2014) and in 2014 on the detection of Salmonella in chicken faeces (Kuijpers and Mooijman, 2015). For the current study, the (animal feed) samples were artificially contaminated with a diluted culture of Salmonella Senftenberg (SSE) at the laboratory of the EURL-
Salmonella.
Like in earlier studies, the contamination level of the low-level contaminated samples was close to the detection limit of the method used and the level of the high-level samples was approximately 5-10 times above the detection limit. In total, 18 chicken feed samples were tested, 6 samples per
contamination level (blank, low level and high level) containing one
Salmonella serovar (Salmonella Senftenberg). Additionally, three control
samples (two blank control samples and one positive control sample) were tested. The number and level of samples tested were in accordance with ISO/TS 22117 (Anonymous, 2010).
2
Participants
Country City Institute / NRL Salmonella
Austria Graz Austrian Agency for Health and Food Safety (AGES) Institute for Medical Microbiology and Hygiene
Belgium Brussels Veterinary and Agrochemical Research Centre (VAR)
Bulgaria Sophia National Diagnostic Research Veterinary Institute (NDRVMI), National Reference Centre of Food Safety
Croatia Zagreb Croatian Veterinary Institute, Lab for Food Microbiology
Cyprus Nicosia Ministry of Agriculture, Natural Resources and Environment Veterinary Services Laboratory for the Control of Foods of Animal Origin (LCFAO)
Czech Republic
Prague State Veterinary Institute
Denmark Ringsted Danish Veterinary and Food Administration, Microbiology Ringsted
Estonia Tartu Estonian Veterinary and Food Laboratory
Finland Helsinki Finnish Food Safety Authority Evira Research Department, Microbiology Unit
France Ploufragan Anses Laboratoire de Ploufragan -Plouzané, Unité Hygiène et Qualité des Produits Avicoles et Porcins (HQPAP)
Germany Berlin Federal Institute for Risk Assessment (BFR)
Greece Halkis Veterinary Laboratory of Chalkis, Hellenic Republic Ministry of Rural Development and Food
Hungary Budapest National Food Chain Safety Office, Food and Feed Safety Directorate
Iceland Reykjavik Matis ohf, Icelandic Food and Biotech R&D
Ireland Kildare Central Veterinary Research Laboratory CVRL/DAFM Backweston, Department of Agriculture, Food and Marine
Israel Kiryat Malachi
Southern Laboratory for Poultry Health, Laboratory Egg and Poultry
Italy Legnaro PD Istituto Zooprofilattico Sperimentale delle Venezie, OIE
Latvia Riga Institute of Food Safety, Animal Health and Environment, BIOR Animal Disease Diagnostic Laboratory
Lithuania Vilnius National Food and Veterinary Risk Assessment Institute, Food Microbiology section
Luxembourg Dudelange Laboratoire National de Santé, Département des Laboratoires officiels d'analyses de contrôle
Malta Valletta Public Health Laboratory (PHL) Microbiology Evans Building
Country City Institute / NRL Salmonella Netherlands,
the
Bilthoven National Institute for Public Health and the Environment (RIVM/CIb) Infectious Disease Control, Centre for Zoonoses and Environmental Microbiology (cZ&O)
Netherlands, the
Wageningen Netherlands Food and Consumer Product Safety Authority (nVWA) Consumer and Safety Division, Microbiology
Norway Oslo Norwegian Veterinary Institute, Section of Bacteriology
Poland Pulawy National Veterinary Research Institute (NVRI) Department of Hygiene of Animal Feeding Stuffs
Portugal Lisbon Instituto National de Investigação Agrária e Veterinária Unidade de Tecnologia e Segurança Alimentar (INIAV)
Romania Bucharest Hygiene and Veterinary Public Health Institute (IISPV)
Serbia Belgrade Institute of Veterinary Medicine of Serbia Department of Nutrition and Feed Safety
Slovak Republic
Bratislava State Veterinary and Food Institute
Slovenia Ljubljana National Veterinary Institute, Veterinary Faculty (UL)
Spain Madrid, Algete
Laboratorio Central de Veterinaria
Sweden Uppsala National Veterinary Institute (SVA), Department of Bacteriology
United Kingdom
Addlestone Animal and Plant Health Agency (APHA), Department
of Bacteriology
United Kingdom
Belfast Agri-Food and Bioscience Institute (AFBINI)
3
Materials and methods
3.1 Chicken feed 3.1.1 General
The matrix in this interlaboratory comparison study was chicken feed: mixed meal for laying hens (free-range). The chicken feed was obtained from the retail sector and was produced by De Heus Voeders, Ede in the Netherlands. For the pre-test, two different chicken feed meals were tested: chicken breeding meal (flour No2) and mixed meal for laying hens,
both obtained from Kasper Faunafood, Woerden, the Netherlands. For the
interlaboratory comparison study, a batch of 25 kg of mixed meal for laying hens (De Heus Voeders) was obtained. This latter batch arrived at the EURL-Salmonella on 25 August 2014.
Immediately after receipt of the chicken feed, 5 samples (for the pre-test) or 10 samples (for the interlaboratory comparison study) of 25 g each were checked for the absence of Salmonella in accordance with ISO 6579
(Anonymous, 2002) and Annex D of ISO 6579 (Anonymous, 2007). For this purpose, the 25-gram samples were each added to 225 ml of Buffered Peptone Water (BPW). After pre-enrichment at 37 (± 1)°C for 16 to 18 hours, selective enrichment was carried out in Rappaport-Vassiliadis Soya broth (RVS), Mueller Kaufmann Tetrathionate novobiocin broth (MKTTn) and on Modified Semi-solid Rappaport-Vassiliadis (MSRV) agar. Next, the MKTTn and RVS tubes and the suspect growth on MSRV plates were plated-out on Brilliance Salmonella agar (BSA) and confirmed biochemically.
After checking the absence of Salmonella, the chicken feed was repacked in portions of 25 g in Whirl-pak plastic bags and stored (see 3.3.1).
3.1.2 Total bacterial count in chicken feed
The total number of aerobic bacteria in the chicken feed was investigated by following ISO 4833 (Anonymous, 2003a). A 20-gram portion of the chicken feed was homogenized in 180 ml of peptone saline solution in a plastic bag. The content was mixed by using a stomacher (for 60 sec). Next, tenfold dilutions were prepared in peptone saline solution. Two times 1 ml of each dilution were placed in two empty Petri dishes (diameter 9 cm). To each dish, 15 ml of molten Plate Count Agar (PCA) was added. After the PCA was solidified, an additional 5 ml of PCA was added to the agar. The plates were incubated at (30 ± 1) °Cfor (72 ± 3) hours and the total number of aerobic bacteria was counted after incubation.
3.1.3 Number of Enterobacteriaceae in chicken feed
In addition to the total number of aerobic bacteria, the Enterobacteriaceae count was determined by following ISO 21528-2 (Anonymous, 2004). A 20-gram portion of the chicken feed was homogenized in 180 ml of peptone saline solution in a plastic bag. The contents were mixed using a stomacher (for 60 sec). Next, tenfold dilutions were prepared in peptone saline solution. Two times 1 ml of each dilution were placed in two empty Petri dishes (diameter 9 cm). To each dish, 10 ml of molten Violet Red Bile Glucose agar (VRBG) was added. After the VRBG was solidified, an
additional 15 ml of VRBG was added to the agar. These plates were incubated at (37 ± 1) °Cfor (24 ± 2) hours and the number of typical
violet-red colonies were counted after incubation. Five typical colonies were tested for the fermentation of glucose and for a negative oxidase reaction. After this confirmation, the number of Enterobacteriaceae was calculated.
3.2 Artificial contamination of chicken feed samples
3.2.1 Pre-tests for the preparation of contaminated chicken feed samples
The chicken feed samples were artificially contaminated at the laboratory of the EURL-Salmonella with a diluted culture of Salmonella. Some experiments were performed prior to the start of the interlaboratory comparison study, especially in relation to the stability of Salmonella in the artificially
contaminated chicken feed samples when stored at different temperatures. For the contamination, two different Salmonella serovars were tested:
Salmonella Typhimurium (STM) ATCC 14028 and Salmonella Senftenberg
(SSE), isolated from cacao in 2008. The ATTC strain was obtained from the American Type Culture Collection (ATCC, Manassas, USA).
Each strain was inoculated in Buffered Peptone Water (BPW) and incubated at (37 ± 1) °C overnight. Next, each culture was diluted in peptone saline solution to be able to inoculate the chicken feed samples with
approximately 5-10 CFU/sample and 50-100 CFU/sample. For the enumeration of the contamination level (CFU/ml), 0.1 ml of the diluted culture was spread over an XLD plate and incubated at 37 °Cfor 20-24 hours.
Samples of 25 g of chicken feed were artificially contaminated with a dilution of a Salmonella culture (different levels of STM or SSE). Some control
samples were also prepared without the addition of Salmonella (blank chicken feed samples). All chicken feed samples were stored at -20 °C, 5 °C and 10 °C for a period of 0, 7, 14, 21 and 35 days. After each storage time at the different temperatures, the artificially contaminated SSE, STM and blank chicken feed samples were tested for the presence of Salmonella following Annex D of ISO 6579 (Anonymous, 2007), with selective
enrichment on Modified Semi-solid Rappaport-Vassiliadis (MSRV) and, for some samples, also following ISO 6579 (Anonymous, 2002) with selective enrichment in Rappaport Vassiliadis Soya broth (RVS) and/or Mueller Kauffmann Tetrathionate novobiocin Broth (MKTTn).
To obtain an indication of the amount of the background flora in the samples after storage at different temperatures, the blank chicken feed samples (without the addition of Salmonella) were tested for the number of aerobic bacteria and Enterobacteriaceae (see 3.1.2 and 3.1.3).
3.2.2 Determination of contamination level in chicken feed samples by MPN
The level of contamination in the final chicken feed samples, as used at the time of the study, was determined by using a five-tube, most probable number (MPN) technique. For this purpose, tenfold dilutions of five chicken feed samples of each contamination level were tested representing 25 g, 2.5 g and 0.25 g of the original sample. The presence of Salmonella was determined in each dilution by following Annex D of ISO 6579 (Anonymous, 2007) and ISO 6579 (Anonymous, 2002). From the number of confirmed positive dilutions, the MPN of Salmonella in the original sample was calculated by using an MPN software program in Excel, freely available on the Internet (Jarvis et al., 2010).
3.3 Design of the interlaboratory comparison study 3.3.1 Chicken feed samples
Approximately two weeks before the study, a total of 810 chicken feed samples were prepared. For this purpose, the following steps were performed:
• labelling of each plastic bag;
• adding 25 g of chicken feed to each plastic bag;
• adding approximately 0.1 ml of a diluted culture of S. Senftenberg (SSE) to the chicken feed sample. The contamination levels aimed at were 15–20 CFU/25 of chicken feed, 50–100 CFU/25 g of chicken feed and blank;
• storage of samples at 5 °C until transport to the NRLs on 29 September 2014.
On 29 September 2014 (one week before the study), the chicken feed samples were prepared for shipment (see 3.3.2) and sent to the participants by door-to-door courier service. After arrival at the
laboratories, the chicken feed samples had to be stored at 5 °Cuntil the start of the study.
Further details about the shipping and handling of the samples and the reporting of the test results can be found in the protocol (EURL-Salmonella, 2014a), in the Standard Operation Procedure (SOP, EURL-Salmonella, 2014b) and in a print-out from the web-based test report
(EURL-Salmonella, 2014c).
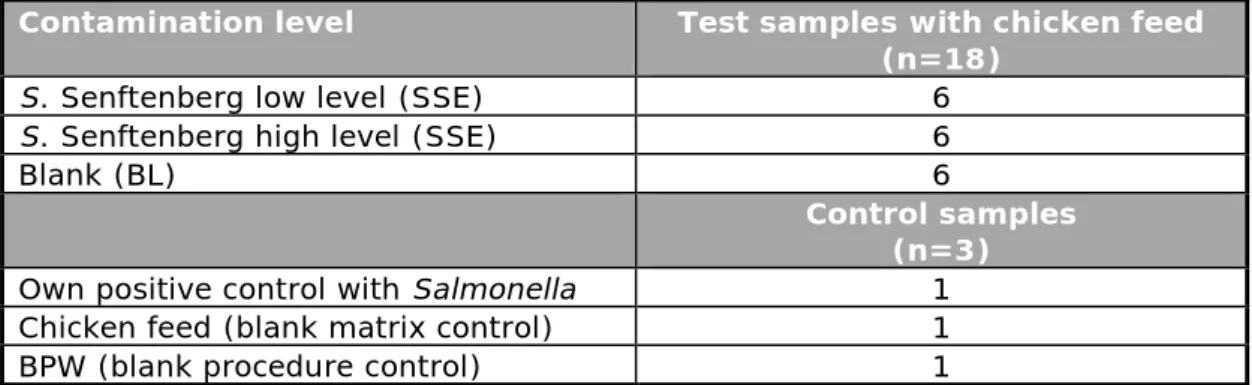
Eighteen chicken feed samples (numbered B1–B18) and three control samples (numbered C1-C3) had to be tested by each participant. Table 1 gives an overview of the number and type of samples to be tested by the participants.
For the control samples, the laboratories were asked to use their own positive Salmonella control, which they normally use when analysing routine samples for the detection of Salmonella. In addition to this, controls of the BPW and of the matrix had to be analysed (both blank controls).
Table 1. Overview of the number and type of samples tested per laboratory in the interlaboratory comparison study
3.3.2 Shipment of parcels and temperature recording during shipment
To each NRL, 21 plastic bags were sent containing the chicken feed samples artificially contaminated with Salmonella, blank chicken feed samples or no chicken feed at all (controls). The 21 bags were packed in
Contamination level Test samples with chicken feed (n=18)
S. Senftenberg low level (SSE) 6
S. Senftenberg high level (SSE) 6
Blank (BL) 6
Control samples (n=3)
Own positive control with Salmonella 1
Chicken feed (blank matrix control) 1
one plastic safety bag. The safety bag was placed in one large shipping box, together with three frozen (-20 °C) cooling devices. Each shipping box was sent to the participants as ‘biological substances category B (UN3373)’ using a door-to-door courier service. To monitor exposure to abusive temperatures during shipment and storage, micro temperature loggers were used to record the temperature during transport. These loggers are tiny units sealed in a stainless steel case that is 16 mm in diameter and 6 mm deep. Each shipping box contained one logger packed in one of the safety bags. The loggers were programmed by the EURL-Salmonella to measure the temperature every hour. Each NRL had to return the temperature recorder to the EURL-Salmonella on the day the laboratory started the study. At the EURL-Salmonella, the loggers were read using a special computer program and all recorded temperatures from the start of the shipment until the start of the study were transferred to an Excel sheet.
3.4 Methods
The NRLs could follow the procedures for as they are normally used in daily routine analyses (e.g. pre-warming of BPW, different ways of mixing the samples in BPW). For the pre-treatment of the chicken feed samples, reference was made to ISO 6887-4 (Anonymous, 2003c). According to this ISO, the chicken feed diluted in BPW needs to stand for 20 to 30 minutes at 18 °C to 27 °C before mixing. This was described in more detail in the SOP of this study (EURL-Salmonella, 2014b).
The prescribed method of this interlaboratory comparison study for detection of Salmonella in the chicken feed samples was ISO 6579
(Anonymous, 2002) and the requested (additional) method was Annex D of ISO 6579 (Anonymous, 2007). In addition, the NRLs could use their own method, such as a Polymerase Chain Reaction (PCR) procedure.
The prescribed (and requested) method in summary:
Pre-enrichment in:
• Buffered Peptone Water (BPW)
Selective enrichment in/on:
• Rappaport Vassiliadis Soya broth (RVS);
• Mueller Kaufmann Tetrathionate novobiocin broth (MKTTn); • Modified Semi-solid Rappaport-Vassiliadis medium (MSRV)
(requested);
Plating-out on the following isolation media:
• Xylose Lysine Desoxycholate agar (XLD);
Confirmation:
• Confirmation by means of appropriate biochemical tests (ISO 6579, Anonymous, 2002) or by reliable, commercially available
identification kits and/or serological tests.
3.5 Statistical analysis of the data
The specificity, sensitivity and accuracy rates were calculated for the artificially contaminated chicken feed samples. For the control samples, only the accuracy rates were calculated. The rates were calculated according to the following formulae:
Specificity rate: x 100%
Sensitivity rate: x 100%
Accuracy rate: x 100%
Mixed effect logistic regression (Gelman and Hill, 2007) was used for modelling the binary outcomes as a function of a fixed effect part, consisting of the level of contamination (CFU), enrichment media and isolation media, and a random effect part, consisting of the different
laboratories. Mutual differences between media and contamination level are shown as odds ratios (OR) stratified by medium. The odds of detecting
Salmonella is calculated by dividing the probability of detecting Salmonella
by the probability of not detecting it. An odds ratio is the ratio of the odds of detecting Salmonella in one group to the odds of detecting it in another group and can be interpreted as an effect size. Groups are, for instance, two different media.
A Bayesian approach was adopted to prevent spurious odds ratios, i.e. zero or infinite odds ratios. This was done by putting a uniform prior on the probability of detecting Salmonella. As a result, the eventual odds and odds ratios will be ‘shrunken’ towards one and values equal to zero or infinity are made impossible.
Results were analysed using the statistical software R (R Development Core Team, 2014).
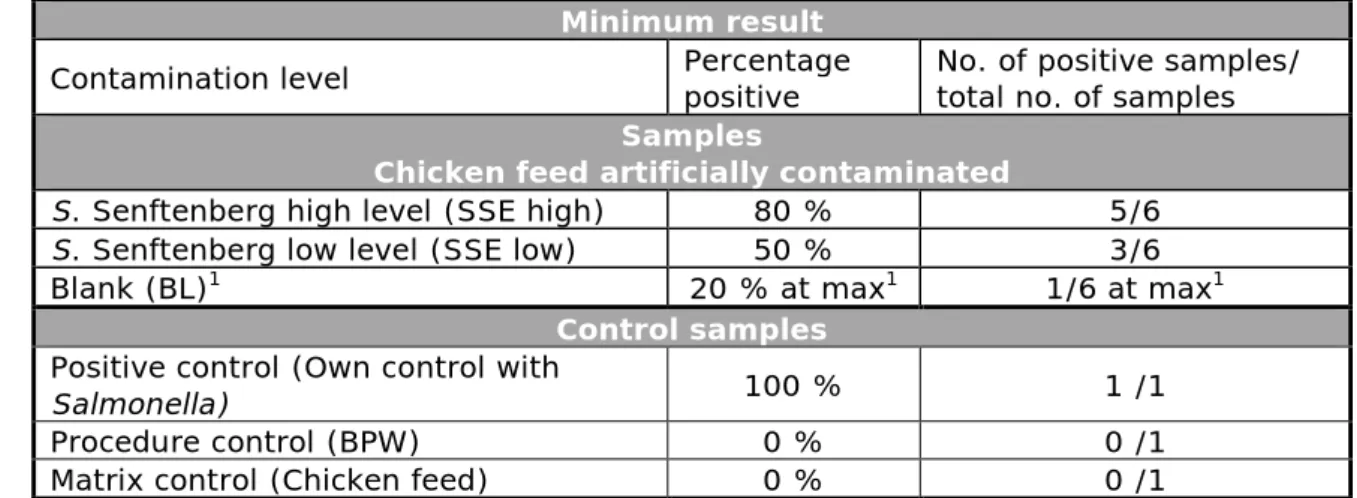
3.6 Good performance
For the determination of good performance, the criteria indicated in Table 2 were used. For the determination of ‘good performance’ per laboratory, the results found with all combinations of the prescribed and requested
selective enrichment media and isolation media used by the laboratory were taken into account. For example, if a laboratory found 5/6 low-level contaminated samples positive with RVS/XLD, but no positives with any other selective enrichment medium or isolation medium, this was still
samples negative (expected) of number Total results negative of Number samples positive (expected) of number Total results positive of Number negative) and (positive samples of number Total negative) and (positive results correct of Number
considered as a good result. The opposite was used for the blank samples. Here also, all combinations of media used per laboratory were taken into account. If, for example, a laboratory found 2/6 blank samples positive with MKTTn/BGA but no positives with the other media, this was still considered a ‘no-good’ result.
The results will therefore be presented for selective enrichment in RVS, MKTTn or on MSRV in combination with the isolation medium (XLD or non-XLD) that gave the highest number of Salmonella isolations (e.g. RVS/x).
Table 2. Criteria for testing good performance in the Animal feed III study (2014)
Minimum result
Contamination level Percentage positive No. of positive samples/ total no. of samples
Samples
Chicken feed artificially contaminated
S. Senftenberg high level (SSE high) 80 % 5/6
S. Senftenberg low level (SSE low) 50 % 3/6
Blank (BL)1 20 % at max1 1/6 at max1
Control samples
Positive control (Own control with
Salmonella) 100 % 1 /1
Procedure control (BPW) 0 % 0 /1
Matrix control (Chicken feed) 0 % 0 /1
1.All should be negative. However, as no 100% guarantee of the Salmonella negativity of the matrix can be given, 1 positive out of 6 blank samples (20% pos.) is considered acceptable.
4
Results
4.1 Chicken feed, mixed meal for laying hens
All batches of chicken feed tested negative for Salmonella.
For the interlaboratory comparison study, the artificially contaminated chicken feed samples were sent to the NRLs-Salmonella on Monday, 29 September 2014. After receiving them, the NRLs had to store the samples at 5 °C.
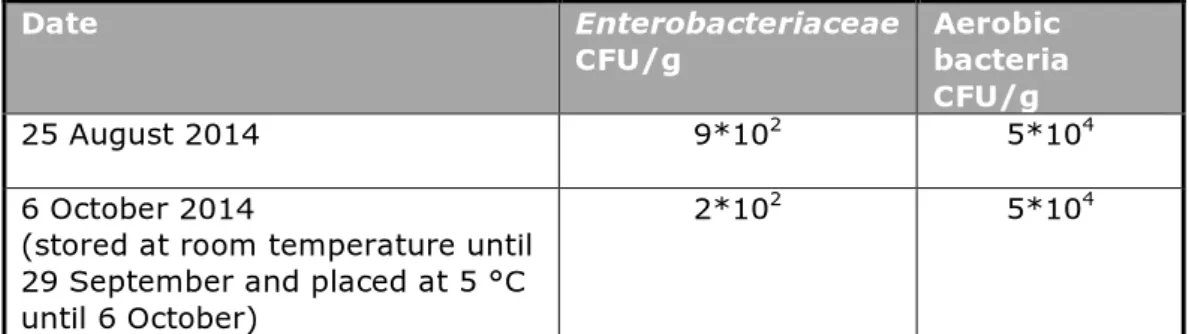
The number of aerobic bacteria and the number of Enterobacteriaceae were tested twice at the laboratory of the EURL-Salmonella; first on the day the chicken feed arrived at the EURL (27/09/2014) and, a second time, after storage at 5 °C for one week (6/10/2014). Table 3 summarizes the results, showing that the amount of background flora remained stable during storage of a few weeks.
Table 3. Number of aerobic bacteria and number of Enterobacteriaceae per gram of chicken feed
Date Enterobacteriaceae
CFU/g Aerobic bacteria CFU/g
25 August 2014 9*102 5*104
6 October 2014
(stored at room temperature until 29 September and placed at 5 °C until 6 October)
2*102 5*104
4.2 Artificial contamination of chicken feed samples 4.2.1 Pre-tests for the preparation of chicken feed samples
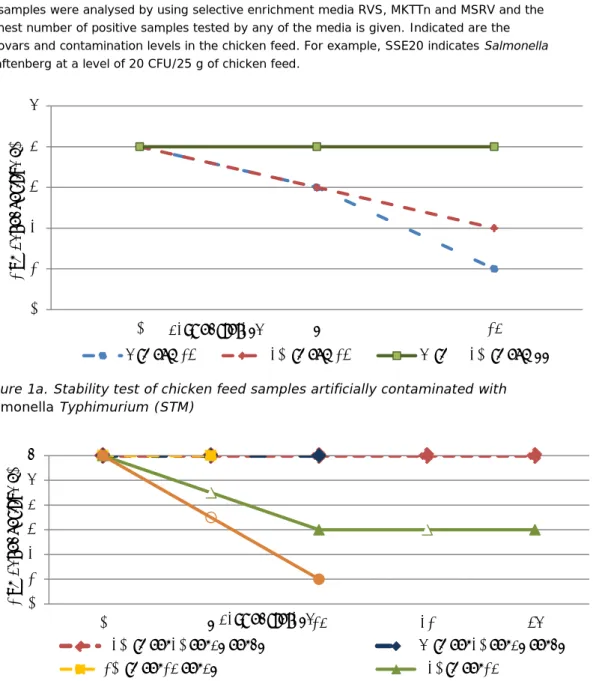
Three sets of experiments were performed. For each set of experiments, the stability of Salmonella in the chicken feed samples was tested during storage of the samples at different temperatures for up to five weeks. During each set of experiments, different variables were tested in different combinations (see Section 3.1.1). Table 4 and Figure 1a and 1b show the results of all tested samples.
Table 4. Stability tests of chicken feed artificially contaminated with Salmonella Typhimurium (STM) and S. Senftenberg (SSE)
Days of storage Storage at -20 ºC Storage at +5 ºC Storage at +10 ºC STM13 STM77 SSE14 SSE20
SSE67 SSE47 STM13 STM77 SSE14 SSE20 SSE67 SSE47 SSE14 SSE47
number of positive samples/number of tested samples
0 4/4 4/4 6/6 6/6 6/6 4/4 4/4 6/6 6/6 6/6 6/6
7 3/4 4/4 6/6 3/4 4/4 6/6 6/6
14 2/4 4/4 3/6 6/6 6/6 1/4 4/4 1/6 6/6
35 3/6 6/6
All samples were analysed by using selective enrichment media RVS, MKTTn and MSRV and the highest number of positive samples tested by any of the media is given. Indicated are the serovars and contamination levels in the chicken feed. For example, SSE20 indicates Salmonella Senftenberg at a level of 20 CFU/25 g of chicken feed.
Figure 1a. Stability test of chicken feed samples artificially contaminated with Salmonella Typhimurium (STM)
Figure 1b. Stability test of chicken feed samples artificially contaminated with Salmonella Senftenberg (SSE)
0 1 2 3 4 5 0 7 14 N umb er o f p os iti ve n =4 days of storage 5 °C STM13 -20 °C STM13 5 °C & -20 °C STM77 0 1 2 3 4 5 6 0 7 14 21 35 N umb er o f p os iti ve n =6 days of storage
- 20 °C SSE20 SSE47 SSE67 5 °C SSE20 SSE47 SSE67
The major findings are summarized below:
Samples artificially contaminated with low levels of Salmonella
Typhimurium (chicken breeding meal (flour No2) contaminated with STM 13 CFU) and Salmonella Senftenberg (mixed meal for laying hens
contaminated with SSE 14 CFU) showed a decrease in the number of
Salmonella positive samples after storage at –20 ºC and 5 ºC for 1-2 weeks.
• The number of positive samples was reduced by approx. 50 % after 1 week of storage at 5 ºC.
• Only one sample from both serotypes (STM and SSE) tested positive after storage at -20 ºC for 2 weeks.
• During the different experiments, the number of Enterobacteriaceae in the chicken breeding meal was < 10 CFU/g, while the mixed meal
for laying hens gave 104 CFU/g.
• The background flora in the chicken breeding meal was not stable at a storage temperature of 5 ºC and -20 ºC. The number of aerobic bacteria showed a decrease at both storage temperatures, from 104 CFU/g to
• 102 CFU/g within 1 week.
All subsequent experiments were performed with mixed meal for laying
hens contaminated with S. Senftenberg (SSE). To mimic abuse
temperatures during transport, the samples were additionally stored at 10 ºC.
• Samples artificially contaminated with Salmonella Senftenberg at a level of 20 CFU or higher were shown to be stable in chicken feed samples during storage at 10 ºC or lower for at least 1-2 weeks. The background flora in the samples of mixed meal for laying hens was stable during storage at 5 ⁰C and –20 ⁰C, but increased during storage at 10 ⁰C.
• Storage for one week at 10 ⁰C showed an increase of approximately one log10 CFU/g in the number of Enterobacteriacea, as well as in
the total number of aerobic bacteria.
• The number of aerobic bacteria (initially 105 CFU/g) and
Enterobacteriaceae (initially 104 CFU/g) in the mixed meal for laying
hens remained the same after storage at -20 ºC and 5 ºC, even
after 5 weeks.
From the results of the experiments, a decision was taken to use the following samples for the interlaboratory comparison study:
• For each participant, 18 x 25 g of chicken feed (ISO/TS 22117; Anonymous, 2010);
• Each sample individually inoculated with a diluted culture of Salmonella:
- low-level SSE: 15-20 CFU/25 g of chicken feed - high-level SSE: 50-100 CFU/25 g of chicken feed - blank: 0 CFU/25 g of chicken feed
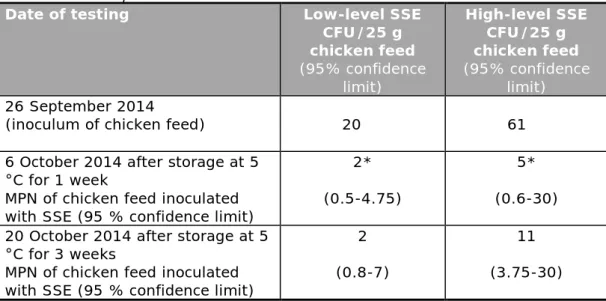
Table 5. Number of Salmonella Senftenberg (SSE) in the inoculum and in the chicken feed samples
Date of testing Low-level SSE CFU/25 g chicken feed (95% confidence limit) High-level SSE CFU/25 g chicken feed (95% confidence limit) 26 September 2014
(inoculum of chicken feed) 20 61
6 October 2014 after storage at 5 °C for 1 week
MPN of chicken feed inoculated with SSE (95 % confidence limit)
2* (0.5-4.75)
5* (0.6-30) 20 October 2014 after storage at 5
°C for 3 weeks
MPN of chicken feed inoculated with SSE (95 % confidence limit)
2 (0.8-7)
11 (3.75-30) *In the MPN of 6 October, one dilution (1/100) was missing, so the MPN is at least the calculated number
4.2.2 Contamination level of the artificially contaminated chicken feed samples
Table 5 shows the contamination levels of the low-level and high-level contaminated chicken feed samples. The inoculum level of the diluted SSE culture (tested on XLD), as well as the contamination level of the chicken feed samples after the inoculation with the diluted culture, were tested. The latter was tested using a five-tube MPN test (see Section 3.1.2). The number of positive chicken feed samples tested on 20 October for 25 g, 2.5 g and 0.25 g were, respectively, for the low-level SSE 5/5, 0/5 and 0/5 and for high-level SSE 5/5, 3/5 and 1/5. The calculated MPN/25 g of chicken feed is given in Table 5.
4.3 Technical data: interlaboratory comparison study 4.3.1 General
Thirty-four NRLs for Salmonella participated in this study: 30 NRLs from 28 EU-Member States (MS) and 4 NRLs from non-EU MS. The non-EU MS consisted of EU candidate MS or potential EU candidate MS, members of the European Free Trade Association (EFTA) and a non-European country. All laboratories performed the study on the planned date (week 41, starting on 5 or 6 October 2015).
4.3.2 Accreditation/certification
Thirty-two laboratories are accredited for their quality system according to ISO/IEC 17025 (Anonymous, 2005) and two EU-MS laboratories (12 and 25) are still in the process of accreditation. Twenty-nine laboratories are accredited for ISO 6579 (detection of Salmonella in food and animal feeding stuffs), 24 of them are also accredited for Annex D of ISO 6579. Three laboratories (4, 20 and 26) are accredited only for the detection of
Salmonella in animal faeces and veterinary samples by using MSRV (Annex
4.3.3 Transport of samples
Twenty-one participants received the samples within one day after
dispatch, six participants within two days and five participants after three days of transport due to a strike at the airport. For two parcels (non-EU-MS), it was not possible to arrange door-to-door transport. The parcels for laboratories 13 and 20 were retained by the customs and arrived only after 4 and 6 days of transport, respectively, at the participating laboratory The NRLs returned the temperature recorders to the EURL-Salmonella at the time they started the study, as requested. One temperature logger was lost and did not arrive at the EURL-Salmonella (lab code 8). For the
majority of the parcels, the temperature did not exceed 5 °C during
transport, with the exception of laboratories 4, 20 and 31. The temperature in the parcels of these laboratories increased to a maximum of 16 °C for 2 to 3 days. During storage at the NRL, the temperature was generally between 0 °C and 5 °C. At eight laboratories (lab codes 1, 11, 13, 15, 17, 19, 29 and 33), the samples were stored between 5 °C and 10 °C.
4.3.4 Media
Each laboratory was asked to test the samples using the prescribed method (ISO 6579; Anonymous, 2002) and the requested method (Annex D of ISO 6579; Anonymous, 2007). All laboratories except one used the selective enrichment media RVS, MKTTn and MSRV in combination with XLD and a second plating-out medium of their own choice. Laboratory 18 (EU-MS) did use the prescribed selective enrichment media RVS and MKTTn, but did not use the requested medium MSRV.
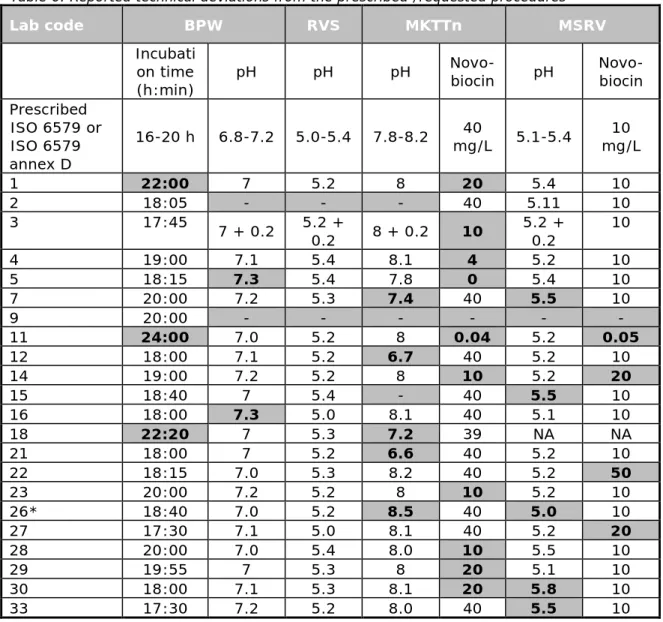
Table 6 provides information on the reported pH, the concentration of Novobiocin, the incubation time and temperature that deviated from the prescribed method. The table lists only the reported deviations from the method.
Three laboratories (1, 11 and 18) reported a longer incubation time for the pre-enrichment in BPW. Two laboratories (5 and 16) reported a pH of 7.3 instead of the prescribed maximum pH of 7.2 for BPW.
Five laboratories (7, 12, 18, 21 and 26) used MKTTn at a pH that deviated from the prescribed pH of 7.8-8.2. Ten laboratories used MKTTn with a lower concentration of novobiocin than the prescribed 0.04 g/L and laboratory 5 used MKTTn without the addition of Novobiocin.
Three laboratories (14, 23 and 27) used MSRV with a higher concentration of novobiocin than the prescribed 0.01 g/L and laboratory 11 used a lower concentration of novobiocin. Five laboratories (7, 15, 26, 30 and 33) reported a deviating pH for MSRV.
Table 6. Reported technical deviations from the prescribed /requested procedures Lab code BPW RVS MKTTn MSRV Incubati on time (h:min) pH pH pH
Novo-biocin pH Novo-biocin Prescribed ISO 6579 or ISO 6579 annex D 16-20 h 6.8-7.2 5.0-5.4 7.8-8.2 mg/L 5.1-5.4 40 mg/L 10 1 22:00 7 5.2 8 20 5.4 10 2 18:05 - - - 40 5.11 10 3 17:45 7 + 0.2 5.2 + 0.2 8 + 0.2 10 5.2 + 0.2 10 4 19:00 7.1 5.4 8.1 4 5.2 10 5 18:15 7.3 5.4 7.8 0 5.4 10 7 20:00 7.2 5.3 7.4 40 5.5 10 9 20:00 - - - - - - 11 24:00 7.0 5.2 8 0.04 5.2 0.05 12 18:00 7.1 5.2 6.7 40 5.2 10 14 19:00 7.2 5.2 8 10 5.2 20 15 18:40 7 5.4 - 40 5.5 10 16 18:00 7.3 5.0 8.1 40 5.1 10 18 22:20 7 5.3 7.2 39 NA NA 21 18:00 7 5.2 6.6 40 5.2 10 22 18:15 7.0 5.3 8.2 40 5.2 50 23 20:00 7.2 5.2 8 10 5.2 10 26* 18:40 7.0 5.2 8.5 40 5.0 10 27 17:30 7.1 5.0 8.1 40 5.2 20 28 20:00 7.0 5.4 8.0 10 5.5 10 29 19:55 7 5.3 8 20 5.1 10 30 18:00 7.1 5.3 8.1 20 5.8 10 33 17:30 7.2 5.2 8.0 40 5.5 10
Bold numbers/ grey cells =Deviating from ISO 6579 and/or from ISO 6579 Annex D
- =No information
NA =Not applicable
* BPW incubation at 35.3 °C instead of at the prescribed 36-38 °C
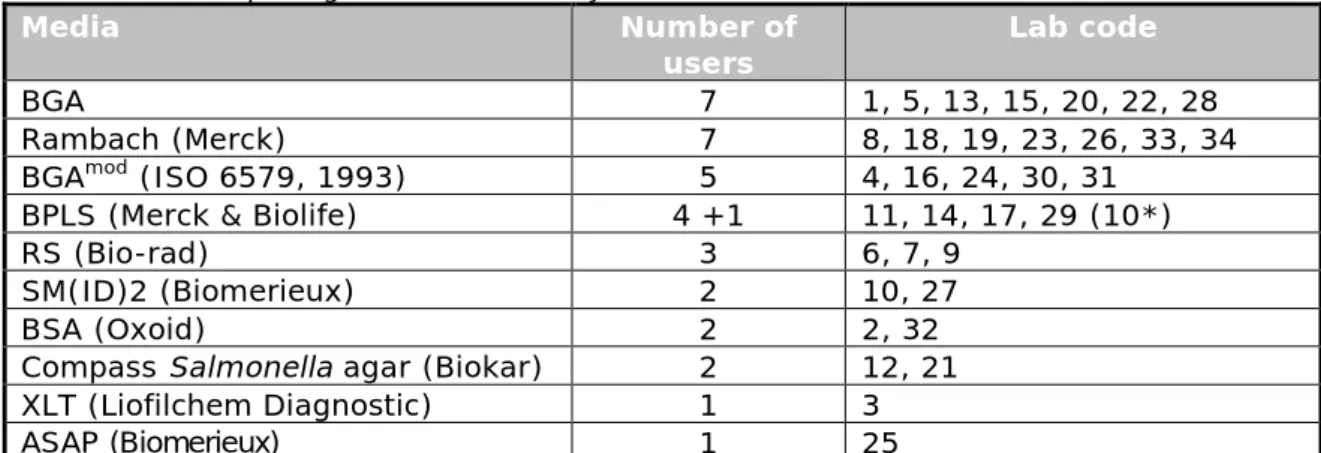
A second plating-out medium of choice was obligatory. Table 7 shows the second isolation media used by the participants. Most laboratories used BGA (Anonymous, 1993) or a Chromogenic medium (e.g. Rambach) as a second plating-out medium.
Table 7. Second plating-out media used by the NRLs
Media Number of
users Lab code
BGA 7 1, 5, 13, 15, 20, 22, 28
Rambach (Merck) 7 8, 18, 19, 23, 26, 33, 34
BGAmod (ISO 6579, 1993) 5 4, 16, 24, 30, 31
BPLS (Merck & Biolife) 4 +1 11, 14, 17, 29 (10*)
RS (Bio-rad) 3 6, 7, 9
SM(ID)2 (Biomerieux) 2 10, 27
BSA (Oxoid) 2 2, 32
Compass Salmonella agar (Biokar) 2 12, 21
XLT (Liofilchem Diagnostic) 1 3
ASAP (Biomerieux) 1 25
Explanations of the abbreviations used are given in the ‘List of abbreviations’. *Laboratory 10 used a third plating-out medium
Table 8. Biochemical and other confirmation tests of Salmonella used by the NRLs
Lab code TSI UA LDC Gal VP Indole Kit Other
1, 11, 28, 29 + + + - - + 2 + + + - - + oxidase 3, 23 + + + + + + PCR 4, 16, 30 - - - 5 + - + - - - 6, 31 + + + + + + 7, 25 - - - API 2 E 8, 9 + - + - - - 10 - - - Lysine Iron Agar 12 + - - - API 2 E 13 + + + + + + API 2 E 14 - - - MICROBACT PCR 15 + + + - - - 17 + - - - Microgen GnA- ID system 18 + + - - - - API 2 E 19 + + + + - + semi-solid glucose agar 20 - - - + PCR 21 - - - rapid ID32E 22 - - - VITEK2 24 + + + + - + 26 - - - 27 - - - + BBL PCR 32 + + + + + + PCR 33 - - - Enterotest 24 MALDI-TOF 34 + + + + - + MALDI-TOF
The use of an extra non-selective plating agar between the ‘isolation’ and ‘confirmation’ steps was optional. A total of 26 laboratories performed this extra step (e.g. by using Nutrient agar; Anonymous, 2002).
All participating laboratories performed one or several confirmation tests for
Salmonella, see Tables 8 and 9. Three laboratories (16, 26 and 30)
performed serological tests only and five laboratories (1, 2, 9, 29 and 32) performed only a biochemical test. Two laboratories (33 and 34) used the MALDI-TOF test and seven (3, 13, 14, 20, 23, 27 and 32) used a PCR method for confirmation.
Table 9. Serological confirmation tests of Salmonella used by the NRLs
Lab code Serological
O
antigens antigens H antigens Vi Other
1, 2, 4, 9, 10, 29, 32 - - - 3, 5, 6, 11, 14, 15, 16, 18, 19, 21, 22, 23, 26, 28, 31, 33 + + - 7 + - + 8, 13, 20, 24, 25, 30, 34 + - - 17 + + + 27 - - + 10 omnivalent 12 Salmonella O Anti-serum
Poly A-I & Vi - = Not done / not mentioned.
4.4 Control samples 4.4.1 General
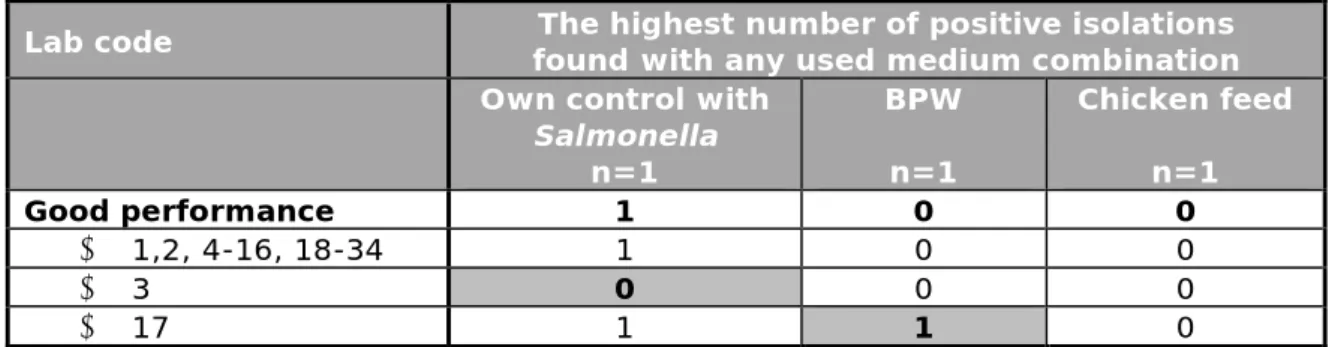
Table 10 gives the results of all control samples. The results given in the table are the highest number of positive isolations found with all
combinations of selective enrichment media and isolation media per laboratory. Annex 1 gives more details on the results for each selective enrichment medium (RVS, MKTTn and MSRV) in combination with the isolation media used per laboratory.
Thirty-two laboratories scored all three control samples correctly with at least one of the used media.
Table 10. Total number of positive results from the control samples per laboratory
Lab code found with any used medium combination The highest number of positive isolations Own control with
Salmonella n=1 BPW n=1 Chicken feed n=1 Good performance 1 0 0 • 1,2, 4-16, 18-34 1 0 0 • 3 0 0 0 • 17 1 1 0
Bold number = deviating result.
Positive control with Salmonella
Thirty-three laboratories scored good results with their own Salmonella positive control sample and detected Salmonella with all used media. Laboratory 3 could not detect Salmonella in all the used media. For the positive control samples, the majority of the participants used a diluted culture of Salmonella (20 laboratories). Others used a lenticule disc (8), a freeze-dried ampoule (2), kwik-stik (2) or a culti-loop (2) with
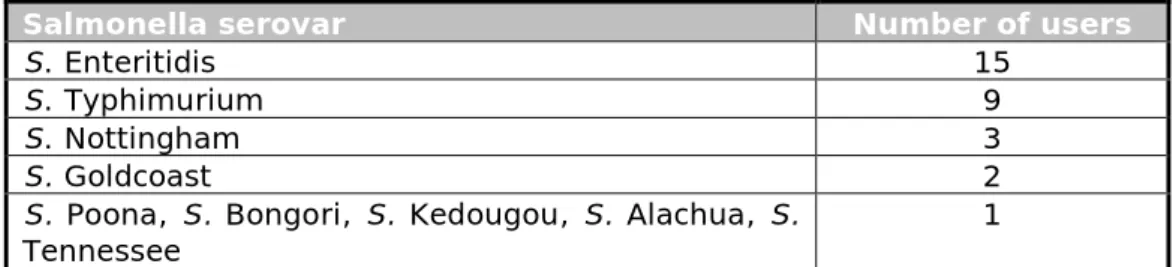
Salmonella. Table 11 shows the Salmonella serovars used for the positive
control samples. Most often, Salmonella Enteritidis (15) and Salmonella Typhimurium (9) were used. The concentration of Salmonella in the positive control samples used by the different participants varied between 8 and 109 CFU/sample.
Table 11. Salmonella serovars used by the participants for the positive control samples
Salmonella serovar Number of users
S. Enteritidis 15
S. Typhimurium 9
S. Nottingham 3
S. Goldcoast 2
S. Poona, S. Bongori, S. Kedougou, S. Alachua, S.
Tennessee 1
Procedure control Blank (only BPW)
Thirty-three laboratories correctly analysed the one procedure control sample (no matrix, only BPW) correctly as negative for Salmonella. Laboratory 17 reported this sample as positive for Salmonella with all selective enrichment media.
Matrix control Blank (chicken feed)
All laboratories correctly analysed the one chicken feed control sample (25 g of matrix) as negative for Salmonella.
The results were compared with the definition of ‘good performance’ (see Section 3.6). The Laboratories 3 and 17 did not fulfil these criteria for the control samples.
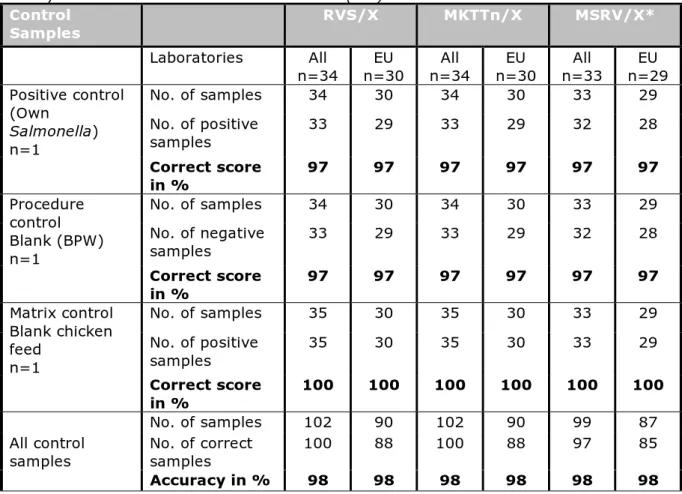
Table 12. Correct scores found with the control samples by all laboratories (‘All’) and by the laboratories of the EU member states (‘EU’)
Control Samples RVS/X MKTTn/X MSRV/X* Laboratories All n=34 n=30 EU n=34 All n=30 EU n=33 All n=29 EU Positive control (Own Salmonella) n=1 No. of samples 34 30 34 30 33 29 No. of positive samples 33 29 33 29 32 28 Correct score in % 97 97 97 97 97 97 Procedure control Blank (BPW) n=1 No. of samples 34 30 34 30 33 29 No. of negative samples 33 29 33 29 32 28 Correct score in % 97 97 97 97 97 97 Matrix control Blank chicken feed n=1 No. of samples 35 30 35 30 33 29 No. of positive samples 35 30 35 30 33 29 Correct score in % 100 100 100 100 100 100 All control samples No. of samples 102 90 102 90 99 87 No. of correct samples 100 88 100 88 97 85 Accuracy in % 98 98 98 98 98 98
X = isolation medium with the highest number of positives *Result without Laboratory 18 (EU-MS): they did not use MSRV
4.4.2 Correct scores of the control samples
Table 12 shows the correct scores found with the control samples for the different selective enrichment media (RVS, MKTTn and MSRV) in
combination with the isolation medium that gave the highest number of positives. The calculations were performed on the results of all participants and on the results of only the EU-MS. Only minor differences were found between these groups.
The laboratories scored a good result for the control samples, with accuracy rates of 98%.
4.5 Results of chicken feed samples artificially contaminated with
Salmonella
4.5.1 Results for each level of Salmonella and each laboratory General
Table 13 shows the results of the chicken feed samples artificially
contaminated with Salmonella Senftenberg. The results given in this table are the highest number of positive isolations found with the different selective enrichment media (RVS, MKTTn and MSRV) in combination with ‘the best’ isolation medium. Annex 2 gives more details on the results for each selective enrichment medium (RVS, MKTTn and MSRV) in combination
with the used isolation media per laboratory. Not all media combinations gave the same results.
Blank samples
Thirty-two laboratories correctly scored all six blank chicken feed samples as negative for Salmonella with all used media. Two laboratories (2 and 30) found one blank sample of the six positive for Salmonella with the selective enrichment medium RVS, while identifying the same sample correctly as negative with the other selective enrichment media (MKTTn and MSRV) inoculated from the same BPW.
All blanks should test as negative. However, because no 100% guarantee for the Salmonella negative status of the chicken feed could be given, one positive out of six blank samples (80% negative) is still considered to be acceptable.
High-level contaminated Salmonella Senftenberg samples
All laboratories detected Salmonella in all six samples that contained
Salmonella Senftenberg at an inoculum level of approximately 61 CFU/25 g
of chicken feed with at least one of the used selective enrichment media. Laboratory 24 could not detect Salmonella in one of the six samples with a high-level of contamination using the selective enrichment medium MKTTn, though they found the same sample to be positive using the other selective enrichment media (RVS and MSRV) inoculated from the same BPW.
Table 13. Number of positive results found with the artificially contaminated chicken feed samples (25g) at each laboratory
Lab code
The highest number of positive isolations found with selective enrichment medium (RVS, MKTTn or
MSRV) in combination with ‘the best’ isolation medium
Blank
n=6 SSE Low n=6 SSE High n=6 Good performance ≤1 ≥3 ≥5 1, 3, 5-6, 8–13, 15–29, 31-32, 34 0 6 6 2 1 6 6 4 0 4 6 7 0 5 6 14 0 5 6 30 1 6 6 33 0 5 6
Bold number = deviating result.
Grey cell = result below level of good performance.
Low-level contaminated Salmonella Senftenberg samples
Thirty laboratories detected Salmonella in all six samples that contained
Salmonella Senftenberg at an inoculum level of approximately 20 CFU/25 g
of chicken feed using all the selective enrichment media in combination with at least one of the used isolation media. Three laboratories (lab codes 7, 14 and 33) could not detect Salmonella in one out of six samples with a
low-level of contamination. Laboratory 4 could not detect Salmonella in two out of six samples with a low-level of contamination with any of the used media (RVS, MKTTn and MSRV).
The results of the artificially contaminated chicken feed samples were compared with the definition of ‘good performance’ (see Section 3.6) and all laboratories fulfilled these criteria.
4.5.2 Results for each selective enrichment medium, each level of contamination and each laboratory
Figures 2 and 3 show the number of positive isolations for each level of artificially contaminated chicken feed sample and for each laboratory after pre-enrichment in BPW and selective enrichment in RVS, MKTTn and on MSRV, followed by isolation on selective plating agar (XLD and other). Furthermore, all possible combinations of media that produced the highest number of positive results (x) are given. The selective enrichment medium and/or isolation medium that gave the highest number of positives varied per laboratory.
The results found with the artificially contaminated chicken feed samples were compared with the agreed definition of ‘good performance’ (see Section 3.6). In Figures 2 and 3, the border of good performance is indicated by a black horizontal line.
Table 14 presents the percentages of samples testing positive for
Salmonella after 24 hours of incubation in RVS, MKTTn and on MSRV and
after an additional 24 hours of incubation on MSRV. The majority of the laboratories used BGA (modified) or Rambach as the second plating-out medium (see Table 7).
When MKTTn was used for selective enrichment, XLD produced 7% more positive results than other plating-out media; for RVS and MSRV this was 3-4%.
An extra incubation time of 24 hours for MSRV produced 3-5% more positive results.
-
= border of good performanceFigure 2. Results per laboratory found with the chicken feed samples artificially contaminated with a low-level of SSE (n=6) after selective enrichment in RVS, MKTTn and on MSRV, followed by isolation on the ‘best’ selective plating agarand all possible combinations of media producing the highest number of positive results (x).
-
= border of good performanceFigure 3. Results per laboratory found with the chicken feed samples artificially contaminated with a high-level of SSE(n=6) after selective enrichment in RVS, MKTTn and on MSRV, followed by isolation on the ‘best’ selective plating agar and all possible combinations of media producing the highest number of positive results (x).
Table 14. Mean percentages of positive results for the detection of Salmonella in the artificially contaminated chicken feed samples after selective enrichment in RVS, MKTTn and on MSRV incubated for 24 hours, and for a total of 48 hours on MSRV, followed by isolation on different plating out media
Plating out medium Selective enrichment medium RVS
24h MKTTn 24h 24 / 48 hMSRV
Contamination level SSE Low High Low High Low High
XLD 97% 99% 96% 99% 94/97% 96/100%
Other isolation media
(most often BGA or Rambach) 93% 96% 89% 92% 88/93% 91/96%
Difference XLD/other 4% 3% 7% 7% 6/4% 5/4%
Tables 15 and 16 show the differences between selective enrichment media and isolation media for each contamination level as odds ratios (OR). In addition, the 95% confidence intervals and p-values are given. In Table 15, the odds of finding a positive isolation using the different plating-out media are compared, given a selective enrichment medium. For instance, the odds of finding Salmonella in the low-level contaminated SSE samples after selective enrichment in MKTTn is a factor of 3.69 higher when XLD is used as the isolation medium, compared with an isolation medium other than XLD. In general, if RVS is used as selective enrichment medium, the Odds Ratios (ORs) are smaller than the ORs for MKTTn and MSRV. In other words, when MKTTn or MSRV is used for selective enrichment, it is easier to detect Salmonella if XLD is used compared to other isolation media. The use of XLD produces significantly higher scores for RVS, MKTTn and MSRV. Only for the high-level
contaminated samples with selective enrichment in RVS was the higher score using XLD not significant compared with isolation medium other than XLD.
Table 15. Number of positive isolations found with XLD compared with the number of positive isolations found with other isolation media, given a selective enrichment medium.
Samples: chicken feed, artificially contaminated with Salmonella Senftenberg
Selective enrichment medium
Compared
isolation media CFU odds ratios 95% lower 95% upper p-value*
RVS XLD compared with media
other than XLD
Low 2.89 1.1 8.05 0.03
High 2.67 0.76 10.66 0.12
Low & High 2.78 1.25 6.48 0.01
MKTTn XLD compared with media other than XLD
Low 3.69 1.58 8.99 0
High 9.38 2.72 44.93 0
Low & High 5.88 2.74 14.37 0
MSRV XLD compared with media
other than XLD
Low 2.89 1.03 8.51 0.04
High 17.28 2.08 446.11 0
Low & High 7.07 2.14 37.1 0
All selective enrichment media XLD compared with media other than XLD Low 3.14 1.79 5.54 0 High 7.51 2.9 25.69 0
The interpretation of Table 16 is similar to that of Table 15, except that selective enrichment media are compared with each other, with XLD as the isolation medium. For instance, the odds of finding Salmonella in low-level contaminated SSE samples after selective enrichment in RVS is a factor of 1.39 higher than when MKTTn is used. When RVS or MKTTn is used as the selective enrichment medium, compared with MSRV, the odds become smaller (a factor of 0.37). In general, if MSRV is used as the selective enrichment medium, the chance of finding Salmonella is higher than when MKTTn or RVS is used. However, these differences are not significant.
Table 16. Number of positive isolations found using a selective enrichment medium compared with the number of positive isolations found when using another selective enrichment medium, given that the isolation is on XLD. Samples: chicken feed artificially contaminated with Salmonella Senftenberg
Compared selective enrichment media
Isolation
medium CFU Odds Ratios lower 95% upper 95% p-value*
RVS compared
with MKTTn XLD
Low 1.39 0.48 4.22 0.55
High 0.69 0.12 3.56 0.68
Low & High 0.98 0.35 2.57 0.99
RVS compared
with MSRV XLD
Low 0.85 0.26 2.81 0.78
High 0.16 0.01 1.61 0.13
Low & High 0.37 0.06 1.35 0.15
MKTTn compared
with MSRV XLD
Low 0.62 0.19 1.88 0.39
High 0.23 0.01 2.64 0.27
Low & High 0.37 0.06 1.43 0.17
* Significant difference in case p < 0.05.
Figure 4 shows the performance of each laboratory as odds ratios compared with the mean of all laboratories for the artificially
contaminated samples. In this calculation, the blank samples are not used. The mean (OR = 1) is defined as the odds of detecting Salmonella based on the fixed effects only (SSE low or high, enrichment medium and isolation medium). Laboratories below the mean (OR < 1) have a lower probability of detecting Salmonella. The laboratories 4, 7, 14, 15, 16, 20, 25, 29, 30 and 33 scored a significantly lower probability of detecting
Salmonella, but still scored within the lines of good performance. Yet
these laboratories still may have a sensitivity problem with one of their media. For example, the laboratories 4, 7, 14 and 33 (marked yellow in Figure 4) scored one or two low-level contaminated samples as negative when using all selective-enrichment media. The laboratories 15, 16, 25, 29 and 30 (marked pink in Figure 4) scored 5 to 23 fewer positive results with their second isolation medium (other than XLD). Laboratory 20 (marked red in Figure 4) found 4 more positive samples with their second isolation medium (BGA), compared with XLD for both selective
enrichment media RVS and MKTTn, while with MSRV they scored all samples correctly, regardless of the isolation medium used.
Figure 4 shows the highest scores for eighteen laboratories (1, 3, 5, 8, 9, 10, 12, 13, 17, 19, 21, 23, 26, 27, 28, 31, 32 and 34). They scored all artificially contaminated samples correctly for all used media.
Figure 4 Performance of each laboratory compared with the mean of all laboratories for the artificially contaminated chicken feed samples (without blanks)
4.5.3 Specificity, sensitivity and accuracy rates of the artificially contaminated samples
Table 17 shows the specificity, sensitivity and accuracy rates for all levels of artificially contaminated chicken feed samples. This table gives the results for the different selective enrichment media (RVS, MKTTn and MSRV) and isolation on selective plating agar showing the highest number of positives (x). The calculations were performed on the results of all participants and on the results of the participants of the EU-MS only. Only minor differences were found between these groups. The rates were comparable for the different selective enrichment media: specificity rates 99-100%, sensitivity rates 97-100% and accuracy rates of 99%.