Functional analysis of glb-3 in the neurons of
Caenorhabditis elegans
Bram Ulrichts
Student number: 01409909
Promotor: Prof. Dr. Bart Braeckman Supervisor: Tim Loier
A dissertation submitted to Ghent University in partial fulfilment of the requirements for the degree of International Master of Science in Agro- and Environmental Nematology.
Copyright disclaimer
The author and promotor give the permission to use this dissertation for consultation and to copy parts of it for personal use. Every other use is subject to the copyright laws. More specifically, the source must be extensively specified when using results from this dissertation.
Ghent, 10 June 2020.
The promotor, The author,
Preamble regarding the corona measures taken in the academic
year 2019-2020
As a consequence of the 2019-2020 SARS-CoV-2 outbreak, the dissertation research could not be carried out as initially projected. Here, the adaptations required for the completion of the dissertation during the corona measures are outlined.
Description of the dissertation research as initially projected: Comprehensive behavioural pheno-typing of the glb-3-deficient Caenorhabditis elegans hermaphrodite through (i) behavioural assays and (ii) automated phenotyping.
Description of the projected steps that could not be followed: (i) The behavioural assays were cut short at 3 experiments, performed over a 5-6 week period. Extrapolating these numbers to a full semester, indicates that another 3-4 experiments could have been conducted if uninterrupted. (ii) The automated phenotyping was not commenced.
Description of the reorientation of the dissertation research: The student and the promotor agreed upon an alternative assignment. The alternative assignment consisted of the exploration of existing RNA-Seq data, aiming to (i) investigate neuronal gene expression of the GLoBin-related genes and (ii) reinforce the experimental findings.
This preamble has been prepared in consultation with the student and the promotor and approved by both.
Ghent, 10 June 2020.
The promotor, The student,
Table of Contents
Abstract 1
1 Introduction 1
2 Materials and Methods 5
2.1 In vivo research . . . . 5
2.1.1 Maintenance and preparation . . . 5
2.1.2 Pharyngeal pumping rate assay . . . 7
2.1.3 Swimming activity assay . . . 8
2.1.4 Chemotaxis assay . . . 8
2.1.5 Statistical data analysis . . . 9
2.2 In silico research . . . 10
2.2.1 RNA-Seq data pipeline . . . 10
2.2.2 Globin clustermap analysis . . . 12
2.2.3 Pathway enrichment analysis . . . 12
3 Results 15 3.1 In vivo research . . . 15
3.1.1 Pharyngeal pumping rate assay . . . 15
3.1.2 Swimming activity assay . . . 16
3.1.3 Chemotaxis assay . . . 17
3.2 In silico research . . . 19
3.2.1 RNA-Seq data pipeline validation . . . 19
3.2.2 Globin clustermap analysis . . . 21
3.2.3 Pathway enrichment analysis . . . 22
4 Discussion 25 4.1 In vivo research . . . 25 4.2 In silico research . . . 26 5 Conclusion 27 Acknowledgements 29 Abbreviations 31 Glossary 33 Bibliography 35 Appendix A 37 Appendix B 47
1 INTRODUCTION
Abstract
The roundworm Caenorhabditis elegans expresses an exceptionally high number of globins, proposed to play a role in oxygen transport and redox-based signal transduction. This dissertation research has focused on the functional analysis of neuronal glb-3, a particular member of the C. elegans globin family, by (i) examining the effects of a mutation in the glb-3 gene on the behavioural phenotype of adult hermaphrodites and (ii) placing neuronal glb-3 expression in a broader context within the C. elegans globin family. By conducting several behavioural assays, significant changes in pharyngeal pumping rate, swimming activity and diacetyl chemotaxis were revealed. Additionally, the exploration of existing RNA-Seq data was able to reinforce these experimental findings to a certain degree.
1
Introduction
Caenorhabditis elegans is a small and ubiquitous free-living nematode1. Newly hatched larvae are 0.25 millimeters in length, while adult specimens are about 1 millimeter long. C. elegans populations naturally occur in soil and tend to aggregate around decomposing plant matter, where they feed on bacteria (Corsi et al., 2015). Since the 1960s, a vigorous scientific community has - driven by the apparent simplicity of the nematode’s nervous system - propelled C. elegans to an excellent and well-established model organism for neurobiological research (Corsi et al., 2015). Various features, including a rapid life cycle, self-fertilization, transparency and an invariant cell lineage have contributed to its omnipresence in the fields of developmental biology and neurobiology (Brenner, 1974; Sulston and Horvitz, 1977; Sulston et al., 1983; Chalfie et al., 1994).
Moreover, the relatively simple nervous system of C. elegans has been thoroughly described by White et al. (1986) and, for the adult hermaphrodite, consists of 302 neurons, connected through ap-proximately 6400 synapses, 900 gap junctions and 1500 neuromuscular junctions. In contrast with hermaphrodites, C. elegans males have an additional set of neurons, bringing the total number of neu-rons to 383. The majority of these male-specific neuneu-rons are present in the tail region, where they are involved in the complex mating behaviour (Jarrell et al., 2012).
Incidentally, C. elegans is a soil nematode and thus, is adapted to life in a fluctuating low-oxygen environment. As nematodes lack both specialized respiratory systems and complex circulatory organs, they must rely on respiratory adjustments at the molecular level, which might explain the exceptionally high number of globins - a superfamily of haem-containing globular proteins - encoded in the C. elegans genome (Tilleman et al., 2011). Recently, the exponential growth of genomic data has fostered the discovery of a bewildering globin diversity across all kingdoms of life. Well-known vertebrate globins such as the α- and β-haemoglobin subunits and the myoglobins are only the tip of the iceberg; globins, as a protein superfamily, are much more widespread than initially presumed (Vinogradov et al., 2006).
As a matter of fact, 34 globin genes are present in the C. elegans genome, coding for a total of 55 globin protein isoforms (WormBase, 2020a,b). The C. elegans globins are grouped under the ”GLoBin-related” moniker (abbreviated as ”GLB” for globin proteins and as ”glb” for globin protein-encoding genes) (WormBase, 2020a) and some of them (e.g. GLB-1, GLB-5, GLB-6, GLB-12, GLB-26, ...) have already been partially characterized (Tilleman et al., 2011; De Henau et al., 2015). Depend-ing on the haem coordination state, these globins are proposed to play a role in, for pentacoordinated globins, the transport of diatomic ligands (e.g. O2, CO, NO and CN−) or, for hexacoordinated globins, electron transfer and redox-based signal transduction (Milani et al., 2005; Kiger et al., 2011; De Henau et al., 2015).
GLB-3, the subject of this dissertation, is a member of the GLoBin-related family of proteins and is encoded by the glb-3 gene. The glb-3 gene is located on chromosome V and spans 6214 nucleotides
1 INTRODUCTION
from position 11134596 to position 11140810 on the positive (+) strand. Depending on transcript splic-ing, two different mRNA constructs are predicted to be formed. Thus, the name GLB-3 actually refers to two separate protein isoforms, i.e. GLB-3 isoform A and GLB-3 isoform B (WormBase, 2020c). GLB-3 isoform B (282 amino acid residues) represents the full protein covering all 6 exons including an N-terminal myristoylation site, a masked mitochondrial targeting signal and a palmitoylation site. The presence of both a myristoylation and palmitoylation site suggests targeting to the plasma membrane. GLB-3 isoform A (210 amino acid residues) lacks the two first N-terminal exons and part of the third exon, and thus the myristoylation site is absent in this isoform. However, in this alternatively spliced form, the mitochondrial targeting sequence is located at the N-terminal end of the protein, making it highly probable that GLB-3 isoform A is a mitochondrial protein linked to the membrane by palmitoyla-tion (unpublished).
Aside from the genomic information available on WormBase, a recent study by Taylor et al. (2019) has provided a deeper insight into the expression profile of GLB-3 across the entire nervous system of
C. elegans. The ”C. elegans Neuronal Gene Expression Network” or ”CeNGEN” for short, as the project
is named, has generated a comprehensive neuronal gene expression catalog through single-cell RNA sequencing of multiple partially overlapping subgroups of neurons. The study itself has not yet been published, but it is already available as a preprint on bioRxiv2and the neuronal gene expression catalog can readily be interrogated via the SCeNGEA web application3(Hammarlund et al., 2018; Taylor et al., 2019).
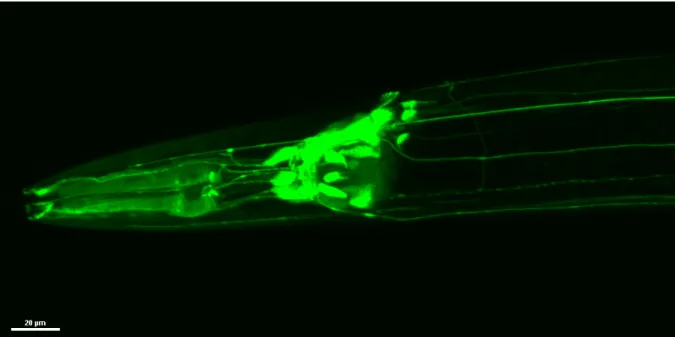
More recently, research at the Braeckman Lab has examined the localization of glb-3 within adult hermaphrodite worms, showing that glb-3 is expressed in the gonadal sheath tissue, as well as in the cephalic and pharyngeal neurons (see Figure 1). Additionally, a clear phenotype has been established for glb-3 mutants: sterility. Therefore, it is likely that gonadal glb-3 plays an important role in fertility. The role of neuronal glb-3, on the other hand, remains opaque.
Building upon this previous work, this dissertation starts from the hypothesis that mutations in the
glb-3 gene will alter the normal functioning of the nervous system. Particularly, that glb-3 mutants will
exhibit aberrant locomotory behaviour and will perceive their environment in a different way, when com-pared with wild type specimens.
To investigate this matter, the dissertation research has been divided into two separate components: (i) The in vivo component will encompass traditional behavioural assays, aiming to elucidate differences in behavioural phenotype between glb-3 mutants and wild type specimens. (ii) The in silico component will explore the CeNGEN project’s original RNA-Seq data with a twofold purpose. On the one hand, neuronal glb-3 expression will be placed in a broader context within the GLoBin-related protein family, while on the other hand, in vivo experimental findings may be reinforced by bringing distinctive metabolic pathways to light.
2https://www.biorxiv.org/content/10.1101/737577v2 3https://cengen.shinyapps.io/SCeNGEA/
1 INTRODUCTION
Figure 1: Neuronal glb-3 expression. Confocal fluorescence microscopy image showing the expression of neuronal glb-3 in
2 MATERIALS AND METHODS
2
Materials and Methods
2.1
In vivo research
Since its inception as a model organism for neurobiological research, many behaviour-based screen-ing methods have been developed for C. elegans, rangscreen-ing from classical behavioural assays to auto-mated high-content phenotyping. The common thread in all these methods, is that they try to assess the state of the nervous system through investigation of the worm’s behavioural phenotype (Hart, 2006).
Here, the optimal behavioural assays were decided based on which neurons show the highest glb-3 expression levels. For C. elegans, a lot of neuronal gene expression information is available through the CeNGEN project. This data is publicly available on the CeNGEN website4and can be interrogated at the SCeNGEA web application5(Hammarlund et al., 2018; Taylor et al., 2019).
At the SCeNGEA web application, querying glb-3 against the “Neurons only” dataset resulted in a violin plot, showing glb-3 expression levels in a number of neurons. For approximately the top 30
glb-3-expressing neurons, an associated functional role was retrieved via the WormAtlas Individual
Neu-rons Section6.
A compilation of glb-3-expressing neurons, together with their functional annotation is presented in Table 1. Based on the greatest common divisor of this compilation, a selection of behavioural assays was made. In this case, a pharyngeal pumping rate assay, a swimming activity assay and a diacetyl chemotaxis assay were selected.
2.1.1 Maintenance and preparation
Two C. elegans strains were used in this study: the Caenorhabditis elegans N2 strain (further re-ferred to as ”the wild type strain”) and the Caenorhabditis elegans VC2879 strain7(further referred to as ”the mutant strain”). The VC2879 strain is a glb-3 mutant in which heterozygous mutants exhibit GFP fluorescence in the pharyngeal region, while homozygous mutants do not exhibit GFP fluorescence. Specimens from the VC2879 strain with two balancer chromosomes, and thus having two intact copies of the glb-3 gene, are inviable.
For culture maintenance in the lab, both strains were reared on nutrient agar (NA) plates seeded with
Escherichia coli K12 and incubated at 16 °C, while for experimental purposes, both strains were kept
on nematode growth medium (NGM) plates seeded with Escherichia coli OP50, stored at 20 °C prior to the initiation of the experiment and at room temperature during the experiment (E. coli OP50 is uracil auxotroph, thus providing a thinner bacterial lawn compared to E. coli K12). To be more specific, after cultivating worms on K12 NA plates, worm populations were synchronized by bleaching and L1-stage juveniles were plated out on OP50 NGM plates and incubated at 20 °C.
Regarding the general experimental design: all experiments were performed with day 2 adults and all experiments were repeated on three days consecutively, to obtain three biological replicates.
4http://www.cengen.org/
5https://cengen.shinyapps.io/SCeNGEA/
6https://www.wormatlas.org/neurons/Individual%20Neurons/Neuronframeset.html 7https://cgc.umn.edu/strain/VC2879
2.1 In vivo research 2 MATERIALS AND METHODS
Table 1: Compilation of glb-3-expressing neurons with their functional annotation. Neurons and functional annotations
were retrieved from the SCeNGEA web application and the WormAtlas Individual Neurons Section, respectively. Neurons are ordered by glb-3 expression, from high (top) to lower (bottom).
Neuron Functional annotation
I2, I3, I4, I5 pharyngeal pumping
PVD mechanosensation (harsh), thermosensation
MC pharyngeal pumping rate (”pacemakers”)
DVB defecation
ALM, PLM, PVM mechanosensation (gentle + harsh), tap response habituation (= memory)
M2 pharynx (redundant)
SMB locomotion, search behaviour
BAG O2-sensing, CO2-avoidance
RIM locomotion (reversals)
ASEL NaCl chemotaxis (osmotic stress), CO2sensing
AVL defecation
AIM swimming, male mate searching
AVE backward locomotion
ASI locomotion, search behaviour, chemotaxis, thermosensation, pheromone sensing
MI pharynx (redundant)
RMH \
ASJ electrosensation, photosensation, dauer stage
IL2 dauer dispersal
AVF \
AVG \
AIB locomotion, search behaviour, starvation response
VD, DD locomotion (sinusoidal movement)
ADF NaCl chemotaxis (osmotic stress), O2sensing, dauer stage
K12 NA plates
A 15 ml liquid lysogeny broth (LB) culture of E. coli K12 was prepared in advance, by seeding E. coli K12 in liquid LB medium (8 g LB in 400 mL distilled water, autoclaved) and incubating overnight (ranging from 8 to 18 hours) at 37 °C, prior to storing the bacterial culture at 4 °C.
Nutrient agar (NA) medium was prepared by adding 11 g nutrient agar, 5 g agar N°1 and 200 µL 1 % cholesterol to 390 mL distilled water. The mixture was autoclaved and, after cooling down to 60 °C, 10 mL of 1 M K-phosphate buffer pH 6 was added.
Standard petri plates (9 cm diameter) were filled with NA medium and allowed to solidify. After solidification, 500 µL liquid LB culture was used to seed the plates with E. coli K12 as a food source for the worm population. The plates were allowed to incubate overnight at 37 °C, before storage at 4 °C.
2 MATERIALS AND METHODS 2.1 In vivo research
OP50 NGM plates
A 50 ml liquid lysogeny broth (LB) culture of E. coli OP50 was prepared in advance, by seeding
E. coli OP50 in liquid LB medium (8 g LB in 400 mL distilled water, autoclaved) and incubating overnight
(ranging from 8 to 18 hours) at 37 °C, prior to storing the bacterial culture at 4 °C.
Nematode growth medium (NGM) was prepared by adding 10 g agar N°1, 1 g soy peptone, 1.2 g sodium chloride and 200 µL 1% cholesterol to 390 mL distilled water. The mixture was autoclaved and, after cooling down to 60 °C, 400 µL 1 M CaCl2, 400 µL 1 M MgSO4 and 10 mL of 1 M K-phosphate buffer pH 6 were added.
Standard petri plates (9 cm diameter) were filled with NGM medium and allowed to solidify. After solidification, 500 µL liquid LB culture was used to seed the plates with E. coli OP50 as a food source for the worm population. The plates were stored at room temperature.
Worm synchronization
A chlorox mixture was prepared in advance by adding 2 mL bleach and 0.5 mL 10 M sodium hydroxide to 8 mL distilled water.
S-buffer was used to rinse worm populations off a K12 NA plate into a 15 mL tube. After the worms had settled by gravity in the tube, a Pasteur pipette was used to remove the supernatant. Subsequently, additional S-buffer was added to wash the worms and the supernatant was removed again after the worms had settled (optionally, 15 mL tubes can be centrifuged for 1 minute at 600 rpm, to speed up the settling process).
The entire chlorox mixture (10.5 mL) was added to the pellet in the 15 mL tube, aiming to dissolve all tissues, except for the eggs. Immediately after adding the chlorox mixture, the tube was shaken vigorously for 4 minutes and 30 seconds.
Subsequently, the washing procedure consisted of centrifugating the tube containing the chlorox mixture for 1 minute at 5000 rpm, followed by removing the supernatant and adding fresh S-buffer. The washing procedure was repeated three times.
Next, the remaining supernatant was removed and about 1 mL S-buffer was added to the tube. The tube was stirred and its contents were transferred to a small tissue culture bottle. The tube was washed a second time with another 1 mL S-buffer and the tube was stirred again and its contents were added to the tissue culture bottle as well.
To let the worms hatch, the tissue culture bottle was put at 20 °C overnight. On the next day, the L1-stage juveniles were plated out on nematode growth medium (NGM) plates seeded with E. coli OP50 and incubated at 20 °C.
2.1.2 Pharyngeal pumping rate assay
The pharyngeal pumping rate was measured in accordance with Raizen et al. (2012). Three condi-tions were investigated: wild type, heterozygous glb-3 mutant and homozygous glb-3 mutant. For each condition, 10 worms were individually isolated on a tissue culture dish (i.e. one worm per dish). Tissue culture dishes were prepared in advance and similarly as the OP50 NGM plates mentioned above, they were filled with 4 mL NGM and a 15 µL droplet of liquid OP50 culture was added after solidification. Worms were allowed to recover for 60 minutes after they were transferred to the tissue culture dishes.
The pharyngeal pumping rate was estimated by counting grinder movements under a fluorescence stereo microscope (Olympus SZX12 stereo microscope with Olympus U-LH100HG fluorescence light source) at a magnification of 60-70X. Due to temporal variability in pharyngeal pumping rate (Hobson et al., 2006), the grinder movements were counted in blocks of 20 seconds per minute for 5 minutes sequentially, bringing the total counting time at 100 seconds per worm.
2.1 In vivo research 2 MATERIALS AND METHODS
2.1.3 Swimming activity assay
Three conditions were investigated: wild type, heterozygous glb-3 mutant and homozygous glb-3 mutant. For each condition, the swimming activity of 15 worms was observed.
Assessing the swimming activity of a single worm took place by transferring the worm into a 20 µL S-buffer droplet in a blue-circled glass slide and recording a one-minute video (AVI format), after allowing a 30 second recovery period, on a stereo microscope (Nikon SMZ745T G-AL stereo micro-scope with Nikon digital video camera). The swimming activity of the worm was then determined by counting the number of body bends throughout the entire video, with a body bend defined as a complete oscillation of the body center.
Worms unable to complete a single oscillation were discarded from the experiment and the subse-quent analyses.
2.1.4 Chemotaxis assay
A chemotaxis experiment based on Margie et al. (2013) was performed to assess attraction to diacetyl (IUPAC name: butane-2,3-dione), a volatile odorant that is well-known and commonly used as a chemoattractant within the C. elegans scientific research community (Margie et al., 2013).
Two conditions were investigated: wild type and homozygous glb-3 mutant. For each condition, the chemotaxis index of a group of about 15 to 30 worms was calculated.
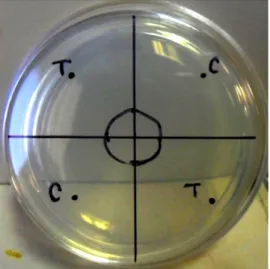
Medium-sized petri dishes were prepared in advance, contained 10 mL NGM and were unseeded. Each petri dish was divided in four quadrants as outlined in Margie et al. (2013). Two opposing quadrants were used as test quadrants, while the other two opposing quadrants were used as control quadrants. Around the origin, a circle of radius 0.5 cm was drawn. Quadrant organization is shown in Figure 2.
Figure 2: Organization of quadrants of a medium-sized petri dish, as described in Margie et al. (2013). Two opposing
quadrants were used as test quadrants, while the other two opposing quadrants were used as control quadrants. Around the origin, a circle of radius 0.5 cm was drawn.
Before the cultivated worms were transferred to the experimental medium-sized petri dish, they were collected in a temporary petri dish. A 60 µL S-buffer droplet was placed in the center of the temporary dish and about 15 to 30 worms were transferred from the culture into the droplet. Hereafter, S-buffer was used to rinse the worms off the temporary dish and into a 15 mL tube. Next, the supernatant S-buffer was removed and the residual S-buffer, containing the worms, was transferred to the center of the experimental medium-sized petri dish via a glass pipette.
Subsequently, a 2 µL droplet of an attractant was added in every quadrant at a 2 cm distance from the center and equidistant from the neighbouring droplets of attractant. For test quadrants, the test
2 MATERIALS AND METHODS 2.1 In vivo research
attractant was a 1:1 mixture of 0.5 % diacetyl and 0.5 M sodium azide, while for control quadrants, the control attractant was a 1:1 mixture of 99 % ethanol and 0.5 M sodium azide. Sodium azide was used to paralyze worms within the vicinity of the attractant droplet.
The worms were allowed to forage for 60 minutes and their position was registered afterwards. From their position, a chemotaxis index (abbr. CI) can be calculated according to Equation 1.
CI =
∑
T est−∑Control
∑
T est +∑Origin +∑Control (1)
2.1.5 Statistical data analysis
Statistical analysis of the data was performed in R version 3.6.3 and the respective R scripts are available on GitHub8, as well as in Appendix A.
Experiments were designed to be analyzed by an independent two-sample t-test or a one-way ANOVA. Assumptions for these tests were assessed graphically via Q-Q plots and formally via the Shapiro-Wilk test of normality and Levene’s test of homoskedasticity. In case the datasets did not pass the tests of normality and homoskedasticity, the two-sample t-test and the one-way ANOVA were re-placed by their nonparametric counterparts, respectively the Wilcoxon rank sum test and the Kruskal-Wallis test.
Due to the rather limited number of worms in the chemotaxis assay, a reliable estimation of the chemotaxis index may not be guaranteed. Therefore, an additional analysis was undertaken, namely Fisher’s exact test, a nonparametric test for categorical data.
All statistical tests were performed at the de facto standard significance level of α = 0.05.
2.2 In silico research 2 MATERIALS AND METHODS
2.2
In silico research
2.2.1 RNA-Seq data pipeline
Computer system configuration
Processing of RNA-Seq data requires appropriate hard- and software. Here, a 64-bit computer sys-tem was used, equipped with an AMD Ryzen 7 3750H 2.3 GHz CPU and 16 GB of DDR4 RAM. Fur-thermore, due to the high storage requirements, the computer system was expanded with an additional 2 TB external hard disk. On top of this hardware, the UNIX-based operating system Ubuntu 18.04 LTS9 with Linux kernel version 5.3.0 was running.
RNA-Seq data acquisition
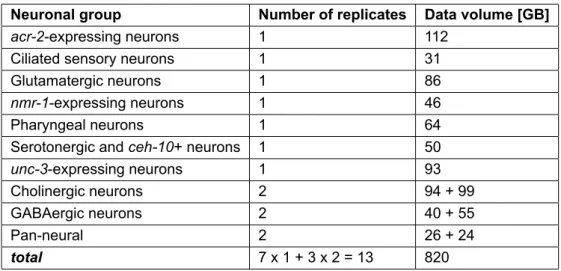
In-depth information on the CeNGEN project’s RNA-Seq data is available through the associated Gene Expression Omnibus Accession10, while for conciseness, the elementary structure of the dataset is outlined in Table 2.
Moreover, the raw RNA-Seq data was acquired from the Sequence Read Archive11 in the form of FASTQ files, while the C. elegans genome assembly version WBcel235 and the associated genome annotation were retrieved from Ensembl’s FTP server12in FASTA format and GTF format, respectively.
Table 2: Elementary structure of the CeNGEN RNA-Seq dataset.
Neuronal group Number of replicates Data volume [GB]
acr-2-expressing neurons 1 112
Ciliated sensory neurons 1 31
Glutamatergic neurons 1 86
nmr-1-expressing neurons 1 46
Pharyngeal neurons 1 64
Serotonergic and ceh-10+ neurons 1 50
unc-3-expressing neurons 1 93
Cholinergic neurons 2 94 + 99
GABAergic neurons 2 40 + 55
Pan-neural 2 26 + 24
total 7 x 1 + 3 x 2 = 13 820
RNA-Seq data processing
As outlined in Table 2, the CeNGEN project’s RNA-Seq dataset consists of 13 samples, belonging to 10 neuronal groups. Because paired-end sequencing technology was used, each sample’s reads are stored as two separate FASTQ files, corresponding to both sequencing directions. The next step is then to map these reads to the C. elegans genome. This procedure is called the ”RNA-Seq data pipeline” and is implemented in thefastq-mapper.py script, available in Appendix B.
9http://releases.ubuntu.com/bionic/
10https://www.ncbi.nlm.nih.gov/geo/query/acc.cgi?acc=GSE136049 11https://www.ncbi.nlm.nih.gov/sra?term=SRP218876
12Ensembl C. elegans index: https://www.ensembl.org/Caenorhabditis_elegans/Info/Index
C. elegans genome assembly: ftp://ftp.ensembl.org/pub/release-99/fasta/caenorhabditis_elegans/dna C. elegans genome annotation: ftp://ftp.ensembl.org/pub/release-99/gtf/caenorhabditis_elegans
2 MATERIALS AND METHODS 2.2 In silico research
The design of the RNA-Seq data pipeline was largely guided by Pertea et al. (2016). Therefore, Python version 2.7.17, (Anaconda) Python 3.7.6, R version 3.6.3, HISAT2 version 2.1.0, SAMtools ver-sion 1.10 and StringTie verver-sion 2.1.2 were installed on the computer system.
Subsequently, thefastq-mapper.py script proceeded by building a genome index for C. elegans and aligning a single sample’s RNA-Seq reads to this genome index. Next, the transcripts in the gener-ated alignment map were assembled based on the associgener-ated C. elegans genome annotation, enabling to identify and quantify C. elegans gene transcripts. Then,prepDE.py was used to generate a gene count matrix for downstream analysis, as explained on the StringTie webpage13. Ultimately, the gene count matrix was written out to a comma-separated value file. This procedure was repeated for all of the 13 RNA-Seq samples, resulting in 13 separate gene count matrices (total running time was approx-imately one week).
During the implementation of the RNA-Seq data pipeline, the philosophy was to use a minimal amount of parameters, while not compromising the scientific rigour. In an attempt to keep the data pipeline as generic and modular as possible, a ”LEGO blocks” approach was taken to the coding. This consisted of programming the required tools in an independent fashion and testing them on dummy datasets. After programming the tools, they were chained together, one by one. To ensure that the pipeline remained functional, the entire analysis was reran every time a new tool was added to the toolchain. All of this was done to reduce the probability of making errors.
Furthermore, the gene count matrices were post-processed in the reshape.R script, available in Appendix B. This script was responsible for merging the 13 gene count matrices corresponding to each sample into a single dataframe. DESeq2 version 1.26.0 (Love et al., 2014; Anders et al., 2013) was then used to normalize this dataframe with respect to the housekeeping genes proposed by Tao et al. (2020). A list of the used housekeeping genes and their corresponding WormBase Gene IDs is available in the README.md file in Appendix B.
The resulting master dataframe, containing gene abundances (gene expression levels normalized within and between samples) for all genes in all samples expressed as FPKM14, was written out to a comma-separated value file,master.csv.
Data pipeline validation
The last part of thereshape.R script is concerned with the validation of the RNA-Seq data pipeline, primarily by assessing the correlation and clustering of the replicates. In this case, as only a single replicate was available for three out of the thirteen samples, this meant that the clustering of the cholin-ergic neurons group’s samples, the GABAcholin-ergic neurons group’s samples and the pan-neuronal group’s samples had to be investigated.
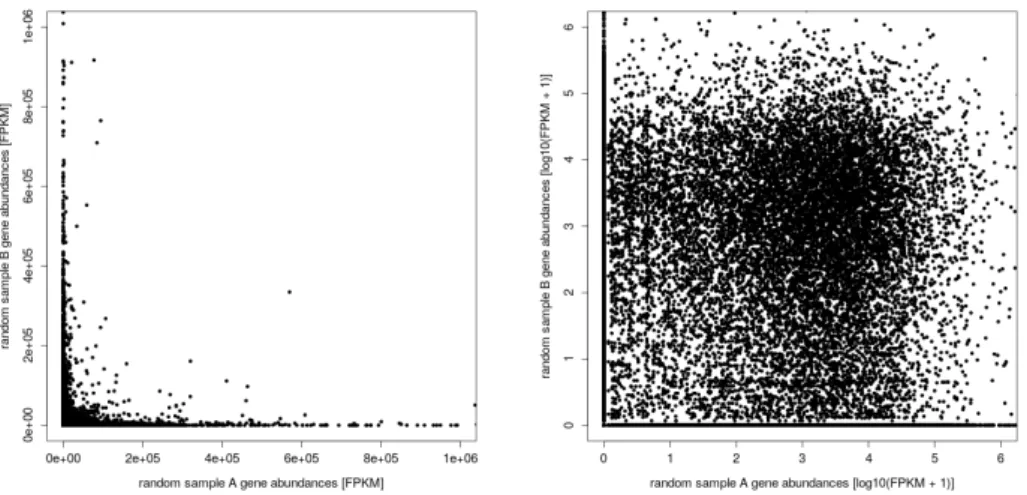
Before proceeding to inspect the correlation of replicates, the gene abundance distribution from all samples combined was explored to investigate the appropriateness of log-transforming the data in fur-ther analyses. In general, log-transformation provides compression to the gene abundances. Large differences become smaller and small differences become larger. Therefore, small differences in gene expression are magnified and may be detected in a further analysis. Due to the high number of gene abundances equal to zero, a log(x + 1) transform was used instead of a log(x) transform. In that way, gene abundances that were equal to zero will remain equal to zero after transformation (Bartlett, 1947). As a next step in the validation of the data pipeline, replicates were plotted against each other and their correlation was assessed. For reference, an additional figure was generated to demonstrate what no correlation between replicates looks like. Therefore, the master dataframe was resampled by drawing two independent random samples from it and plotting both samples against each other in a scatter plot.
13http://ccb.jhu.edu/software/stringtie/index.shtml?t=manual#deseq
2.2 In silico research 2 MATERIALS AND METHODS
Additionally, a sample dendrogram was generated by hierarchical clustering with complete linkage and a principal component analysis was performed.
Supplementary information
Supplementary information on computer system configuration and RNA-Seq data acquisition, to-gether with the Python and R scripts for all subsequent analyses are available on GitHub15, as well as in Appendix B.
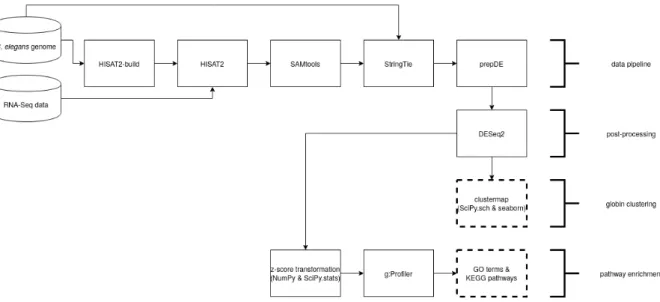
Additionally, Figure 3 presents a bird’s-eye-view on the entire data analysis process.
2.2.2 Globin clustermap analysis
Before proceeding with the globin clustermap analysis, the master dataframe was modified by av-eraging both of the cholinergic neurons group’s replicates, as well as avav-eraging both of the GABAergic neurons group’s replicates. The pan-neural group’s replicates, on the other hand, were discarded from the analysis, since they effectively spanned multiple neuronal groups.
Next, the clustermap.py script was written to conduct the globin clustermap analysis. First, all genes belonging to the GLoBin-related protein superfamily were filtered from the master dataframe based on their WormBase Gene ID. Subsequently, SciPy Cluster Hierarchy16was used to generate clus-ter dendrograms via hierarchical clusclus-tering with complete linkage, using the euclidean distance metric (Oyelade et al., 2016). Hereafter, the cluster dendrograms and their associated gene abundances were visualized as a clustermap via seaborn17. This procedure was executed for GLoBin-related genes and for neuronal groups, and for untransformed linearly scaled gene abundances, log10(x + 1)-transformed gene abundances and Z-score-transformed log10(x + 1)-transformed gene abundances.
A list of GLoBin-related genes and their corresponding WormBase Gene IDs is available in the README.md file in Appendix B.
2.2.3 Pathway enrichment analysis
Aiming to elucidate metabolic pathways that are distinctive for pharyngeal neurons, a pathway en-richment analysis was conducted. A prerequisite for this kind of analysis is the availability of a list of differentially expressed genes for the pharyngeal neurons group, when compared to the other neuronal groups. More specifically, in order to be able to continue with the pathway enrichment analysis, a differ-ential gene expression analysis had to be conducted first. A major difference with traditional differdiffer-ential gene expression analyses, however, is that in this case many samples were provided with only one or two replicates, instead of only a few samples with three or more replicates each. Therefore, the pathway enrichment analysis resorted to Z-score transformation-based differential gene expression analysis, as outlined in Cheadle et al. (2003), instead of negative binomial Wald test-based differential gene expres-sion analysis.
Before proceeding with the differential gene expression analysis, the master dataframe was modi-fied by averaging both of the cholinergic neurons group’s replicates, as well as averaging both of the GABAergic neurons group’s replicates. The pan-neural group’s replicates, on the other hand, were discarded from the analysis, since they effectively spanned multiple neuronal groups.
15https://github.ugent.be/bulricht/cengen-glob (access from within Ghent University only). 16https://docs.scipy.org/doc/scipy/reference/cluster.hierarchy.html
2 MATERIALS AND METHODS 2.2 In silico research
Hereafter, theztransform.py script continued by log10(x + 1)-transforming the master dataframe, containing gene abundances. Following this, a Z-score transformation was applied to the dataframe and the dataframe column corresponding to the pharyngeal neurons was subjected to a Z-test, implemented using SciPy Stats18(Cheadle et al., 2003). Subsequently, the WormBase Gene IDs corresponding to the differentially expressed genes were written out to a plain-text file, split into up- and downregulated genes.
To return to the pathway enrichment analysis, the WormBase Gene IDs corresponding to the up- and downregulated genes were uploaded in plain-text format to the g:Profiler webserver version e99_eg46_p14_f92918319 and the associated metabolic pathways were exported. In case the web server asked to rerun the query, it was reran while selecting the genes with the highest number of GO annotations (Reimand et al., 2019).
Figure 3: Flowchart representing all components of the in silico research.
18https://docs.scipy.org/doc/scipy/reference/stats.html 19https://biit.cs.ut.ee/gprofiler/gost
3 RESULTS
3
Results
3.1
In vivo research
3.1.1 Pharyngeal pumping rate assay
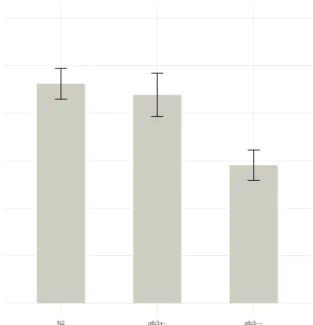
Figure 4 shows a bar plot of the three conditions under investigation, while Table 3 summarizes the results in tabular form. Wild type, heterozygous glb-3 mutant and homozygous glb-3 mutant are represented byN2, glb3+- and glb3--, respectively.
Statistically, the assumptions required for one-way ANOVA were not satisfied, thus a Kruskal-Wallis test was performed. The Kruskal-Wallis test reported a true difference in mean grinder counts between conditions (p-value = 0.0032). A post-hoc multiple comparisons correction reported a true difference in mean between the wild type (N2) and the homozygous mutant (glb3--) condition and a true difference in mean between the heterozygous mutant (glb3+-) and the homozygous mutant (glb3--) condition.
0 100 200 300 N2 glb3+− glb3−− strain gr inder counts [−]
Figure 4: Graphical summary of the pharyngeal pumping rate assay. Mean grinder counts with standard error for each strain
under investigation.
Table 3: Tabular summary of the pharyngeal pumping rate assay.
strain number of worms mean grinder counts standard deviation
N2 30 230.87 88.56
glb3+- 30 219.20 125.38
3.1 In vivo research 3 RESULTS
3.1.2 Swimming activity assay
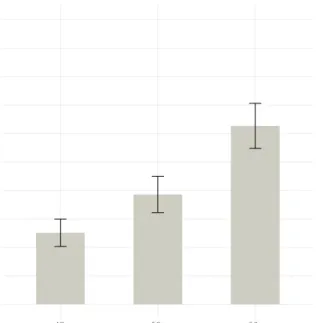
Figure 5 shows a bar plot of the three conditions under investigation, while Table 4 summarizes the results in tabular form. Wild type, heterozygous glb-3 mutant and homozygous glb-3 mutant are represented byN2, glb3+- and glb3--, respectively.
Statistically, the assumptions required for one-way ANOVA were not satisfied, thus a Kruskal-Wallis test was performed. The Kruskal-Wallis test reported a true difference in mean body bend counts be-tween conditions (p-value = 0.0035). A post-hoc multiple comparisons correction reported a true differ-ence in mean between the wild type (N2) and the homozygous mutant (glb3--) condition.
0 10 20 30 40 50 N2 glb3+− glb3−− strain
body bend counts [−]
Figure 5: Graphical summary of the swimming activity assay. Mean body bend counts with standard error for each strain
under investigation.
Table 4: Tabular summary of the swimming activity assay.
strain number of worms mean bend counts standard deviation
N2 45 12.58 16.15
glb3+- 41 19.29 20.43
3 RESULTS 3.1 In vivo research
3.1.3 Chemotaxis assay
Traditional data analysis
Figure 6 shows a bar plot of the two conditions under investigation, while Table 5 and Table 6 sum-marize the results in tabular form. Wild type and homozygous glb-3 mutant are represented byN2 and glb3--, respectively.
Statistically, Student’s independent two-sample t-test reported a true difference in mean chemotaxis index between both conditions (two-tailed test with p-value = 0.034).
−1.0 −0.5 0.0 0.5 1.0 N2 glb3−− strain chemotaxis inde x [−]
Figure 6: Graphical summary of the chemotaxis assay. Mean chemotaxis index with standard error for each strain under
investigation.
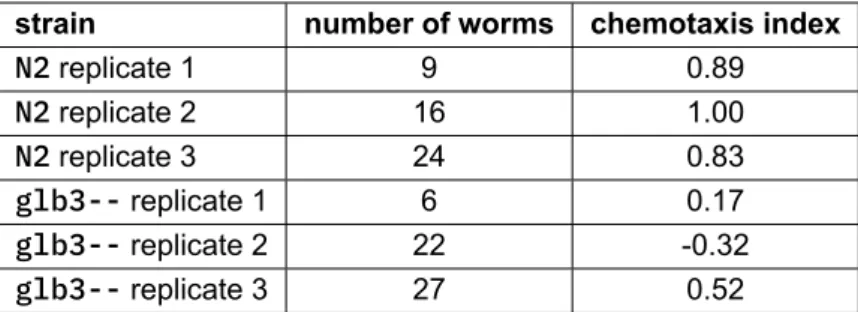
Table 5: Tabular summary of the chemotaxis assay per replicate.
strain number of worms chemotaxis index
N2 replicate 1 9 0.89 N2 replicate 2 16 1.00 N2 replicate 3 24 0.83 glb3-- replicate 1 6 0.17 glb3-- replicate 2 22 -0.32 glb3-- replicate 3 27 0.52
Table 6: Tabular summary of the chemotaxis assay for the combined replicates.
strain number of replicates mean chemotaxis index standard deviation
N2 3 0.91 0.09
3.1 In vivo research 3 RESULTS
Alternative data analysis
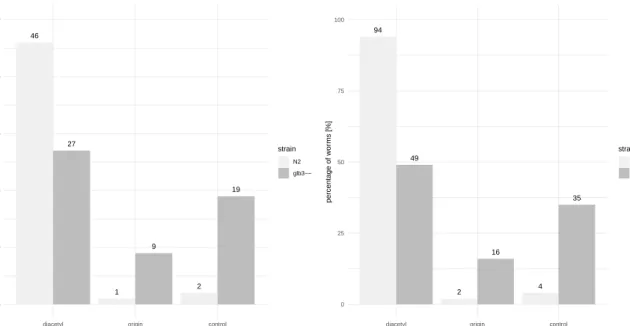
Figure 7 shows the distribution of the two strains under investigation across the three sectors, diacetyl, origin and control. In addition, Table 7 summarizes the results in tabular form. The wild type condition and homozygous glb-3 mutant condition are represented byN2 and glb3--, respectively.
Statistically, Fisher’s exact test reported a significant association between the strain variable and the sector variable (two-tailed test with p-value = 1.16e-06).
46 1 2 27 9 19 0 10 20 30 40 50
diacetyl origin control
sector n umber of w or ms [−] strain N2 glb3−− 94 2 4 49 16 35 0 25 50 75 100
diacetyl origin control
sector percentage of w or ms [%] strain N2 glb3−−
Figure 7: Distribution of both strains across the sectors. Left: Distribution expressed in number of worms. Right: Distribution
expressed in percentage of worms.
Table 7: Contingency table showing the distribution of both strains across the sectors.
diacetyl origin control total
N2 46 1 2 49
glb3-- 27 9 19 55
3 RESULTS 3.2 In silico research
3.2
In silico research
3.2.1 RNA-Seq data pipeline validation
Here, a selection of diagnostic plots that arose during the validation of the RNA-Seq data pipeline is presented.
First of all, Figure 8, showing the gene abundance distribution from all samples combined, clarifies that it may be appropriate to log-transform the gene abundances to approximate normality.
Furthermore, correlation plots to assess the correlation of the replicates are shown in Figure 10, while the artificial random sample scatter plot, which was generated as a reference, is presented in Figure 9. Lastly, to assess the clustering of the replicates, a sample dendrogram generated by hierarchical clustering with complete linkage, and a principal component analysis are shown in Figure 11 and 12, respectively. 0e+00 1e+05 2e+05 3e+05 0 10000 20000 30000 gene abundance [FPKM] frequency [−] 0 50000 100000 150000 0 2 4 6
gene abundance [log10(FPKM + 1)]
frequency [−]
Figure 8: Gene abundance distribution. Left: Gene abundances on a linear scale (the vertical red line represents the arithmetic
mean of the gene abundance, on a linear scale). Right: Gene abundances on a logarithmic scale (the vertical red line represents the arithmetic mean of the gene abundance, on a logarithmic scale, while the vertical blue line represents the arithmetic mean of the log-transformed gene abundance, on a logarithmic scale).
Figure 9: Artificial random sample scatter plot, demonstrating no correlation. Left: Sample correlation on a linear scale.
3.2 In silico research 3 RESULTS
Figure 10: Validation by sample correlation. Upper row: Sample correlation on a linear scale. Lower row: Sample correlation
on a logarithmic scale. cil pan1 pan2 cho1 cho2 gab1 gab2 nmr ser glu unc acr pha 300 350 400 450 500 550 600 hclust (*, "complete") group height [−]
3 RESULTS 3.2 In silico research ● ● ● ● ● ● ● ● ● ● ● ● ● −50 −25 0 25 −50 0 50 100 PC1: 31% variance PC2: 13% v ar iance group ● ● ● ● ● ● ● ● ● ● ● ● ● acr cho1 cho2 cil gab1 gab2 glu nmr pan1 pan2 pha ser unc
Figure 12: Validation by sample clustering: principal component analysis.
3.2.2 Globin clustermap analysis
After filtering the GLoBin-related genes from the master dataframe, the gene abundances were log-transformed and two hierarchical clustering analyses were performed. One analysis clustered the GLoBin-related genes based on their abundance within each neuronal group, a second analysis clus-tered the neuronal groups based on GLoBin-related gene abundance. The results are presented in Figure 13.
Subsequently, a clustermap was constructed for the globin gene abundances against the neuronal groups. This was done for untransformed linearly scaled gene abundances, log-transformed gene abun-dances and Z-score-transformed log-transformed gene abunabun-dances. These clustermaps are shown in Figure 14, Figure 15 and Figure 16, respectively.
glb-19glb-29glb-10glb-01glb-32glb-18glb-31glb-34glb-22glb-33glb-17glb-15glb-06glb-02glb-07glb-27glb-23glb-11glb-25glb-12glb-24glb-13glb-09glb-21glb-26glb-08glb-05glb-14glb-03glb-28glb-20glb-16glb-04glb-30 0 2 4 6 8 10 12 height [-]
ser acr pha cil glu nmr unc cho gab
0 1 2 3 4 5 6 7 8 height [-]
Figure 13: Gene and group dendrograms, based on log-transformed gene abundances. Left: Globin genes clustered by
3.2 In silico research 3 RESULTS acr cho cil gab glu nmr pha ser unc glb-18 glb-31 glb-22 glb-19 glb-29 glb-34 glb-10 glb-33 glb-01 glb-32 glb-12 glb-11 glb-27 glb-14 glb-28 glb-13 glb-02 glb-09 glb-04 glb-07 glb-30 glb-20 glb-16 glb-21 glb-26 glb-03 glb-08 glb-05 glb-15 glb-17 glb-06 glb-23 glb-24 glb-25 0 100000 200000 300000 400000 500000 abundance [FPKM]
Figure 14: Clustermap, showing gene abundance on a linear scale.
acr cho cil gab glu nmr pha ser unc glb-19 glb-29 glb-10 glb-01 glb-32 glb-18 glb-31 glb-34 glb-22 glb-33 glb-17 glb-15 glb-06 glb-02 glb-07 glb-27 glb-23 glb-11 glb-25 glb-12 glb-24 glb-13 glb-09 glb-21 glb-26 glb-08 glb-05 glb-14 glb-03 glb-28 glb-20 glb-16 glb-04 glb-30 0 1 2 3 4 5 abundance [log10(FPKM + 1)]
Figure 15: Clustermap, showing gene abundance on a logarithmic scale.
acr cho cil gab glu nmr pha ser unc glb-14 glb-34 glb-01 glb-11 glb-25 glb-12 glb-08 glb-28 glb-21 glb-04 glb-05 glb-03 glb-24 glb-09 glb-16 glb-22 glb-30 glb-02 glb-10 glb-20 glb-27 glb-15 glb-32 glb-17 glb-07 glb-26 glb-31 glb-29 glb-19 glb-33 glb-13 glb-23 glb-18 glb-06 1.6 0.8 0.0 0.8 1.6 Z-score [log10(FPKM + 1)]
Figure 16: Clustermap, showing Z-score transformed gene abundance.
3.2.3 Pathway enrichment analysis
Here, all-round gene expression in the pharyngeal neurons group was compared with all-round gene expression in the other neuronal groups. After applying a Z-test to this comparison on untransformed linearly scaled gene abundances, 1254 differentially expressed genes were found, from which 1254 were upregulated and 0 were downregulated. When applying a Z-test to log-transformed gene abundances, on the other hand, 1306 differentially expressed genes were found, from which 890 were upregulated and 416 were downregulated. Only in the case of untransformed gene abundances, a differentially expressed GLoBin-related gene was retrieved: glb-9. In the case of log-transformed gene abundances, no GLoBin-related genes were found to be differentially expressed.
3 RESULTS 3.2 In silico research
The results of querying the lists of up- and downregulated genes via the g:Profiler web server are shown in Figure 17 and 18, respectively. For the upregulated genes, a remarkable association with aminoacyl-tRNA biosynthesis (KEGG pathway 00970)20 and Cytoplasmic Ribosomal Proteins (WikiPathways WP540)21was found.
Figure 17: g:Profiler output; upregulated pathways.
Figure 18: g:Profiler output; downregulated pathways.
20https://www.kegg.jp/dbget-bin/www_bget?map00970 21https://www.wikipathways.org/index.php/Pathway:WP540
4 DISCUSSION
4
Discussion
4.1
In vivo research
In the pharyngeal pumping rate assay, the results clearly point towards a reduced pharyngeal pump-ing rate in the homozygous glb-3 mutant. The number of grinder counts per 100 seconds was reduced from 230 (= 138 pharyngeal pumps per minute) to 145 (= 87 pharyngeal pumps per minute), a 37% decrease in pharyngeal pumping rate. However, no significant difference in pharyngeal pumping rate was found between wild type worms and heterozygous glb-3 mutants, suggesting that a single healthy copy of the glb-3 gene may compensate for the other defect copy of the glb-3 gene, in that way retaining the wild type phenotype.
As for the swimming activity assay, the homozygous glb-3 mutant showed an elevated swimming activity. The homozygous mutant (31 body bends per minute) is highly active, while the heterozygous mutant (19 body bends per minute) is in between the wild type (13 body bends per minute) and the homozygous mutant, implying that mutations in the glb-3 gene may have an additive effect on this phenotype. This is a remarkable finding, as an elevated swimming activity is not in line with previous pilot experiments conducted at the Braeckman Lab. It is speculated that experimenter’s individual differences in harsh or soft picking of the worms might play a role in this. That is, the homozygous glb-3 mutant might suffer less from harsh touch and stay active, while the wild type may suffer more and needs time to recover before returning to its normal activity. Future mechanosensation experiments (e.g. as outlined in Chalfie et al. (2014)) may provide more information on this part.
Lastly, the chemotaxis assay results indicate a strongly reduced attractance to diacetyl in the ho-mozygous glb-3 mutant. Both data analysis approaches agreed and arrived at the same conclusion. However, there was a major difference in the degree of confidence, with Fisher’s exact test providing a much more convincing result, compared to Student’s two-sample t-test (p-value of 1.16e-06 versus p-value of 0.034, respectively). In contrast with the pharyngeal pumping rate assay and the swimming activity assay, it turns out that the glb-3 gene is not only involved in locomotion and muscular function, but is involved in the perception of environmental cues as well.
It is important to realize that the abovementioned results are merely an indication of the ground truth and several variables might have confounded the results. For example, issues with microbial contamination on petri plates, mixing and/or contaminating the experimental plates with different worm strains (most notably, interchanging the homozygous and heterozygous mutant), mixing different worm stages (e.g. early adults and late juveniles), damaging a worm during the transfer to a new plate, ... All precautions have been taken to avoid these confounders, but nevertheless, they might have occurred.
4.2 In silico research 4 DISCUSSION
4.2
In silico research
When having a look at both histograms in Figure 8, it can be seen in the histogram on the left that the frequency of the observed gene abundance decays exponentially as the gene abundance increases. This corresponds to the fact that the vast majority of genes is expressed at only very low levels, while relatively few genes are expressed at high levels. Therefore, as the histogram on the right shows, it is appropriate to log-transform the gene abundances, providing more compression to the gene abundances and aiming not to violate the assumptions of subsequent analyses (e.g. the assumption of a normally distributed sample).
Furthermore, Figure 10, 11 and 12 provide sufficient evidence for the reliability of the RNA-Seq data pipeline. Especially when comparing the correlation plots in Figure 10 to the correlation plots in Figure 9, it is clear to see that a given replicate shows a high degree of correlation with its corresponding replicate. Additionally, the group dendrogram in Figure 11 and the principal component analysis in Figure 12 demonstrate that both replicates belonging to a single neuronal group cluster together as expected. Replicates belonging to the group of cholinergic neurons and replicates belonging to the pan-neural group are clearly separated from the others, while the replicates belonging to the GABAergic neurons group are found close together, but also close together with some of the other samples.
Concerning the globin clustermap analysis, Figure 14 has pointed out the exceptionally high expres-sion levels of glb-18 (most notably in nmr-1-expressing neurons) and glb-31 (most notably in
unc-3-expressing neurons). Figure 15, on the other hand, stressed the exceptionally low expression
level of glb-21. Now, isolating the glb-3 gene in Figure 16 for a between-groups comparison, it can be seen that glb-3 is highly prevalent in the ciliate, GABAergic and pharyngeal neuronal groups, while the glb-3 gene is most likely silenced in the serotonergic neurons group. The functional annotation of the ciliate, GABAergic and pharyngeal neuronal groups links them with the perception of environmental cues, locomotion and pharyngeal musculature, respectively. Remarkably, these functional annotations overlap with the experiments conducted throughout the in vivo partim of this dissertation and were all shown to be significantly affected by mutations in the glb-3 gene. In that way, the globin clustermap analysis reinforces the in vivo experimental findings.
At last, a pathway enrichment analysis was conducted, aiming to provide an additional reinforcement of the in vivo experimental findings by comparing the pharyngeal neurons group with the other neuronal groups. The attempt, however, was largely unsuccessful, only recovering a couple of superficial GO22 terms and KEGG23pathways. One upregulated pathway, aminoacyl-tRNA biosynthesis (KEGG path-way 00970), stood out and, in combination with another retrieved upregulated pathpath-way, Cytoplasmic Ribosomal Proteins (WikiPathways WP540), may indicate increased protein production in pharyngeal neurons. Additionally, several differences in signal transduction and signaling pathways were found, but since neurons are the cell type under investigation, it does not come as a surprise to find differences in signal transduction pathways.
22Gene Ontology.
5 CONCLUSION
5
Conclusion
To recapitulate, the in vivo partim of this dissertation has demonstrated significant differences in pharyngeal pumping rate, swimming activity and diacetyl chemotaxis between glb-3 mutants and wild type specimens. Additionally, the in silico partim was, through additional analyses, able to reinforce these in vivo experimental findings to a certain degree.
Not to mention, this dissertation has provided support for the CeNGEN project. The dissertation research and the CeNGEN project were able to agree on several occasions (e.g. the high expression level of glb-18), even though a radically different approach had been taken to the data analysis process. Therefore, this dissertation research may be considered as complementary with the CeNGEN project.
With regard to the initial hypothesis, a (partial) answer can now be provided: Yes, mutations in the
glb-3 gene significantly affect the behavioural phenotype. Taking into account that glb-3 influences
locomotion as well as perception, it is highly probable that there are several more widespread be-havioural features wherein glb-3 mutants differ from wild type worms. Therefore, a full and exhaustive answer to this hypothesis, on the other hand, would require further investigation.
In spite of the invested time and effort, this dissertation has progressed the collective knowledge domain only a tiny step forward. Still, a lot of questions lie unanswered and a lot of things undiscovered in the mysterious world of globins.
ACKNOWLEDGEMENTS ACKNOWLEDGEMENTS
Acknowledgements
The begin with, the author is thankful to his promotor, prof. Bart Braeckman, for offering him the opportunity to conduct his master’s dissertation research in the Laboratory of Aging Physiology and Molecular Evolution at Ghent University. In addition, he is thankful to his supervisor, Tim Loier, for introducing him to the practical aspects of C. elegans research, for the periodical supervision of his work, for the proofreading of his manuscript and for the constructive comments and suggestions on his manuscript.
Once more, the author is thankful to prof. Bart Braeckman and Tim Loier for their flexibility in these challenging times and for enabling him to complete his dissertation research during the corona measures through an alternative assignment.
Furthermore, the author would like to express his gratitude towards the Nematology Research Unit at Ghent University, particularly prof. Wim Bert and Inge Dehennin, for arranging such a wonderful master’s programme. Still in this context, the author is thankful to his classmates, especially to his Cambodian friend, Penghieng Theam, for taking him in on this magnificent multicultural experience.
As a final point, the author is deeply grateful to his friends and family, and in particular his parents and his brother, for their continued support, financially and emotionally, throughout seven years of higher education.
ABBREVIATIONS ABBREVIATIONS
Abbreviations
GFP green fluorescent protein. 3 RNA-Seq RNA sequencing. 2
GLOSSARY GLOSSARY
Glossary
haem coordination complex consisting of an iron ion coordinated to a porphyrin acting as a tetradentate ligand, and to one or two axial ligands (as defined by the IUPAC). 1
hexacoordinated globin in hexacoordinated globins, the sixth coordination site of the iron ion is bound and the haem group only allows for the transfer of electrons. 1
pentacoordinated globin in pentacoordinated globins, the sixth coordination site of the iron ion is free for reversible binding of diatomic ligands. 1
RNA sequencing modern transcriptomics technology consisting of the next-generation sequencing of cDNA fragments, thereby quantifying gene expression levels. 2
BIBLIOGRAPHY BIBLIOGRAPHY
Bibliography
Anders, S., McCarthy, D. J., Chen, Y., Okoniewski, M., Smyth, G. K., Huber, W., and Robinson, M. D. (2013). Count-based differential expression analysis of RNA sequencing data using R and Biocon-ductor. Nature Protocols, 8(9):1765–1786.
Bartlett, M. S. (1947). The use of transformations. Biometrics, 3(1):39.
Brenner, S. (1974). The genetics of Caenorhabditis elegans. Genetics, 77:71–94.
Chalfie, M., Hart, A. C., Rankin, C. H., and Goodman, M. B. (2014). Assaying mechanosen-sation (July 31, 2014). WormBook, ed. The C. elegans Research Community, WormBook,
doi/10.1895/wormbook.1.172.1, http://www.wormbook.org.
Chalfie, M., Tu, Y., Euskirchen, G., Ward, W., and Prasher, D. (1994). Green fluorescent protein as a marker for gene expression. Science, 263(5148):802–805.
Cheadle, C., Vawter, M. P., Freed, W. J., and Becker, K. G. (2003). Analysis of microarray data using Z score transformation. The Journal of Molecular Diagnostics, 5(2):73–81.
Corsi, A. K., Wightman, B., and Chalfie, M. (2015). A transparent window into biology: A primer on
Caenorhabditis elegans (June 18, 2015). WormBook, ed. The C. elegans Research Community,
WormBook, doi/10.1895/wormbook.1.177.1, http://www.wormbook.org.
De Henau, S., Tilleman, L., Vangheel, M., Luyckx, E., Trashin, S., Pauwels, M., Germani, F., Vlaem-inck, C., Vanfleteren, J. R., Bert, W., Pesce, A., Nardini, M., Bolognesi, M., Wael, K. D., Moens, L., Dewilde, S., and Braeckman, B. P. (2015). A redox signalling globin is essential for reproduction in
Caenorhabditis elegans. Nature Communications, 6(1).
Hammarlund, M., Hobert, O., Miller, D. M., and Sestan, N. (2018). The CeNGEN project: The complete gene expression map of an entire nervous system. Neuron, 99(3):430–433.
Hart, A. C. (2006). Behavior (July 3, 2006). WormBook, ed. The C. elegans Research Community, WormBook, doi/10.1895/wormbook.1.87.1, http://www.wormbook.org.
Hobson, R. J., Hapiak, V. M., Xiao, H., Buehrer, K. L., Komuniecki, P. R., and Komuniecki, R. W. (2006). SER-7, a Caenorhabditis elegans 5-HT7-like receptor, is essential for the 5-HT stimulation of pharyn-geal pumping and egg laying. Genetics, 172(1):159–169.
Jarrell, T. A., Wang, Y., Bloniarz, A. E., Brittin, C. A., Xu, M., Thomson, J. N., Albertson, D. G., Hall, D. H., and Emmons, S. W. (2012). The connectome of a decision-making neural network. Science, 337(6093):437–444.
Kiger, L., Tilleman, L., Geuens, E., Hoogewijs, D., Lechauve, C., Moens, L., Dewilde, S., and Marden, M. C. (2011). Electron transfer function versus oxygen delivery: A comparative study for several hexacoordinated globins across the animal kingdom. PLoS ONE, 6(6):e20478.
Love, M. I., Huber, W., and Anders, S. (2014). Moderated estimation of fold change and dispersion for RNA-seq data with DESeq2. Genome Biology, 15(12).
Margie, O., Palmer, C., and Chin-Sang, I. (2013). C. elegans chemotaxis assay. Journal of Visualized
Experiments, (74).
Milani, M., Pesce, A., Nardini, M., Ouellet, H., Ouellet, Y., Dewilde, S., Bocedi, A., Ascenzi, P., Guertin, M., and Moens, L. (2005). Structural bases for heme binding and diatomic ligand recognition in trun-cated hemoglobins. Journal of Inorganic Biochemistry, 99(1):97–109.
BIBLIOGRAPHY BIBLIOGRAPHY
Oyelade, J., Isewon, I., Oladipupo, F., Aromolaran, O., Uwoghiren, E., Ameh, F., Achas, M., and Adebiyi, E. (2016). Clustering algorithms: Their application to gene expression data. Bioinformatics and
Biology Insights, 10:BBI.S38316.
Pertea, M., Kim, D., Pertea, G. M., Leek, J. T., and Salzberg, S. L. (2016). Transcript-level expression analysis of RNA-seq experiments with HISAT, StringTie and Ballgown. Nature Protocols, 11(9):1650– 1667.
Raizen, D., Song, B., Trojanowski, N., and You, Y. (2012). Methods for measuring pharyngeal be-haviors (December 18, 2012). WormBook, ed. The C. elegans Research Community, WormBook, doi/10.1895/wormbook.1.154.1, http://www.wormbook.org.
Reimand, J., Isserlin, R., Voisin, V., Kucera, M., Tannus-Lopes, C., Rostamianfar, A., Wadi, L., Meyer, M., Wong, J., Xu, C., Merico, D., and Bader, G. D. (2019). Pathway enrichment analysis and visualization of omics data using g:Profiler, GSEA, Cytoscape and EnrichmentMap. Nature Protocols, 14(2):482– 517.
Sulston, J. and Horvitz, H. (1977). Post-embryonic cell lineages of the nematode, Caenorhabditis
ele-gans. Developmental Biology, 56(1):110–156.
Sulston, J., Schierenberg, E., White, J., and Thomson, J. (1983). The embryonic cell lineage of the nematode Caenorhabditis elegans. Developmental Biology, 100(1):64–119.
Tao, J., Hao, Y., Li, X., Yin, H., Nie, X., Zhang, J., Xu, B., Chen, Q., and Li, B. (2020). Systematic identification of housekeeping genes possibly used as references in Caenorhabditis elegans by large-scale data integration. Cells, 9(3):786.
Taylor, S. R., Santpere, G., Reilly, M., Glenwinkel, L., Poff, A., McWhirter, R., Xu, C., Weinreb, A., Basavaraju, M., Cook, S. J., Barrett, A., Abrams, A., Vidal, B., Cros, C., Rafi, I., Sestan, N., Hammar-lund, M., Hobert, O., and Miller, D. M. (2019). Expression profiling of the mature C. elegans nervous system by single-cell RNA-sequencing. biorxiv.org – unpublished preprint.
Tilleman, L., Germani, F., Henau, S. D., Geuens, E., Hoogewijs, D., Braeckman, B. P., Vanfleteren, J. R., Moens, L., and Dewilde, S. (2011). Globins in Caenorhabditis elegans. IUBMB Life, 63(3):166–174. Vinogradov, S. N., Hoogewijs, D., Bailly, X., Arredondo-Peter, R., Gough, J., Dewilde, S., Moens, L.,
and Vanfleteren, J. R. (2006). A phylogenomic profile of globins. BMC Evolutionary Biology, 6(1):31. White, J. G., Southgate, E., Thomson, J. N., and Brenner, S. (1986). The structure of the nervous system of the nematode Caenorhabditis elegans. Philosophical Transactions of the Royal Society B:
Biological Sciences, 314(1165):1–340.
WormBase (2020a). https://wormbase.org/resources/gene_class/glb. Release WS274. Retrieved Jan-uary 6, 2020.
WormBase (2020b). https://wormbase.org/search/protein/GLB?species=c_elegans. Release WS274. Retrieved January 6, 2020.
WormBase (2020c). http://www.wormbase.org/db/get?name=glb-3;class=gene. Release WS274. Re-trieved January 6, 2020.
APPENDIX A APPENDIX A
Appendix A
PPRA.R; Implementation of the exploratory data analysis and the Kruskal-Wallis test for the pharyngeal pumping rate assay.
#!/usr/bin/env Rscript # @author Bram Ulrichts
# *** DATAFRAME CONSTRUCTION AND EXPLORATION ***
print("DATAFRAME CONSTRUCTION AND EXPLORATION")
df = read.table(file="data/PPRA.csv", header=TRUE, sep=",") str(df) table(df$strain) df_exp = data.frame( strain=c( "N2", "glb3+-", "glb3--" ), grinder_counts=c( mean(df$grinder_counts[df$strain == "N2"]), mean(df$grinder_counts[df$strain == "glb3+-"]), mean(df$grinder_counts[df$strain == "glb3--"]) ), stdev=c( sd(df$grinder_counts[df$strain == "N2"]), sd(df$grinder_counts[df$strain == "glb3+-"]), sd(df$grinder_counts[df$strain == "glb3--"]) ) ) print(df_exp) df_graph = data.frame( strain=c( "N2", "glb3+-", "glb3--" ), grinder_counts=c( mean(df$grinder_counts[df$strain == "N2"]), mean(df$grinder_counts[df$strain == "glb3+-"]), mean(df$grinder_counts[df$strain == "glb3--"]) ), stderr=c( sd(df$grinder_counts[df$strain == "N2"]) / sqrt(length(df$grinder_counts[df$strain == "N2"])),
APPENDIX A APPENDIX A sd(df$grinder_counts[df$strain == "glb3+-"]) / sqrt(length(df$grinder_counts[df$strain == "glb3+-"])), sd(df$grinder_counts[df$strain == "glb3--"]) / sqrt(length(df$grinder_counts[df$strain == "glb3--"])) ) ) df_graph$strain = factor(df_graph$strain, levels=c("N2", "glb3+-", "glb3--")) print(df_graph) print(df_graph$strain) pdf("media/barplot_PPRA.pdf") library(ggplot2)
ggplot(data=df_graph, aes(x=strain, y=grinder_counts)) + geom_bar(stat="identity", width=0.5, fill="ivory3") +
geom_errorbar(aes(ymin=grinder_counts-stderr, ymax=grinder_counts+stderr), width=0.125) + coord_cartesian(ylim=c(0, 300)) + ylab("grinder counts [-]") + theme_minimal() dev.off() strains = levels(df$strain) pdf("media/qqplot_PPRA.pdf") par(mfrow=c(2, 2)) for (i in 1:3) {
qqnorm(df$grinder_counts[df$strain == strains[i]], main=strains[i]) qqline(df$grinder_counts[df$strain == strains[i]])
}
par(mfrow=c(1, 1)) dev.off()
# *** ONE-WAY ANOVA MODEL AND ASSUMPTIONS ***
print("ONE-WAY ANOVA MODEL AND ASSUMPTIONS")
anova_model = aov(grinder_counts ~ strain, data=df) rsid = anova_model$residuals; shapiro.test(rsid)
library(car); car::leveneTest(grinder_counts ~ strain, data=df) summary(anova_model)
TukeyHSD(anova_model, conf.level=0.95)
# *** KRUSKAL-WALLIS TEST ***
APPENDIX A APPENDIX A
kw_model = kruskal.test(grinder_counts ~ strain, data=df) kw_model$p.value
APPENDIX A APPENDIX A
SAA.R; Implementation of the exploratory data analysis and the Kruskal-Wallis test for the swimming activity assay.
#!/usr/bin/env Rscript # @author Bram Ulrichts
# *** DATAFRAME CONSTRUCTION AND EXPLORATION ***
print("DATAFRAME CONSTRUCTION AND EXPLORATION")
df = read.table(file="data/SAA.csv", header=TRUE, sep=",") str(df) table(df$strain) df_exp = data.frame( strain=c( "N2", "glb3+-", "glb3--" ), bend_counts=c( mean(df$bend_counts[df$strain == "N2"]), mean(df$bend_counts[df$strain == "glb3+-"]), mean(df$bend_counts[df$strain == "glb3--"]) ), stdev=c( sd(df$bend_counts[df$strain == "N2"]), sd(df$bend_counts[df$strain == "glb3+-"]), sd(df$bend_counts[df$strain == "glb3--"]) ) ) print(df_exp) df_graph = data.frame( strain=c( "N2", "glb3+-", "glb3--" ), bend_counts=c( mean(df$bend_counts[df$strain == "N2"]), mean(df$bend_counts[df$strain == "glb3+-"]), mean(df$bend_counts[df$strain == "glb3--"]) ), stderr=c( sd(df$bend_counts[df$strain == "N2"]) / sqrt(length(df$bend_counts[df$strain == "N2"])), sd(df$bend_counts[df$strain == "glb3+-"]) / sqrt(length(df$bend_counts[df$strain == "glb3+-"])),
APPENDIX A APPENDIX A sd(df$bend_counts[df$strain == "glb3--"]) / sqrt(length(df$bend_counts[df$strain == "glb3--"])) ) ) df_graph$strain = factor(df_graph$strain, levels=c("N2", "glb3+-", "glb3--")) print(df_graph) print(df_graph$strain) pdf("media/barplot_SAA.pdf") library(ggplot2)
ggplot(data=df_graph, aes(x=strain, y=bend_counts)) + geom_bar(stat="identity", width=0.5, fill="ivory3") +
geom_errorbar(aes(ymin=bend_counts-stderr, ymax=bend_counts+stderr), width=0.125) +
coord_cartesian(ylim=c(0, 50)) + ylab("body bend counts [-]") + theme_minimal() dev.off() strains = levels(df$strain) pdf("media/qqplot_SAA.pdf") par(mfrow=c(2, 2)) for (i in 1:3) {
qqnorm(df$bend_counts[df$strain == strains[i]], main=strains[i]) qqline(df$bend_counts[df$strain == strains[i]])
}
par(mfrow=c(1, 1)) dev.off()
# *** ONE-WAY ANOVA MODEL AND ASSUMPTIONS ***
print("ONE-WAY ANOVA MODEL AND ASSUMPTIONS") anova_model = aov(bend_counts ~ strain, data=df) rsid = anova_model$residuals; shapiro.test(rsid)
library(car); car::leveneTest(bend_counts ~ strain, data=df) summary(anova_model)
TukeyHSD(anova_model, conf.level=0.95)
# *** KRUSKAL-WALLIS TEST ***
print("KRUSKAL-WALLIS TEST")
APPENDIX A APPENDIX A
kw_model$p.value