ACCURACY
STUDY
OF
A
COMMERCIAL
RADIOTHERAPY
DOSE PLANNING SYSTEM WITH
RESPECT
TO
THE
DOSE
DISTRIBUTION IN AND AROUND
LUNG TUMOURS
Cannoot Kim
Student number: 01502912
Supervisor(s): Prof. dr. ir. Carlos De Wagter Co-supervisor: Dr. Leen Paelinck
A dissertation submitted to Ghent University in partial fulfilment of the requirements for the degree of Master of Science in Biomedical Science
PREFACE
It has been a great opportunity and experience to perform this thesis along with all the other people who have been involved.
Firstly, I want to thank my promotor, Prof. Dr. Ir. Carlos De Wagter for allowing me to perform this thesis and for supporting me along the two master years. His insights and ideas helped me perform film dosimetry more critically. I encountered a lot of problems during this thesis though by continuously offering objective suggestions and advice, a lot of uncertainties became clear. His constructing input in our e-mail conversations during the hard times of COVID-19 helped to complete my results.
Further, I would like to express my thankfulness to Willeke Danckaert for guidance throughout the entirety of film dosimetry which undoubtedly helped me moving forward with my results. Next, I want to thank the staff members of the radiation therapy facility at the University Hospital Ghent for designing our treatment plans and helping us during the CT-simulations. A special thank-you goes out to Frederik Vanhoutte for the assistance during the late-night irradiation sessions.
Thank you, Manon Van Haute, for the support during this dissertation. We endured a lot of problems, but we continuously stimulated each other to reason critically in a broad view. Finally, I would like to thank my family and friends. They always believed in me and supported me during stressful times.
TABLE OF CONTENTS
SUMMARY 1 1. INTRODUCTION 2 1.1. CANCER 2 1.2. LUNG CANCER 2 1.3. TREATMENT 3 1.3.1. Surgery 3 1.3.2. Chemotherapy 3 1.3.3. Radiotherapy 31.3.4. Lung cancer and radiotherapy 5
1.4. INTENSITY MODULATED RADIOTHERAPY (IMRT) 6
1.5. RADIOTHERAPY VERIFICATION PROCEDURES 7
1.5.1. Computed tomography 7
1.5.2. Treatment planning 8
1.5.3. Dose calculating algorithms 8
1.5.4. Film dosimetry 11
1.5.4.1. Generations of Radiochromic films 11
1.5.4.2. Optical density (OD) 11
1.5.4.3. Flatbed scanner 12
1.5.4.4. Considerations of the EBT3 films 12
1.5.5. Gamma-analysis 13
1.6. AIM 13
2. MATERIAL AND METHODS 14
2.1. EXPERIMENTAL PHANTOMS 14
2.1.1. CarPet phantom 14
2.1.2. Thorax phantom 14
2.2. SIMULATION OF THE PHANTOMS 15
2.3. RAYSTATION®: TREATMENT PLANNING SYSTEM 16
2.4. LINEAR ACCELERATOR (LINAC) 17
2.5. CALIBRATION OF THE GAFCHROMIC® FILMS 18
2.6. GAMMA-ANALYSIS 20
3. RESULTS 21
3.1. CALIBRATION CURVES 21
3.2. DOSE-TO-PLAN COMPARISON 23
3.2.1. Evaluation under well-controlled radiation conditions: CarPet phantom – 3D-CRT plan 23 3.2.1.1. Evaluation outcomes with the calibration curve from October 2019 23
3.2.1.2. Evaluation outcomes with the calibration curve from November 2019 24 3.2.2. Evaluation of a more patient simulated situation: Thorax phantom – 3D-CRT 28 3.2.2.1. Evaluation outcomes with the calibration curve from February 2020 28 3.2.3. Evaluation of a more patient simulated situation: Thorax phantom – IMRT 32 3.2.3.1. Evaluation outcomes with the calibration curve from March 2020 32
4. DISCUSSION 39
4.1. CALIBRATION CURVES 39
4.2. DOSE-TO-PLAN COMPARISON 39
4.2.1. Evaluation under well-controlled radiation conditions: CarPet phantom – 3D-CRT plan 39 4.2.1.1. Evaluation outcomes with the calibration curve from October 2019 39 4.2.1.1. Evaluation outcomes with the calibration curve from November 2019 40 4.2.2. Evaluation of a more patient simulated situation: Thorax phantom – 3D-CRT 42 4.2.2.1. Evaluation outcomes with the calibration curve from February 2020 42 4.2.3. Evaluation of a more patient simulated situation: Thorax phantom – IMRT 44 4.2.3.1. Evaluation outcomes with the calibration curve from March 2020 44
5. CONCLUSION 45
IMPACT OF THE COVID-19 PANDEMIC ON THE MASTER THESIS 46
LIST OF ABBREVIATIONS
SCLC Small cell lung cancer NSCLC Non-small cell lung cancer
MV Megavoltage
TPS Treatment planning system
TCP Tumour control probability
NTCP Normal tissue complication probability
GTV Gross target volume
CTV Clinical target volume PTV Planning target volume
OAR Organ(s) at risk
CPE Charged particle equilibrium
IMRT Intensity modulated radiation therapy MLC Multi-leaf collimator
3D-CRT Three-dimensional conformal radiotherapy
QA Quality assurance
kV Kilovoltage
CT Computed tomography
PB Pencil-beam
CS Convolution/Superposition
TERMA Total energy released per unit mass
ρ Density
CCC Collapsed cone convolution LINAC Linear accelerator
EBT External beam therapy
Gy Gray
cGy CentiGray
OD Optical density
CCD Charged coupled device
CCFL Cold cathode fluorescent lamp
RBG Red/Blue/Green
LRA Lateral response artefact in an optical scanner
DD Dose difference
DTA Distance to agreement
VMAT Volumetric intensity modulated therapy
ROI Region of interest
MeV Megaelectronvolt
MU Monitor unit
SSD Source to surface distance
1
SUMMARY
BACKGROUND
The thorax region is challenging in radiotherapy treatment. The density deviations in lung tissue confuse the treatment planning system (TPS) to design an optimal patient-specific dose distribution. Therefore, high precision treatment verification complying with the according to quality assurance (QA) is crucial.
MATERIAL AND METHODS
The performance the TPS was examined by evaluating the agreement between the measured dose by the Gafchromic® EBT3 film and the planned dose by the treatment planning system
for both a homogeneous CarPet phantom and inhomogeneous thorax phantom. The available software of Film QA Pro was used to measure and analyze all plans (three in total) using a 3%/3mm gamma criteria.
RESULTS
The obtained results from the treatment plans satisfied the common criterion of 95% in the high dose area, surrounding the PTV. The incorrect set-up of the CarPet phantom and the underestimation of the lung equivalents in the thorax phantom especially affected the outcomes of the low and medium dose areas.
CONCLUSION
Due to the obtained discrepancies between the planned doses and measured doses -especially in the low and medium dose areas - the TPS was eventually applied as reference. Additional research is necessary to study the low and medium dose areas more profoundly.
2
1. INTRODUCTION
1.1. CANCER
Globally, cancer is a major public health problem in all regions of the world where a significant rate is borne by developing countries. The mortality rate is estimated to account for 9.6 million deaths in 2018. Out of the total amount of cases worldwide, 60% of which will be in developing countries. Moreover, the survival rates in these countries are poor, often about half of the well-developed countries. This can be elucidated by the fact that poor people are commonly exposed to risk factors and have no admittance to decent healthcare. This burden of cases increases enormously due to population ageing and growth, alongside the adaption of cancer-causing behaviour, especially smoking. Cancer is a multigenic and multicellular disease that can arise from different cell types and organs. It cannot be determined as one disease; it is a large group of diseases described by abnormal transformed cells spreading beyond their boundaries. Subsequently, these cells can undergo uncontrolled cell growth or metastatic cell spread and can invade other organs or parts of the body 1.
Cancer development, tumorigenesis, is a process containing multiple steps which reflect genetic alterations contributing to the transformation of normal healthy cells into cancerous diseased derivatives. Six vast mechanisms contribute to alteration in cell physiology which is responsible for the malignant transformation. These six hallmarks of cancer are described in literature by Hanahan and Weinberg. The anticancer defence mechanisms, shared in common with all cancer types, are self-sufficiency in growth signals, insensitivity to growth-inhibitory signals, evasion of programmed cell death, limitless replicative potential, angiogenesis, tissue invasion and metastasis. However, cancer can potentially be considered as a preventable disease due to the current resources, the early-stage detection and the possible preventable nature of some tumours. The past decade’s research ensued in noticeable progress in terms of advances in early detection, towards treatment and better understanding the cancer characteristics 1,2.
GLOBOCAN estimates the cancer incidence and mortality rates over 185 countries with a total population of at least 150.000 for the major cancer types 4. Based on the incidence and
mortality data of the different countries, the estimation methods described 18.1 million new cancer cases and 9.6 million cancer deaths occurred in 2018 worldwide. The rates are significantly higher in low-and middle-income countries (LMIC). These results are calculated considering both sexes. The most diagnosed cancers are also characterized along with the different countries. In men, prostate cancer is most diagnosed, followed by lung cancer. Worldwide, lung cancer is the main cause of cancer-related death. In women, breast cancer is most diagnosed which is also the most frequent cause of cancer-related death. In Belgium, breast cancer shows the highest incidence (14,8%) followed by lung cancer (11,8%) and colorectal cancer (11.7%). Lung cancer shows, just like the global results, the highest mortality rate. Almost ¼ of the Belgium deaths are caused due to lung cancer. Also, colorectum (10,9%) and breast cancer (8,3%) show high mortality rates 3,4.
1.2. LUNG CANCER
Worldwide, lung cancer is the most common malignant disease with a high incidence of 11,6%. It is the major cause of cancer-related death, particularly amongst men. The prognosis remains poor despite significant research and advances in new molecular therapies, contrary to the improved survival outcomes for many other cancer types. The prognosis strongly depends on the stage of the disease at diagnosis. The reason is that most of the symptomatic patients are in a late stage of the disease when diagnosed.
3 Moreover, an overall five-year survival rate of about 5% can be recognized. The ability to identify early-stage lung cancer patients who would benefit most from effective therapies will reduce mortality. Altogether, the need for diagnosis on early preclinical stages and detection of preinvasive lesions is recommending for improving the prognosis and decrementing mortality 5–7.
The pathology can be divided into small cell lung cancer (SCLC) and non-small cell lung cancer (NSCLC) with an incidence of respectively 15% and 85%. The latter group can be subdivided into 3 histological types, namely: squamous cell carcinoma, adenocarcinoma and large cell carcinoma. These groups are thoroughly specified by the investigation of histopathological features 6.
The risk factors for lung cancers strongly vary among race, sex, geography and genetic susceptibility. A positive family history of lung cancer can be identified as a risk factor. Also, lifestyle and environment might play a pivotal role. Although, the association between the incidence of lung cancer and smoking is the most intensively studied in research. The development of lung cancer is tightly related to the consumption of tobacco. Cigarette smoke contains a lot of substances with carcinogenic characteristics. Although, nicotine itself is not carcinogenic 8.
The contribution of tobacco in the pathology features is also overwhelmingly determined by the average amount of cigarettes a day, the age of start, the duration of smoking, with the latter being the dominant factor. Also, second-hand smoking is an included risk of lung cancer. The smoking prevalence is considerably higher in developing countries, and the burden of lung cancer is prognosticated to rise substantially during the coming years. There is also evidence that other risk factors may contribute to the progression of lung cancer including, indoor air pollution, radioactive radon, occupational exposures (e.g. workers at minors) and workplace exposures 8–10.
1.3. TREATMENT
1.3.1. Surgery
Surgery is a consistent treatment option for lung cancer patients. However, a few recommendations should be met: the tumour should be fully resectable, this information is obtained from the CT-images and biopsy, and the intervention needs to be completely tolerated by the patients. Based on randomized controlled clinical studies, a standard for surgery is established. Currently, the standard treatment option is lobectomy of the lung 11.
1.3.2. Chemotherapy
In the case of patients with metastatic disease at diagnosis (70%), chemotherapy is beneficial. The chemotherapy treatment often consists of a combination of various drugs. Chemotherapy can be recommended before surgery to shrink the tumour to facilitate the surgery procedure. To eliminate the cancer cells that are left behind after surgery or unseen on medical imaging, chemotherapy after surgery can be suggested. Along with radiotherapy, chemotherapy can be proposed for the treatment of more advanced cancer invading structures nearby which cannot be treated with surgery 52.
1.3.3. Radiotherapy
Along with surgery and chemotherapy, radiation therapy or radiotherapy is an essential mode of cancer treatment and contributes to the cure and palliation of many cancer patients. Radiotherapy is the most widely used treatment option due to low treatment costs.
4 Approximately one-half of the patients will receive radiation therapy along their course of illness to cure localized disease, palliate symptoms and control incurable cancers. The palliative treatment aims to relieve the symptoms caused by malignant cancer and other cancer-caused problems. Furthermore, combination strategies with other treatment approaches are possible, such as surgery, chemotherapy or immunotherapy. Additionally, radiation therapy before (neoadjuvant therapy) or after surgery (adjuvant therapy) with the purpose to shrink or eradicate microscopic tumour cells below the detection limit respectively is feasible.
External beam radiation, including photon or X-ray and particulate radiation is the most common approach for delivering radiation. X-ray radiation shows a more spread-out dose distribution along their path while particulate therapy delivers a sharp dose course with a large dose deposit at the end of the track, called the Bragg peak. This offers advantages in comparison with X-ray radiation in terms of sparing dose-limiting tissues in close proximity to the targeted tumour. An additional approach is brachytherapy, from which the radiation originates from inside the body of the patient. This internal radiation is a treatment of choice for prostate, breast and gynaecological cancers. The radioactive sources are established into the tumour site to exert their effect locally 1,12,47.
The dose delivery of the interaction of megavoltage (MV)- beams can be computed by considering the interaction of X- and γ-rays (indirect ionizing radiation) in tissue. The biological effects are caused by charged particles, produced by the interaction of photons and tissue. The interaction of high MV-beams with tissue gives rise to the production of secondary electrons and positrons. These secondary particles deposit their energy in tissue into the production of ionisations. The absorbed dose is eventually defined by the energy deposited in tissue per unit mass. In addition, the maximum absorbed dose is generally not at the surface of the water phantom/patient but at the depth that corresponds to the range of the secondary charged particles, denominated as the build-up region. When higher energies are used, the build-up region increase as the range of the secondary electrons becomes larger 46.
Note that in radiotherapy, the lateral beam penumbra has a major impact on the dose distribution in the borders of the target volumes. The penumbra is caused by the limited transmission of beams through the collimator and the lateral scatter of radiation. Gafchromic®
films adequately measure the variation in dose delivered in the penumbral region 13,47.
In radiotherapy, high energy photons (X-rays or gamma(γ)-rays) are used to sterilize cancer cells and deprive them to proliferate and divide further. Moreover, improvements are achieved in imaging techniques, treatment planning systems (TPS), radiation treatment devices besides the insights in radiobiology. Since ionizing radiation also causes damage in the healthy cells, the efficacy of radiotherapy depends on the actual dose delivered to the malignant tumour whilst sparing the exposure to the surrounding tissues 33.
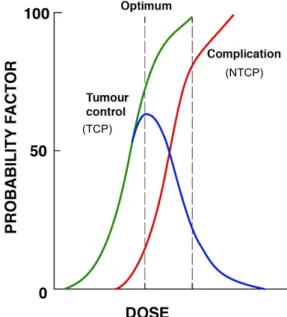
Despite recent improvements in radiotherapy, the achievable dose in a defined area is still limited since acute toxicity and long-term side effects frequently develop. Normal cells have the ability to repair the damaged DNA to an original function state while cancers cells generally are actually not efficient in repairing damage generated by radiation. The evaluation of the radiotherapy treatment plan depends on the tumour control probability (TCP) and the normal tissue complication probability (NTCP) for a given dose distribution. To reduce the chance of complication of surrounding tissues and organs, the radiotherapy dose can be adjusted to obtain higher levels of TCP. Furthermore, a favourable TCP and a low NTCP is required in treatment planning. In this way, the therapeutic ratio can be optimized (Figure 1) 1,12,14.
The determination of the tumour and the surrounding structures is of paramount importance for characterizing the extent of the malignant structure and to optimize the treatment modality. Therefore, to obtain an optimal treatment plan, three main volumes are taken into consideration. Namely, the gross target volume (GTV), clinical target volume (CTV) and the
5 planning target volume (PTV). The GTV is the volume which can be imaged, seen or palpated and defines the extent of the tumour. The second volume contains the GTV together with sub-clinical disease spread. This area should be sufficiently covered to enact cure. The latter volume is the area that effectively will be irradiated, correcting for the uncertainties of the planning or treatment system. The PTV offers a scope to ensure that the prescribed radiation dose accurately comprises the CTV and critically depends on the coincidence of the treatment isocentre with the isocentre of the linear accelerator (LINAC).
Further, the concept of ‘internal margin’ is introduced for the correction of uncertainties such as respiratory motion. By combining this concept with the CTV, the internal target volume is established. This volume encompasses the uncertainties of the tumour motion. On the other hand, since the dose submitted to the organs at risk (OAR) should be minimized, a certain margin is surrounding these critical organs as well by considering position fluctuations of these organs 14.
1.3.4. Lung cancer and radiotherapy
Tissue inhomogeneities in the thorax region are challenging for lung cancer treatment, especially to determine accurate dose distributions. Over many years, substantial attempts are conducted to achieve improved dose-calculation models that correct for the heterogeneous anatomy of the lung. Moreover, considering the miscellaneous structures in the lung area is crucial as the tumour is surrounded by highly radiosensitive lung tissue 15. As the two main
components of the lung are water and air, densities are lower inside the lung than in the surrounding tissues. As a result, these differences will influence the dose distribution.
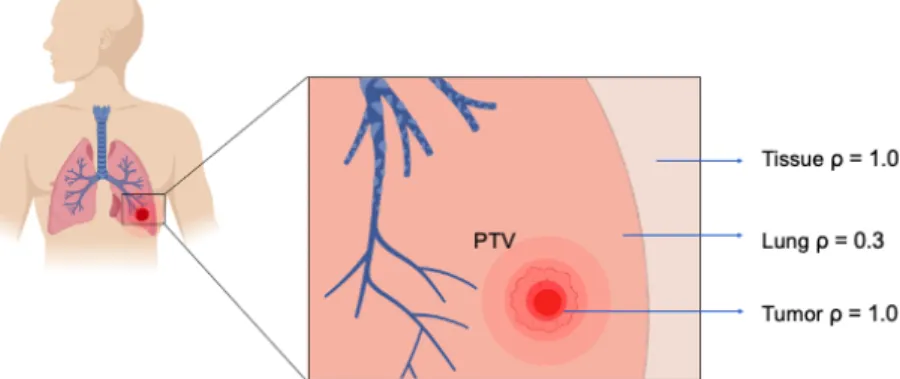
The aim to deliver the effective dose to the malignant tumour cells while minimizing the exposure to the surrounding healthy tissue is complicated due to these density (ρ) differences in the lung structure (Figure 2).
Figure 1 - The line in green displays the chance of cure (TCP) and the line in red shows the complication probability (NTCP). The blue curve results from the distraction of the green and red curves which indicates the probability of local recurrence without complications, in this case approximately 50% 48. Image source: personal collection.
(TCP)
6 These deviations result in electron disequilibria and take place especially when using narrow beams and higher photon energies. This complicates the TPS, RaystationÒ, to design an
optimal dose distribution.
The reduced density results in a decreased attenuation of the radiation beam and a longer pathway of the secondary electrons. Normally, each secondary charged particle leaving a volume with a certain kinetic energy is replaced by another secondary charged particle with the same energy. This charged particle equilibrium (CPE) exists in an irradiated volume. Hence, when the electrons penetrates the lung-tissue surface, this equilibrium is disturbed, especially when using small field sizes 15,16.
When irradiating the tumour, the electrons scatter out over the lung carrying away the dose around the tumour which will lead to an underdose. For that reason, dose computation models should be qualified to consider this electron disequilibrium. Nowadays, 3D dose computation models are assumed be capable of taking this tissue heterogeneity into account 16.
1.4. INTENSITY MODULATED RADIOTHERAPY (IMRT)
Intensity modulated Radiotherapy (IMRT) is a treatment technique using multiple beams originating from different directions, each beam is characterized by another intensity and beam angle. On varies the intensities of the beams to deliver more intensity to the rays which targets the volume of interest. The leaves of the multi-leaf collimator (MLC) alters during the intervention for optimizing the beam transmission. This results in a non-uniform dose distribution and improves the dose conformity with the PTV. Subsequently, the superimposed beams result in complete coverage of the target volume and sufficiently sparing the critical structures. This increases overall treatment quality by speeding up both the planning and delivery processes.
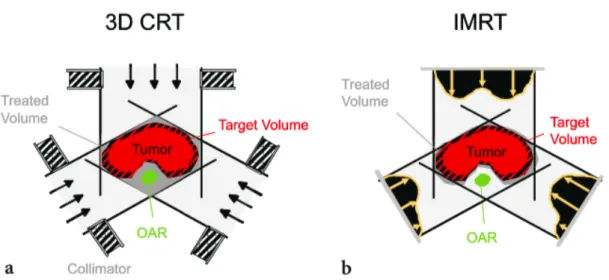
Typically, IMRT is applied when three-dimensional conformal radiotherapy (3D-CRT) is inappropriate for the given dose constraints. 3D-CRT is a standard procedure in radiotherapy whereby typical four to six radiation beams are collimated to the PTV. Despite the conformality, the OARs cannot always be saved from the target dose. To generate a more conformal dose distribution with an additional advantage of sparing OAR, an IMRT treatment plan is more accurate. IMRT is likely safer in case of substantial tumours with a lower risk of post-irradiation toxicity, concerning the conventional method (Figure 3) 17–19.
Figure 2 - The low-density lung structure (ρ = 0.3 g cm-3) including the tumour with a higher density (ρ = 1.0 g cm-3). The illustration is designed by the software of ‘Biorender’ 54. Image
7 For the implementation of IMRT, which can be considered as complicated and less understandable to the users, the TPS plays a pivotal role. The advanced algorithms of TPS are appropriate for calculating the dose accurately by dividing beams into many beamlets. Further, the dose distributions given by TPS needs to be assessed before the treatment is performed. Quality assurance (QA) is a well-established method that exists of systematic actions to ensure the quality and accuracy of a product or process. The assessment of the quality of the treatment plans and the verification of the dosimetry accuracy is strongly recommended (see section 1.5.4.1) 20.
As mentioned above, the heterogeneous anatomy of the thorax is an issue for radiotherapy due to density deviations in this area. The presence of radiosensitive structures such as the lung, oesophagus, heart and spinal cord nearby the tumour impedes the opportunity of efficient dose delivery to the lung tumour whilst minimizing the exposure to surrounding tissues at risk. However, when the irradiated volume expands to the sensitive lung tissue, treatment-related pneumonitis is possible and is considered as the main dose-limiting endpoint in radiotherapy. As a result, external radiotherapy to shape the radiation beams more conformal to the target volume, such as IMRT, is necessary. Additionally, volumetric modulated arc therapy (VMAT) is also frequently used for lung cancer due to the benefits regarding target coverage and sparing of healthy tissue 1,17–19.
1.5. RADIOTHERAPY VERIFICATION PROCEDURES
1.5.1. Computed tomography
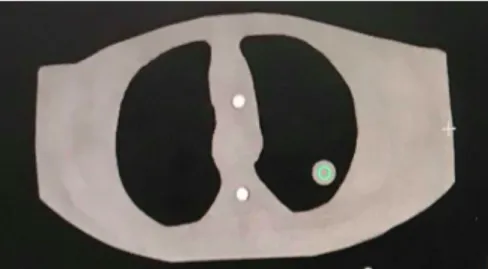
Originally, the anatomy needs to be visualized to define the target volume in three dimensions. This enables the TPS to tailor the high-dose distribution conformally to the tumour and to spare the healthy tissues. During the image acquisition, kilovoltage (kV) X-rays are produced to achieve cross-sectional images of the body (Figure 4). This procedure is performed by an X-ray transmitter and detector which rotates synchronously around the patient/phantom. As a result, various sections are retrieved from different angles, these ‘slices’ are reconstructed in a 3D image.
Figure 3 - Comparison of 3D-CRT and IMRT. IMRT provides potential advantages in terms of sparing the critical structures (shown in green) close to the target volume (shown in red). In case of 3D-CRT, the OAR receives the full treatment dose while the IMRT beams are modulated in that way to fully cover the tumour volume whereas the OAR receives minimal doses 19.
8 The fast scanning and reconstruction of the slices in transverse directions are the main characteristics of the CT-scanner. The sagittal and lateral lasers are important features, they are mounted on the wall and ceiling coming from three directions, the junction of these beams specifies the location of the isocentre. This is the point everything resolves about, usually indicated in the middle of the tumour. This point is marked on the phantom with tape and pen. Although, in clinical settings, fuchsine is used. This will facilitate the positioning of the phantom on the treatment couch.
The positioning of the patient or phantom is recognized as indispensable since the position needs to be re-established daily. Moreover, the connectivity between the CT simulator and the TPS plays a pivotal role since the obtained 3D data of the patient/phantom allows realizing the radiotherapy treatment plan 51.
1.5.2. Treatment planning
The appropriate treatment planning, including various crucial steps, aims to design a state-of-the-art radiotherapy dose plan. Based on the obtained CT-images, lungs, tumour and other critical structures are contoured. Moreover, to ensure an adequality treated target, the GTV and PTV are defined on the different CT-slices.
After the delineation of the thoracic anatomy, extra radiation beams and dose constraints are defined to sufficiently conform the desired radiation dose to the target. Besides, the directions of the beams and angles of the collimator, table and gantry are optimized to fully cover the target volume. Finally, the dose computation algorithms included in the TPS calculate the dose inside the patient, or in this case the phantom. Especially for lung tumours, standard plans are available that can be adjusted to the specific geometry of the lungs and the tumour (see 2.3). 1.5.3. Dose calculating algorithms
In radiation oncology, the simulation and accurate calculation of the 3D dose distribution before the actual delivery is a central procedure. The calculation of the accurate dose becomes increasingly important as an accurate prediction of the dose distribution improves the success rate of cancer treatment and enhances safety. In general, the actual treatment is simulated by computing software based on the CT-images and pre-defined anatomical structures. The accuracy of dose calculating algorithms in heterogeneous tissues such as solid tumours embedded in lung cavities becomes a major issue. Therefore, electron energy transport should be modelled in detail which is time-consuming and intricate.
Figure 4 – Cross-section of the thorax phantom at the level of the tumour, obtained during the CT-stimulation. The tumour is indicated with a green circle. Image source: personal collection.
9 Initially, the ‘correction-based methods’ were introduced for an ultimate homogenous patient consisting of water. The dose calculation procedures were extrapolated by the application of correction algorithms. Hereby, the “missing” part of the patient model was included in a second step. However, one wants to account for the underlying physical processes responsible for the energy deposition as the previous method did not provide accurate dose distributions in three dimensions. For that reason, ‘model-based algorithms’ are introduced to provide a more realistic view of the absorbed dose in inhomogeneous tissues by considering multiple tissue densities. The Monte Carlo algorithm is the most sophisticated approach as the dose calculations satisfy all of the pre-defined requirements. However, the computational times are still too long. For that reason, semi-analytical methods are adopted instead such as the pencil-beam (PB) and convolution/superposition (CS) approaches 21. These algorithms simplify and
enhance the speed of the dose calculation, although this can lead to a lower accuracy. Mainly, the CS approach is proposed for the dose calculations which is described below.
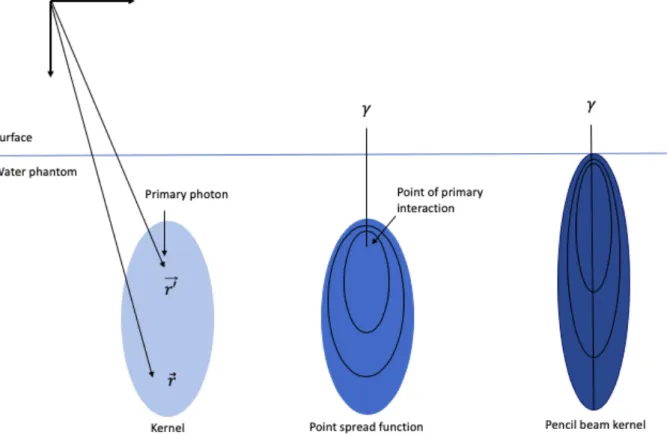
Before the determination of the energy absorption, the radiation output from the treatment device is assessed by the energy fluence. This energy fluence serves as input for the determination of the energy absorption and transport within the patient. First, the interaction of the first photons leads to the ‘total energy released per unit mass’ (TERMA). TERMA can also be described as the lost energies transferred to and deposited in the medium. Subsequently, these interactions result in secondary electrons and photons, mathematically represented by kernel. Dose kernels describe the energy transport and deposition originating from different photon interactions 21,22.
Figure 5 –The dose kernel concept. Light blue: Illustration of a point spread kernel. indicates the dose point and 𝑟′##⃗
shows the place of the primary photon interactions. Blue: The point spread kernel (as used in CS) displays the single interaction point with the resulting 3D dose distribution. Dark blue: The PB kernel (as used in PB) indicates the 3D dose distribution for a mono-energetic elementary photon beam and is derived from the integration of the point spread kernel. This graphical representation of the dose kernels is derived from the figures in
22. Image source: personal collection.
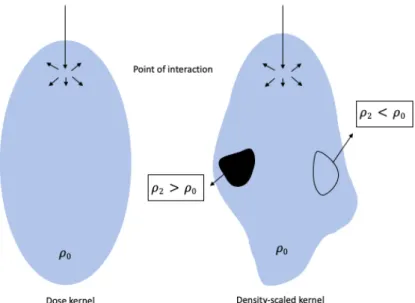
10 For the model-based algorithms two elementary dose kernels are introduced, namely a point spread kernel and a PB kernel (Figure 5). The point spread kernel shows the energy distribution at coordinate 𝑟⃗ originating from photon interactions located at site ##⃗𝑟′, in other words, it indicates the energy distribution around the point of interaction. The energy transport between the interaction point to the dose point is considered as a straight line which introduces an internal ray into the dose kernel. However, the geometry of kernels alters based on the average electron density along the track. This leads to a deformation of the kernels behind inhomogeneities. The kernel expands away from the interaction point if the internal energy ray transverse a low-density medium (in comparison with water), while the kernel will shrink in the presence of high-density structures (Figure 6).
The second category of kernels is obtained through an infinite integration of the different point spread kernels, named PB kernels. The implementation of the PB kernels reduces computation times. However, the adaptation of the dose calculations in tissue inhomogeneities is hard as the individual photon interactions are assumed to be along the central axis. The PB displays a dose kernel considering that all of the interaction points are outlined on the central axis of the kernel whereby density deviations perpendicular to the beam axis are neglected. Finally, the TERMA and the point-spread dose kernels can be combined with the superposition method or convolution algorithm to achieve an accurate calculation of the dose. The superposition approach is the most general and sophisticated one. This method superimposes the dose contributions of all the dose kernels that originate from the primary interaction points 𝑟′
##⃗. However, the convolution algorithm overcomes the limitation of the computational effort by interpreting the dose kernel as the distance between 𝑟⃗ and 𝑟′##⃗. As a result, the calculation times are reduced substantially 21,22.
Collapsed cone convolution (CCC) is an advanced CS algorithm used in TPS. This algorithm applies a three-dimensional density scaling to model the effects of heterogeneities near the points. The accuracy of this algorithm has been well investigated in this thesis by the application of a lung phantom. At interfaces with steep density gradients, such as the lung-tissue surface, a precise dose is assumed to be calculated.
Figure 6
–
A hypothetical dose kernel in water together with a superposition kernel. This density scaled kernel extends or shrinks when the entered medium contains lower/higher electron densities in comparison with water, respectively. This graphical representation of the dose kernels is derived from the figures in 22. Image source: personal collection.11 Further research claims CCC to be a more accurate model for the dose reduction originating from the low-density lung tissue at the surface with soft tissue 21.
1.5.4. Film dosimetry
1.5.4.1. Generations of Radiochromic films
During the last decades, film dosimetry has become an essential method for QA in medical radiation physics and patient-specific dose verifications in a phantom plane. The first suitable film was the Gafchromic® external beam therapy (EBT) film, launched in 2004 by International
Speciality Products. Currently, the well-investigated EBT3 film is applied to avoid the up/down dependency of the previously launched EBT2 films, which were asymmetric.
The Gafchromic® EBT3 films (Ashland ISP Advanced Materials, Wayne, NJ, USA) consist of
three important layers. Namely, a single active layer of 28 μm thickness covered by two 100 μm polyester layers (Figure 7). The active component also includes a yellow marker dye to decrease the UV/light sensitivity, stabilizers and other active components that enable multi-channel dosimetry. Since the structure of the film is symmetrical, the up/down dependency is removed. Moreover, a high spatial resolution, insensitivity to visible light, weak photon energy dependence (only for kV X-rays) and easy handling are the main features which make the films applicable for high dose gradients. Additionally, the films are self-developing, so processing is not required 20,23.
1.5.4.2. Optical density (OD)
After exposure to ionizing radiation (minimum dose of 0.5 Gy), the colouration of the film changes 50. The absorbed dose causes the polymerization of di-acetyl monomers located in
the active layer. The measured dose of the EBT3 films can be compared with the calculated dose of the TPS. The recommended dose range of these films lays in a range of 0.01-30 Gray (Gy).
This colour change in response to the exposure can be characterized by the optical density (OD). This OD can be calculated by determining the intensities of the transmitted light through the exposed and unexposed films, It and I0 respectively 25. The formula of Lambert-Beer is as
follows:
𝑇 =𝐼!"#$%
𝐼&
𝑂𝐷 = −𝐿𝑜𝑔'&𝑇 = 𝜀. 𝑐. 𝑑
Figure 7 - The structural representation of a Gafchromic® EBT3 film. This illustration is derived
12 C = the molecular concentration of the absorbing matter, d = the thickness of the material, ε is the absorption coefficient. T corresponds with the transmission.
1.5.4.3. Flatbed scanner
The films are digitized by a 10000XL Epson Flatbed transmission scanner. This device contains a cold cathode fluorescent lamp (CCFL) as light source, an optical system to split the light into three colour channels and a linear charged coupled device (CCD) array as imaging sensor. Together with the RBG film scanner, the Radiochromic film enables the benefits of multichannel dosimetry of FilmQA Pro. While reading out the film, the scanner converts the intensity and colour of the light that transverses the film into an assembly of pixels. Eventually, the three colours are combined to determine the absorbed dose. The blue colour allows the correction of variations in the active-layer thickness (as induced by the yellow dye). The red channel offers a greater sensitivity at lower doses while the green and blue channels offer an extension to higher doses. A key point within this process is the reproducibility of the film positioning on the scanner bed 20,24.
1.5.4.4. Considerations of the EBT3 films
Despite the advantages of the EBT3 films described before, in turn, practical pitfalls and uncertainties can originate from the characteristics of the film such as the dependency on film orientation and the post-exposure effects 53. These potential pitfalls can harm the accuracy
and efficiency of the measurements made during the film dosimetry procedures 23.
The OD after irradiation will increase within a couple of hours, denominated as post-irradiation darkening. After irradiation, the active component of the film polymerizes continuously, and this process never really stops. Extensive investigation on the post-irradiation exposure suggests a waiting period of 24 hours before the polymerization processes are finished 23,24.
The influence of the relative film orientation in the scanner is of great importance, this should be considered by performing film dosimetry. Films can be positioned in the Epson scanner in the direction (landscape orientation) or orthogonal to the CCD array (portrait orientation). Notably, the position of the films influences the OD as the polymers are considered as small needles and thereby changing the transmission response to the orientation. The difference in orientation is most pronounced in the red channel 23–25.
The accuracy of the Radiochromic films can be affected by the lateral response artefact (LRA). The measured responses depend on the positions of the films perpendicular to the scan axis and the dose. As the OD of the film rises substantially when approaching the lateral edges of the scanner frame, overestimated doses at the edges of the frame can be noticed. This effect is relatively neglectable at low doses (< 100 cGy) and the position of the film within 5 -7 cm of the middle scan axis. The fundamental causes of this effect could be explained as follows. The transmitted light of the films is guided to the CCD detector by a series of mirrors and lenses. In the middle of the scanner bed, rays are normal to the plane of the mirrors. However, when films are reaching the lateral side, the angle will increase by increasing the distance from the axis. Consequently, the reflectivity of the mirrors alters by the angle of the polarized light in such a way that less light of the border of the scan area will reach the detector in comparison with the films placed at the centre for an equal transmission. The transmission diminishes by increasing the distance from the centre of the scanner bed 26,27.
13
1.5.5. Gamma-analysis
The gamma index evaluation method was introduced in a seminal work by Low et al. in 1998. In radiotherapy, the calculated dose from the TPS should be verified before treatment. This patient-specific QA has become a standard tool in medical physics departments. The gamma evaluation method compares the predicted dose distribution with the acquired dose. During γ-analysis, the agreement between the measured dose and the calculated dose of the TPS is assessed by two standard criteria. Namely, the dose differences (DD) and the distance to agreement (DTA) analysis. A numerical index gamma lower than 1 indicates an agreement between the two dose distributions according to the two criteria. Moreover, a high γ pass rate (%) - being the fraction of dose points where gamma is lower than 1 - indicates a good agreement between the calculated dose distribution and the EBT3 film measurements. The DD analyses the % difference between the two dose distributions by subtracting the two images. However, the DD criterion shows highly accurate results in flat dose gradients while in the steep gradients, an oversensitivity can be observed. This can result in deviations from the measured dose in these high dose gradient regions. Therefore, the usefulness of this criterion is limited to the shallow dose gradient. For that reason, the DTA is established to overcome these limitations. The DTA determines for a specific measured point the distance to the closest approach of the calculated dose distribution of the same dose. In this master thesis, a cut off criterion of 3mm/3% is applied. Acceptable accuracy goals are better than 3% DD and 3 mm DTA criterium. This allows to discuss the deviation between the acquired dose and the planned dose.
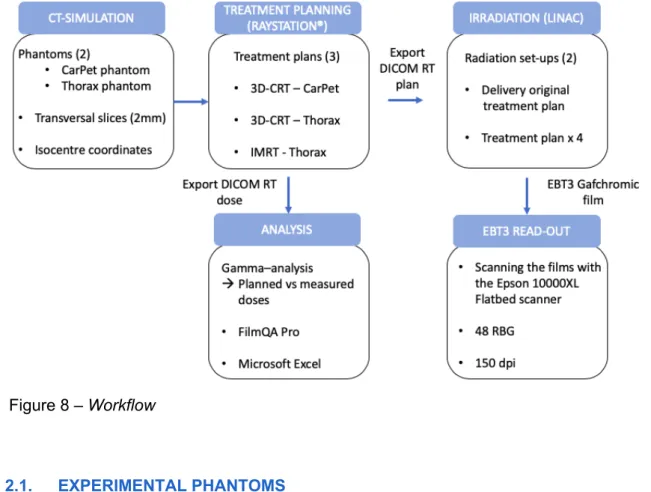
As mentioned before, the comparison can be facilitated by conducting the plan to a phantom. The phantom can verify the dose distributions and is widely adopted in clinical use. To confirm the dose distribution in a phantom, film dosimetry can be performed by the ‘FilmQA Pro’ Software 28–30. The general workflow is shown in Figure 8.
1.6. AIM
In this thesis, the accuracy of Raystation® will be investigated in the thorax region by comparing
the planned dose to the film-measured dose. The CS algorithm will be assessed by following the radiotherapy workflow. Therefore, a homogenous CarPet phantom and a heterogeneous thorax phantom will be “treated” as a patient. During this master course, three different treatment plans are discussed: a 3D-CRT plan (for the Carpet and thorax phantom) and an IMRT plan (for the thorax phantom). The rationale behind this complex plan is that IMRT is more challenging since the resulting dose distributions are expected to be spatially more irregular. Afterwards, the deviations between the acquired dose and the planned dose distribution are compared using the γ-analysis method. These outcomes are processed and discussed.
14
2. MATERIAL AND METHODS
2.1. EXPERIMENTAL PHANTOMS
2.1.1. CarPet phantom
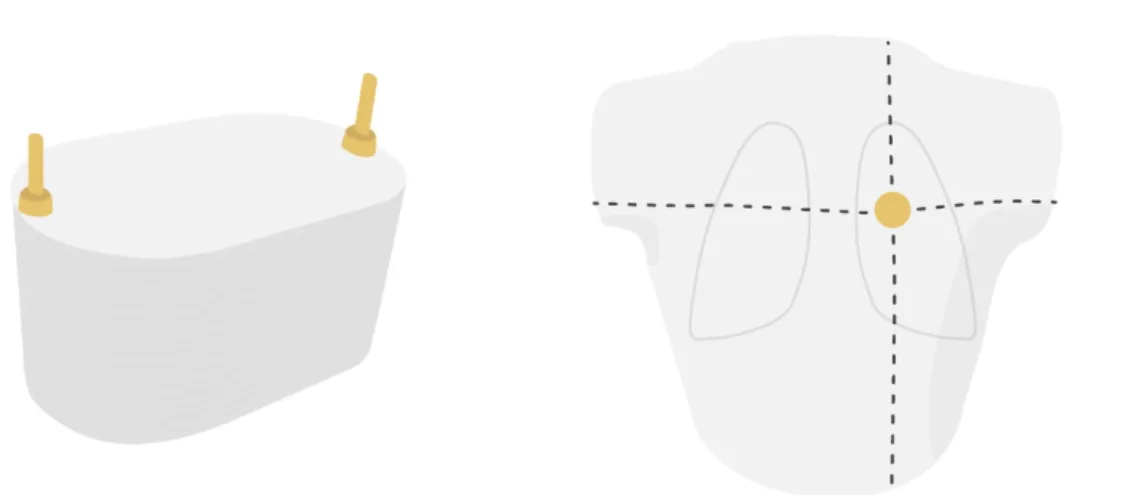
The first treatment plans are conducted with the cylindrical CarPet phantom. This homogenous ‘pelvis’ phantom (ρ = 1.04 g/cm3) is made out of water-equivalent material and contains 16
identical transverse polystyrene slices with a dimension of 37 cm (length) x 20 cm (width) x 16 cm (total height) (Figure 9). The slices, with each a thickness of 1 cm, are clamped together with two supporting bars.
2.1.2. Thorax phantom
To simulate the reality more accurately, a lung phantom is used to represent the heterogenous thoracic anatomy. This anthropomorphic lung phantom with a length of 30 cm simulates the appearance of a pathologic lung and is made out of polystyrene (ρ = 1.02 g/cm3). This
construction consists of different slices of approximately 2 mm thickness which are hold together with two supporting bars. Inside the thorax phantom, a lung equivalent (Gammex RMI, Middleton, WI) (ρ = 0.3 g/cm3) and a tumour-like cylinder are incorporated (Figure 9). This
cylinder is located in the left simulated lung. As described before, both phantoms are conceived for the dosimetry verification of the simple three-beam and IMRT plan of lung cancer.
15
2.2. SIMULATION OF THE PHANTOMS
At the beginning of the investigation, both the CarPet and the thorax phantom are simulated with the large bore CT scanner (Canon Medical System Corporation, Otawara, Japan) located in the University Hospital UZ Ghent (Figure 10). The phantoms are placed ‘head-in/supine’ into the CT-scanner and are scanned according to the ‘thorax lung 2mm protocol’. Subsequently, detector arrays rotate around the phantom and different X-ray projections from various directions are converted into different cross-sections to obtain transversal CT-images of 2 mm thickness. On the slices, the tumour is indicated by ‘isovol’: this spherical volume with a diameter of 1 cm, is placed on the axial coupe to indicate the centre of the target volume. Finally, the CT-images and the ‘isovol’ are sent to the treatment planning group in DICOM format.
Figure 9 – The CarPet phantom (left) and the thorax phantom (right). The two supporting clamps are illustrated on the CarPet phantom. The intersection of the dotted lines on the thorax phantom indicates the isocentre lying in the tumour. Image source: personal collection.
Figure 10 – The CarPet phantom (left) and the thorax phantom (right) positioned in the large bore CT-scanner. The green scanning lines indicate the chosen treatment isocentre. Image source: personal collection.
16 These input images are essential for the TPS to design an optimal treatment plan according the retrieved densities from the CT-simulation. Additionally, the CT-images facilitate positioning of the phantoms on the treatment couch of the linac.
The isocentre of the thorax phantom is determined during the CT simulation: 8, 93 cm, -0,60 cm and 0,04 cm according to the X-, Y- and Z-axis, respectively. In Addendum I (3D-CRT – Thorax phantom and IMRT -Thorax phantom), the precise location of the isocentre is visible on the coronal section of the phantom, being at the centre of the upper 1/3th part of the tumour
volume. The isocentre of the CarPet phantom is located at the centre of the phantom (0,0,0).
2.3. RAYSTATION®: TREATMENT PLANNING SYSTEM
The TPS at UZ Ghent, RaystationÒ (Raysearch Laboratories AB, Stockholm, Sweden) is
launched in 2009. The extended tool of the software allows us to fully automate the treatment planning to generate clinical treatment plans which makes RaystationÒ an advanced
commercial TPS. As mentioned above, the computational dose algorithm of RaystationÒ is the
CCC algorithm. This dose calculation process can be divided into three important steps. Namely, the determination of the energy fluence, the computation of TERMA and the convolution with the point-spread kernels. The RaystationÒ algorithm is able to design
treatment plans for several techniques such as IMRT, VMAT and 3D-CRT.
The planning procedure starts with the delineation whereby organ and target delineation tools are available. The abundant adjustable parameters aim to design the beam configurations and delineate targets in that way to reduce the potential exposure to the healthy surrounding structures. The delineation of the PTV and OAR can be done manually but nevertheless, automated tools are also disposable. After de delineation, a state-of-the-art plan can be designed. Numerous options for the treatment plan are available, such as the number of beams, the position of the phantom, the energy, the treatment technique, the number of fractions, the device, the gantry, the collimator and the couch angle.
Finally, the plan is optimized by adding different objectives and constraints to the added regions of interest (ROI) whereby an acceptable dose plan can be delivered. There must be a balance between the adequate target covering on the one hand and the avoided excessive radiation to surrounding organs on the other hand. An acceptable trade-off may need altering and optimizing the treatment plan multiple times.
During this master thesis, three treatment plans were designed (Figure 11):
(1) 3D-CRT treatment plan with 6 MV photon beams (3) of the same weight (71.79 MUs per fraction, gantry angles 0°, 90° and 180°, couch angle 0°, 10cmx10cm field size, photon energy 6 MV) for the CarPet phantom.
(2) 3D-CRT treatment plan for the thorax phantom with 6 MV photon beams (3) of the same weight (63.89 MUs1 per fraction, gantry angles 0°, 90° and 180°, couch angle 0°,
10cmx10cm field size, photon energy 6 MV).
(3) IMRT plan for the thorax phantom with 6 MV photon beams (7) of different weight2
(gantry angles of 30°, 130°, 200°, 230° and 150° and couch angles of 0°, 90°, 60° and 30°, photon energy 6 MV).
1 The planned amount of MUs in the thorax phantom are lower in comparison with the homogenous phantom as there is more
attenuation in the CarPet phantom. In the thorax phantom the simulated lungs are less dense.
17 an and target D tools` 3
2.4. LINEAR ACCELERATOR (LINAC)
The Elekta Synergy accelerator (Elekta Oncology Systems, Crawley, UK) is capable to deliver two photon energies of 6 MV and 15 MV and six electron energies namely 4 MeV, 6 MeV, 8 MeV, 10 MeV, 12 MeV and 15 MeV. The maximum field size of 40x40 cm2 can be defined by
the diaphragms31.
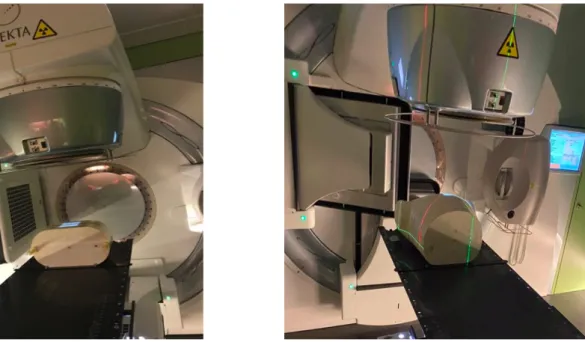
The EBT3 films were irradiated with Elekta Synergy 2 at UZ Ghent. The films have a dimension of 8’x10’ which covers the whole transverse sections of the CarPet phantom. However, the films loaded in the thorax phantom were cut to fit the geometry of the phantom. The phantoms with the EBT3 films are positioned correctly on the treatment table by altering the height and position of the couch (Figure 12). The positioning is completed when the lasers align with the marked lines on the phantom. For each measurement, the phantoms were placed in a similar position on the treatment couch.
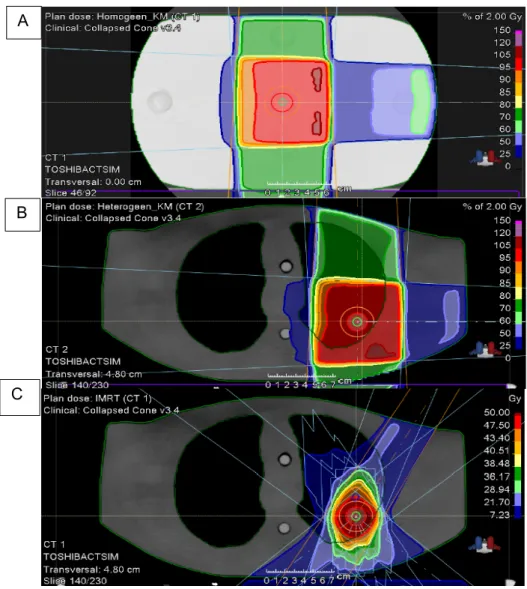
Figure 11 – Transversal overview of the CRT plan on the CarPet phantom (A), The 3D-CRT plan on the thorax phantom (B) and the IMRT plan on the thorax phantom (C) with the pre-contoured structures.
A
B
18 Before the delivery, the treatment plan should be double-checked (including the number of monitor units (MUs) and the beam quality) and the EBT3 films are loaded between the slices of the phantoms (see Addendum II-1). However, the film position should not be in the isocentre of the phantom, but the films are offset by 1 cm from the isocentre as the film should not fully contain the central axis of any of the beams 32.
In total, two irradiation set-ups were executed. In the first set-up, the originally designed treatment plan was delivered to the films in the phantom (with a planned dose of about 2 Gy). In the second set-up, the films were exposed to four times the treatment plan to assess the low-dose area of the film. As a result, the low dose region, the less sensitive part of the film, also absorbs enough dose. However, these films will be overexposed as the recommending range of the EBT3 film is only limited to 3 Gy while the middle part of the film will receive about 8 Gy. Though, the information of the low dose area of these overexposed films is valuable (see further). For statistical reasons, the measurements of every set-up were repeated two times. Note that in this thesis, the films that were irradiated once are labelled as films 1 and 1’ whilst the overexposed films (treatment plan x 4) are denominated as films 2 and 2’ for every plan.
2.5. CALIBRATION OF THE GAFCHROMIC® FILMS
Before the irradiation experiments, the Gafchromic® films were calibrated with the Elekta
Synergy 2 at the University Hospital Ghent. During this master dissertation, Radiochromic EBT3 films were used with sheet dimensions of 20.3 cm x 25.4 cm. The sheets were cut into calibration patches of 3 cm x 13 cm for all the experiments.
The experimental set-up of the calibration consists of ten polystyrene plates and several plates for the backscatter correction, above and below the film respectively (Figure 14). The films were perpendicularly irradiated in the isocentre with a 6MV photon beam. The linac was calibrated in that way to ensure a delivery of 1cGy per MU at 10 cm depth whereby the calibration patches were irradiated in reference conditions with an irradiation field of 10x10 cm2
and a source to surface distance (SSD) of 90 cm. To ensure the similar position of the films in the phantom and scanner, a mark was drawn in the corner of the films.
Figure 12 – The CarPet phantom (left) and thorax phantom (right) on the couch of the LINAC. Image source: personal collection.
19 The films were exposed to various doses ranging from 0 to 5 Gy. The given doses were 0 Gy, 104 cGy, 174 cGy, 294 cGy and 501 cGy. To reduce the statistical uncertainty, three other films also received 0 Gy, 174 cGy and 501 cGy so eight calibration patches were exposed (Figure 13). Since the variation in post-exposure read-out time may cause fluctuation in the dose-response, the exposed calibration patches were scanned 24 hours after the irradiation with an Epson 10000 XL flatbed scanner in transmission mode. A glass plate was positioned on all films in the scanner to ensure a fixed and reproducible position of the film in contact with the surface of the scanner glass.
The films were scanned after five pre-scans to stabilize the light source of the flatbed scanner. The images were acquired in transmission mode, portrait orientation, RBG-positive mode with 48-bit colour and a resolution of 150 dpi. Further, the ROIs (10,1 cm2) drawn on the scanned
calibration patches have 35093 pixels each. The films were positioned in the middle of the scanner bed to overcome the unwanted LRA effect (see 1.5.4.1 – See picture in Addendum II-2). The calibration curves were computed by the software of FilmQA Pro. Note that the same orientation of both the calibration patches and the measurement (patient) film in the scanner is required.
Figure 13 – An overview of the exposed calibration patches on the scanner plate (the light green colour indicates a low absorbed dose while the dark green colour displays a high absorbed dose). Image source: personal collection.
Figure 14 – The experimental set-up for the film calibration procedure. The calibration patch is indicated in orange and is located between the top ten polystyrene plates (at 10-cm depth) and the lower plates that provide sufficient backscatter correction. Image source: personal collection.
20 The calibration procedures were performed based on the recommendations outlined in the ‘Efficient Protocols for accurate Radiochromic Film calibration and Dosimetry’ 50 to ensure the
reproducibility of the measurements. During the calibration, irradiation and scanning procedure, the EBT3 films (lot #03311402 and #05161905) were handled very carefully whereby solely contact with gloves was allowed. As the films are sensitive to UV-light, they were kept in a light-tight envelope for storage.
2.6. GAMMA-ANALYSIS
The irradiated EBT3 films were scanned after the same post-irradiation period as the calibration patches (24 hours). This waiting time is maintained during the whole master thesis. Moreover, the same procedure as for the calibration films was followed to position the films in the centre of the scanner bed in a portrait position and to place the glass plate on top of the films. The EBT3 patient films were read out together with the calibration film patches. Such as the calibration patches, the application films were also pre-scanned five times before the effective scan. Subsequently, the definite scan of the film was performed by the tool ‘New dose map’. The application films and calibration patches were saved separately in .tiff format to operate new dose determinations afterwards.
In the next step, the treatment plan in DICOM-RT DOSE format was provided to FilmQA Pro in order to perform the gamma-analysis. Therefore, two acceptance criteria are set to test the agreement between the calculated and the measured dose distribution: the DD (3%) and the DTA (3mm).
The ‘Dose-to-plan comparison’ function, incorporated in the software of FilmQA Pro, allows to perform the gamma-analysis. In the beginning, the maximum dose value was entered. Subsequently, the treatment plan and the dose map were fit on each other based on the geometrical shape of the dose maps and the radiation beams. This process can be optimized by altering the position of the treatment plan based on the isolines. Also, the threshold function in the software can be used to exclude lower-dose values from the comparison.
Note that the dose obtained from the (more noisy) Radiochromic film was taken as the reference distribution while the (more smooth) TPS dose was taken as the evaluation distribution.
21 3. RESULTS 3.1. CALIBRATION CURVES 0,596751744 0,595779386 0,490698077 0,407121207 0,40368626 0,338711457 0,190152713 0,189433816 0 0,1 0,2 0,3 0,4 0,5 0,6 0,7 0 100 200 300 400 500 600 ME AN O D R ED
ABSORBED DOSE (cGy)
VARIATION CALIBRATION CURVES #05161905
Figure 16 – Overview of the calibration curves of the red colour channel, irradiated in February and March 2020 (#05161905). The mean OD value of these curves is displayed together with the calculated standard deviation (STD) indicated with the grey marks
. 0 0,1 0,2 0,3 0,4 0,5 0,6 0,7 0 100 200 300 400 500 600 OD RED
ABSORBED DOSE (cGy)
CALIBRATION CURVES
OCTOBER 2019 (#03311402) NOVEMBER 2019 (#03311402) FEBRUARY 2020 (#05161905) MARCH 2020 (#05161905)
Figure 15 – Comparison of the calibration curves of the red colour channel. The irradiated films originated from two different EBT3 film batches, namely #03311402 and #05161905.
22 The comparison of calibration curves from lot #03311402 revealed an under response in OD in comparison with the curves from lot #05161905 (Figure 15). Consequently, from February 2020 on, the more recent film lot #05161905 was used. The well-past expiration date of the film batch #03311402 (May 2016) can have affected the film response, although the film had been stored in a refrigerator. The STD between the curves of the recent film batch (February and March with the expiration date of May 2021) is rather small (Figure 16). Four calibration curves were used in this thesis.
a. In October 2019, a calibration curve with a dose range from 0-3 Gy was made (#03311402 – yellow curve in Figure 15 – see 3.2.1.1)
b. In November 2019, the same film lot was recalibrated with an extended dose range from 0-5 Gy (#03311402 – dark blue curve in Figure 15 – see 3.2.1.2)
c. In February 2020, a more recent film batch (#05161905 - with expiration date of May 2021) was applied for the calibration procedure. In total, two calibration curves were computed. For the first calibration curve, the calibration patches were located in landscape orientation (Figure 17 – Dark blue curve). The calibration patches of the second curve, on the other hand, were positioned in portrait orientation (Figure 17 – Light blue curve). This curve was used for the measurements (grey curve in Figure 15 – see 3.2.2.1).
d. In March 2020, a similar calibration curve was acquired as in February 2020 with equal characteristics(#05161905 - light blue curve in Figure 15 – see 3.2.3.1)
Figure 17 – Comparison of the two calibration curves of February 2020 (#05161905). Dark blue: calibration patches in landscape. Light blue: calibration patches in portrait.
0 0,1 0,2 0,3 0,4 0,5 0,6 0,7 0 100 200 300 400 500 600 OD RE D
ABSORBED DOSE (cGy)
CALIBRATION CURVES FEBRUARY 2020 #05161905
(LANDSCAPE VS PORTRAIT ORIENTATION)
23
3.2. DOSE-TO-PLAN COMPARISON
Generally, in the course of every radiation procedure, the original treatment plan was delivered to two patient films, denominated as film 1 and film 1’. However, during the irradiation procedure of the two other films, labelled as film 2 and film 2’, the treatment was executed four times for the assessment of the low dose area. As a result, an adequate film response in the low-dose area can be measured without much noise. For statistical reasons, the measurements were repeated two times.
3.2.1. Evaluation under well-controlled radiation conditions: CarPet phantom – 3D-CRT plan
3.2.1.1. Evaluation outcomes with the calibration curve from October 2019
The calibration curve of October #03311402 with a dose range from 0 – 3 Gy yielded a yellow-coloured reconstructed dose map (Figure 18 – A) of the irradiated film whereas a normal dose map should only contain grey pixels. The yellow pixels reveal a lack of response from the blue channel. Also, poor consistency between the different colour channels is visible in Figure 18- C. In practice, the dose values for the different channels should be in close agreement. The offset points to inconsistency between the calibration data and the scanned film. As a result, the gamma-analysis of this film was not performed due to the poor dose map characteristics. For that reason, the same film lot was recalibrated in November 2019 with an extended dose range (0 – 5 Gy), as the mismatch between the calibration data and film was expected to be caused by the narrow dose range4. As a result, the following experiments were executed with
calibration curves with a dose range to 5 Gy.
4 Later in advanced stages of the thesis, the aberrant yellow dose map appeared not the be caused by the narrow dose range
(See discussion).
Figure 18 – A) The discussed unexpected yellow dose map obtained with the calibration curve of October 2019 - B) The corresponding consistency map – C) A dose profile drawn along the yellow line in dose map A) in the high dose area.
24
3.2.1.2. Evaluation outcomes with the calibration curve from November 2019
As a result, the following experiments were performed with the calibration curve of November 2019 with an extended dose range to 5 Gy. Against our expectations, the initial gamma-analysis yielded pass rates of 70.54% and 72.32% for film 1 and film 1’, respectively. Also, the dose maps of the films revealed a clear inconsistency of the colour channels. This systematic deviation can point to the incorrect scanning procedure of the exposed patient films, for example, the incorrect orientation of the films on the scanner bed.
To verify this, the same films were rescanned one week after exposure according to the correct scanning recommendations unveiling better agreement between the three channels. However, the gamma-analysis of the correctly rescanned film 1 revealed a pass rate of only 37.4%. The 62.6% deviation points to post-exposure polymerization since the films were rescanned one week after irradiation whereas a fixed post-irradiation period of 24 hours was predefined. Line profiles drawn on the overlaid images of film 1 disclose that the measured dose encompasses the calculated dose of the TPS. This post-exposure effect is indicated in Figure 19.
For that reason, four new films from the EBT3 batch #03311402, also denominated as films 1, 1’, 2 and 2’, were irradiated according to the same 3D-CRT plan to retrieve both a good consistency and acceptable pass rates (Table 1). The quantitative assessment of the accordance between measurements of film 1 and the plan yielded an adequate pass rate of 95.4%. However, the gamma pass rate of film 1’, exposed with the same irradiation characteristics as film 1, was remarkably lower (85.1%)5.
The values displayed in Table 1 disclose similar pass rates of films 1 and 1’ in the low and medium dose areas which are systematically measured (Figure 20).
5 IDX POS / - = pixel value. In this case is one pixel = 0.66
Figure 19 – Illustration of the post-exposure polymerization effect. The yellow profile indicates the treatment plan while the red, green and blue profiles display the film measurement. The film clearly measured higher doses. The white arrow drawn on the dose map indicates the position of the dose profile.
25 However, in the high dose area, the pass rates are surprisingly dissimilar. For that reason, lines profiles in the high dose areas of film 1 and 1’ were drawn to verify this systematic deviation (Figure 21).
Gamma pass rates (%) Film 1
Whole film 95.4
High dose area 98.4
Medium dose area 82.2
Low dose area 83.6
Film 1’
Whole film 85.1
High dose area 87.4
Medium dose area 84.7
Low dose area 83.7
Table 1 – Overview of the retrieved gamma pass rates of films 1 & 1’. The scope of the medium and low dose areas is displayed in Figure 20.
B.1)
Figure 20 – The green square on the dose maps indicates the ROI from where the pass rate is calculated in the Medium dose area (1) and Low dose area (2) of films 1 and 1’.
26 Figure 21 illustrates that the measured dose of film 1’ encompasses the treatment plan in the high-exposed area whereas for film 1, the calculated and acquired dose coincide to a higher extent in that region. This can declare the aberrant agreement (%) in the high-dose area for film 1’ (Table 1). Remarkably, for both films, the consistency diminishes when reaching the edges of the film.
The performance of the gamma-analysis of films 2 and 2’ was limited to the low and medium dose areas as the centre of the film received about 8 Gy while the dose range is limited to 3 Gy. Since the low and medium dose regions of films 1 and 1’ unveils much noise besides disagreement of the colour channels (Figure 22-A), the overexposed films were applied for the assessment of these regions. The higher amount of incident photons in that region of films 2 and 2’ eliminates the noise and inconsistency (Figure 22-B). The superimposed dose profiles of films 1 and 2 in the low dose area, shown in Figure 23, confirm these interpretations as more noise is notable from the curve of film 1 in comparison with the overexposed film 2. However, the measured doses of films 2 and 2’ were divided by factor 4 before performing the gamma analysis as these films were irradiated four times. In that manner, the treatment plan could also be compared with the measured doses in the low and medium dose areas without much noise and inconsistency.
The moderate overestimation of the TPS in the medium dose area causes the lower pass rates in that region (between 82.2% - 84.7%) in comparison with the retrieved pass rates from the high dose area (95.4%). Remarkably, the profile shows an asymmetrical course to the right while a symmetrical profile is expected (Figure 22-B). Note that this overestimation can also be observed in the low dose area of the film. However, as the low dose area contains more noise in comparison with the medium dose area, the actual course of the dose profile is partly concealed by higher amounts of noise (Addendum III - 1). Therefore, the dose profile across the medium dose area was chosen to be displayed in Figure 22.
Figure 21 – A.1) – A.2) Horizontal profile across the overlaid images of films 1 and 1’, respectively, in the high dose area. The yellow line displays the treatment plan whereas the coloured lines correspond with the red, green and blue channel. B.1) – B.2) The dose difference maps between the calculated and measured dose plans (%), of film 1 and film 1’, respectively, read out with the calibration curve of November 2019. The yellow arrow drawn on the dose difference maps indicates the position of the dose profile.
27
Figure 22 – Dose profile across the Medium dose area of film 1 A) and film 2 B). [The scope of the medium dose area on the film is displayed in Figure 20]. The white arrow drawn on the measured dose map indicates the position of the dose profile. The measured doses of film 2 were divided by factor 4 to obtain this dose profile.