RIVM report 350010003/2005 Indexes of overall diet quality A review of the literature PΜCM Waijers, EJM Feskens
This investigation has been performed by order and for the account of the Ministry of Health Welfare and Sports, within the framework of project V350010/01/AB ‘Indexes of overall diet quality’
RIVM, P.O. Box 1, 3720 BA Bilthoven, telephone: 31 - 30 - 274 91 11; telefax: 31 - 30 - 274 29 71
Contact:
Ir P.M.C.M. Waijers
Center for Nutrition and Health email: Patricia.Waijers@rivm.nl
Abstract
Indexes of overall diet quality. A review of the literature
A ‘holistic’ approach to diet provides an appealing way to evaluate the diet of the Dutch population. In our critical review of the existing literature on diet quality scores and dietary patterns, we found current methods to have several drawbacks and limitations. This was a reason to propose constructing a diet quality index specific to the Netherlands, using a new approach.
Changes in food consumption habits have both positive and negative effects on the health of the Dutch population. However, the exact consequence to health cannot be assessed through the common approach of considering individual foods and nutrients. Rather, in assessing quality, the diet of the Dutch population should be considered as a whole. Two distinct methods are commonly used. These are diet quality scores (defined beforehand and based on current nutritional knowledge) and dietary patterns (derived afterwards from food
consumption data with the use of statistical methods). Both methods are discussed extensively.
keywords: dietary patterns; diet quality score; diet quality; dietary assessment
Rapport in het kort
Voedingsindexen. Een overzicht van de literatuur
Een ‘holistische’ benadering, waarbij eetpatronen als uitgangspunt worden genomen, is een aantrekkelijke manier om de voeding van de Nederlandse bevolking te beoordelen. We hebben de huidige literatuur over voedingsindexen en afgeleide eetpatronen onderzocht en vonden meerdere tekortkomingen en beperkingen voor de gebruikte methoden. Daarom stellen we voor om middels een nieuwe aanpak een geïntegreerde voedingsindex te ontwikkelen, specifiek voor de Nederlandse situatie.
Veranderingen in het voedingspatroon hebben zowel positieve als negatieve gevolgen voor de voedingsstoffenvoorziening en de gezondheid van de Nederlandse bevolking. De precieze impact van deze veranderingen op de gezondheid kan niet worden bepaald door de
voedingsstoffen en voedingsmiddelen afzonderlijk te bekijken, de meest gangbare
benadering. Om de kwaliteit van de voeding van de Nederlandse bevolking te bepalen, dient deze in zijn geheel te worden beschouwd. Dit gebeurt op twee verschillende manieren. Door het opstellen van een voedingsindex (vooraf, op basis van bestaande kennis omtrent gezonde voeding) of door het afleiden van eetpatronen (achteraf, uit beschikbare
voedselconsumptiegegevens met behulp van statistische methoden). Dit rapport bevat een kritische beschouwing van de huidige literatuur op dit gebied.
Trefwoorden: eetpatronen; voedingsindex; kwaliteit van de voeding; voedselconsumptiebeoordeling
Contents
Summary 7
Samenvatting 10
Introduction 15
1.1 Background and rationale 15
1.2 Outline of the report 16
2. Evaluating diet quality: individual dietary components or dietary patterns 17
2.1 The complexity of the diet 17
2.2 Dietary patterns and public health 18
2.3 Dietary pattern analysis 18
3. Theoretically defined indexes of diet quality 19
3.1 Rationale and composition 19
3.2 Dietary Variety Scores 20
3.3 Existing indexes of diet quality 20
3.4 Index components 23
3.4.1 Index items: foods and nutrients 23
3.4.2 Dietary variety as an index item 24
3.4.3 Assigning foods to food groups 24
3.5 Scoring 25
3.5.1 Choosing a cut-off value 25
3.5.2 Quantification of variables that are both beneficial and detrimental 27 3.5.3 Quantification of cereals, vegetables and fruits 28
3.5.4 Energy intake: a confounder 28
3.5.5 Mutually weighting the individual index components 29 3.6 Composing an index of overall diet quality: conclusions 30
4. Predefined dietary patterns and health outcomes 33
4.1 Socio-demographic factors and nutrient adequacy 33
4.2 Mediterranean Diet Score (MDS) and health outcome 33
4.3 Healthy Eating Index (HEI) and health outcome 34
4.4 Healthy Diet Indicator (HDI) and health outcome 35
4.5 Diet Quality Index (DQI) and health outcome 35
4.6 Food-based indexes and health outcome 36
4.7 Dietary Variety Scores (DVS) and health outcome 36
4.8 Predefined dietary patterns and health outcome: conclusions 37
5. Empirically derived dietary patterns 39
5.1 Dietary patterns from factor analysis 39
5.1.1 Selecting and adjusting the variables 40
5.1.2 Choices in the analysis procedure 40
5.1.4 General conclusions comparing factor analysis studies 42
5.2 Dietary patterns from cluster analysis 42
5.2.1 Selecting and adjusting the variables 43
5.2.2 Choices in the analysis procedure 44
5.2.3 Interpreting and labeling the clusters 45
5.2.4 General conclusions comparing cluster analysis studies 45 5.3 Deriving dietary patterns empirically: conclusions 45 6. Empirically derived eating patterns and health outcome 47 6.1 Associations of dietary patterns and health outcome 47 6.2 Empirically derived dietary patterns and health outcome: conclusions 48 7. Other statistical methods to derive dietary patterns 49 7.1 Multiple, Logistic and Proportional Hazard Regression 49
7.2 Reduced Rank Regression 50
8. Conclusions and recommendations 53
8.1 Is a holistic approach warranted? 53
8.2 Theoretically defined indexes: conclusions 53
8.3 Factor and cluster analysis: conclusions 54
8.4 Additional methods to derive dietary patterns: conclusions 55 8.5 Dietary pattern analysis for use in the Netherlands 56
Literature 59
Appendix A Composition of predefined indexes of diet quality 67 Appendix B Associations of dietary indexes and scores with nutrient adequacy,
Summary
In the last decades various socio-demographic shifts have resulted in significant changes in food choices and eating habits in the Netherlands. These changes have had both positive and negative effects on the nutrient supply and consequently health of the Dutch population. The question rises how exactly these aspects should be weighted.
When diet quality is evaluated generally the dietary components, nutrients and foods, are considered individually. A ‘holistic’ approach would be more realistic though, as people have diets: they do not consume nutrients but combinations of foods.
Two kinds of dietary pattern analysis can be distinguished: theoretically or ‘a priori’ defined dietary patterns and empirically, ‘a posteriori’, derived dietary patterns. This report provides an overview of existing indexes of overall diet quality and methods used to derive dietary patterns and their potentials and limitations. For this purpose published literature has been searched and reviewed. Based on the findings a recommendation is made for the development of a diet quality index for use in the Netherlands.
Theoretically defined indexes of diet quality
Theoretically defined indexes of diet quality consist of nutritional variables, most often nutrients and foods or food groups that are assumed to be either healthful or detrimental. The index variables are quantified and summed to provide an overall measure of dietary quality. The definition of diet quality depends on attributes selected by the investigator. It is built upon current nutrition knowledge or theory or based on a diet that has proven healthful, like the Mediterranean diet.
As many choices have to be made in the composition of an index of overall diet quality, a large degree of subjectivity exists. Several different predefined diet quality scores have been proposed. Four of them have gained most attention: the Healthy Eating Index, the Diet Quality Index, the Healthy Diet Indicator, and the Mediterranean Diet Score.
Food groups included in the large majority of indexes are vegetables and fruits, cereals or grain, and meat and meat products. As for nutrients unanimity seems to exist on the incorporation of fat in the index: total fat, and/or saturated fat (SFA) or the ratio of mono-unsaturated fatty acids (MUFA) to SFA. Cholesterol and alcohol are also included in many indexes.
Several composite indexes contain a variable indicating dietary variety. This concept is generally made operational as the quantity of different foods or food groups consumed in a given period of time. Dietary variety has also been considered on itself in so-called Dietary Variety Scores.
Not only the choice of the index items but also the way in which they are quantified provides many options. An intake cut-off or range for each index variable needs to be chosen. Some
researchers have chosen (a) specific value(s), others the population median. Both choices have advantages and disadvantages. In some indexes energy intake is accounted for.
Although very important, the relative contribution of the various index items to the total score has seldom been addressed. In most indexes all individual variables have the same weight, i.e. they contribute equally to the total score.
In several studies proposed indexes have been validated by relating the index score with nutrient adequacy and/or health outcome. For most of the indexes an association with disease or mortality was reported. These associations were generally moderate, casting doubts on the validity of the indexes.
We think that a diet quality index should be merely food-based. A few macronutrients could be included to assure the diet to be overall balanced, and a few nutrients that are regarded fairly deleterious may also be comprised. Furthermore energy intake should be considered and, although complicated, the relative weights of the individual index items should be seriously addressed.
Empirically derived dietary patterns
Another way of examining dietary patterns is an ‘a posteriori’ approach, in which statistical methods like factor and cluster analysis are used to generate patterns from collected dietary data.
In factor analysis dietary patterns, the so-called factors, are discerned based on correlations between variables, generally foods or food groups. Correlated variables are grouped together, distinct from groups of variables with which they are not correlated. Individuals have a score on each factor. In contrast to factor analysis, cluster analysis does not aggregate intake variables but individuals into relatively homogenous subgroups (clusters) with similar diets. A summary score for each pattern can be derived and used in either correlation or regression analysis to examine relationships between various eating patterns and the outcome of interest, such as nutrient intake, cardiovascular risk factors, and other biochemical indicators of
health.
Although factor and cluster analysis are ‘data-driven’ a degree of subjectivity exists, as choices have to be made in each of the consecutive steps in the analytical process. These steps are somewhat alike for factor and cluster analysis. First the foods or food groups for entry into the analysis need to be selected, foods need to be assigned to food groups, and input variables can (or cannot) be adjusted for example for energy intake. In the majority of studies in nutrition between 20 and 50 food groups were entered for factor analysis. The average number of food groups entered for cluster analysis was apparently smaller and ranged from 10 to 40 for most studies.
The analysis itself and the identification of the dietary patterns or clusters are not
nutritional epidemiology principal components analysis has been applied, using orthogonal rotation and eigenvalues >1. In cluster analysis studies K-Means method was most often used, but Ward’s Method was also regularly applied.
Both the parameters of the resulting factor and cluster solutions and the interpretability as decided on by the researcher determine which solution is finally reported. The number of derived factors reported generally ranged from 2 to 25 and for most studies the total of variance explained by all factors was limited, in general between 15 and 40 percent. The number of resulting clusters varied from 2 (only once) to 8.
The researcher also gives names to the factors or clusters. And although the factor or cluster loadings are generally reported in the published results, labeling does play a critical role in the interpretation.
At this moment there is not yet enough insight in to what extent outcomes are influenced by choices including treatment of the input variables and the factor or clustering method used. Many studies in which dietary patterns have been derived by factor or cluster analysis have reported positive and/or negative associations between certain patterns and a measure of health outcome. These patterning methods therefore seem able to distinguish healthy and less healthy eating patterns. However, if a dietary pattern obtained by either factor or cluster analysis turns out to be a risk factor for a specific disease, an explanation is often difficult to find. In addition some studies could not find any association between any of the factors or clusters derived and health outcome. A reason is that explaining as much variation in food intake as possible does not mean that these patterns represent ideal diets.
Other statistical methods to derive dietary patterns
Constructing a diet quality index and deriving dietary patterns by means of factor or cluster analysis are approaches that have frequently been applied in nutritional epidemiology. Other statistical methods however exist that may also have potential in dietary pattern analysis. Two methods are discussed.
Regression analysis, multiple, logistic or Cox proportional-hazards regression, is a very commonly performed statistical procedure in nutritional epidemiology. It is commonly used to predict a dependent variable (e.g. incidence of disease, or mortality) on the basis of a set of independent variables (e.g. dietary variables).
Some researchers have used a regression model to predict disease risk from specific risk factors, generally for use in a clinical setting. In a similar way regression analysis could be employed to derive dietary patterns that are associated with for example mortality.
Reduced Rank Regression (RRR) is a statistical method that determines linear functions of predictors (for example foods) by maximizing the explained variation in responses (for example disease-related nutrients, disease or mortality). This method has been applied in two
studies only to identify dietary patterns with mixed results. Its potential should be further examined though as it may provide another way to analyze the overall diet.
Conclusions and recommendations
To monitor (changes in) food consumption and to be able to set policy priorities a tool is needed to evaluate the quality of the diet. Studying individual dietary components can reveal the role of individual nutrients in the development of disease, but goes beyond the actual fact that people have diets. When the quality of the overall diet is assessed existing correlations and interactions between dietary components need to be taken into account. For this reason a holistic approach is warranted.
However, although exploratory methods may be used to gain insight into correlations in intakes between foods and prevailing eating patterns, factor or cluster analysis cannot contribute significantly to the construction of an overall diet quality score.
A predefined index of overall diet quality on the other hand could serve to assess the diet of the Dutch population. Yet, development of an index demands many arbitrary choices to be made and existing indexes are only marginally able to predict disease or mortality.
We therefore propose a slightly different method, as the importance of a holistic approach to assess diet quality is evident. Based on the findings in this report a global framework for an index can be constructed. In a next step regression (survival) analysis can be conducted in an appropriate Dutch cohort to establish the final model. In this way a diet quality score can be constructed specific for the Dutch population based on both current insights into the relation of nutrition and health, and existing correlations and interactions between dietary
Samenvatting
Voedingsindexen. een overzicht van de literatuur
Sociaaldemografische ontwikkelingen in de afgelopen decennia hebben geleid tot
aanzienlijke veranderingen in de voedselkeuze en het voedingspatroon van de Nederlandse bevolking. Deze veranderingen hebben zowel positieve als negatieve gevolgen voor de voedingsstoffenvoorziening en de gezondheid. De vraag is echter hoe deze aspecten onderling dienen te worden afgewogen.
Bij het beoordelen van de voedselconsumptie wordt in het algemeen gekeken naar
afzonderlijke voedingsstoffen of voedingsmiddelen. Maar mensen eten geen nutriënten maar combinaties van voedingsmiddelen. Een meer ‘holistische’ benadering, waarbij eetpatronen als uitgangspunt worden genomen, is daarom realistischer.
Dit wordt op twee verschillende manieren in de praktijk gebracht: theoretische kan een ‘a priori’ voedingsindex worden opgesteld of eetpatronen kunnen empirisch, ‘a posteriori’, worden afgeleid uit beschikbare voedselconsumptiegegevens.
Voor dit rapport is de huidige literatuur doorzocht en beoordeeld om een overzicht te kunnen geven van tot nu toe gebruikte voedingsindexen en de statistische methoden om eetpatronen af te leiden. De mogelijkheden en beperkingen van beide methoden worden besproken. Op basis van de bevindingen wordt een aanbeveling gedaan voor het ontwikkelen van een index voor Nederlands gebruik.
Bestaande voedingsindexen
Een geïntegreerde voedingsindex is in het algemeen opgebouwd uit een aantal
voedingsstoffen en voedingsmiddelen of –groepen die gezond of juist ongezond worden geacht. Deze elementen worden gekwantificeerd en bij elkaar opgeteld en vormen zo een maat voor de kwaliteit van het dieet of voedingspatroon. De definitie van kwaliteit hangt dus af van de voedingsfactoren die de onderzoeker selecteert en van de manier waarop hij of zij deze kwantificeert. Dit gebeurt op basis van huidige kennis en inzichten omtrent gezonde voeding. Een index kan echter ook gebaseerd zijn op een voedingspatroon waarvan
wetenschappelijk is aangetoond dat het ‘gezond’ is, zoals het Mediterrane voedingspatroon. Aangezien er veel keuzes moeten worden gemaakt is het opstellen van een voedingsindex in grote mate subjectief. Er zijn al verschillende indexen opgesteld. De vier meest bekende zijn de ‘Healthy Eating Index’, de ‘Diet Quality Index’, de ‘Healthy Diet Indicator’, en de ‘Mediterranean Diet Score’.
Als we kijken naar de samenstelling van bestaande voedingsindexen dan blijken de
voedselgroepen groente en fruit, granen, en vlees en vleesproducten in de meeste indexen wel terug te vinden. Ook de macrovoedingsstof ‘vet’ is opgenomen in vrijwel alle indexen: totaal
vet en daarnaast verzadigd vet of de verhouding tussen enkelvoudig onverzadigd en verzadigd vet. Cholesterol en alcohol zijn eveneens opgenomen in veel indexen. Verschillende indexen bevatten een component die de mate van gevarieerdheid van de voeding (‘dietary variety’) moet weergeven. Dit wordt meestal geoperationaliseerd als de hoeveelheid verschillende voedingsmiddelen of voedselgroepen die in een bepaalde tijdsperiode zijn gegeten. De gevarieerdheid van het dieet wordt ook wel op zichzelf beschouwd in de zogenaamde ‘Dietary Variety Scores’.
Niet alleen moet besloten worden welke componenten worden opgenomen maar ook hoe deze worden gekwantificeerd. Er dient een waarde (‘cut-off’) te worden gekozen waaraan de inneming wordt getoetst. In sommige gevallen is gekozen voor (een) vastgestelde waarde(n), in andere gevallen voor de mediane inneming in de populatie. Aan beide keuzen zitten voor- en nadelen. In sommige indexen wordt rekening gehouden met energie-inneming. Er wordt echter zelden iets gezegd over de relatieve bijdrage van de afzonderlijke componenten aan de totale score, hoewel dat een zeer belangrijk punt is. In vrijwel alle indexen dragen alle
componenten in gelijke mate bij aan de totaalscore.
Bestaande voedingsindexen zijn gevalideerd door te kijken naar associaties met
voedingstoffenvoorziening en/of ziekte of sterfte. Hoewel de meeste indexscores wel een verband lieten zien met ziekte of sterfte, was dit over het algemeen niet heel sterk. De validiteit van de bestaande indexen staat dan ook enigszins ter discussie.
Volgens ons moet een voedingsindex vooral voedingsmiddelen of voedselgroepen bevatten. Een aantal macrovoedingsstoffen zou kunnen worden opgenomen om de gebalanceerdheid van het dieet te toetsen als ook enkele voedingsstoffen met sterk nadelige
gezondheidseffecten. Verder is het van belang dat rekening gehouden wordt met energie-inneming en er dient, al is dit ingewikkeld, met nadruk aandacht te worden besteed aan de relatieve bijdrage van de afzonderlijke componenten aan de totaalscore.
Eetpatronen uit factor- en clusteranalyse
Factor- en clusteranalyse zijn statistische methoden om eetpatronen af te leiden uit
beschikbare voedselconsumptiegegevens. Bij factoranalyse worden eetpatronen, de factoren, onderscheiden op basis van correlaties tussen variabelen (voedingsmiddelen of
voedselgroepen). Variabelen die met elkaar samenhangen worden gegroepeerd, en zo
gescheiden van variabelen waarmee ze geen correlatie vertonen. Elk individu heeft een score op iedere factor. Bij clusteranalyse worden de individuen, en dus niet de voedingsfactoren, met een vergelijkbaar dieet gegroepeerd in clusters.
Voor elk eetpatroon (dus elke factor of cluster) kan een totaalscore worden opgemaakt die gebruikt kan worden in correlatie- of regressieanalyse om zo verbanden tussen verschillende eetpatronen en een uitkomstmaat, zoals voedingsstoffenvoorziening, ziekte of sterfte te onderzoeken.
Hoewel bij factor- en clusteranalyse eetpatronen empirisch worden afgeleid uit bestaande data is er toch sprake van een bepaalde mate van subjectiviteit. In de analyse moeten namelijk verschillende keuzen worden gemaakt. Deze zijn voor factor- en clusteranalyse vergelijkbaar. Allereerst dienen de voedingsmiddelen of voedselgroepen die meedoen in de analyse te worden geselecteerd. Dan moeten voedingsmiddelen worden toegewezen aan deze voedselgroepen. En kunnen deze vervolgens al dan niet gecorrigeerd worden.
De meeste factoranalysestudies die zijn gevonden zijn uitgegaan van tussen de 20 en 50 voedselgroepen, terwijl dat er voor de clusteranalysestudies minder waren, tussen de 10 en de 40 voor de meeste studies.
Ook de analyse zelf en de identificatie van de uiteindelijke factoren of clusters vraagt om keuzes. In het merendeel van de factoranalysestudies is gekozen voor ‘principal components analysis’ (PCA) met orthogonale rotatie en een eigenwaarde >1. De meeste
clusteranalysestudies gebruikten de ‘K-means’ methode, maar ook ‘Ward’s’ methode werd regelmatig toegepast.
Zowel de parameters van de factor- en clusteroplossingen als de mate waarin de onderzoeker vindt dat deze interpreteerbaar zijn, bepalen welke oplossing uiteindelijk wordt gepubliceerd. Het aantal gerapporteerde factoren varieerde grofweg van 2 tot 25. Voor de meeste studies was het percentage totaal verklaarde variatie gering, in het algemeen tussen de 15 en 40 procent. Het aantal gerapporteerde clusters varieerde van 2 (slechts eenmaal) tot 8. De onderzoeker voorziet de factoren en clusters van een label. Hoewel de lading van de diverse input variabelen op de verschillende factoren of clusters meestal weergegeven wordt in de gepubliceerde resultaten, speelt de naamgeving een belangrijke rol in de interpretatie. Het is nog niet duidelijk in welke mate uitkomsten worden beïnvloed door keuzes zoals hoe de variabelen worden behandeld en de gebruikte factor- of clustermethode.
In veel factor- en clusterstudies binnen de voedingswetenschappen zijn positieve en/of negatieve associaties gerapporteerd tussen bepaalde eetpatronen (factoren of clusters) en ziekte of sterfte. Het lijkt daarom mogelijk met behulp van deze methoden gezonde en minder gezonde eetpatronen te onderscheiden. Een precieze reden waarom een bepaald eetpatroon een risicofactor is voor een bepaalde ziekte is echter vaak moeilijk te geven. In veel studies kon ook geen verband worden gevonden tussen één van de gerapporteerde factoren of clusters en een gezondheidsuitkomst. Een reden hiervoor is dat het verklaren van zoveel mogelijk van de variatie in voedselconsumptie niet betekent dat de zo gevonden eetpatronen ook optimaal zijn.
Andere statistische methoden om eetpatronen af te leiden
Er zijn in de voedingswetenschappen verscheidene pogingen geweest om een geïntegreerde voedingsindex op te stellen of om eetpatronen af te leiden met behulp van factor- of
clusteranalyse. Er zijn echter ook andere statistische methoden denkbaar om inzicht te krijgen in (gezonde) eetpatronen.
Regressie-analyse, meervoudig (‘multiple’), logistische of Cox proportional-hazards
regressie, wordt veel toegepast binnen de voedingswetenschappen en de epidemiologie. Deze methode wordt gebruikt om een afhankelijke variabele (bijvoorbeeld ziekte of sterfte) te voorspellen uit een reeks van onafhankelijke variabelen (bijvoorbeeld roken, lichamelijke activiteit en eetgewoonten).
In sommige studies wordt regressie-analyse toegepast om een risicomodel op te stellen voor klinisch gebruik. Op vergelijkbare wijze zou regressie-analyse kunnen worden aangewend voor het afleiden van voedingsfactoren die bijvoorbeeld zijn geassocieerd met sterfte. Met behulp van een andere methode, Reduced Rank Regression (RRR), kan een lineaire functie van voorspellende variabelen (bijvoorbeeld voedingsmiddelen) worden opgesteld door de verklaarde variatie in responses (bijvoorbeeld ziekte of sterfte) te maximaliseren. Vooralsnog is deze methode in slechts twee studies toegepast met als doel eetpatronen te identificeren die voorspellend zijn voor een gezondheidsuitkomst. Dit was met wisselend resultaat.
Conclusies en aanbevelingen
Om (veranderingen in) de voedselconsumptie te monitoren en om tot beleidsprioritering te kunnen komen is een instrument nodig om de kwaliteit van de voeding te evalueren. Bij het bestuderen van individuele voedingsfactoren kan de rol van individuele nutriënten in de ontwikkeling van een ziekte worden blootgelegd, maar wordt voorbij gegaan aan het feit dat mensen eetpatronen hebben en geen individuele voedingsstoffen consumeren. Deze aanpak houdt geen rekening met de vaak hoge correlaties in de inneming van voedingsmiddelen en voedingsstoffen en hun mogelijke interacties. Daarom is een holistische benadering nodig. Hoewel met behulp van exploratieve methoden inzicht kan worden verworven in correlaties in de consumptie van voedingsmiddelen en in bestaande eetpatronen, kunnen deze methoden niet werkelijk bijdragen aan het opstellen van een index om de kwaliteit van de totale
voeding te beoordelen.
Daarentegen zou met behulp van een geïntegreerde voedingsindex de voeding van de Nederlandse bevolking kunnen worden beoordeeld. Echter, bij het ontwikkelen van een dergelijke index moeten meerdere arbitraire keuzen worden gemaakt en reeds bestaande indexen zijn slechts matig in staat om ziekte en sterfte te voorspellen. Daarom wordt een iets andere methode voorgesteld.
Op basis van de bevindingen in dit rapport zou een raamwerk kunnen worden opgesteld voor een nieuwe voedingsindex. In een volgende stap kan door middel van regressie- of
overlevingsduuranalyse in een geschikt Nederlands cohort het uiteindelijke model worden vastgesteld. Op deze manier lijkt het mogelijk om een voedingsindex te ontwikkelen
specifiek voor de Nederlandse bevolking, die gebaseerd is op zowel huidige kennis omtrent voeding en gezondheid en bestaande correlaties en interacties tussen factoren in de voeding.
1.
Introduction
1.1
Background and rationale
In the last decades various socio-demographic shifts have resulted in significant changes in food choices and eating habits in the Netherlands. In September 2002 the National Health Council has published a report with the title: ‘Significant trends in food consumption in the Netherlands’ (24). This report describes the major dietary trends in the period 1987/88 to 1997/98 based on the three Dutch National Food Consumption Surveys1.
Major developments reported were an ongoing decrease in the consumption of staple foods such as potatoes, vegetables, fruit and meat, accompanied by a rise in that of grains/cereals, fish, nuts/snacks, pre-prepared meals, and beverages. Consumption of margarine and full-cream milk products were reported to have lost some ground to the lighter ‘halvarine’ and semi-skimmed and skimmed milk products. These developments in food consumption have both positive and negative effects on the nutrient supply to the Dutch population.
A more recent report from the National Institute for Public Health and the Environment (RIVM) (51) deals with the health consequences of these (changes in) nutritional behavior. Two aspects concerning our eating habits are stressed. In the first place that energy intake is too high in relation to energy expenditure, resulting in a rising prevalence of overweight and obesity, and consequently, health loss. And secondly that for a large part of the population in several aspects the composition of the diet differs seriously from the recommendations. Although the trend is reported to be favorable for saturated fatty acids and trans fatty acids (intakes are declining), their intakes are still too high. Consumption of fruit and vegetables on the other hand is further decreasing, while consumption levels are only half of the
recommended quantities.
The question rises how exactly these positive and negative aspects should be weighted. When diet quality is evaluated generally the dietary components, nutrients and foods, are considered individually as mentioned above, whereas it may be more realistic to consider the diet as a whole. Dietary pattern analysis, in which a ‘holistic’ approach is applied, has gained considerable attention in recent years and many studies considering dietary patterns have been published.
In this report an attempt is made to give an overview of existing indexes of overall diet quality and methods used to derive dietary patterns. Results from studies relating dietary patterns with disease or other health outcomes are described as well in order to gain insight into the validity and usefulness of these patterns or patterning methods.
More insight in and a better understanding of dietary patterns and their potentials will
facilitate the possible development and implementation of a dietary index that can be used for the Dutch population in a next step.
1.2
Outline of the report
In order to better understand the rationale behind dietary pattern analysis this issue is further explored in chapter 2. In this chapter both the limitations of relating individual dietary factors with disease and the potentials of considering dietary patterns instead are discussed briefly. Chapter 3 and 4 deal with indexes of diet quality that have been defined beforehand, based on current nutrition knowledge. First, in chapter 3, an overview of existing indexes is provided and similarities and differences between the indexes are discussed. Then, in chapter 4, study results of the associations of the various indexes with health outcome are reported.
Likewise chapter 5 and 6 describe and evaluate dietary patterns that have been derived empirically, making use of dietary intake data. Two methods, factor and cluster analysis, are described, and resulting patterns and their relation with health outcome are evaluated. In chapter 7 a few other statistical methods to derive patterns used sporadically so far are described briefly.
Final conclusions and recommendations for the use of dietary patterns in the Dutch situation can be found in the last chapter, chapter 8.
2.
Evaluating diet quality: individual dietary
components or dietary patterns
Unlike other behavioral risk factors like smoking, eating is not optional. The question is not whether to eat, but how to eat for optimal health. Thousands of studies have been conducted to gain insight into the role of diet and dietary constituents in the development of disease. In nutrition research focus is generally on the role of single nutrients in diet-disease relations. This view has led to important steps forward in identifying relationships of dietary
components and several health outcomes. Nevertheless, this ‘reductionist’ approach passes over the complexity of the true relationship between diet and disease.
2.1
The complexity of the diet
The complex nature of the diet makes it extremely difficult to study the relationship between dietary factors and health outcome. Almost everyone eats fat, fiber, and folate, for example. Besides people eat foods not nutrients and are generally not aware of the content of the foods eaten.
Studying diet and disease we should therefore be aware of the fact that intake of nutrients may be related. It is often difficult to separate the specific effects of nutrients or foods. For example, diets high in fiber tend to be high in vitamin C, folate, and various carotenoids. When an association is detected between fiber and disease risk, is it certain that the
relationship is not a consequence of folate or carotenoid intake? Although the use of foods or food groups instead of nutrients might help to capture a part of this complexity, similar problems exist. For example, when whole-grain intake is found to be associated with lower disease risk, is it certain that the association is not due to differences in e.g. red meat or fruit and vegetable consumption? When intakes are highly correlated adjusting for intakes of other nutrients or foods may not produce satisfying results.
Moreover analyses of individual nutrients and foods often ignore the many potential
interactions between components of a diet and disease risk. Additionally, by trying to find the effect of certain dietary components, one might miss associations between diet and disease. It might in practice not be possible to detect small differences in for example disease risk from single nutrients.
An endeavor is therefore warranted to evaluate diet quality, considering the diet as a whole, in which dietary patterns, and not single nutrients, are related to health outcome.
2.2
Dietary patterns and public health
Also from a public health perspective it seems more relevant to study dietary patterns instead of individual foods or even nutrients. People do not consume nutrients nor single foods, but combinations of several foods that contain both nutrient and non-nutrient substances. Dietary pattern analysis would thus resemble more closely the real world, in which nutrients and foods are consumed in combination.
Studying dietary patterns could have important public health implications because the overall patterns of dietary intake might be easier to interpret or translate into diets. In fact, dietary guidelines depart from dietary patterns. Studying dietary patterns in relation to disease outcomes thus provides a practical way to evaluate the health effects of adherence to dietary guidelines by individuals. It can also enhance our understanding of dietary practice, and provide guidance for nutrition intervention and education.
2.3
Dietary pattern analysis
Dietary pattern analysis has increased substantially in the past two decades and many studies using this alternative method have been published. Two kinds of dietary pattern analysis can be distinguished: beforehand defined dietary patterns and empirically derived dietary
3.
Theoretically defined indexes of diet quality
Theoretically defined indexes of diet quality consist of nutritional variables, most often foods and/or nutrients, that are grouped according to proposed criteria of nutritional health. The index variables are quantified and summed to provide an overall measure of dietary quality. In order to find publications on diet quality measures PubMed was searched (to June 2004). PubMed is a service of the US National Library of Medicine including over 15 million citations for biomedical articles. These citations are from Medline, a database that contains more than 11 million references to journal articles in the health sciences, and additional life science journals. Key words included diet(ary) quality, diet(ary) patterns, diet score, diet index, food groups, dietary diversity, dietary variety, and Mediterranean diet. In addition references cited were reviewed.
3.1
Rationale and composition
Theoretically defined dietary patterns generally have been created ‘a priori’ or beforehand by a research group in order to rank eating behavior that is assumed to be more or less healthy. The definition of diet quality depends on attributes selected by the investigator and are built upon current nutrition knowledge or theory.
For example, in the past, diets that met needs for nutrients such as protein or selected vitamins and minerals may have been defined as high quality. Given the current focus on reducing the risk of chronic diseases, dietary attributes associated with risk reduction may be considered as contributing to a healthy diet. Indexes often include variables that represent current nutrition guidelines or recommendations.
Instead of dietary guidelines creation of indexes of diet quality can also be based on a diet that has proven healthful. The Mediterranean diet has received increased attention in recent years because of a suggested association with reduced risk of coronary heart disease and several forms of cancer for people consuming such diet (53; 53; 90-93). Several indexes have been developed based on the Mediterranean diet.
Dietary variables contained in the index are generally nutrients and foods or food groups that are assumed to be either healthful or detrimental. In addition to dietary components, dietary variety is also considered to contribute to a healthy diet and can be an individual index item. Frame 3.1 provides an overview of the characteristics of predefined indexes of diet quality.
Frame 3.1: Characteristics of theoretically defined indexes of overall diet quality created beforehand (‘a priori’)
researcher selects attributes:
nutrients, foods or food groups, and/or an indicator of dietary variety built upon current nutrition knowledge
often represents nutrition guidelines or recommendations
or based on diet that has proven healthful (e.g. Mediterranean diet)
3.2
Dietary Variety Scores
Several investigators have used dietary variety on itself to evaluate food consumption by computing a Dietary Variety Score. Generally this score is calculated as the number of different foods consumed over a given period. If food consumption data originate from food frequency questionnaires, all different food items on the questionnaire can contribute to the score. Some researchers however assigned foods to more comprehensive food groups and calculated the score as the number of different food groups consumed.
A modification was proposed by Kant en Thompson (44) who divided foods in nutrient-dense and nutrient-poor (energy-dense) foods and calculated a variety score for recommended foods. Several researchers followed this example and calculated Recommended Food Scores (RFS).
3.3
Existing indexes of diet quality
From the above it may not be surprising that many different predefined indexes of overall diet quality have been constructed. Table 3.1a and b give an overview of existing
theoretically defined indexes of overall diet quality and dietary variety scores. In appendix A the exact composition and make-up of the scores has been summarized for all indexes
mentioned in table 3.1. Several indexes have been adapted and modified by other researchers. These revised indexes have also been described.
The Healthy Eating Index (46), the Diet Quality index (77), the Healthy Diet Indicator (37) and the Mediterranean Diet Score (92) are the indexes that have been referred to and/or validated most extensively.
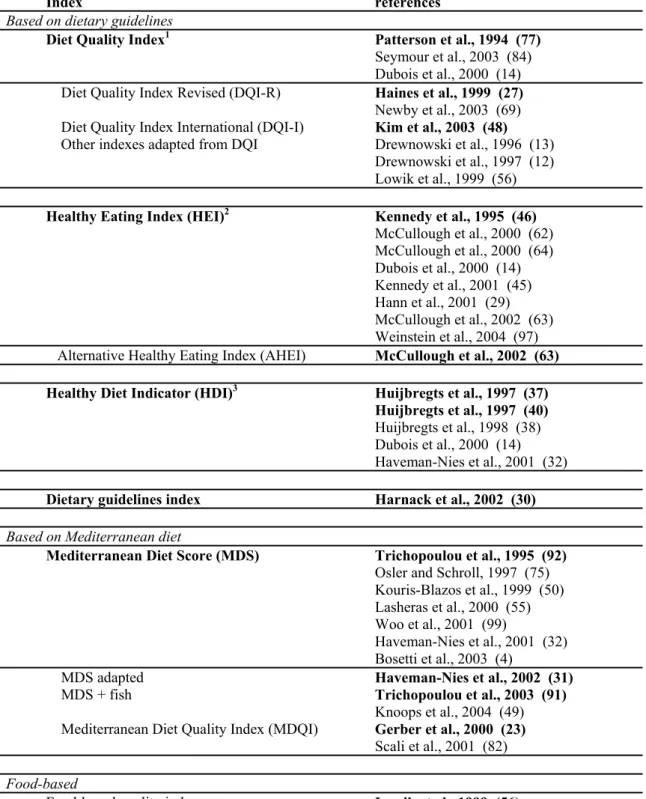
Table 3.1a: Overview of existing indexes of overall diet quality and studies in which they have been used and/or evaluated*
Index references
Based on dietary guidelines
Diet Quality Index1 Patterson et al., 1994 (77) Seymour et al., 2003 (84) Dubois et al., 2000 (14) Diet Quality Index Revised (DQI-R) Haines et al., 1999 (27) Newby et al., 2003 (69) Diet Quality Index International (DQI-I) Kim et al., 2003 (48) Other indexes adapted from DQI Drewnowski et al., 1996 (13)
Drewnowski et al., 1997 (12) Lowik et al., 1999 (56) Healthy Eating Index (HEI)2 Kennedy et al., 1995 (46)
McCullough et al., 2000 (62) McCullough et al., 2000 (64) Dubois et al., 2000 (14) Kennedy et al., 2001 (45) Hann et al., 2001 (29) McCullough et al., 2002 (63) Weinstein et al., 2004 (97) Alternative Healthy Eating Index (AHEI) McCullough et al., 2002 (63) Healthy Diet Indicator (HDI)3 Huijbregts et al., 1997 (37)
Huijbregts et al., 1997 (40) Huijbregts et al., 1998 (38) Dubois et al., 2000 (14) Haveman-Nies et al., 2001 (32) Dietary guidelines index Harnack et al., 2002 (30)
Based on Mediterranean diet
Mediterranean Diet Score (MDS) Trichopoulou et al., 1995 (92) Osler and Schroll, 1997 (75) Kouris-Blazos et al., 1999 (50) Lasheras et al., 2000 (55) Woo et al., 2001 (99)
Haveman-Nies et al., 2001 (32) Bosetti et al., 2003 (4)
MDS adapted Haveman-Nies et al., 2002 (31)
MDS + fish Trichopoulou et al., 2003 (91)
Knoops et al., 2004 (49) Mediterranean Diet Quality Index (MDQI) Gerber et al., 2000 (23)
Scali et al., 2001 (82)
Food-based
Food-based quality index Lowik et al., 1999 (56) Healthy Food Index (HFI) Osler et al., 2001 (73) Osler et al., 2002 (74)
Nutrient-based
Nutrient Adequacy Ratio (NAR/MAR)4 Madden and Yoder, 1972 (57) *Bold: Publication in which index has first been published
1 based on US dietary recommendations
2 based on US dietary recommendations, recommended servings of USDA Food Guide Pyramid 3 based on 1990 WHO dietary guidelines
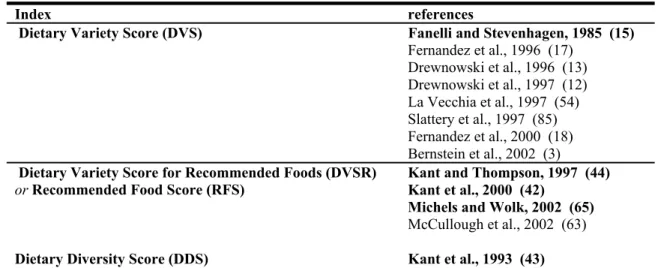
Table 3.1b: Overview of Dietary Variety Scores and studies in which they have been used and/or evaluated*
Index references Dietary Variety Score (DVS) Fanelli and Stevenhagen, 1985 (15)
Fernandez et al., 1996 (17) Drewnowski et al., 1996 (13) Drewnowski et al., 1997 (12) La Vecchia et al., 1997 (54) Slattery et al., 1997 (85) Fernandez et al., 2000 (18) Bernstein et al., 2002 (3) Dietary Variety Score for Recommended Foods (DVSR)
or Recommended Food Score (RFS) Kant and Thompson, 1997 (44) Kant et al., 2000 (42) Michels and Wolk, 2002 (65) McCullough et al., 2002 (63)
Dietary Diversity Score (DDS) Kant et al., 1993 (43) Drewnowski et al., 1996 (13) *Bold: Publication in which index has first been published
3.4
Index components
3.4.1 Index items: foods and nutrients
Dietary variables contained in the index are generally nutrients and foods or food groups that are assumed to be either healthful or detrimental. Some indexes consist solely of food groups or foods (Food-based quality index, HFI), others only of nutrients (adapted DQIs). Most indexes however comprise both food groups and nutrients. Frame 3.2 gives an overview of index components or attributes found to be included in the indexes in Appendix A.
Main food groups included in the various indexes are vegetables and fruits, cereals or grain, and meat and meat products. Some indexes also incorporated legumes, milk and dairy
products, fish, olive oil, bread, potatoes, and cheese. As for nutrients: fat, saturated fat (SFA), or the ratio of mono-unsaturated fatty acids (MUFA) to SFA, cholesterol, and alcohol are included in many indexes. (Complex) carbohydrates, protein, and fiber are comprised in some scores. A few indexes have included the micronutrients sodium or calcium. Also iron and vitamin C can be found in one index. In addition to foods and nutrients, a number of researchers have included a variable representing dietary variety in their index.
The units in which intake is expressed differs between indexes and between nutrients. As intake of total fat or SFA is usually expressed in energy percent, for other nutrients other appropriate units are used. Micronutrients are expressed in micrograms or in percentage of the recommended dietary allowance. Intake of foods can be conveyed in grams, but is often expressed as number of servings.
There seems to exist unanimity on the fact that fat intake should be considered: almost all indexes contain one or more fat-related variable. In Mediterranean indexes the ‘ratio of MUFA to SFA’ is, next to alcohol, the only nutrient-derived variable included. Total fat is included in the majority of indexes, but also SFA and cholesterol are often simultaneously included.
It should be noticed that most indexes have been created several years ago and that nutrition science has not stand still since. There is increasing awareness of the risks associated with high intakes of trans fatty acids (TFA). This variable may therefore also be candidate for inclusion in an index of diet quality.
What accounts for fat also accounts for vegetables and fruit. They are incorporated in the majority of indexes, either grouped together or separately. Some indexes contain an
Frame 3.2: Overview of attributes included in theoretically defined indexes of diet quality Nutrients
fat-related variables: total fat, saturated fat, cholesterol, MUFA/SFA carbohydrates: (complex) carbohydrates, mono- and disaccharides, sucrose dietary fiber
protein
micronutrients: sodium, calcium, iron, vitamin C alcohol
Foods or food groups
Vegetables and fruit: vegetables, vegetables and fruit, fruit, fruit and nuts, legumes, legumes and nuts, etc.
meat (and meat products) cereals or grain
milk (and dairy)
others: fish, olive oil, cheese Dietary diversity or dietary variety Dietary moderation
3.4.2 Dietary variety as an index item
Several composite indexes contain a variable indicating dietary variety. Dietary variety is generally made operational as the quantity of different foods or food groups consumed in a given period of time. As most indexes contain several different foods (and nutrients) only with a varied diet it is possible to score high on all these items. Nevertheless ‘dietary variety’ or ‘dietary diversity’ is additionally included in many indexes.
3.4.3 Assigning foods to food groups
Dietary data used to calculate diet scores can stem from either food frequency questionnaires (FFQs) or from other methods used to collect food consumption data, like diet records or dietary recalls.
Following the choice of the index variables, foods have to be assigned to an item. For many foods this might not be disputable, but nevertheless choices have to be made. It should be realized that the dietary assessment method used influences the outcome. A food frequency questionnaire contains a limited number of foods or food groups, whereas a dietary history is generally more elaborate. As mentioned, also in order to calculate dietary variety the
3.5
Scoring
Once the attributes to be included in the index have been selected, they need to be quantified. Many options exist. Most straightforward is to use a cut-off value for each component and to attribute a score of ‘0’ if consumption is lower than this value (or higher if an unfavorable component is concerned) and ‘1’ if consumption is higher (or lower) than the cut-off. The question remains however how the cut-off value should be chosen. It is also possible to create several cut-offs. Or would it be better to assign a graduate score as the consumption level of a variable becomes more favorable? In addition, it may be justifiable to assign different
weights to the diverse components if a certain variable is assumed to contribute more to a (un)healthy diet than another.
It may be clear that again many decisions have to be made. Although based on current nutrition knowledge, it is finally the (subjective) choice of the researcher. Below, scoring within the various indexes, and thus choices made by the researchers, will be compared.
3.5.1 Choosing a cut-off value
The first step in the quantification procedure is to determine an intake cut-off or range for each index variable in order to distinguish between healthy and less desirable consumption levels. There are different ways to do so.
In Mediterranean indexes the group median intake of each variable serves as a cut-off value. Taking the group median as a cut-off might not seem a rational choice, as it has in fact no relation with a healthy level of intake perse. The advantage however of doing so follows from the definition of ‘median’: half of the subjects will score positively and half will score
negatively on each index item, ensuring that each index item distinguishes well and exactly similar between subjects.
In all other indexes index items are categorized or scaled based on current insights on what is supposed to be a healthy level of intake. Often they are based on dietary guidelines. This approach might seem more appealing. However if for example for a certain food or nutrient intake remains below the desired (cut-off) level for almost all subjects in a group, this index item will not contribute to the scores power of discernment and could just as well be left out. It is therefore likely that researchers do take into consideration the median intake levels for the variables they want to incorporate in their index when assigning intake categories or cut-offs. Cut-off values are therefore generally population specific.
Frame 3.3: The consecutive steps and choices for the researcher in the construction of an index of overall diet quality
Choosing the index items (§ 3.4.1 and frame 3.2) Assigning foods to food groups (§ 3.4.3)
Choosing cut-off values (§ 3.5.1)
Quantifying index components (§§ 3.5.1 and 3.5.2) Weighting index items (§ 3.5.3)
Handling energy intake (§ 3.5.4)
Haveman-Nies et al. have used the MDS to quantify diet quality (32).They have used both Greek medians (GMDS) and study-specific medians (FS-MDS) as cut-offs. Individuals should only score high on the MDS if they do really consume a diet that can be characterized Mediterranean, for the Mediterranean diet has proven ‘healthy’. Therefore it seems
reasonable to use the cut-offs of the Greek population. However, as consumption patterns differ considerably between cultures, using these cut-off values it might not be possible to discern well between individuals. Although mean total GMDS scores for non-Mediterranean populations were considerably lower than mean total FS-MDS scores, the authors did not report a poorer distinguishing power. When relating the diet scores to the individual
components both the GMDS and the FS-MDS appeared reliable indicators of diet quality. In this study the Greek medians were successfully applied as cut-offs for a Western population. This might however not always be the case.
For some indexes the researchers have specified just one cut-off value and positively appraised those individuals with an intake level at the desirable side of the cut-off (MDS, HDI, adapted DQIs, Food-based quality index, HFI). Several other indexes contain for
example a lower cut-off, an intermediate range, and an upper boundary (DQI, MDQI, DQI-R, Dietary guidelines index). A third option was the score for each item to be proportional to the extent to which for example the dietary guideline was met (HEI, AHEI, DQI-I). This may allow the total score to better represent the degree to which the individuals satisfy the
recommendations, especially for those with intakes near the cut-offs. Consequently the range of the score was also increased, instead of ‘0’ or ‘1’ individuals can score from ‘0’ to ‘10’ on an item.
Several indexes that have been adapted from the DQI (12; 13; 56) are essentially similar, containing only the nutrient-components of the original index. All these indexes had a low discriminating power; most persons yielded very low scores and fell within the same (low-score) category. This shows the importance of well chosen cut-offs.
3.5.2 Quantification of variables that are both beneficial and
detrimental
‘Meat’ and ‘dairy’, but also ‘alcohol’, are particularly complex variables. Consumed in moderate quantities they are assumed to be beneficial (or even elemental). However, their intake should not be exaggerated, as high consumption levels are considered unfavorable. Consequently both non-consumers and individual with excessive intakes should have a low or no score on these items. Theoretically one can therefore not confine to a straight cut-off value to categorize consumption of these variables.
Moderate alcohol (especially wine) intake might be protective for cardiovascular disease. Alcohol intake in higher doses is well known to be harmful. High consumption of meat (and meat products) and dairy (products) is thought to be detrimental, because of their relatively high (saturated) fat content and presence of other less favorable substances. For example red meat contains nitrosamines and meat cooked at high temperatures contains other potential mutagens in the form of heterocyclic amines (HCAs) and polycyclic aromatic hydrocarbons (PAHs), consumption of which is believed to increases cancer risk. However, these food groups contribute importantly to our intake of protein and calcium and are generally
recommended to be included in the diet. Omission of these foods from the diet could result in severe insufficiencies for an individual if no major effort is done to compensate. We should therefore take a closer look at how these variables are being quantified.
All Mediterranean indexes, the HEI and the Food-based quality index include the variable ‘meat’. The Mediterranean indexes have a cut-off value (most often the median) and no scoring is awarded if consumption is above this value. In contrast, the HEI departs from a minimum of servings, and consumption below this minimum is not credited, whereas there is no deduction for being beyond this level. Only the food based quality index contains a consumption interval for meat: if consumption falls within a certain range the score is ‘1’, else ‘0’.
Most indexes that do not incorporate meat, do (instead) contain protein. Either a cut-off value is used (DQI) or an interval (HDI) to calculate the score. When dairy is included in the index generally intakes below a certain cut-off value are positively appraised. For the adapted MDS and the Food-Based Quality Index an interval has been determined.
Alcohol has been included in the Mediterranean indexes. It seems that in the original MDS the group median intake is used as a lower cut-off. The adapted Mediterranean Diet Scores have specified an intake range.
From the above it becomes clear that, especially for meat, inconsistency exists as how to handle these items that are considered both beneficial and detrimental. Using an range to assess their intake seems most appealing as in that way both insufficient as excessive intakes are penalized.
3.5.3 Quantification of cereals, vegetables and fruits
Most indexes contain either a carbohydrate rich food group, generally ‘cereals’ or ‘grain’, or they contain ‘carbohydrates’ or a related nutrient. Consumption of cereals, grains or
carbohydrates is generally positively appraised, with no deduction for high consumption levels. Also dietary variety scores generally include the food group ‘grain’.
The HDI has included the variables ‘dietary fiber’ and ‘complex carbohydrates’ for both of which a certain intake range is positively appraised, but both consumption levels below or above this range are not rewarded. However the upper limit for complex carbohydrates is as high as 70 energy percent. For ‘mono- and disaccharides’ the intake ranges from
0 to 10 energy percent.
Thus, there seems to exist agreement regarding the consumption of cereals or grain (products), but also (complex) carbohydrates and fiber. High intake ranges are considered beneficial. Whether to choose for foods (cereals) or nutrients (carbohydrates) also depends on the composition and aim of the index.
Consumption of foods from the vegetable and/or fruit group is generally assumed to be healthful. Intake of fruits and vegetables has been associated with a lower risk of
cardiovascular disease as well as a lower risk of many diet-related cancers, chronic diseases prevailing highly in Western societies. It seems therefore that vegetable and fruit can not be lacking in an index aimed to evaluate overall diet quality.
These index components may however need to be more narrowly defined. Dark green and deep yellow fruits and vegetables, citrus fruits, and tomatoes may be more strongly
associated with reduced risk of many chronic diseases than other fruits and vegetables (87). This distinction is not found in indexes of diet quality.
3.5.4 Energy intake: a confounder
Individuals with high energy needs and consequently a high total consumption will more easily meet requirements for a number of food group servings or a specific cut-off value. They may therefore have a high index score, whereas relative to their needs their
consumption may not be more balanced or in the desired direction. Fat consumption does not pose a problem in this respect, as it is expressed in energy percent. But intake of other
variables does generally not account for energy intake. Dietary variety faces the same problem. Individuals with high intakes will more easily consume a larger variety of foods. Some scores have allowed for energy intake. Calculating the MDS, intake of each component is adjusted to daily intakes of 2500 kcal for men en 2000 kcal for women. The HEI and DQI-R have handled this issue in a different way. In these scores the recommended number of servings depends on recommended energy intakes. For all index items scores reflect intake as a proportion of the number of servings recommended for the appropriate energy intake level, based on sex and age. Three energy intake levels have been discerned following the 1992 US Food Guide Pyramid.
3.5.5 Mutually weighting the individual index components
Another complex and important issue, but not frequently addressed, is the relativecontribution, as determined by the researchers, of the different index items to the total score. In most indexes all individual variables have the same weight, i.e. they contribute equally to the total score. It is not plausible though that all index variables do have the same health impact. It seems therefore better to ascribe greater weights to those items that affect our health to a greater extent.
However, to be able to correctly do so, information is needed on the individual health effects of the index items and especially on their relative impact. Not only is ‘health impact’ a complex concept, as many different health outcomes can be considered and the various dietary factors are related to different health outcomes. It is extremely difficult to do statements on the relative contribution of different dietary components to health outcome. In this respect it should also be noted that many indexes include several items encompassing ‘similar’ or strongly correlating dietary variables, so that in fact these variables contribute more heavily to the score. This is for example the case for dietary fat. Some indexes include more than one fatty variable, for example ‘total fat’ and ‘saturated fat’. Additionally high consumption of some foods (e.g. meat) can be negatively appraised, to a large extent due to their fat content.
An additional remark concerns the contribution of the individual items to the discriminating power of the total score. The discrimination power depends on the extent to which the constructed variables can distinguish between individuals, as has been discussed previously. This aspect however does not only determine the discriminating power of the index score, but also influences the relative contribution of the individual variables to the total score.
From the indexes described in appendix A only the Diet Quality Index International (DQI-I) has contributed different weights to their variables (48). The authors of the DQI-I do not argue how they have come to the attribution of a score for each of the four discerned main categories and thus how they have assessed their relative importance. They only state that ‘current worldwide and individual national dietary guidelines… provided a basic rationale for the construction of the DQI-I’ .
The Dietary guidelines index1 may seem to have differently weighted its attributes, however ‘the scoring system was based on the premise that each major guideline should contribute equally to the total dietary guidelines index score’ (30).
It is a shortcoming that most researchers have not well addressed this topic concerning the relative importance of the individual index attributes and therefore their relative contribution to the total score.
1 The Dietary guidelines index also contains non-dietary variables (‘Aim for fitness’), and therefore actually falls outside the scope of this report. However, because of its interesting construction, and to be complete, it has been included.
Although it is deemed essential to consider the relative effects of the individual index items, it is very tricky to substantiate choices for different weights of the attributes. Yet, deciding to leave out such weighting, because of the complexity discussed above, will result in equal weights for all index components. And that is also a choice that needs to be accounted for. One way to weight the index items could be to let the weights depend on the size of the items association with morbidity and/or mortality. However, the exactness with which associations can be determined based on study results is questionable and might for some foods or
nutrients be more reliable than for others. But more important, ‘la raison d’être’ of an index of overall diet quality is not taken into account when individual foods or nutrients are
considered: existing correlations and interactions between the individual dietary components.
3.6
Composing an index of overall diet quality: conclusions
Composing an index of overall diet quality involves many choices for the researchers.Choices are related to the variables or index items to be included, the cut-off values, and their scoring (frame 3.3).
The first question that may arise is whether it is actually possible to sum the extent to which a desired intake level of fat is satisfied with that of cereals or alcohol for instance. Who finds this approach irrational may consider indexes of overall diet quality not relevant to assess diet quality. However, although skepticism is understandable, the only alternative is doing what has been done for years: relating individual nutrients and foods to disease or other health outcomes. And as discussed earlier, this approach has many limitations. Indexes of diet quality might therefore be a good endeavor to consider the diet as a whole.
The question remains of course what the best approach would be. How can overall diet quality be quantified best? Several indexes have been proposed (summarized in appendix A). As many choices have to be made, a large degree of subjectivity exists.
However the various indexes have similarities. Based on these similarities it can be concluded that some agreement exist upon the index components to be included. Indexes generally contain one or more fat-related variables, several food groups: generally cereals or grain, vegetables and/or legumes, fruits, and sometimes meat, or, if not, protein.
In addition dietary variety may be a relevant component of the score. Its operationalization should however be well contemplated.
Inclusion of macro-nutrients like total fat and carbohydrates or protein seems sound to ensure that consumption is overall balanced. It would not be necessary to include all three
macronutrients as they are complementary. SFA, or the ratio of MUFA to SFA, but also alcohol and cholesterol are included because high intakes are regarded deleterious. Most
other components are considered beneficial and intake should therefore exceed a specified level. If the index consists of a sufficient number of dietary components it also implies that the diet should be varied, because otherwise intakes for all the specified index items cannot be satisfied. Inclusion of micronutrients seems less defensible as translation into consumption patterns is difficult. Besides it undermines the base of the idea of considering the diet as a whole.
We therefore think that a diet quality index should be merely food-based. Such index is also more practical if it is aimed to be a tool that should ultimately lead to intervention or health education purposes. A few macronutrients could be included to assure the diet to be overall balanced, and a few nutrients that are regarded fairly deleterious may also be comprised. Except for the Mediterranean indexes most indexes are based on dietary recommendations. Both the DQI and the HEI are based on US guidelines and composition and cut offs are therefore alike. Cut-off values for total fat (30 E%) and saturated fat (10 E%) are the same for almost all indexes.
The choice for the cut-off also depends on what the index is used for. If the objective is to divide individuals in subgroups with different diet quality in order to relate diet quality to health outcome then most important is that the index distinguishes well between subjects. If, on the other hand, it is intended to evaluate the quality of the overall diet, to what extent all dietary guidelines are met and, for example, to discern risk groups for whom diet quality is considerably less than desired, it is important that cut-off values are based upon nutritional knowledge as to what is considered a healthy diet.
Using an intake range instead of a simple cut-off to appraise intake levels seems appealing, especially for those foods or nutrients that are essential or beneficial in lower quantities, but detrimental if intakes become too high. In a way this may account for most items, as
excessive intakes are seldom healthful.
Total consumption or energy intake may be an important confounder and its influence should therefore be seriously considered. A possible way to handle this problem is to let the intake cut-off, or intake range, depend on energy intake or to adjust intake of each component to specific daily energy intakes.
Furthermore the relative weights of the individual index components should be addressed and the researcher should defend his or her choice. Although this is an arduous task, it is highly important and may determine to a large extent the index’ predictive capacity, and
4.
Predefined dietary patterns and health outcomes
Chapter 3 has provided an overview of predefined indexes of overall diet quality. Several existing indexes have been summarized and their composition, and thus the choices of the researchers have been discussed. Although it can be argued that some choices are more rational than others, composing an index remains a complex matter with a large degree of subjectivity. Therefore validation of the indexes is desired.
To gain insight into the validity of the various indexes, thus the extent to which they are able to distinguish between individuals, the indexes can be related to either nutrient adequacy or health outcome. In this chapter results of validation studies will be discussed.
It should first be mentioned that results from the various studies are difficult to compare. Exact values but also significance of the relative risks depends largely on the testing procedure, especially the variables adjusted for. Reported associations between diet quality and mortality in some studies may be greatly attenuated if additional potentially confounding factor were taken into account. Also the way in which energy intake has been dealt with may influence the results. In addition interpretation and presentation of the results differs
considerably between researchers. In some studies relative risks are reported for example for the lowest versus the highest quintile of index score, whereas in others relative risks are given for a certain increment in score. Furthermore some authors report ‘strong associations’ or ‘high predictivity’ whether others may report ‘marginal predictivity’ with similar results.
4.1
Socio-demographic factors and nutrient adequacy
Diet scores have been related to socio-demographic factors, nutrient adequacy, and health outcome. Female gender, older age, and higher income or education were generally predictors of better diet scores.
Six studies have examined associations between biological markers of dietary exposure and diet quality. Sixteen studies have related diet scores to overall and/or cause-specific mortality. An overview of studies that have examined associations between overall diet scores with nutrient adequacy and health outcome and their major findings is given in appendix B.