RIVM report 350030005/2005
Post Launch Monitoring of Functional Foods Methodology development (II)
N de Jong, EJM Buurma-Rethans, HP Fransen, MC Ocké
This investigation has been performed by order and for the account of the Ministry of Public Health, Welfare and Sports, within the framework of project V/350030, Functional Foods: PLM and consumption.
RIVM, P.O. Box 1, 3720 BA Bilthoven, telephone: 31 - 30 - 274 91 11; telefax: 31 - 30 - 274 29 71 Contact:
N. de Jong
Centre for Nutrition and Health Nynke.de.Jong@rivm.nl
RIVM report 350030005 Page 3 of 109
Abstract
Post Launch Monitoring of Functional Foods: Methodology development (II)
Despite the availability of numerous cohort and monitoring studies in different populations in the Netherlands, the available information on functional food and/or supplement use on the whole from these studies is rather limited. Unfortunately, food intake data are vital for Post Launch Monitoring (PLM) of functional foods. Data gathered within the framework of the Dutch National Food Consumption Survey (DNFCS) appear most appropriate for signaling purposes – a first step in PLM. It will be important for future national surveys to provide individual links to other registries and to focus the survey on, among others, special target and risks groups for functional food consumption and supplements. Collecting
additional nutritional and health status information and further development of nutrient databases to calculate nutrient intake will be imperative. Two studies were investigated to obtain experience in using the currently available functional food consumption data. In the DNFCS 2003 study with participants aged 19 to 30 years, the total dietary intake by users generally met the recommendations, with folic acid being a frequent exception. The recommended amounts for the phytosterol/phytostanol enriched spreads were not met by the consumers. The VIO 2002 study with children aged 9, 12, and 18 months showed (among users) total dietary intake to amply meet the recommendations. In neither study did intakes generally exceed the safe Upper Levels, with very few exceptions in the 90th
percentile of the intake distributions. Since results are based on observed intakes and not on usual intakes, they are only indicative.
Key words:
Post Launch Monitoring, functional foods, cohort studies, monitoring studies, food consumption
RIVM report 350030005 Page 5 of 109
Het rapport in het kort
Postlaunch monitoring van functionele voedingsmiddelen – methodologie ontwikkeling (II)
Consumptiegegevens over functionele voedingsmiddelen zijn beperkt beschikbaar, ondanks de vele monitoring- en cohortstudies die in Nederland zijn en worden uitgevoerd. Voor het adequaat uitvoeren van postlaunch monitoring (PLM) van functionele voedingsmiddelen en het signaleren van mogelijke problemen echter, zijn op persoonsniveau te koppelen
voedselconsumptiegegevens essentieel. Innemingsdata zoals verzameld in de
voedselconsumptiepeiling (VCP) lijken het meest waardevol. Aandacht is gewenst voor specifieke doel- en risicogroepen voor functionele voedingsmiddelen en supplementen, voor informatie over de voedings- en gezondheidstoestand van de populatie, alsook voor databestanden nodig voor de berekening van de nutriëntenvoorziening.
Twee studies (een bij jongvolwassenen en een bij kinderen van 9, 12 en 18 maanden) zijn nader bekeken op consumptie van functionele voedingsmiddelen. Onder gebruikers bleek de nutriëntenvoorziening (in sommige gevallen ruimschoots) te worden gehaald. Alleen de foliumzuurvoorziening bij jongvolwassenen schoot veelal tekort en de aanbevolen
hoeveelheid van met phytosterolen/-stanolen verrijkte margarines werd niet gehaald. In beide studies werden de veilig geachte bovengrenzen niet overschreden, met uitzondering van enkele overschrijdingen door gebruikers die zich in de bovenste 10 procent van de verdeling bevinden. De resultaten zijn slechts indicatief omdat deze bevindingen zijn gebaseerd op de waargenomen inneming en niet op de gebruikelijke inneming. Trefwoorden:
Post Launch Monitoring, functionele voedingsmiddelen, cohort studies, monitoring studies, voedselconsumptie
RIVM report 350030005 Page 7 of 109
Contents
Summary 9
1 Introduction 11
1.1 Background 11
1.2 Demarcation and approach 12
2 Dietary assessment methods 13
2.1 Introduction 13 2.2 Methods 13 2.3 Results 15 2.3.1 Functional foods 15 2.3.2 Supplements 19 3 Case study 1 21 3.1 Approach 21
3.2 Results and discussion 22
4 Case study 2 27
4.1 Approach 27
4.2 Results and discussion 28
5 Discussion and conclusion 35
5.1 Methods 35
5.2 Timeframe 36
5.3 Practical issues 37
5.4 In summary 37
5.5 Outcome of the 1st case study 38
5.6 Limitations of the 1st case study 39
5.7 Outcome of the 2nd case study 40
5.8 Limitations of the 2nd case study 40
Acknowledgements 43
Literature 45
APPENDIX I: Overview of the cohort and monitoring studies 47
APPENDIX II: Intake tables based on the Dutch National Food Consumption Survey 2003 65 APPENDIX III: Intake tables based on the Dutch Nutrient Intake Study 2002 79
RIVM report 350030005 Page 9 of 109
Summary
Despite the availability of numerous cohort and monitoring studies in different populations in the Netherlands, on the whole the information on functional foods consumption available from these studies is rather limited. Several causes should be mentioned within this respect: among others an obvious delay in getting accurate data due to a fast changing supply and consumption of these types of foods. Also, the limited number of consumers of functional foods and the limited consumption data (e.g. only frequency of consumption is recorded and not the absolute amount of intake) do not contribute to a solid database within this respect. Unfortunately, food intake data are vital for the execution of Postlaunch
Monitoring (PLM) of functional foods. Data gathered within the framework of the Dutch National Food Consumption Survey (DNFCS) appear to be most appropriate at this stage. For future national surveys it will be important to link these data to other registries on an individual level. Also, it will be important to focus the survey on special target and risks groups for functional food consumption.
To obtain experience with the available data, two studies have been investigated more thoroughly: the DNFCS 2003 and the VIO 2002 (Nutrient Intake Study). In the DNFCS 2003 the study participants were aged 19 to 30 years. In this study the recommended dietary allowances were generally met, however in several cases the folic acid
recommendations and the recommended amounts for the phytosterol/-stanol enriched spreads were not met by the consumers. In general, the total dietary intake did not exceed the safe Upper Levels. One exception on this was observed: women finding themselves in the upper part of the distribution (P90) using micronutrient enriched margarine exceeded the limits for calcium and vitamin A in the two days their food had been recorded. The VIO 2002 was performed in children aged 9, 12, and 18 months. Again the total dietary intake among the users amply met the recommendations and in general the established safe Upper Levels were not exceeded with a few exceptions for vitamin A and zinc intake in especially the upper ten percent of users. However, final conclusions on this cannot be drawn as for both studies a few remarks are in place for interpretation purposes: the data presented in this report may not be as representative as we would have liked as usage numbers of functional foods are sometimes fairly low. Also, the figures presented in this report are based on two days of recording and not on usual intake figures. In case usual intake figures would be at disposal the upper and lower ends of the distribution would become less extreme and thus the observations in the P90 category would be influenced. On the other hand, supplement use could not be taken into account which could have led to an
underestimation of results among specific users. The results are therefore only indicative for future topics of monitoring for future admittance policy.
RIVM report 350030005 Page 11 of 109
1
Introduction
1.1 Background
Consumption of functional foods may constitute beneficial health effects which are often communicated by manufacturers through specific claims accompanying the product. Nevertheless, potential safety hazards of functional food consumption should not be disregarded: e.g. health issues through risks of over consumption of specific ingredients, the risk of interaction effects with other nutrients and/or active constituents in drugs, unclear long-term effects, or potential harmful effects in specific risk groups within the population. The manufacturer is responsible for the safety of the specific marketed product, whereas the government has to protect public health, and is therefore responsible for the safety of the overall food supply for the whole population. A Postlaunch Monitoring (PLM) system may be needed in order to carry out this governmental task with respect to
functional foods, as not all possible adverse effects will be predictable based on the
information assessed before market introduction of a new functional food. The objective of a PLM system is to systematically monitor (unexpected) health effects of functional food consumption after marketing and under customary conditions of use. On commission of the Dutch Ministry of Health, Welfare and Sport, we presented a theoretical proposal for a PLM methodology in an earlier report (3). Special attention has been paid to the theoretical necessities of such a system. Also, in this earlier report an inventory was compiled about available cohort and monitoring studies that might constitute suitable data for PLM purposes.
In short, PLM may consist of the following phases:
a) passive signaling of consumer complaints through for example consumer care telephone lines;
b) active signaling of hazardous effects based on active investigation of (pre- and postmarket) research data;
c) assessment of the relevance of the data from a and b;
d) quantification of the hazardous effects on a population (group) level;
e) balancing the beneficial (positive) and the hazardous (negative) effects, i.e. risk-benefit analyses;
f) regulation.
Investments in the organisational structure will be necessary to establish decision-making criteria for the different phases of PLM as to whether to proceed to a next phase. Besides, expert committees for assessments, and methods and frameworks for data analyses, scenario building and modeling techniques are to be established. And last but not least the
Page 12 of 109 RIVM report 350030005 item ‘who is responsible for what’ should be addressed for each PLM phase. For a detailed description of the different phases, the challenges and necessary investments we would like to refer to this earlier report (3). Once a theoretical PLM framework has been agreed upon, a case-by-case approach is advised in order to test and evaluate the suitability of the
system, and to be able to adapt the system if necessary in due course.
To further build the PLM structure and to extend our experience for PLM related activities, we will focus in this report on a detailed description of the dietary assessmentmethods of the available Dutch cohort and monitoring datasets that may suit the PLM related activities. In addition, we will describe two case studies in which the exposure to functional foods and/or functional ingredients in subgroups of the Dutch population has been assessed. With the execution of these case studies a methodology will be investigated to further assess the ranges of intake and the associated risks on excess intake of functional foods in parts of the population. Moreover the boundaries of what can be explored in the currently existing databases will be sought.
1.2 Demarcation and approach
For our inventory on and evaluation of data availability and dietary assessment methods (chapter 2) we kept in mind two types of novel foods, i.e. those with specific bio-active components and the exotic foods. Also, we have taken into account the enriched foods and the micronutrient supplements. Genetically modified foods and phyto therapeutics have not been taken into account as there are different premarket (EU) regulations for these types of products which may require a different PLM system. Furthermore, we limited ourselves initially to the studies described in our earlier report (3) excluding two studies without any dietary information and including a few additional studies of potential interest. For
readability, we have used the generic terms functional foods and supplements in this report. We investigated in our case studies (chapter 3 and 4), functional food use in general as well as functional ingredient use. In addition we attempted to gather the information from two different datasets, e.g. one in-home and one external, in order to obtain experience on the accessibility of different types of data. In these case studies we did not focus on supplement use, as this is a topic with again special difficulties regarding the availability of data. This will be described in an analogous RIVM report by Ocké et al. (15) on the data availability of supplement consumption in the Netherlands on commission of the Dutch Food and Consumer Product Safety Authority. Our report is finalized in chapter 5 with our concluding remarks.
RIVM report 350030005 Page 13 of 109
2
Dietary assessment methods
2.1 Introduction
The important goals of the inventory on dietary assessment methods used in the Dutch cohort and monitoring studies were a) to gather knowledge about what data are available in the Netherlands in general and b) to find the appropriateness of these existing data for PLM purposes. For these monitoring purposes one is especially interested in those parts of the population distribution that reach upper or lower limits; e.g. excess intakes or inadequacies. However, available dietary data are often limited with respect to exposure information on functional foods and/or supplements. Either there is insufficient information with respect to the frequency or amounts of intake of functional foods or supplements consumed and/or there are no or insufficient up-to-date nutrient databases available to calculate the daily nutrient intake delivered by functional foods or supplements. Another limitation often encountered is the low number of users of functional foods or supplements in the various studies, which makes it impossible to study the specific users as a separate group of interest. Because of these power problems only cohort and/or monitoring studies of respectable sample size are of interest for PLM purposes. To overcome gaps in our
knowledge concerning the dietary data, the use of biomarkers has been suggested to assess nutrient intake and status of specific functional food and/or supplement users (6). An important drawback of using biomarkers is that for many functional food ingredients there are no or unspecific biomarkers available. Furthermore, the source of the active ingredient will still be unknown and also only very few biomarkers truly represent absolute levels of intake. In addition gathering, storage, and analyses of blood samples also introduces a lot of practical, financial, and ethical hurdles. It seems therefore that up till now, the use of
thorough food consumption data is the best alternative for general purposes. In special cases, these data may need to be completed with biochemical data. In this chapter we will give an overview of potential datasets suitable for PLM purposes with respect to dietary intake.
2.2 Methods
The starting point of our inventory was the overview of cohort and monitoring studies presented in the appendix of our earlier report (3). Three extra studies have been added to the original overview, namely the VIO (Nutrient Intake Study 2002 (in Dutch:
Voedingsstoffen Inname Onderzoek), the Dutch Health Care Consumer Panel (NIVEL/Consumentenbond) survey performed in 2000, and a Survey on Food
Consumption of allochtonous Population (TNO). The VIO study has been performed in 2002 by TNO among children of 9, 12 and 18 months of age on commission of the Dutch infant feeding company ‘Nutricia’ and contains quite some detailed information about the
Page 14 of 109 RIVM report 350030005 nutritional intake of the study group (1). The Dutch Health Care Consumer Panel survey has been performed in a representative sample of the Dutch adult population in 2000. The survey focused on opinions on functional foods and supplements and subsequently recorded frequency of usage of some functional foods and supplements (2). Two other surveys (GLAS and POLS) have been excluded for this report as no dietary data were available from these studies.
In theory the ideal intake dataset should contain the following information: 1) For a specific functional food:
- Exact identification of the functional food (contents, physical appearance, brand name etcetera);
- Frequency of usage/pattern of usage; - Amount used;
- Details on the nutrients/ingredients delivered by the functional food; - Details on the background diet.
2) For a specific supplement:
- Method of questioning, as this may vary considerably among different studies;
- Exact identification of the supplement (contents and physical appearance, brand name, standard supply unit etcetera.);
- Frequency of usage/pattern of usage; - Amount used;
- Details on the nutrients/ingredients delivered by the supplement; - Details on the background diet.
3) In general:
- Demographic descriptors;
- Preferably: nutritional and health status descriptors;
- Biochemical indicators or access to blood samples to determine biochemical indicators of potential PLM interest.
With respect to the frequency of usage one might be interested in the usual intake, in the actual (observed) intake, or in both, depending on the question to be answered, but in general data on usual intake may be preferred for monitoring longer term purposes. Through further reading of the available literature on the particular studies and contacting the responsible persons for the particular studies more detailed information on the dietary assessment methods was gathered. With this knowledge at our disposal we could retrieve and describe the data that can be calculated from the available studies. The main topics of our investigation were the items described above at 1) and 2). The type of information mentioned at 3) has been briefly described in our earlier report and was not the topic of research of the current report.
RIVM report 350030005 Page 15 of 109
2.3 Results
2.3.1 Functional foods
In Appendix I an overview is given of our inventory on the cohort and monitoring studies that might be of use for PLM purposes. Apart from the general study descriptors about the name of the study, the executive research institutes involved, year(s) of study, population descriptors and a general description about the methods used, specific information is retrieved on details of the background diets, functional food use and supplement use (among others information on type of products, brand names, frequency and amount of usage).
In general, studies on dietary assessment are to be distinguished in methods either
investigating the observed intake on the short term (recalls or records) or the (usual) long term (food frequency questionnaires or dietary histories). These methods have been described in Appendix I in the fourth column. Another classification of the different methods could be the distinction between open methods (every item will be recorded: this is the case in recalls, records and dietary histories) or closed methods (food frequency questionnaire: only a limited number of foods are of interest). The closed method has been covered in our table by describing the foods of interest in a particular study either in the table or in the footnotes.
It appears from this table in Appendix I that the number of studies constituting any information on functional food use is rather limited. Below we will discuss the most important studies in the light of PLM purposes.
Dutch National Food Consumption Survey
The Dutch National Food Consumption Surveys (DNFCS, 1-3) still remain the most valuable and complete source of information with respect to food intake in the general population. Many reports have appeared that describe the results of these surveys, among others (4). The first three surveys have used a 2-day dietary record which supplies us with information on the actual intake of food. For a limited number of food groups a food frequency list has also been collected. The three surveys have been performed over 10 years; i.e. 1987/88, 1992, and 1997/1998. It is anticipated that functional food use during these years was not very common. The DNFCS 2003 has been performed more recently, but in a limited study population (men and women aged between 19 and 30 years) and has used the 2x24 h recall method which again retrieves a lot of information on the actual intake by an open method of questioning.
Page 16 of 109 RIVM report 350030005 For PLM purposes, the most important drawbacks of these surveys are the limited
background information of the participants (on socio-demographic details and/or health and nutritional status), the cross-sectional character of the surveys, the limited number of functional food users, and the limited information on frequency of usage, and thus usual intakes. Under certain conditions the observed intake can be reverted to usual intake with special computerisation methods. However, for functional food use which is characterised by erratic use or no use the calculation from observed to usual intake might be a problem. The addition of focused (functional) food frequecy lists would therefore be an advantage within this respect. Also, the addition of modules focusing on specific user groups (either target groups or risks groups) would be a strong advantage for PLM.
RIVM related studies
In the RIVM related studies the information as retrieved with the EPIC Food Frequency Questionnaire is predominant (8; 9). Through this FFQ for most foods and nutrients a rather general picture of the dietary intake of the study population is obtained. In the category of spreads, cooking oils and fats, the so-called functional food bread spreads of the
phytosterol/-stanol enriched type (e.g. Benecol® and Becel pro.activ®) have been coded separately in this questionnaire. Studies that have used this EPIC questionnaire deliver information on the frequency of use as well as the amounts used for consumption for bread spreads. Participants are asked to tick the type of bread spreads they most commonly use. The phytosterol/-stanol enriched bread spreads could be recorded by the participant as a special type. The type of information on these bread spreads is quite useful for PLM purposes as amounts and frequency of consumption are available. Also, in many RIVM related studies detailed background information on study participants is available, e.g. socio-demographic details, details about the nutritional and health status and some biochemical parameters. The disadvantage of the EPIC FFQ is the fact that the list is not flexible: other types phytosterol/-stanol enriched foods that have appeared on the market in the meantime are not and cannot be included. Also information on other functional foods cannot be retrieved from this questionnaire. Power problems with respect to a low absolute number of functional food users also remain a difficult issue in these surveys.
There are a few studies that have used a different method to investigate food intake: the Zutphen Elderly Study, the PIAMA study, and the MORGEN calibration study. With respect to the first, the Zutphen Elderly Study, a small part of the study population has filled out a 3-day dietary record which should also contain functional food information on portion sizes during those 3 days (but not on frequency of use), if participants had been using those. However, the latest follow-up has been in 2000 and it is anticipated that these very old men have not been major users of these types of food at that time.
The PIAMA study contains very limited general food frequency information of children born in 1996/97. In the questionnaires special attention is paid to the frequency of use of probiotics in addition to the use of organic and ecological food products from 2004
RIVM report 350030005 Page 17 of 109 onwards. Data collection is still ongoing at the time of writing of this report. Again no information on amounts daily consumed will be available in the PIAMA cohort. The advantage of this study is that longer term detailed information is available on the demographics and health status of the children involved.
The calibration part of the MORGEN study performed by RIVM also supplies us with detailed food intake information based on 24 h recalls. This again implies that a lot of information should be available on absolute intake levels during those days of recalling, however the lack of frequency data hampers an easy extrapolation to usual intakes for individuals. Unfortunately, the calibration part of the study has only been performed in 1995 until 1997, a period in which the consumption of functional foods had not been established firmly. The MORGEN study has been continued in Doetinchem, Maastricht, and Amsterdam. In these follow-up studies the EPIC food frequency questionnaire has been used with again frequency information about phytosterol/-stanol enriched bread spread use only.
External studies
With respect to the external studies there are a few that have used the same EPIC food frequency questionnaire (CoDAM, Hoorn, Prospect-EPIC (Utrecht cohort) that retrieves dietary data in general as well as information about phytosterol/-stanol enriched bread spread use as described above. Initially, the Prospect-EPIC study (Utrecht cohort), and then especially the calibration part of the overall study supplied us with detailed food intake information based on 24 h recalls. Again, this calibration part of the study has only been performed in 1995 until 1997, a period in which the consumption of functional foods had not been established firmly. The overall Prospect-EPIC study is still ongoing, but only uses the EPIC food frequency questionnaire with again information about phytosterol/-stanol enriched margarine use only. The latter accounts for CoDAM and Hoorn as well.
The Generation R study contains limited information on functional food intake of pregnant mothers (type of bread spread, breakfast drinks, dairy products with extra calcium and vitamins, sweeteners and sports drinks), and their offspring (type of bread spread). The disadvantage is that only food frequencies have been questioned. There is no information on brand names (bread spreads excluded) and amounts of consumption. The Generation R study has only started recently and data from this study are not available yet. The same accounts for the ABCD study. This study on pregnant women and their offspring has also started only recently. Questionnaires used in this study however do not retrieve any information on functional foods.
The cross-sectional Dutch Health Care and Consumer Panel study retrieves information on the frequency of use of a few specific functional foods: i.e. yoghurt with lactic acid
bacteria, cholesterol lowering bread spreads, vitamin/mineral enriched syrups and sweets and foods enriched with calcium. Also a few indicator questions on background diet have been included in order to categorise participants in healthy or unhealthy eaters.
Page 18 of 109 RIVM report 350030005
There are a few studies with potentially more information on dietary intake in general and functional food use. These concern the AGAHLS (the Amsterdam Growth and Health Longitudinal Study), the SENECA study and the VIO study. The AGAHLS performed by the EMGO VUMC is a longitudinal study which started in 1977 with measurements in children at 13 years of age. The last measurement has been performed in 2004 with the children having grown into adulthood (aged late thirties/early forties). Detailed information about actual and usual food intake is available through usage of the cross-check dietary history method plus 24 h recalls. Through these measurement methods, information on portion sizes is available. In this study, information on socio-demographic variables and health and nutritional status has been documented, which is important for future PLM purposes. Another strong advantage of this study is it’s longitudinal character. At the time of writing of this report the 2000 data of the AGAHLS study were available. Analyses of these data seemed, however, not to be a fruitful option yet as the launch of most enriched foods and other functional foods happened after this time period.
The next study of interest is the SENECA study, performed in elderly people by WUR during 1988/89, 1993, and 1999. A special dietary history method has been used in which 3-day dietary records were completed with a special checklist. Potentially, information on amounts consumed and frequency of consumption, and thus observed and usual intake should be available. The drawback of this dataset is that for the final measurement which has been performed in 1999, only a checklist of foods has been used. In addition, the dataset has already been gathered 5 years ago, and the year 1999 accounts for a time period in which functional food consumption in elderly people had not yet been established firmly. Positive aspects of the SENECA study for PLM purposes are the longitudinal aspect and the fact that a lot of background information is available about the study participants. The last study of potential interest is the VIO study performed in 2002 by TNO.
Approximately, 900 children aged 9, 12 and 18 months have been included and parents have filled out a 2-day dietary record. This implies the availability of actual data on amounts consumed, but no data on usual consumption. It must be remarked that this study concerns a very specific age group within the total population which might be an advantage as well as a disadvantage. The dataset is unique in its sort and provides us at least some information on functional food use in this vulnerable group. The disadvantage of this study is that detailed background information on nutritional and health status of the children has not been gathered. Also the data are gathered on commission of an industrial partner which implies some restrictions with respect to further data-analyses.
In many other studies (the Dutch National Survey of General Practice, LASA, Utrecht Health Monitoring Study – Leidsche Rijn Gezondheidsproject, Netherlands Twin Register, PGO-peilingen, Vitamins and foods supplements 2003) only very limited information on dietary intakes have been gathered and no specific information on functional food use
RIVM report 350030005 Page 19 of 109 appeared to be available. In a few other studies (ERGO and ERGO plus, GLOBE, Monitor VGZ, NLCS, REGENBOOG) details about functional bread spreads, cooking oils and fat appears to be available at some extent in addition to general dietary information based on FFQ or in the cases of Monitor VGZ only a few focused questions.
2.3.2 Supplements
The situation for supplements may appear to be somewhat brighter (Appendix I), however, in general, a very basic route of questioning has been applied (taking supplements: yes or no, during the year or in wintertime). This type of questioning does not reveal information on amounts and frequency of use. As a consequence in many cases it is not possible to calculate the nutrient intake derived from these supplements without making assumptions. If standard or median amounts of consumption of supplements are taken as an assumption one may be able to rank subjects as has been done in the RIVM report ‘Ons eten gemeten’ (11), but for detailed monitoring purposes one would need additional information as described in paragraph 2.2. Below we will discuss briefly the main observations with respect to the availability of supplement usage data based on the table in Appendix I. For further details and discussion on supplement usage in the Netherlands we would like to refer to an analogous RIVM report by Ocké et al. (15).
Dutch National Food Consumption Survey
Again a good source of information on observed intake figures on a population level is the Dutch National Food Consumption Survey. The method of investigation (dietary record or 24 h recall) leaves room for a detailed recording of supplement intake. However, the same disadvantages as for functional foods intake account for the supplement intake. In addition the Dutch food composition database (in Dutch: NEVO tabel (13)) does not contain
information on the contents of the available supplements. As such a special database has to be constructed, and as a consequence at the time of writing of this report intake data on supplement use from this survey were not available.
RIVM related studies
RIVM related studies and external studies that have used the EPIC food frequency
questionnaire (see Appendix I) have detailed information on vitamin C and E consumption and otherwise have some frequency information (e.g. number of tablets per day/per week/ per month/per year) on 10 other (multi)vitamins and minerals, garlic and lecithin
supplements (Appendix I). Another RIVM related study that has partially focused on supplement intake is the PIAMA study. Frequencies of intake of multivitamins, vitamin A, C, D and E had been recorded for the children participating. In REGENBOOG open ended questions on actual use have been used in the medical questionnaire which might provide information of sufficient detail.
Page 20 of 109 RIVM report 350030005
External studies
With respect to the external studies, the ABCD study has focused on supplement use by (pregnant) women and their offspring and will continue to follow the children. Again no frequencies and/or amounts of supplement use have been recorded in this study. The same accounts for the Generation R study which focuses on the same study population. As stated before, the Generation R study as well as the ABCD study only started recently and the complete data are not available yet. The VIO 2002 study has asked about usage (yes/no) with the help of a list of vitamins and minerals. The cross-sectional Dutch Health Care and Consumer Panel study retrieves information on the frequency of use of a few supplements: multivitamin/-mineral supplements, calcium supplements, and Echinacea supplements, but does not retrieve a lot of information on all other sorts of aspects of PLM interest. The investigation of TNS-NIPO on vitamins, minerals, fibre, garlic and herbs retrieves some information on household level and also questions about which members of the household actually use supplements, however the principal goals of this study was to check
knowledge and possession of supplements in addition to usage frequency. Additional information is lacking.
A rather detailed picture seems to be available from the ERGO-plus study on elderly people from EUR. Usage during the last 12 months has been recorded together with brand name, amounts and frequencies. The NLCS (National Cohort Study on Diet and Cancer) from TNO/UM has asked about supplement usage over the last five years and also provides information on the amounts used and on brand names. Calculation of nutrients derived from supplements is therefore possible with this dataset, though the five year period is too long to get information of sufficient quality. Then again the Prospect-EPIC calibration study (UMCU/RIVM) has detailed information on supplement usage based on a 24 h recall. But again this study has only been performed in 1995 until 1997, and is therefore already rather ‘outdated’, in the fast changing field. The overall Prospect-EPIC study is still ongoing, but only uses the EPIC food frequency questionnaire with limited information on supplement use (see above).
Last but not least the SENECA study of WUR should be mentioned again. This study in elderly people has used a special dietary history method consisting of a 3-day dietary record completed with a food checklist. Apparently, the food checklist provides frequency data on supplement use. The combination of both methods should enable us to calculate the amounts of nutrients derived from supplements based on true data. The problem of this dataset is that for the final measurement which has been performed in 1999, only a checklist of foods has been used.
In several other cases no supplement usage information has been gathered at all (i.e. PGO peilingen, Monitor VGZ, Netherlands Twin Register, GLOBE, Dutch National Survey of General Practice, AGAHLS).
RIVM report 350030005 Page 21 of 109
3
Case study 1
In our first case study we took the most recent Dutch National Food Consumption Survey (2003) as database. This database contains the most detailed and most recent information on functional food and supplement use (see also the table in Appendix I) in the Netherlands at the moment. Our case study was an exploratory examination about the ‘state-of-the art’ of functional food use in the target group of the survey: i.e. 750 men and women aged 19 to 30 years. For the Dutch National Food Consumption this age group was chosen for various reasons which were not specifically related to functional food use (10). Nevertheless, it was anticipated that functional food use was also prevalent in this age group.
3.1 Approach
In first instance, an overview was compiled of which functional foods had been recorded during the 2 x 24 h recalls. In total, 83 different codes for functional foods were
distinguished, with the ‘diet’ products included (5). Accordingly, we have checked the Dutch Food Composition Table 2001 on actuality and correctness of the nutrient data for the functional foods of interest by checking the actual labels of the products and consulting of the manufacturers involved. Especially in this fast changing area, the contents of
products are continuously changing and in some cases products were very new and were not part of the extended 2001 Food Composition Table. Also the contrary could have happened: products that were coded during the survey last year, were already removed from the market at the time of writing of this report. We made a supplement to the original Food Composition Table 2001 regarding changed contents of some of the enriched
breakfast cereals and of the micronutrient enriched margarine. We excluded the typical products designed for dieting (e.g. meal replacers). Furthermore, we partially excluded three persons that had consumed non-traceable enriched breakfast cereals. These breakfast cereals had probably been on the market for only a short period of time and we could not trace the exact content anymore. Therefore these persons were taken into account in the frequency tables, but not in the tables in which nutrient intakes and percentage of users of functional foods are presented. We defined seven categories of functional foods based on 76 codes: probiotics, phytosterol enriched spreads, enriched breakfast cereals, enriched biscuits and cakes, enriched (fruit) juices, enriched dairy products, and micronutrient enriched spreads. The enriched breakfast cereals, biscuits and cakes, (fruit) juices, and dairy products were enriched with micronutrients and/or fibre. It was decided not to adjust for representativeness as the purpose of this report was to describe the observed functional food users and their intake patterns. We calculated the frequency of consumption and the distribution of intakes (mean, median, 90th percentile) of the seven categories of functional foods based on the recorded data. For two product categories i.e. enriched breakfast cereals and enriched cakes and biscuits the number of male users appeared to be too low to present
Page 22 of 109 RIVM report 350030005 a complete distribution of the intake data. This was in fact also the case for male and
female users of phytosterol enriched margarines. For several added nutrients we have compared the distribution of the intakes with the Dutch RDA (Recommended Dietary Allowances) for this age group and the UL (safe Upper Levels), and have calculated the percentage of nutrients delivered by the specific functional foods compared to the total intake. Based on the details we had, we have described the consumers in comparison to the total population and tried to identify potential risk groups for toxicity.
3.2 Results and discussion
In Table 1 the number of users per functional food category is shown. In Table 2 a
description of the users compared to the total population is presented. From these tables we conclude that 42% of the participating men and 53% of the women used at least one
functional food on one or two days. There was no difference in percentage of users according to age: i.e. the distribution of users in the older age category (25-30 years) appeared to be same compared to the distribution in the younger age category (19-24 years). Totally, 25 males (7% of the total male population) and 41 females (10% of the total female population) used 2 different types of functional foods concurrently (mainly dairy products and fruit juices), and 3 males and 10 females used 3 types of functional foods (all sorts of combinations).
Table1: Number of users of at least one functional food presented in seven categories of functional foods in the Dutch National Food Consumption Survey 2003 (total population: n=750, aged 19-30 years) Type of food Total users (n=356) Male users (n=147) Female users (n=209) Total population (n=750) n %* n %* n %* % Probiotics 59 17 26 18 33 16 8 Phytosterol enriched spreads 12 3 6 4 6 3 2 Breakfast cereals** 19 5 6 4 13 6 3
Biscuits and cakes** 29 8 8 5 21 10 4
Fruit juices** 180 51 69 47 111 53 24
Dairy products** 95 27 38 26 57 27 13
Nutrient enriched
spreads** 54 15 25 17 29 14 7
* percentage of total, male or female users
RIVM report 350030005 Page 23 of 109
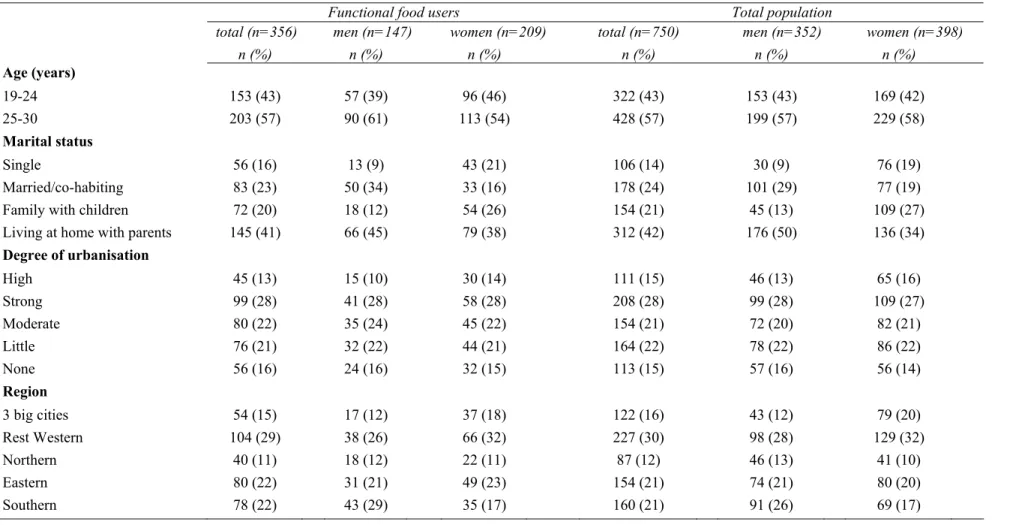
Table 2: Characteristics of the users vs. the total population
Functional food users Total population
total (n=356) men (n=147) women (n=209) total (n=750) men (n=352) women (n=398)
n (%) n (%) n (%) n (%) n (%) n (%) Age (years) 19-24 153 (43) 57 (39) 96 (46) 322 (43) 153 (43) 169 (42) 25-30 203 (57) 90 (61) 113 (54) 428 (57) 199 (57) 229 (58) Marital status Single 56 (16) 13 (9) 43 (21) 106 (14) 30 (9) 76 (19) Married/co-habiting 83 (23) 50 (34) 33 (16) 178 (24) 101 (29) 77 (19)
Family with children 72 (20) 18 (12) 54 (26) 154 (21) 45 (13) 109 (27)
Living at home with parents 145 (41) 66 (45) 79 (38) 312 (42) 176 (50) 136 (34)
Degree of urbanisation High 45 (13) 15 (10) 30 (14) 111 (15) 46 (13) 65 (16) Strong 99 (28) 41 (28) 58 (28) 208 (28) 99 (28) 109 (27) Moderate 80 (22) 35 (24) 45 (22) 154 (21) 72 (20) 82 (21) Little 76 (21) 32 (22) 44 (21) 164 (22) 78 (22) 86 (22) None 56 (16) 24 (16) 32 (15) 113 (15) 57 (16) 56 (14) Region 3 big cities 54 (15) 17 (12) 37 (18) 122 (16) 43 (12) 79 (20) Rest Western 104 (29) 38 (26) 66 (32) 227 (30) 98 (28) 129 (32) Northern 40 (11) 18 (12) 22 (11) 87 (12) 46 (13) 41 (10) Eastern 80 (22) 31 (21) 49 (23) 154 (21) 74 (21) 80 (20) Southern 78 (22) 43 (29) 35 (17) 160 (21) 91 (26) 69 (17)
page 24 of 109 RIVM report 350030005
(Table 2 continued)
Functional food users Total population
total (n=356) men (n=147) women (n=209) total (n=750) men (n=352) women (n=398)
n (%) n (%) n (%) n (%) n (%) n (%) Education Low 77 (22) 27 (18) 50 (24) 170 (23) 65 (18) 105 (26) Intermediate 177 (50) 74 (50) 103 (49) 363 (48) 176 (50) 187 (47) High 102 (29) 46 (31) 56 (27) 217 (29) 111 (32) 106 (27) Country of birth Netherlands 343 (96) 138 (94) 205 (98) 720 (96) 336 (95) 384 (96) Surinam 1 (0) 0 (0) 1 (0) 3 (0) 0 (0) 3 (1) Turkey 0 (0) 0 (0) 0 (0) 1 (0) 1 (0) 0 (0) Other country 12 (3) 9 (6) 3 (1) 26 (3) 15 (4) 11 (3) BMI <18.5 12 (3) 5 (3) 7 (3) 26 (3) 14 (4) 12 (3) 18.5-25 225 (63) 106 (72) 119 (57) 484 (65) 249 (71) 235 (59) 25-30 90 (25) 29 (20) 61 (29) 183 (24) 75 (21) 108 (27) ≥30 29 (8) 7 (5) 22 (11) 57 (8) 14 (4) 43 (11) Alcohol use Never 65 (18) 15 (10) 50 (24) 125 (17) 37 (11) 88 (22) No, stopped 2 (1) 0 (0) 2 (1) 4 (1) 0 (0) 4 (1) < 1 glass/week 129 (36) 36 (24) 93 (44) 258 (34) 72 (20) 186 (47) Yes, ≥ 1 glasses/week 159 (45) 96 (65) 63 (30) 360 (48) 242 (69) 118 (30) Unknown 1 (0) 0 (0) 1 (0) 3 (0) 1 (0) 2 (1) Smoking Yes 112 (31) 54 (37) 37 58 (28) 237 (32) 114 (32) 123 (31) No, stopped 43 (12) 14 (10) 10 29 (14) 103 (14) 45 (13) 58 (15)
No, never smoked 201 (56) 79 (54) 54 122 (58) 409 (55) 192 (55) 217 (55)
RIVM report 350030005 Page 25 of 109 There were no relevant differences in the most important socio-demographic descriptors between the users group and the total population. This again (as concluded earlier, see: (2)) makes it less obvious to typically characterise the general functional food consumer. Instead characterisation should take place per functional food category.
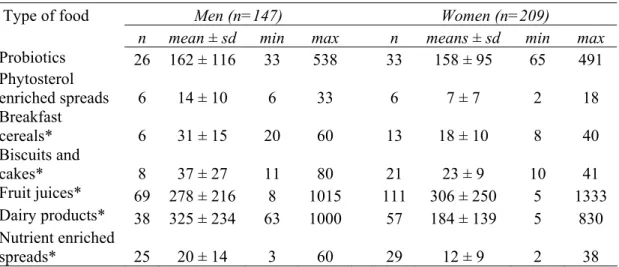
Table 3: Mean amounts (g/day) ± sd consumed over two days per functional food category for men and women
Type of food Men (n=147) Women (n=209)
n mean ± sd min max n means ± sd min max
Probiotics 26 162 ± 116 33 538 33 158 ± 95 65 491 Phytosterol enriched spreads 6 14 ± 10 6 33 6 7 ± 7 2 18 Breakfast cereals* 6 31 ± 15 20 60 13 18 ± 10 8 40 Biscuits and cakes* 8 37 ± 27 11 80 21 23 ± 9 10 41 Fruit juices* 69 278 ± 216 8 1015 111 306 ± 250 5 1333 Dairy products* 38 325 ± 234 63 1000 57 184 ± 139 5 830 Nutrient enriched spreads* 25 20 ± 14 3 60 29 12 ± 9 2 38
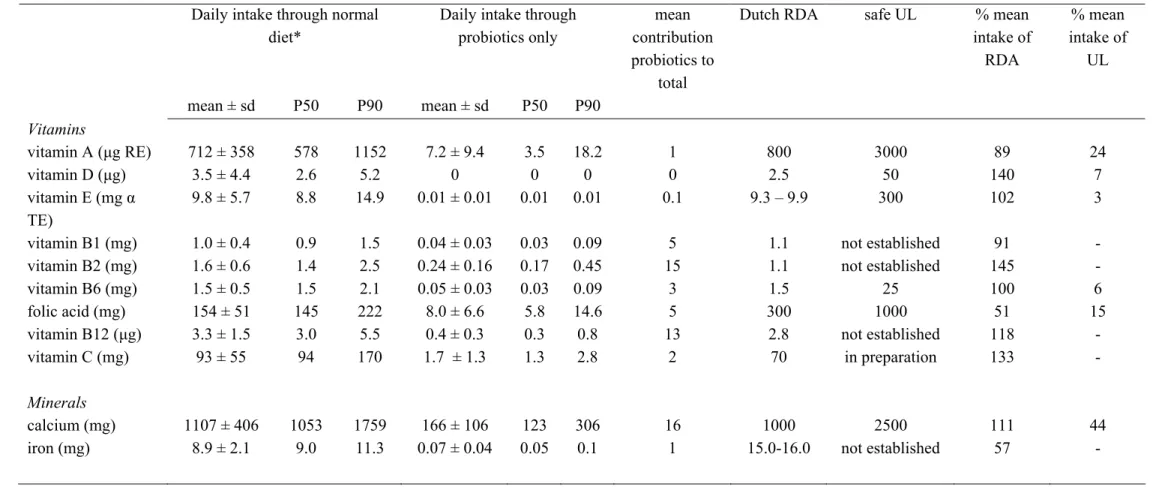
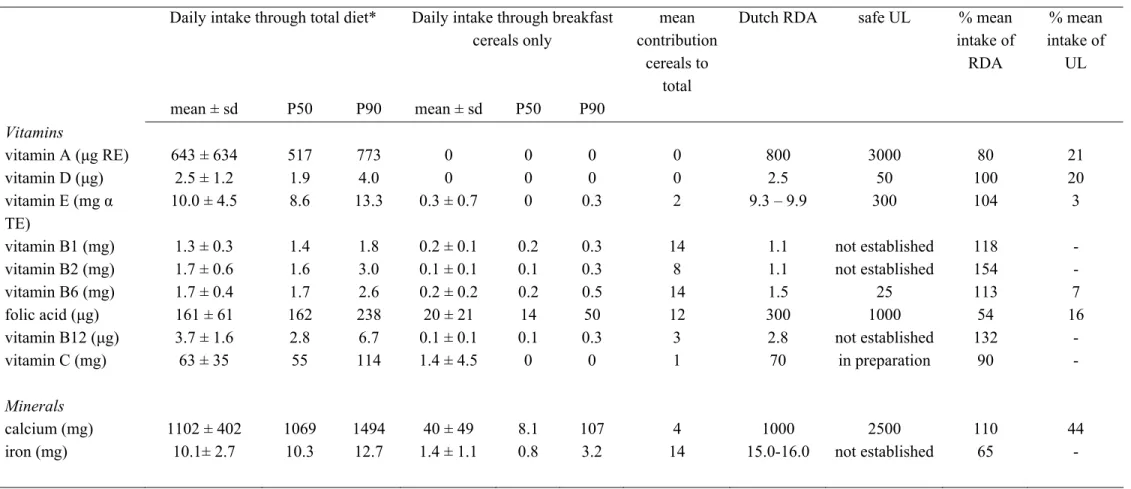
In the Tables 7a to 13a (men) and 7b to 13b (women) (see Appendix II) the mean concentration and the distribution of intake of important micronutrients delivered by the several functional food groups are presented. Only those men and women who had used a functional food in the particular category have been taken into account for these tables. The contribution of each functional food group to the total intake has been calculated. As well, a comparison has been made with the Dutch Recommended Dietary Allowances and the European safe Upper Levels for the specific age group.
For many nutrients in all categories of functional food groups the mean total dietary intake met the Recommended Dietary Allowances in males as well as in females (Tables 7a, 7b, 9a -13b). However, folic acid intake appeared to be reasonably low in several of the usage categories. An amply sufficient supply of nutrients (at least 1.5 RDA) was observed for: Male users:
- vitamin B12 (probiotics)
- vitamins B1, B6 and B12 (breakfast cereals) - vitamins D, B6, B12 (cake and biscuits) - vitamins D, B1, B6, B12, C (fruit juice) - vitamins B1, B2, B6, B12, C (dairy products)
page 26 of 109 RIVM report 350030005 Female users:
- vitamin B2 (breakfast cereals) - vitamin C (fruit juice)
- vitamins B2, C (dairy products)
- vitamins B2, B12, C (micronutrient enriched spreads)
Only males using enriched breakfast cereals and dairy products exceeded for one nutrient (vitamin B12 and vitamin C respectively) two times the RDA. The total dietary intake of the users did not exceed the established safe Upper Levels with one exception. The total dietary intake of the upper ten percent of female users of micronutrient enriched spreads exceeded the safe Upper Levels for vitamin A and calcium (Table 13b). Of course the values reached in this upper part of the female user population is determined by only a very limited number of women on only the recorded data. It might be a smoke signal for further follow-up. For the sterols (Tables 8a and 8b), results are somewhat difficult to interpret, among others because of a very low number of users. The level of phytosterols/-stanols in the background diet is regarded as negligible compared to the recommended daily
consumption of 1.5-2.0 g/d and is therefore not taken into account (7). The mean intake of sterols through the enriched spreads compared to the recommended amounts appears to be too low and certainly does not exceed the proposed safety limit.
With respect to the mean contribution of each specific functional food to the total dietary intake (Tables 7a, 7b, 9a-13b), in male users, especially fruit juice contributed to the vitamin C intake (35%), dairy products to the vitamin B2 intake (31%) and calcium intake (26%), and micronutrient enriched spreads to the vitamin D intake (32%) and vitamin E intake (31%). In female users especially fruit juice contributed to the vitamin C intake (37%), dairy products to the vitamin B2 intake (31%) and micronutrient enriched
margarines to the vitamin D intake (28%). It would have been preferable to perform these calculations on usual intake figures instead of recorded (actual) intake figures, so the percentages presented give an indication only. Finally, we compared the micronutrient intake of the users with the non-users. For males we found that the mean total intake of all micronutrients was higher among users compared to the non-users with the exception of folic acid and vitamin B12. For calcium, iron, vitamin B1, B2, B6, C and E the differences were statistically significant (t-test; p < 0.05). Compared to the non-users, the female users had also higher mean total intakes of micronutrients with the exception of iron, vitamin A, B12, and D. For calcium, vitamin B1, B2, B6, C and E the differences were statistically significant (t-test; p < 0.05).
RIVM report 350030005 page 27 of 109
4
Case study 2
For our second case study we chose the VIO database. The VIO study focused on a very specific study group, namely children aged 9 (8-10), 12 (11-13) and 18 (17-19) months. The study has been performed by TNO on commission of Nutricia Nederland B.V. The reason for our choice to examine the VIO data is that the study contains rather up to-date data on multiple functional foods as it has been carried out in 2002 with a broad
perspective, i.e. gaining a clear understanding of the food consumption of toddlers. The study group is a very vulnerable group as there is rapid physical and mental growth and development in this age category. Nonetheless, there is relatively little known about the intake of toddlers, which is all the more reason to monitor the intake of functional foods in this group. Details of the VIO study have been described elsewhere (1).
4.1 Approach
Based on a published overview (1) of enriched foods as had been recorded during the two days of investigation a generic list of interesting functional food categories was compiled for this case study: enriched breakfast cereals, fruit juices/-drinks, syrups, biscuits and cakes, fruit products, complete meals, dairy products, milk products either or not enriched with pre- and/or probiotics, and micronutrient enriched spreads. With the consent of Nutricia Nederland B.V. and the Dutch Ministry of Public Health, Welfare and Sports, TNO was asked to perform the requested statistical analyses. For a description of the general statistics of VIO we would like to refer to the VIO publication (1). In general, the nutritional data have been calculated with the Dutch Food Composition Table 2001 (13) which had been extended with data of 164 special toddler products. Of all products
consumed by the study group (693 in total) 150 (22%) appeared to be enriched with one or more vitamins and minerals (retrieved from (1)). Supplements and foods with artificial sweeteners have been excluded for our case study as intake details will be reported elsewhere by TNO on the account of the Ministry of Public Health, Welfare and Sports. With respect to the dairy products enriched with prebiotics and probiotics a literature and internet search has been performed in order to find out which brands do contain these types of non-nutrients. After consultation of the manufacturers to confirm our listings and to provide additional information on the specific timing of enrichments we finalised this list and included products that contained prebiotics and/or probiotics before January 2002 to the best of our knowledge.
The frequency of consumption and the distribution of intake (mean, median, 90th
percentile) of the defined categories of functional foods have been calculated for each of the three age categories (9, 12, 18 months) based on the recorded intake data. For several product categories e.g. milk products containing pre- and/or probiotics and complete meals
page 28 of 109 RIVM report 350030005 in the oldest age category the number of users appeared to be too low to present a complete distribution of the intake data. For many added nutrients we compared the distribution of the intakes with the Dutch RDA (Recommended Dietary Allowances: mainly based on Adequate Intake figures) and the UL (safe Upper Levels) for this age group, and calculated the percentage of nutrients delivered by the specific functional foods compared to the total intake. Based on the details, we have tried to identify potential risk groups for toxicity. It appeared not to be useful to compare users with non-users as almost all children used one or more enriched food products.
4.2 Results and discussion
In Table 4 the number of functional food users in the VIO 2002 study are presented according to the three age categories.
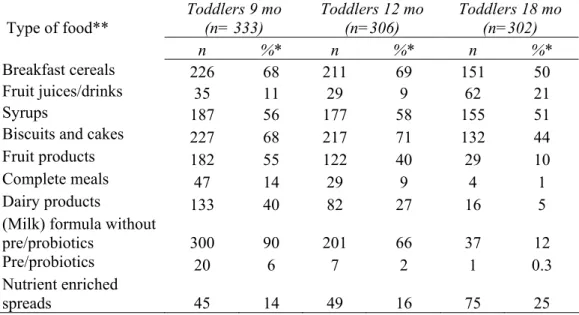
Table 4: Number of users of functional foods in the VIO study 2002 presented in ten functional food categories (total population: n=941, aged 9, 12, 18 months)
Type of food** Toddlers 9 mo (n= 333) Toddlers 12 mo (n=306) Toddlers 18 mo (n=302) n %* n %* n %* Breakfast cereals 226 68 211 69 151 50 Fruit juices/drinks 35 11 29 9 62 21 Syrups 187 56 177 58 155 51
Biscuits and cakes 227 68 217 71 132 44
Fruit products 182 55 122 40 29 10
Complete meals 47 14 29 9 4 1
Dairy products 133 40 82 27 16 5
(Milk) formula without
pre/probiotics 300 90 201 66 37 12
Pre/probiotics 20 6 7 2 1 0.3
Nutrient enriched
spreads 45 14 49 16 75 25
* percentage of users within the specific age category
** all enriched with macro-and/or micronutrients with the exception of pre/probiotics
Among the youngest children especially enriched (milk) formula without pre/probiotics (90%), enriched breakfast cereals (68%), and enriched biscuits and cakes (68%) were used. In the 12-month old group especially enriched biscuits and cakes (71%), and enriched breakfast cereals (69%) were popular, and in the 18-month old group enriched syrups (51%), and again enriched breakfast cereals (50%) were used. On average, the absolute number of 18-month old children who used enriched foods was less compared to the younger groups. Almost all children used at least one enriched food product: 333 children
RIVM report 350030005 page 29 of 109 in the 9-month old group (100%), 304 children in the 12-month old group (99%), and finally 276 children in the 18-month old group (91%).
Artificial sweeteners, for example, to be used in sweet hot drinks, and foods containing artificial sweeteners were not added to this list as that information will be reported
elsewhere by TNO. Nonetheless, we are able to report that artificial sweeteners to sweet hot drinks have not been used frequently during the study period. Only one child per age
category has reported usage of those (total n=3). Fruit juices/drinks with artificial
sweeteners have been used by 10 children aged 9 months, 17 children aged 12 months, and 47 children aged 18 months. Dairy products containing artificial sweeteners have not been used in the youngest age category, by one child in the middle age category and by two children in the oldest age category.
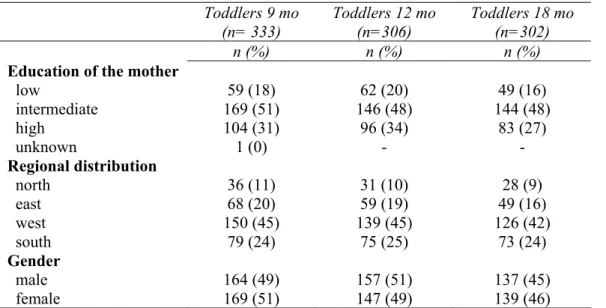
Table 5: A few socio-demographic characteristics of the users of at least one enriched food product* Toddlers 9 mo (n= 333) Toddlers 12 mo (n=306) Toddlers 18 mo (n=302) n (%) n (%) n (%)
Education of the mother
low intermediate high unknown 59 (18) 169 (51) 104 (31) 1 (0) 62 (20) 146 (48) 96 (34) - 49 (16) 144 (48) 83 (27) - Regional distribution north east west south 36 (11) 68 (20) 150 (45) 79 (24) 31 (10) 59 (19) 139 (45) 75 (25) 28 (9) 49 (16) 126 (42) 73 (24) Gender male female 164 (49) 169 (51) 157 (51) 147 (49) 137 (45) 139 (46) * percentages calculated based on the total population
In Table 5 a brief description of the users is presented. As stated earlier a comparison between users and non-users has not been done as almost all children used one or more functional foods. There were no relevant differences in the most important
socio-demographic descriptors among the three different age categories (not statistically tested). Within each specific age category it appears that children having mothers with an
intermediate education and living in the western part of the country represent a larger part of the study group (not statistically tested). However, according to the principal
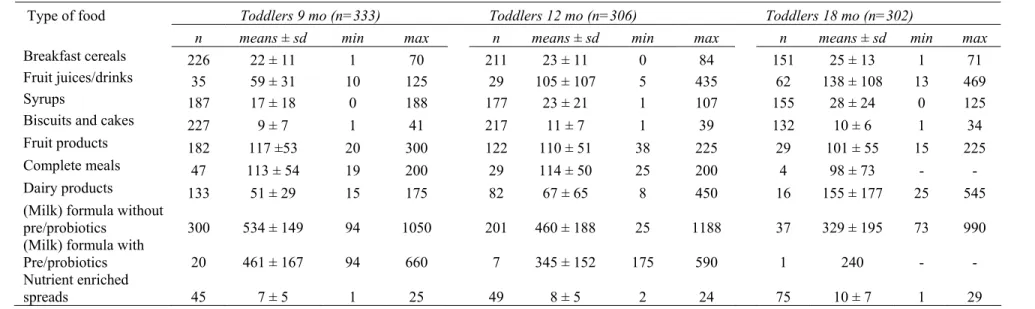
investigators the study group forms a representative group of the toddler population in the Netherlands. In Table 6 the mean absolute amounts of functional foods consumed per category per day among users are presented together with the minimum and maximum intake. There is a fair difference between the mean amounts of consumption of milk
page 30 of 109 RIVM report 350030005 (formula) with and without pre-/probiotics, with the latter consumed in higher amounts. Perhaps, those toddlers experiencing gastro-intestinal problems on conventional formula try the pre-/probiotic enriched products, but still consume less milk-based products on average. Mean amounts in grams per day increase corresponding with the different age categories for enriched fruit juices/drinks, enriched syrups, and enriched dairy products other than the (milk) formula. Amounts of intake for the other food groups either remain equal or
RIVM report 350030005 Page 31 of 109
Table 6: Mean amounts (g/day) ± sd consumed over two days of recording per functional food category for the three age categories of toddlers
Type of food Toddlers 9 mo (n=333) Toddlers 12 mo (n=306) Toddlers 18 mo (n=302)
n means ± sd min max n means ± sd min max n means ± sd min max
Breakfast cereals 226 22 ± 11 1 70 211 23 ± 11 0 84 151 25 ± 13 1 71
Fruit juices/drinks 35 59 ± 31 10 125 29 105 ± 107 5 435 62 138 ± 108 13 469
Syrups 187 17 ± 18 0 188 177 23 ± 21 1 107 155 28 ± 24 0 125
Biscuits and cakes 227 9 ± 7 1 41 217 11 ± 7 1 39 132 10 ± 6 1 34
Fruit products 182 117 ±53 20 300 122 110 ± 51 38 225 29 101 ± 55 15 225
Complete meals 47 113 ± 54 19 200 29 114 ± 50 25 200 4 98 ± 73 - -
Dairy products 133 51 ± 29 15 175 82 67 ± 65 8 450 16 155 ± 177 25 545
(Milk) formula without
pre/probiotics 300 534 ± 149 94 1050 201 460 ± 188 25 1188 37 329 ± 195 73 990
(Milk) formula with
Pre/probiotics 20 461 ± 167 94 660 7 345 ± 152 175 590 1 240 - -
Nutrient enriched
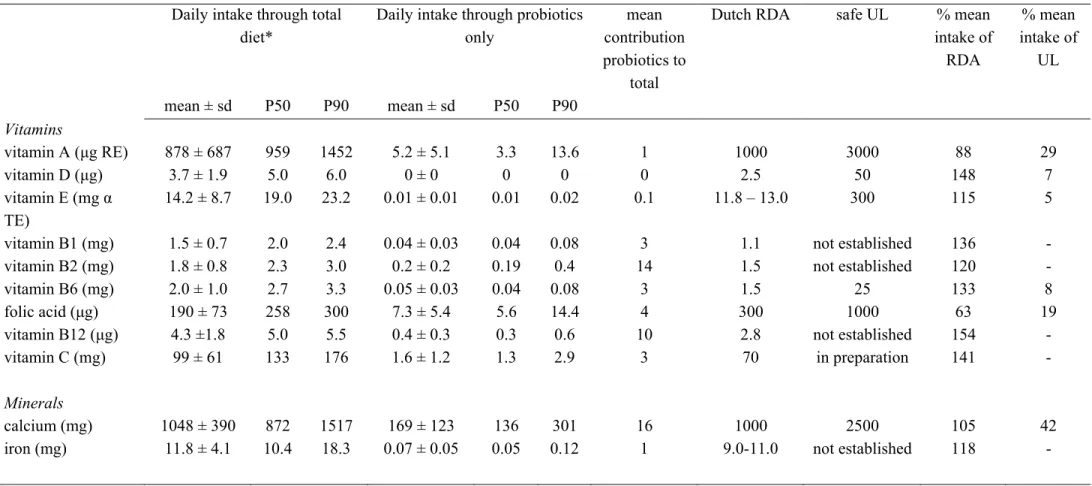
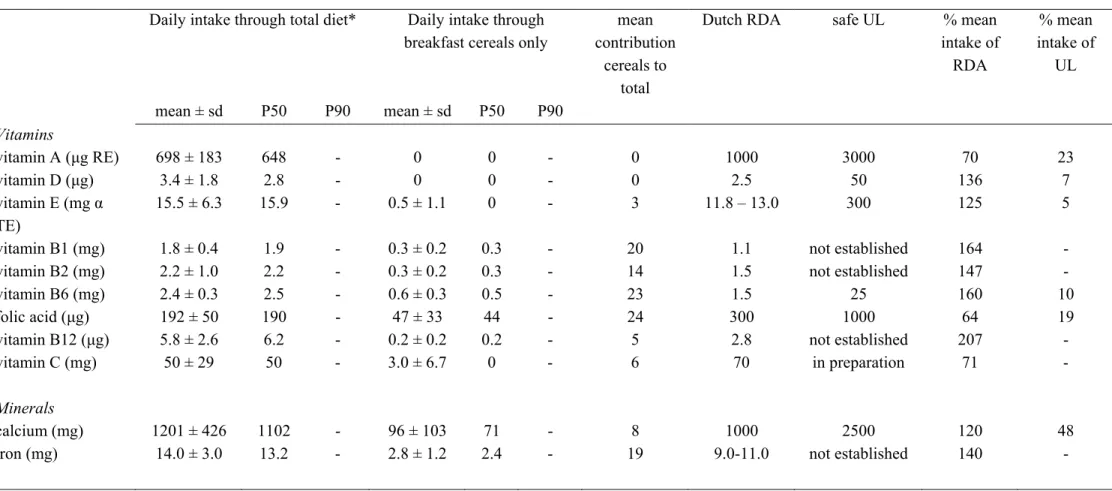
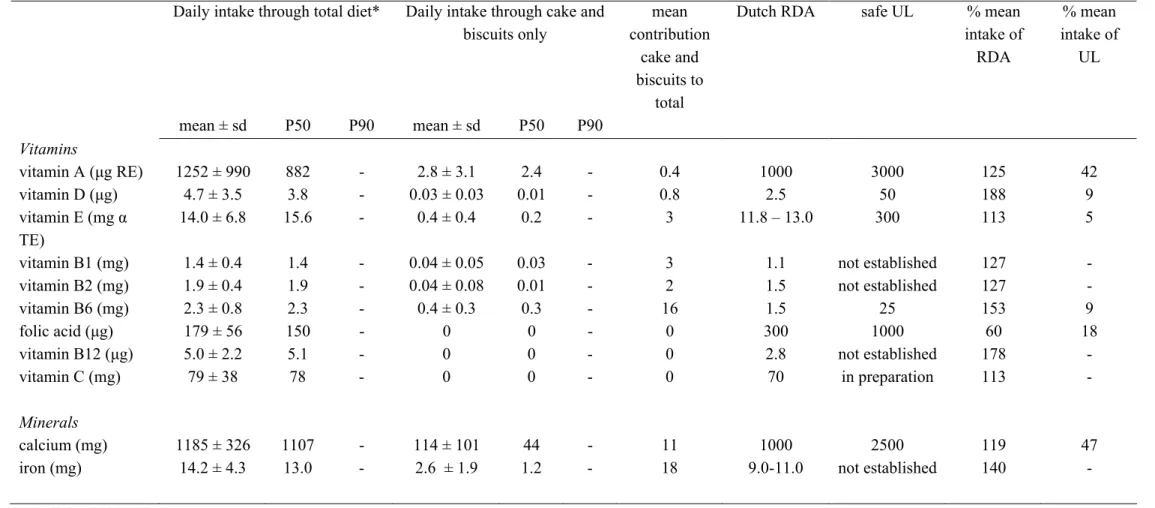
RIVM report 350030005 Page 32 of 109 In the Tables 14a to 23a (9 month old toddlers), 14b to 23b (12 month old toddlers), and 14c to 23c (18 month old toddlers) (see Appendix III) the mean intake and the distribution of intake of important micronutrients out of ten different functional food groups and total diet are presented by group of users. Only those toddlers who had used a functional food in the particular category have been taken into account for these tables. The contribution of each functional food to the total intake has been calculated. Furthermore, a comparison has been made with the Dutch Recommended Dietary Allowances (which are mainly based on the established Adequate Intakes for these specific age groups) and with the safe Upper Levels as far as they are established for these young age groups. For many nutrients in all categories of functional foods the mean total dietary intake amply met the Recommended Dietary Allowances in all three age categories studied. In some cases the mean total vitamin D and iron intake were marginal compared to the RDA which was already mentioned in the earlier report on VIO 2002 (1). In order to categorize some of the observations with respect to the RDA, we took an arbitrary cut-off point of 3 times the RDA. The following was observed:
Mean total dietary intake of 9 month old users exceeding 3 times the RDA: - vitamins B1, B2, B6, B12, magnesium (breakfast cereals)
- vitamins B1, B2, B6, B12 (fruit juice) - vitamins B1, B6, B12 (syrups)
- vitamins B1, B6, B12 (cake and biscuits, fruit products, complete meals, dairy products, enriched (milk) formula with or without pre/probiotics)
- vitamins B1, B2, B6, B12, magnesium (bread spreads)
Mean total dietary intake of 12 month old users exceeding 3 times the RDA: - vitamins B2, B12 (fruit juice)
- vitamin B12 (breakfast cereals, syrups, cake and biscuits, fruit products, complete meals, dairy products, bread spreads)
- vitamins B1, B2, B6, B12, magnesium ((milk) formula without pre/probiotics) - vitamin B12 ((milk) formula with pre/probiotics)
Mean total dietary intake of 18 month old users exceeding 3 times the RDA: - vitamins B12 (breakfast cereals, syrups, fruit products, complete meals, ) - vitamins B1, B2, B12 (fruit juice)
- vitamins B2, B12 (cake and biscuits) - vitamins B1, B2, B12 (dairy products)
- vitamins B1, B2, B6, B12, magnesium ((milk) formula without pre/probiotics) - vitamins B2, B12 (bread spreads)
Among the B-vitamins especially for vitamin B12 the intakes were much higher, up to 5 times, than the current recommendations. As the Upper Levels for the B-vitamins could either not be determined because of lack of evidential data on potential negative effects (in
RIVM report 350030005 page 33 of 109 case of vitamin B1, B2 and B12) or were not reached (in case of vitamin B6, folic acid) no conclusions with respect to safety aspects are to be drawn.
In general, the total dietary intake of the enriched product users did not exceed the established safe Upper Levels with two exceptions. The total dietary intake of the upper ten percent of users in all age categories and in most functional food categories exceeded the safe Upper Levels for vitamin A and zinc (marked bold-faced in the tables in
Appendix III). Also, for the 9-month old toddlers the mean intakes for vitamin A exceeded the safe UL. However, the values reached in the upper part (P90) of the user population is determined by a limited number and the figures presented are based on recorded intake instead of usual intake. Therefore, we cannot put firm conclusions about these findings. Also, the fact that part of the total vitamin A intake is determined by carotenoid intake might influence the final risk on overdosing. For ß-carotene for example no UL has been established and in the determination of the toxicity of high intakes of vitamin A, the pro-vitamin A properties of carotenoids are assumed not to contribute significantly (12). These data might be a smoke signal for further follow-up, but a more detailed investigation is needed for this aspect.
With respect to the mean contribution of each specific functional food to the total dietary intake (Tables 14a-23c) some points of interest are to be noted. In 9-month old users, especially the (milk) formula with or without pre-/probiotics contributed to the total intake of energy and micronutrients (ranging from 52% to 91%). Also, enriched fruit products substantially contributed to the vitamin C intake (20%), breakfast cereals to the vitamin B6 intake (23%), and the enriched complete meals to the vitamin B6 intake (20%). Among the 12-month old users again the (milk) formula with or without pre-/probiotics were important suppliers of energy and micronutrients (ranging from 14% to 87%). In this age category also enriched breakfast cereals were an important supplier of vitamin B1 (23%), and enriched fruit juices were an important supplier of vitamin C (20%). With respect to the 18-month old toddlers the contribution out of each enriched functional food group to the total dietary intake of the using group was as follows: again especially the (milk) formula with or without pre-/probiotics substantially contributed to the total intake of energy and micronutrients (up to 84%). Enriched bread spreads considerably contributed to the vitamin D intake (42%), enriched dairy products to the intake of vitamin D (25%), vitamin B2 (21%), calcium (22%), enriched syrups and fruit products to the intake of vitamin C (22%), enriched breakfast cereals to the intake of vitamin B1 (23%) and iron (27%), and finally enriched fruit juices the intake of vitamin A (25%), vitamin B1 (25%), vitamin B6 (22%), and vitamin C (26%). Again these data are indicative only as calculations have been based on recorded data.
RIVM report 350030005 page 35 of 109
5
Discussion and conclusion
Despite the availability of numerous cohort and monitoring studies in different population groups and in different timeframes, on the whole the amount of information available in the Netherlands on functional food use and/or supplement use is sadly limited. Important limitations for usage for PLM purposes are long-standing (old) data or data that are too recent to have entered a database, limited data (e.g. only frequency of use known and no amounts of consumption available, or only information available on very specific
(enriched) functional foods or supplements), differences in applied study methods, limited power of the studies (low absolute number of participants or focus on specific population groups only), and/or last but not least poor accessibility of the data.
5.1 Methods
With respect to the dietary survey method in general, the most complete picture of functional food use may be obtained by a (repeated) 24 h recall dietary method, dietary record and/or dietary history preferably combined with a (focused) food frequency questionnaire for specific information on usual intake. The first two methods supply us with information on actual intake through open ended questions; the latter method also uses an open ended technique and gives among others more details on longer term intake. This method is, however, quite labour intensive for both the respondent and interviewer and is therefore not used very often in the studies discussed in the current report. The suitability of an FFQ is determined by the focus of the questionnaire. If certain functional foods are included than useful information on usual intake may be obtained. Therefore, the type of FFQ determines the suitability of the information. For example, the EPIC questionnaire provides some data on the use of phytosterol enriched spreads: also with respect to amounts consumed. But the most recent market introduction of phytosterol enriched milk and
yoghurt will not be covered through this questionnaire. The most recent questions in the PIAMA cohort provide some frequency data on probiotics usage, and also some specific questions for the mothers in the Generation R study provide limited information on usage of some functional foods in this specific study group. In many cases however, data on amounts, brand names and other information specifying intake is lacking. We have to conclude that just a general FFQ will not be suitable for estimating functional food or supplement intake.
This future Dutch National Food Consumption Survey will most probably use 24 h recalls as dietary assessment method (report in preparation). The DNFCS potentially offers a rather complete picture of the observed dietary intake data, provided that attention is paid to careful registration of the required details described in paragraph 2.2. The outcomes are limited by the fact that they describe the recorded intake at a given moment in time. In case,