Forest microclimate buffering and
the response of understorey herbs
to climate change
Sarah Vaneenooghe
Student number: 01503998
Promotors: Prof. dr. ir. Pieter De Frenne, Dr. ir. Pieter Vangansbeke Tutor: Ir. Karen De Pauw
Master’s Dissertation submitted to Ghent University in partial fulfilment of the requirements for the degree of Master of Science in Bioscience Engineering: Forest and Nature Management
Deze pagina is niet beschikbaar omdat ze persoonsgegevens bevat.
Universiteitsbibliotheek Gent, 2021.
This page is not available because it contains personal information.
Ghent University, Library, 2021.
Acknowledgements
This thesis was made possible by... no, I won’t make it that lame. After all, the people below have helped me immensely with the fieldwork, elaborating and improving this the-sis and making sure that I stayed positive in this strange, almost apocalyptic year of 2020. First of all, I would like to thank Severine Verschaete, Jonathan Van Loo, Pieter De Frenne, Pieter Vangansbeke, Camille Meeussen, Pieter Sanczuk and Karen De Pauw. All of you were a huge help in the preparation of and the gigantic fieldwork operation across Europe itself. Whether it was in the scorching sun or during a soaking thunderstorm, working between the forest plants in your company was always fantastic! Also a warm thank you to the international colleagues of the FORMICA project for welcoming us so kindly and guiding us in the experiment of your region. I would also like to thank Camille again for the many tips and tricks in setting up a thesis and a poster (unfortunately, the poster hasn’t rolled out of the printer yet because of COVID-19).
Jonathan, my thesis buddy and meanwhile good friend, deserves a special mention. Thanks for keeping up with me for so long during our +5000km roadtrip full of many hilarious, impulsive, sometimes a bit more dramatic, but most of all amazing moments. Also when writing the thesis and processing the gigantic datasets, I could always contact you with my questions. Big thanks to you mate!
Next I would like to thank² Pieter², better known as prof. Pieter De Frenne and Pieter Vangansbeke, for their valuable and very constructive feedback from the very beginning until the finalization of this thesis. As a thesis student, I am lucky to have such a mentors who can help their students forward so quickly, efficiently and effectively. The same goes for Karen De Pauw, my fantastic tutor, with whom I was able to put together my first thesis. Your fantastic guidance, structured planning and instructive answers to my many questions and emails have brought my research skills to the next level. Thanks for the great period and sincerely a big thank you for all your help Karen!
Finally, I would also like to thank my family and friends tremendously for supporting me during this challenging period. Many thanks to Ruben De Blaere for taking some more pictures for me during the quarantine in the Aelmoeseneie forest. Also thanks to my sister Fien for helping me out with the design of the figure of the multigradient experi-ment. Thanks a lot to my friends of ’De Bossers’ and ’Het Beestenbos’ for the uplifting chats and the blissful nonsense to be able to relax during my thesis year. Special thanks to my uni-bestie and study buddy Ellen for dragging us through this period together. Immense thanks to our family friend Veerle for being the proofreader of this English the-sis. Many thanks to my grandmothers and grandfathers for supporting me so lovingly. And of course not to forget, my towers of strength: my mum, dad and little big sister, I can’t thank you enough to assist me at any time of the day through those five years of university, to give me the courage to persevere, to cheer me up when things are not going so well and to be there for me. I love you guys!
Preamble
Covid-19 in itself had little or no impact on the content of the thesis as originally planned. The fieldwork was completed at the beginning of the first semester, and the lab work at the end of the first semester. During Covid-19 the communication between tutor, pro-motors and student took place via e-mail and could easily take place. The only technical problem encountered during the corona crisis was that my computer broke down during the Easter holidays due to intensive use. Because of this, I had no computer for more than a week, just during the phase that I was processing my data into models. The planning concerning my thesis therefore had to be adjusted.
On a personal level, Covid-19 caused me more problems, and not only because this was a difficult period mentally, but especially because of problems with the courses I attend at the university. For a mandatory course that from this year on had to be followed at the KULeuven by the students from Ghent, the communication between KULeuven and UGent was exceptionally bad. For its lessons and its announced tasks, the necessary files almost always reached us a few days/week later than announced, and only after we, the students ourselves, had sent an email that they were still missing. This was extremely stressful and frustrating because we always had to check whether we had all the lesson material ourselves. In the twelfth (and last) week of the lessons we were given another unannounced task for this course.
Finally, during the catch-up week (thirteenth lesson week) I discovered that two of my three exam dates at Centauro, the official exam and lesson schedule at UGent, were not correct by emailing the respective professors on my own initiative. One turned out to be a mistake on the part of the professor who had forgotten that all exams at UGent had been postponed by one week, the other concerned an exam day that had been post-poned by the KULeuven without communicating this to the students. The new day on which this exam fell, however, caused an overlap with my other exam. My exam schedule was no longer feasible at all (three exams in one week), so a few days followed with a lot of mail traffic and Skype conversations between the respective professors, the fsa and myself in order to find a solution for these misconceptions and miscommunication. For two of my three exams, a number of other students, including myself, would have stood in front of a closed exam room, if I hadn’t contacted the professors. The final result: my complete exam schedule changed in the catch-up week. Arranging all this and in the meantime trying to put the finishing touches to my thesis was extremely stressful, resulted in heavy working days from early morning until late at night and therefore put a lot of pressure on my shoulders.
This preamble has been drawn up in consultation between the student and the supervisor and has been approved by both parties.
List of abbreviations
CCI Colonization Capacity Index CSC Canopy Storage Capacity
CSR Competitor - Stress tolerator - Ruderal DBH Diameter at Breast Height
DEI Depth of Edge Influence GHG Greenhouse Gas
IPCC Intergovernmental Panel on Climate Change LAI Leaf Area Index
MAT Mean Annual Temperature NPP Net Primary Productivity
PAR Photosynthetically Active Radiation RR Recovery Rate
SLA Specific Leaf Area VPD Vapour Pressure Deficit
Abstract (EN)
Beneath the canopy of forests, there exists a unique microclimate with specific condi-tions in terms of light, temperature and humidity. This microclimate differs from the climate outside forest ecosystems, also known as the macroclimate. These microclimatic conditions are often less extreme and act as a buffer against a changing macroclimate. The buffering effect is strongly linked to the forest structure as it determines how much sunlight and heat reaches the forest soil. The forest structure is in turn characterized by e.g. tree density, present tree species and vertical structure.
However, it is unclear which climatic factors (light, heat or a combination) influence the herb layer the most. By means of a transplantation experiment along a latitudinal gradient in Europe (Sweden to Italy), the effect of various micro- and macroclimates on the herb layer was investigated. This experiment was set up in five open and five dense deciduous forests, both in the forest edge and the forest core. On each location, twelve vascular plant species were subjected to a light and/or heat treatment simulating climate change and forest management. Both the abundance and plant functional traits of these species were investigated.
The transplantation experiment demonstrated the buffering effect of the forest microcli-mate on the herb layer. In dense forests, forest specialists and generalists grew together without outperforming each other in terms of abundance and plant height. This was in contrast to open forests where forest generalists survived better, grew higher and had a higher cover. Because of different growth responses between these two functional groups in open forests, it is expected that the generalists will dominate, with a loss of special-ists in the long run. The SLA was generally lower in open forests than in dense forests. The treatment experiment showed that adding heat had hardly any effect on the species, except when light was added. Forest generalists reacted with a strong growth increase, which contrasted with the forest specialists who hardly reacted to these treatments. In addition, a distinct effect between the cold and warm species was not immediately ap-parent. An extension of the experiment should determine whether this will change in the future.
Closed canopy forests can slow down the growth of tall-growing, competitive forest gener-alists and thus limit understorey community changes and biodiversity loss. These results have therefore important consequences for forest management to preserve forest biodi-versity in times of climate change.
Abstract (NL)
Onder het bladerdek van bossen heerst een uniek microklimaat met specifieke condities op het vlak van licht, temperatuur en vochtigheid. Dit microklimaat wijkt af van het kli-maat buiten bosecosystemen, ook het macroklikli-maat genoemd. Deze microklimatologische condities zijn vaak minder extreem en werken als buffer ten opzichte van een veranderend macroklimaat. De bufferende werking is daarbij sterk gelinkt aan de bosstructuur. Deze bepaalt immers hoeveel zonlicht en warmte de bosbodem bereikt. De bosstructuur wordt op haar beurt getypeerd door onder andere de dichtheid, de aanwezige boomsoorten en de verticale structuur.
Het is echter onduidelijk welke klimatologische factoren (licht, warmte of een combinatie) de kruidlaag het meest be¨ınvloeden. Door middel van een transplantatie-experiment langs een latitudinale gradi¨ent in Europa (Zweden tot Itali¨e) werd het effect van diverse micro- en macroklimaten op de kruidlaag onderzocht. Dit experiment werd opgezet in de bosrand en de boskern van vijf open en vijf dichte loofbossen. Op elke locatie wer-den twaalf plantensoorten onderworpen aan een licht- en/of warmtebehandeling die de klimaatverandering en het bosbeheer simuleert. Zowel de abundantie als de functionele eigenschappen van deze plantensoorten werden onderzocht.
Het transplantatie-experiment toonde het bufferende effect van het bosmicroklimaat op de kruidenlaag aan. In dichtbegroeide bossen groeiden bosspecialisten en -generalisten samen zonder elkaar te overtreffen op het gebied van abundantie en hoogte. Dit in tegenstelling tot open bossen waar bosgeneralisten beter overleefden, hoger groeiden en een hogere bedekking hadden. Vanwege de verschillende groeiresponsen tussen deze twee functionele groepen in open bossen wordt verwacht dat de generalisten er zullen domineren, met een verlies aan specialisten op de lange termijn. De SLA was over het algemeen lager in open bossen dan in dichte bossen. Het treatment experiment toonde aan dat het toevoegen van warmte nauwelijks effect had op de soorten, behalve wan-neer er licht werd toegevoegd. Generalisten reageerden met een sterke groeitoename, wat in contrast stond met de specialisten die nauwelijks reageerden op deze behandelingen. Daarnaast was niet onmiddellijk een duidelijk effect zichtbaar tussen de koude en warme soorten. Een uitbreiding van het experiment zou moeten bepalen of dit in de toekomst zal veranderen.
Bossen met een gesloten kroonlaag kunnen de groei van sterk groeiende, competitieve gen-eralisten afremmen, en zo de veranderingen in de kruidlaag gemeenschap en het verlies aan biodiversiteit beperken. Deze resultaten hebben dus belangrijke gevolgen voor het bosbeheer zodat de biodiversiteit van bossen in tijden van klimaatverandering beschermd kan worden.
Contents
1 Introduction 1
2 Climate 2
2.1 Climate change . . . 2
2.2 Climate factors affect vegetation . . . 3
3 Forest microclimates 5 3.1 Definition . . . 5
3.2 Characteristics . . . 6
3.3 Forest structure and management . . . 9
4 Understorey plant communities 12 4.1 Forest biodiversity and the threats posed to it . . . 12
4.2 Conditions affecting the herbaceous vegetation . . . 16
4.3 Thermophilization and community shift . . . 17
5 Research questions 20 6 Methodology 21 6.1 Experimental multigradient approach . . . 21
6.2 Transplantation experiment . . . 22
6.3 Light and warming experiment . . . 25
6.4 Field measurements . . . 26
6.5 Statistical data processing . . . 28
7 Results 30 7.1 Transplantation experiment . . . 30
7.2 Light and warming experiment . . . 36
8 Discussion 42 8.1 Transplantation experiment . . . 42
8.2 Light and warming experiment . . . 44
8.3 Future research . . . 49
9 Conclusion 51
10 References 52
1
Introduction
Climate change and global warming are hot topics in the news today: persistent drought, a groundwater table that hasn’t been replenished for months, severe wildfires in Europe and the world ... Climate change is a global issue, just like the biodiversity crisis of which climate change is one of the key drivers: gradually more and more species are being threatened or extinct as a result of human activities such as exploitation, land use change, globalization and the additional spread of invasive species (IPBES, 2019). Concerning forest ecosystems, this decline in species appears to be lagging behind climate change. The buffering forest microclimate, which provides welcome cooling on a hot summer day and comfortable warmth on a forest walk that same evening, is thought to cause this delay. But do these forest microclimates also buffer the effects of climate change and its impact on the many plant species present in forests? The answer to this question is very important in order to preserve the biodiversity worldwide: forests, namely, occupy 31% of the total land surface and are the habitat of two thirds of all terrestrial biodiversity (FAO and UNEP, 2020).
Quite some research was already conducted on the influence of forest microclimates on understorey plant communities: how do communities react across a north-south gradient in Europe, how do communities react to experimental warming ...? However, experiments on the reaction of plants to a combination of these different factors in one large experiment across Europe are still lacking in the literature. Combining these factors is a crucial step in understanding the complex processes in forest ecosystems. After all, processes and factors such as climate change, climate zones across Europe, forest structure and forest microclimate are all directly or indirectly linked to each other.
This thesis combines all of the above factors in one major innovative transplantation and light and warming experiment across five regions in Europe (Sweden to Italy). Twelve plant species from four ecological strategy groups (cold/warm-adapted forest generalists vs cold/warm-adapted forest specialists) were combined in mesocosms of sixteen individ-uals. These mesocosms were then exposed to different forest microclimates (open vs dense forest, forest edge vs core) and treatments (light, heat or a combination). In the middle of the growing season, the plant functional traits (plant height, cover, SLA, survival rate and herbivory rate) and the microclimatic conditions (e.g. temperature, canopy cover, soil humidity, PAR) were measured and monitored during several field work sessions. These data were then processed in mixed-effect models. In this way, this thesis investi-gated the (future) reaction of the understorey species to global warming and the role of the forest microclimate in this context.
The following chapters describe the macroclimate, the different forest microclimates and the importance of and processes within understorey plant communities. Subsequently, the experiments are explained in detail and the obtained results are discussed.
2
Climate
2.1
Climate change
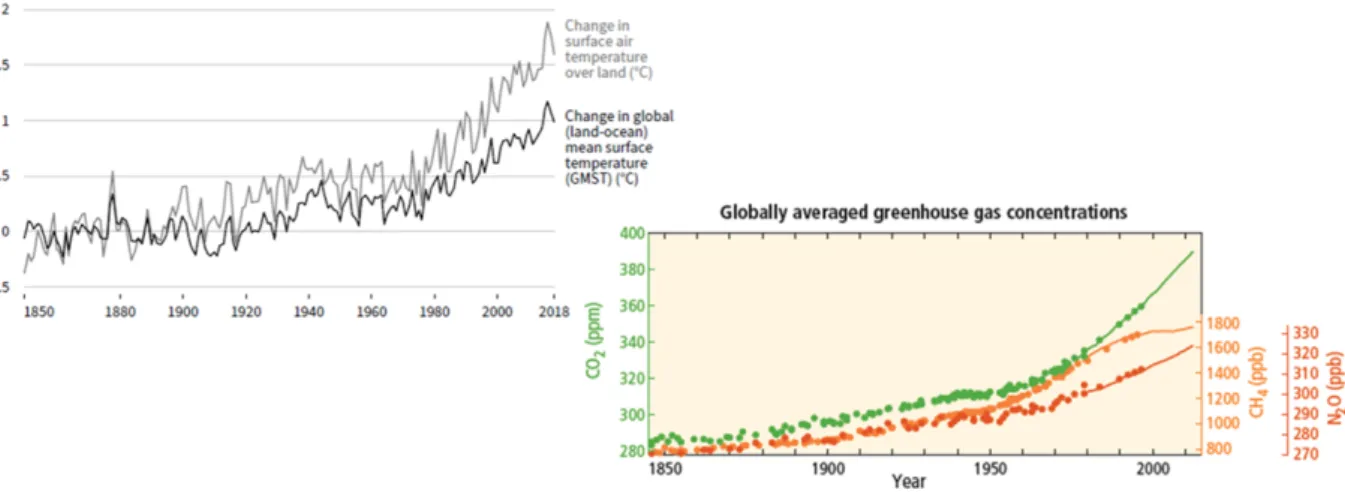
The macroclimate has been changing for millions of years. This natural change is a gradual, cyclic event. Glacial periods which lasted ± 80 000 years each and which are characterised by average cold temperatures, are alternating with interglacials, i.e. periods of ± 10 000 years each with average higher temperatures (Berendsen, 2004; Dobrowski, 2011). This moment in time, the year of 2020, is located in the Holocene (an interglacial). The Holocene era has already experienced many fluctuations in temperature (Dobrowski, 2011; Den Ouden et al., 2016, p. 96-97). From 1950 onwards however, changes were observed that have not occurred at such a velocity in the near and distant past (Pachauri et al., 2014). According to the IPCC 2014 climate report, the temperature in the northern hemisphere during the period 1983 - 2012 was most likely the warmest of the last 800 years (Figure 1) (Pachauri et al., 2014). In 2007, the IPCC even noted that during the last 100 years the average Arctic temperatures increased by almost twice the global average speed, i.e. the global minimum temperature increased almost twice as fast as the global maximum temperature (IPCC, 2007).
Figure 1: At the left side, this figure shows the observed temperature change relative to 1850-1900 (Shukla et al., 2019). At the right side, the global averaged atmospheric greenhouse gas concentrations from 1850 until 2010 are represented, i.e. carbon dioxide (CO2, green), methane (CH4, orange) and nitrous oxide
(N2O, red) determined from ice core data (dots) and from direct atmospheric measurements (lines)
(Pachauri et al., 2014).
This change is not only due to the natural cycle. It was proven that an anthropogenic-induced climate change also plays a huge role in these fluctuations. The main causes of the anthropogenic-induced global warming are greenhouse gas (GHG) emissions (IPCC, 2007) and land use change (IPCC, 2001; Pielke et al., 2002). Greenhouse gas concen-trations of carbon dioxide (CO2), methane (CH4) and nitrous oxide (N2O) in the
atmo-sphere increased tremendously between 1750 and 2011 (Figure 1), respectively by 40%, 150% and 20% (Pachauri et al., 2014). This is mainly due to economic and population
growth (Pachauri et al., 2014). These molecules absorb heat radiation originating from the Earth’s surface and in turn create a layer in the atmosphere that emits heat back and causes an increase in temperature on Earth. The rise in temperature also causes an increase in water vapour in the atmosphere, which makes this layer even more pronounced (Houghton, 2009). This phenomenon is called the greenhouse gas effect. The large in-crease in greenhouse gas concentrations mentioned earlier, is now causing global warming (Houghton, 2009). Land use change on the other hand, contributes to climate change by causing a shift in surface reflectance: the albedo (IPCC, 2001) and the surface-energy budget alters (Pielke et al., 2002). When additionally a land use change like deforesta-tion occurs, 1) there will be less evapotranspiradeforesta-tion which causes warming and 2) a land carbon sink for GHG emissions is lost (Shukla et al., 2019).
Moreover, the climate change associated with this anthropogenic-induced variant occurs at a much higher rate than in past eras (Pachauri et al., 2014). Climate models predict a global temperature increase of 1.5°C between 2030 and 2052. In addition, the temper-ature increase will be greater above land than above water surfaces (IPCC, 2007, 2018). On a global scale, an increase in intensity and frequency of extreme weather events is expected (Pachauri et al., 2014; IPCC, 2018; Seidl et al., 2014; Shukla et al., 2019) on top of the fact that these events have already increased significantly over the past 50 years (IPBES, 2019). Most of the world is also projected to experience an increment in frequency, intensity and duration of heat waves (Shukla et al., 2019). In general, with rising global warming, it is expected that areas with dry climates will increase in number while abundance of polar climates will decrease (Shukla et al., 2019).
On a more regional scale, an increase in frequency and intensity of drought events is predicted for the Mediterranean and Central Europe (Shukla et al., 2019). The predictions for Belgium and The Netherlands suggest that winters are getting wetter, summers drier and precipitation events more intense (Den Ouden et al., 2016, p. 96-97). Shukla et al. (2019) predict that climate zones in the mid to high latitude will generally shift towards the poles and upwards in the higher elevations. Regional winter warming in areas at high latitudes is predicted to accelerate the melting of the permafrost, decrease the surface albedo and cause an increase in abiotic (e.g. drought and wildfires) and biotic (e.g. pests and diseases) disturbances in the boreal forests. This is in contrast to the summer period where warming is likely to be attenuated by higher evapotranspiration of the boreal forests (Shukla et al., 2019).
2.2
Climate factors affect vegetation
Climate is the main driver of the distribution of plant species at a continental scale. Ac-cording to the K¨oppen-Geiger Climate Classification, Europe can be classified as follows: from the Mediterranean (Hot-summer Mediterranean climate/Csa) over Western and Central Europe (Oceanic climate/Cfb) to Scandinavia (Subarctic climate/Dfc to Tundra climate/ET) (Kottek et al., 2006) (Figure 2). The climate determines the length of the growing season, the overall temperature and the water availability for the vegetation to a large extent (Shukla et al., 2019). When the temperature would rise with 1.5°C as a
re-sult of global warming and the macroclimate consequently changes, the tree line in boreal forests will shift northwards, the vegetation yields will change (Shukla et al., 2019) and a loss of biodiversity will occur due to the loss and extinction of species (IPCC, 2018).
Figure 2: This figure displays the Northern Hemisphere of the World Map of K¨oppen-Geiger Climate Classification (Kottek et al., 2006).
2.2.1 Temperature zones
Vegetation gradients are strongly linked to temperature zones. The temperature and the length of the growing season decrease towards the poles (De Frenne et al., 2013a). Additionally, the amount of interannual temperature variability, temperature seasonality and the severity of winter frost increases towards the poles (Pau et al., 2011). For the Northern extratropical hemisphere, moving to the poles, applies (De Frenne et al., 2013a):
• mean annual temperature (MAT): -0.73°C per degree of latitude
• mean growing season temperature (Mar. - Sept.): -0.65°C per degree of latitude • mean temperature of warmest month (Jul.): -0.45°C per degree of latitude 2.2.2 Precipitation zones
Furthermore, the occurrence of certain plant species is related to precipitation zones. In the Northern extratropical Hemisphere, the mean annual precipitation lowers with 4.04 mm per degree of latitude moving towards the poles, with deviations in areas affected by the proximity of oceans, mountains and large wind flows (De Frenne et al., 2013a). In addition, in the Northern Hemisphere, there is a decline in the interannual variability and seasonality towards the pole (Pau et al., 2011).
3
Forest microclimates
3.1
Definition
Microclimate has already been defined in many different ways, depending on the context in which it is used. A broad definition comes from Bramer et al. (2018) who describe microclimate as ’fine-scale climate variations which are, at least temporarily, decoupled from the background atmosphere (macroclimate)’. Geiger et al. (2009) in turn defines the term as ’the climate of an individual site or station... characterised by rapid vertical and horizontal changes’. The main factors determining the microclimate are solar ra-diation, cloud cover, temperature, wind speed and direction, humidity, evaporation and precipitation (Bramer et al., 2018) (Figure 3).
Figure 3: This figure shows the processes on which the state of the macro- and microclimate depends. The arrows show the extent (and sometimes the direction) of the influence of the processes (Bramer et al., 2018).
More specifically in forests, the microclimatic conditions are influenced by the forest structure, density of the canopy, forest stand age (Norris et al., 2012; De Frenne et al., 2013b; Leuschner and Rode, 1999), local topography and soil type (Bramer et al., 2018). In turn, the forest microclimate is one of the main components affecting the carbon cycle (Joos et al., 2010; Knapp et al., 2002; Mercado et al., 2009) and the species composition of the herb layer (Leuschner and Lendzion, 2009). This is due to its buffering effect on the prevailing macroclimate: it weakens extreme conditions (De Frenne et al., 2013b). Moreover, the microclimate influences the functional traits (growth rate, specific leaf area (SLA), plant height...) of species present in the herb layer (De Frenne et al., 2013a) (see section 4.1.1). The different variables and their buffering effect in forests are explained in more detail in the following paragraphs.
3.2
Characteristics
3.2.1 Solar radiation
Solar radiation is an important requirement for plant growth in all vegetation layers. However, the soil and the herbaceous layer in a forest receive only a small amount of the original quantity of solar radiation. For example in summer, in forests on rich soils, the soil receives only 1% to 2% of the amount of light that reaches an open field at the same moment in time (Eber, 1972). There are several factors that determine how much solar radiation a surface receives. A first factor is the surface position relative to the Sun at a specific latitude, in a specific season and at a specific time during the day. The position of the surface (slope and aspect) relative to the Sun is a second important factor. In addition, the quantity of particles in the atmosphere (e.g. aerosols, clouds) determines the percentage of direct and diffuse radiation that reaches the Earth’s surface (Bramer et al., 2018). And lastly, on its way to the soil, the radiation is partially blocked or absorbed by the foliage and woody structures of the present vegetation. A large canopy coverage of the soil results in a high radiation extinction and therefore a small percentage of radiation reaches the herbaceous layer (De Frenne et al., 2013b; Bramer et al., 2018). But also the leaf structure and orientation of the vegetation are of importance: e.g. the amount of radiation reaching the soil is lower at a low sun angle when the leaves are positioned vertically (Bramer et al., 2018). The forest composition (the present tree species) therefore also determines the microclimate through the leaf structure and Leaf Area Index (LAI) of the canopy (Renaud and Rebetez, 2009; Bramer et al., 2018).
3.2.2 Temperature
Reduced transmission of solar radiation due to the presence of tree canopies implies reduced energy for warming of the air under the canopy. Furthermore, some of the radiation energy is used for evapotranspiration which results in lower air temperatures: a cool environment during daytime (Davis et al., 2019; Zeng et al., 2017). In addition, it is observed that the daily temperature fluctuations are smaller underneath the canopy
than outside forests (De Frenne et al., 2019; Geiger et al., 1995): during the growing season, it tends to be cooler during the day and warmer at night in forests compared to outside the vegetation. De Frenne et al. (2019) investigated the global buffering of temperatures under forest canopies compared to open conditions on 98 sites spread over five continents. They found that average and maximum temperatures in forests were respectively 1.7 ± 0.3°C and 4.1 ± 0.5°C cooler than the ones of the macroclimate at the open sites. The minimum temperature below the canopy was on average 1.1 ± 0.2 °C warmer than outside the forest. They also indicated that the temperature offset in forests was more negative (respectively more positive) when the temperature of the macroclimate increased (respectively decreased). Renaud and Rebetez (2009) obtained similar temperature differences for the maximum temperature (namely 5.2K) between open-site and below-canopy climates in Switzerland.
3.2.3 Humidity
The generally lower temperatures ensure that the relative air humidity can be kept high, higher than outside the forest (von Arx et al., 2013). Moreover, Geiger et al. (1995) observed that average daily relative humidity in forests declines with height. In a context of climate change, a high moisture content is beneficial because it protects the understorey plants (herbs and tree seedlings) against summer drought and, in the worst case, death (Lendzion and Leuschner, 2009).
The study of von Arx et al. (2013) also showed a link between the vapour pressure deficit (VPD) offset and the LAI. When there is a dense overstorey (LAI > 4), the VPD offset generally increases with dry soils and when dry periods persist. Among dense canopies, the VPD offset is greatest during these dry periods and in the afternoon. Among open canopies, this is the case during humid-soil periods and in the morning (von Arx et al., 2013).
3.2.4 Wind
The wind and the wind profile can also cause changes in microclimatic conditions. When the wind comes into contact with the canopy or understorey, its speed decreases (Chen et al., 1999). The rate of decrease depends on the roughness or leaf area density of the canopy: the rougher, the greater the decrease (Erisman and Draaijers, 2003). In general, it can be said that wind speeds are reduced under the canopy (Chen et al., 1999). Because of the lower wind speeds, there is also a reduction in air-mixing and lateral transmission of temperature and humidity through wind in forests (Bramer et al., 2018). This reduction intensifies when the distance to the forest edge increases or when the forest structure becomes more complex. Thus, when the forest is viewed from a horizontal perspective, there can exist more variation or heterogeneity of microclimatic temperature and humidity near the forest edge or open spaces due to the reduced air-mixing and lateral transfer. These restrictions within forests encourage increased temperature offsets,
a buffering effect (Bramer et al., 2018; Kov´acs et al., 2017): cooler during the day, but warmer at night (Geiger et al., 1995).
3.2.5 Precipitation
Precipitation has a different spatial distribution above forests in comparison to precipita-tion in microclimates under the canopy. Due to the presence of trees, not all precipitaprecipita-tion reaches the soil directly (e.g. interception and stemflow) causing the precipitation to be redistributed. The vegetation possesses in fact a certain water retention capacity, de-pending on factors like canopy storage capacity (CSC) and LAI. The CSC and LAI also depend on the tree species, age and season (Crockford and Richardson, 2000). In de-ciduous forests of the United States for example, the annual interception loss can vary between 10 and 20%, whereas in coniferous forests it is usually estimated between 20 and 40% due to its higher LAI and its evergreen character (Zinke, 1967). After some time, the precipitation water either reaches the soil, or evaporates and never reaches the forest floor (Crockford and Richardson, 2000). The interception causes the microclimate to cope with different rainfall intensities than the original intensity (Leonardi and Fl¨ uck-iger, 1987). Moreover, the chemical composition of the rainfall changes as a result of, for example, the absorption of dry deposition (Leonardi and Fl¨uckiger, 1987). It is easy to argue that higher rainfall intensities and higher amounts of water per unit time lead to a higher discharge to the forest soil (Den Ouden et al., 2016, p. 162).
3.2.6 Topoclimate
The topography of a landscape (distance from the coast or inland water, altitude, steep-ness and aspect of slope, topographic convergence, etc.) causes variation in temperature, solar radiation, precipitation, evapotranspiration, wind, cold air drainage, etc. which deviate from the macroclimatic conditions (Dobrowski, 2011; Bramer et al., 2018). For example, places close to the sea often experience lower seasonal and daily temperature variations (Maclean et al., 2017) (as opposed to an increase in variations when going in-land (Zellweger et al., 2019)). Renaud and Rebetez (2009) in turn found that south-facing slopes showed larger differences in maximum temperature while north-facing slopes did so for the minimum temperature. Furthermore, the temperature changes spatially much faster along an elevation gradient than along a latitudinal gradient (Jump et al., 2009).
3.2.7 Soil
Related to soil composition in forest microclimates, a study by Wuyts (2009) indicated a difference between the forest edge and the forest core in terms of nutrient deposition. Her study in a birch stand reported that 30% more N and N+S deposition, and an increasing input of potentially acidifying ions can be found in the forest edge (considered 2 m deep) compared to the forest core. For the edge of a pine stand, an increase of more than 100%
in N and N+S deposition was even reported, and this with a greater penetration depth than in the deciduous stands. In contrast to the pine stand edge, the extra throughfall deposition found in the edge of oak and birch stands was approximately 90% lower. Soil moisture on the other hand is an important regulatory factor within microclimates because it plays a role in the surface water and the forests’ energy balance: it indirectly affects the VPD, and the temperature and humidity close to the ground (see also section 3.2.3) (Bramer et al., 2018; von Arx et al., 2013). Of course soil moisture is also of direct importance to the water availability of plants (Bramer et al., 2018).
The effect of the soil type is not further discussed here because it is of lesser importance to this transplantation experiment: all plants were planted in the same kind of potting soil. If further research is carried out using the local soil, its properties will play an important role in the growth of the vegetation. The soil chemistry is namely one of the main factors affecting the distribution and abundance of forest species (Leuschner and Lendzion, 2009).
3.3
Forest structure and management
As mentioned in section 3.2, there is a wide variety of factors that determine the micro-climate. In addition, a change in the forest structure or in the tree species composition through management or a natural event, affects these microclimatic variables and can cause a major change in the microclimatic environment (Norris et al., 2012; Geiger et al., 1995). Different combinations of overstorey species cause variations in the occurring herb layer species as a result of different amounts of incident light and fluctuating soil fertil-ity (microclimatic variables) (Neufeld and Young, 2003; Muller, 2003). In this way, this interaction suggests a link between the herb layer stratum and the overstorey stratum (Gilliam, 2007). However, this linkage between the two strata does not apply to young stands (e.g. 20 years), but gradually becomes stronger as the stands grow mature (80 to 100 years) according to Gilliam et al. (1995). They stated that the same applies to their response to environmental gradients: in the first place, the two strata react to different gradients, but start reacting similarly to the same gradients as the stand ages. For ex-ample, disturbances (like a canopy gap > 200m²) give rise to a decrease in the canopy cover, which in turn cause warming, less shade and establishment of more heat-tolerant species in the herb layer (De Frenne et al., 2013b; Overpeck et al., 1990).
In this section, the differences in structure and management of ”forest edge - forest core” and ”more open (structurally simple) forest - more dens (structurally complex) forest” will be discussed.
3.3.1 Forest edge and core
Murcia (1995) defines forest edges as the transition zones where forest habitat and the sur-rounding matrix interact. Energy flows, nutrients and species from neighbouring
ecosys-tems are exchanged across these forest edges. The edge width can cover distances ranging from a few metres to 200 metres (Murcia, 1995; Honnay et al., 2002; Chen et al., 1995), but is generally defined as the width over which the environmental conditions, the species composition and the abundance differ from those of the core area (Forman and Moore, 1992). The allocation of the exact edge width depends on the abiotic factor considered (Murcia, 1995; Honnay et al., 2002): in a study of Gehlhausen et al. (2000), relative humidity attains a depth of edge influence (DEI) of 80 m (west aspect) while Brothers and Spingarn (1992) obtained a DEI of 8 m (north aspect) to 35 m (south aspect) for photosynthetically active radiation (PAR).
During the day, forest edges differ microclimatically from the forest core in receiving or having higher solar radiation, higher air temperature, higher soil temperature, lower air humidity and lower soil moisture (Brothers and Spingarn, 1992; Chen et al., 1999) (Figure 4). This was proven in an American experiment of Brothers and Spingarn (1992) in which deciduous forests were bordered by cropland. At two meters inside the forest, only ± 1% of the original light intensity, an air temperature decrease of 1.8°C, a soil temperature decrease of 3.7°C and a relative humidity increase of 9% was observed compared to outside the forest. Wind plays an important role by increasing air mixing and the lateral transfer of heat and humidity as the distance to the forest edge decreases (Bramer et al., 2018). Wind causes a decreased temperature offset approaching the forest edge (Bramer et al., 2018).
Figure 4: This figure shows the variation of microclimatic factors from a clearcut into a forest stand during day (diamonds) and night (circles). Values for (a) air temperature, (b) relative humidity, and (c) soil temperature are displayed for the summer (thin lines) and winter months (thick lines) in an old-growth Douglas-fir forest in southern Washington (Chen et al., 1999).
In addition, transition zones are richer in competitive and light demanding species (Hon-nay et al., 2002). In the forest border, the habitat of the native forest flora is now increasingly invaded by exotic species (Wilmanns et al., 1986; Hester and Hobbs, 1992; Gehlhausen et al., 2000) and weed plant species from the surrounding agricultural land-scape (Honnay et al., 2002). Govaert et al. (2019) carried out research into the effect of the forest edge on plant communities at different forest management interventions. They found that among generalist plant species, species richness declined from the edge to the core. The species diversity of specialist plant species experienced no effect at all of the distance to the edge (Govaert et al., 2019).
Besides deviating climatic conditions and species composition, forest edges have different patterns of nutrient mobilisation and decomposition rates compared to the forest core (see also section 3.2.7) (Murcia, 1995). Increased deposition of potentially acidifying and eutrophying ammonium, nitrate and sulphate occurs because of atmospheric deposition and of neighbouring (agricultural) parcels that enhance the input of chemical compounds into forest edges via drift (Thimonier et al., 1992; Wuyts, 2009).
3.3.2 Structurally simple and complex forest stands
The structural complexity of a stand is defined by McElhinny et al. (2005) as a measure of the number of different attributes present and the relative abundance of each attribute. The main attributes considered are foliage arrangement, canopy cover, tree diameter, tree height, tree spacing, tree species, stand biomass, understorey vegetation and wood debris (McElhinny et al., 2005). Forest stands characterised by tall canopies, high biomass, high vertical complexity or high density seem to reduce the increasing maximum temperatures in forests caused by anthropogenic global warming. Complex forest structures thus have a thermal insulating or buffering effect (Frey et al., 2016; Zellweger et al., 2019) compared to low-structural stands. Furthermore, Kov´acs et al. (2017) study suggests that stand structure has a more dominant influence on microclimatic variables (e.g. air temperature and humidity) than tree species. The presence of a subcanopy and a shrub layer is necessary for a more thermodynamically efficient, stable and resilient ecosystem (Kov´acs et al., 2017; Lin et al., 2009).
Furthermore, as with the forest edges, the amount of airmixing and lateral transfer of heat and humidity by the wind decreases as the forest stand structure becomes more complex. This also leads to a greater temperature attenuation (Bramer et al., 2018; Kov´acs et al., 2017). The amount of dry deposition in the forest edge is also influenced by the stand structure: a wind tunnel study comparing sparse stands to dense ones, suggests that 40% less deposition was found in dense forests compared to sparse forests (Wuyts, 2009). For the species diversity in more open or dense forest stands, reference can be made again to the paper of Govaert et al. (2019) (see section 3.3.1). The decrease of generalists’ species richness was smallest when going from edge to core in unthinned stands. Moreover, their richness decreased more under dense, shady tree species. Specialist plant species richness on the other hand was not affected by forest management practices such as thinnings (Govaert et al., 2019).
4
Understorey plant communities
The herbaceous layer can be found in the forest understorey. Gilliam (2007) defined this layer as the forest stratum with vascular species that reach a height of 1 meter or less, and includes both resident species and transient species. Resident species are defined as the true herbaceous species. Transient species refer to the vegetation temporarily present in the herb layer such as seedlings, sprouts and young saplings of woody species. However, the herbaceous layer is easily overlooked. Gilliam (2007) dedicated this to the low above-ground biomass of the herb layer. In forests in the northern hemisphere for example, the herb layer represents on average only 0.2% of the total above-ground biomass (Gilliam, 2007). But despite the small percentage of above-ground biomass, it still accounts for ± 4% of forests’ net primary productivity (NPP) (Gilliam, 2007). A more recent study of Landuyt et al. (2019) even mentions a relative contribution up to 22% of the understorey to the total forest productivity. The large variability in these values is partially attributed to the various understorey definitions used in the literature (Landuyt et al., 2019).
4.1
Forest biodiversity and the threats posed to it
The herbaceous layer is of major importance for the (forest) biodiversity because it rep-resents on average more than 80% of the total forest species richness (Gilliam, 2007). Many of the existing fauna and flora are also strongly linked to trees in a forest environ-ment (Den Ouden et al., 2016, p. 187). In addition, each forest differs in composition and structure, and so each forest has a different degree of species richness. Nevertheless, there is a positive relationship between a species-rich herb layer and a species-rich overstorey, but this can vary depending on the forest type (Gilliam, 2007; Zhang et al., 2017). A current global problem however, is the accelerating and growing loss of biodiversity (IPBES, 2019). Particularly in the vicinity of densely populated areas, biodiversity is declining sharply due to habitat destruction, habitat fragmentation, land use change, pollution, forest management changes and the introduction of invasive species (Gilliam, 2007; Newbold et al., 2015; Foley et al., 2005; Gilliam, 2016; IPBES, 2019). Another major driver expected to cause biodiversity loss, is climate change (see section 2.1) (Pereira et al., 2012; IPBES, 2019).
The increasing loss of biodiversity makes it even more important to strive for biodiversity preservation. In this way, extensively managed forests are becoming more important for biodiversity conservation: they serve as a refugium for wild fauna and flora (Den Ouden et al., 2016, p. 187). Biodiversity is in particular crucial to the functioning of ecosystems (Loreau and Hector, 2001; IPBES, 2019). In fact, an ecosystem function is partially generated by species diversity, diversity of functional traits and genetic variation (Loreau and Hector, 2001; Den Ouden et al., 2016, p. 188). However, it is necessary to recognise that the preservation of biodiversity is a dynamic process as biodiversity changes when crucial drivers (e.g. climate) change (Den Ouden et al., 2016, p. 493).
4.1.1 Plant strategies
Forests, with their characteristic low light transmission, provide a unique ecosystem. Rich forests whose soil experiences only 1 to 2% of the total emitted sunlight, are only a suitable habitat for a select group of shadow-loving plants (Eber, 1972; Den Ouden et al., 2016, p. 202). The development of a closed herbaceous layer of competitive species on the other hand, can take place when more than 10% light is available at the bottom of a uniform structured forest (Den Ouden et al., 2016, p. 203). After all, in order to ensure a proper plant establishment and survival in a forest ecosystem, the species should have a certain degree of tolerance for shade, litter accumulation and grazing (Den Ouden et al., 2016, p. 205).
Plant species possess specific survival (or ecological) strategies to claim their space in an ecosystem. These strategies are translated into species-specific outcomes for functional traits. Functional traits are defined by Violle et al. (2007) as morphological, physiologi-cal and phenologiphysiologi-cal features of an individual that indirectly influence performance and fitness through their impacts on growth (e.g. height, SLA), reproduction (e.g. seed) and survival. Westoby (1998) stated that plant height, for example, is a functional trait strongly related to light availability. Most plants grow as much and as fast as possible towards the available light. This is done as quickly as possible because plants compete for light. However, not every plant has the same growth strategy. Natural selection ensures that in addition to the species that grow very fast in the initial stage and therefore take the light away from their competitors, other species with a different successful survival strategy will catch up with them later on in the growing period. In this way, plants can store enough carbon during a limited (or unlimited) light-rich period in their vegetative stage to be able to reproduce later on. A second functional trait example discussed by (Westoby, 1998) and (D´ıaz et al., 2016) is the specific leaf area or SLA. SLA stands for the amount of photosynthesising leaf area per unit dry leaf mass. This functional trait is related in the literature to mass-based net photosynthetic capacity, mass-based leaf N and leaf longevity (Reich et al., 1997). A high SLA is associated with a faster turnover of plant tissue (Grime, 1994) and consequently rapid growth. A low SLA on the other hand represents a longer life span of the leaves (Reich et al., 1992, 1997) because these plants prioritise the development of their structural strength and defence mechanisms (Westoby, 1998). A low SLA also means a high leaf mass and a long mean residence time of nutrients such as nitrogen (Aerts and Van der Peijl, 1993).
The CSR (Competitor, Stress tolerator, Ruderal) strategy of Grime et al. (1979) classifies species according to their reaction to different environmental factors, which corresponds to those functional trait approaches. A first group he considered, includes the competitors or dominant species. This group appears on sites with little stress and little disturbances: places with very favourable conditions resulting in an interspecies competition for light, food and space. Most competitors take up their space by making use of underground food reserves. This gives them the opportunity to grow very high or wide at the beginning of the growing season, to develop a high biomass and to occupy the space of subordinate species (Grime et al., 1979; Den Ouden et al., 2016, p. 204). This strategy allows com-petitors to strongly influence the microclimate and the type of humus, or even change
the forest development (Grime et al., 1979; Den Ouden et al., 2016, p. 204).
A second group within the strategy of Grime et al. (1979) are the stress tolerant species. They can be found in places with a lot of stress and little disturbance. These are also places where competition between individuals is lower. Stress tolerant species generally grow slowly, but possess a fast response capacity when the stress disappears in order to take full advantage of available resources. Incidentally, Grime et al. (2014) claim that more than a third of the ancient forest species are primary stress tolerant species, and so do Hermy et al. (1999). Only 11% of all ancient forest species would not apply any stress tolerant strategy (Hermy et al., 1999). The ancient forest species group possesses characteristics such as low stature, susceptibility to drought, low competitiveness, limited long-distance dispersal due to their often large seeds (slow colonizers), a short period of fertility and usually no persistent seed bank (Hermy et al., 1999; Verheyen et al., 2003; Brown and Oosterhuist, 1981; Blondeel et al., 2020a). Their numbers increase with the age of the forest, but this process progresses very slowly (Den Ouden et al., 2016, p. 495). A first subgroup of (semi-)shade tolerant species, such as common wood sorrel (Oxalis acetosella), is adapted to their environment by a high chlorophyll leaf content, a low maximum specific growth rate and a low light saturation value (10-30 W/m²) (Ernst et al., 1995; Valladares and Niinemets, 2008; Den Ouden et al., 2016, p. 205). In addition, the ancient forest species includes a second subgroup that applies the unique trait of shade avoidance: spring ephemeral species. Spring ephemeral species are plants that sprout in spring, before the trees and shrubs do so (Rothstein and Zak, 2001). They do this because they are light-loving and they have enough growth reserves through their rhizomes and tubers. This subgroup has a high light saturation value (± 75 W/m²) and a low compensation point (2-5 W/m²) (Den Ouden et al., 2016, p. 205). Examples of spring ephemeral herbs are the wood anemone (Anemone nemorosa) and the wild garlic (Allium ursinum) (Hermy et al., 1999; Den Ouden et al., 2016, p. 205).
The final group within Grime et al. (1979)’s CSR strategy are the ruderals. These species grow very well in places with little stress, but where disturbances occur frequently. These species are characterized by their fast life cycle: quick germinating, growing and dispersal of their seeds before a new disturbance takes place. Moreover, these fast colonizing species often have a high SLA and produce light seeds (Verheyen et al., 2003).
4.1.2 Ecosystem functions and services
The concept of ecosystem functions is defined by Meyer et al. (2015) as the fluxes of en-ergy, matter and information that link the components of ecosystems. These components can on the one hand be described as biotic (being the primary producers, consumers, decomposers and dead organic matter) and on the other hand as abiotic (e.g. nutrient and water stocks) (Landuyt et al., 2019). The other concept, ecosystem services, relies on ecosystem functions and is defined as the functions or products that an ecosystem offers to humans from which they can gain direct or indirect benefits (Meyer et al., 2015).
Landuyt et al. (2019) noted that in temperate forests, the herb layer also provides sig-nificant contributions to ecosystem functions. The degree of the contribution however depends on the considered ecosystem function, the overstorey properties and the envi-ronment. They state that the herb layer affects the biogeochemical fluxes (e.g. carbon, nutrient and water cycling) directly through carbon sequestration, nutrient uptake and evapotranspiration (Figure 5). There also exists an indirect contribution because the herb layer co-determines the amount of key species (fauna and flora) that are present. These contributions ensure that the herb layer can 1) modify processes belonging to pri-mary producers (such as carbon, nutrient and water fluxes); 2) filter the regeneration of the canopy layer; 3) provide food and habitat for the key species (e.g. pathogens, decomposers, pollinators) (Landuyt et al., 2019).
In this way, Landuyt et al. (2019) reported that the herb layer thus possesses the power to modify the functioning of temperate forests when global change occurs. Global change will potentially modify the herb layer’s available resources and current growth conditions, and hence its productivity and contribution to ecosystem functioning. Besides, the tree layer, which in turn highly affects the herb layer, is also subject to global change and will potentially experience a transformation. Therefore, these direct and indirect effects of global change on the herb layer may determine the future ecosystem’s functioning (Landuyt et al., 2019).
Figure 5: Representation of the expected direct and indirect pathways of how global change will affect the understorey and its functioning. The expected short term (full arrow) and long term (dotted arrow) effects are depicted separately (Landuyt et al., 2019).
4.2
Conditions affecting the herbaceous vegetation
The herbaceous understorey is sensitive to changes in growth factors on both spatial and temporal scales. The most important factors/phenomenons that cause a change in the understorey are listed below (Gilliam, 2007).
4.2.1 Increase of atmospheric CO2 levels and N deposition
In general, plant growth increases when CO2 concentrations in the atmosphere increase
(Shukla et al., 2019). However, plants are only sensitive to changing atmospheric CO2
concentrations to a certain extent: it is a non-linear relationship (H¨attenschwiler and K¨orner, 1996). H¨attenschwiler and K¨orner (1996) were able to establish this by setting up an open-top growth chamber experiment in a spruce forest in Sweden, varying the CO2 concentrations for three understorey species (Oxalis acetosella, Homogyne alpina
and Rubus hirtus). The various species reacted differently in terms of changes in pho-tosynthesis rate, growth rate and plant-herbivore interactions, which resulted in large interspecific variation. Because of these interspecific variations, changes in atmospheric CO2 concentrations can cause shifts in the species composition of the herb layer (Gilliam,
2007; H¨attenschwiler and K¨orner, 1996).
Plant growth moreover, is also influenced by increasing nitrogen concentrations (Hejcman et al., 2012). When plants were subjected to experiments in which extra nitrogen was added, an increase in height and SLA was observed (Hejcman et al., 2012; Mao et al., 2017). However, chronic atmospheric nitrogen deposition is currently a major threat to ecosystem biodiversity (Dirnb¨ock et al., 2014). A long-term monitoring experiment across Europe conducted by Dirnb¨ock et al. (2014) showed that nitrophilic species gradually replaced N-efficient species in plant communities.
4.2.2 Light availability in the understorey
Due to the trees in the canopy, forest herbs usually grow in low light conditions. The vegetation in the understorey competes with each other for the remaining light (Val-ladares et al., 2016) through an asymmetric competition: the largest individuals capture a disproportionate amount of light (Freckleton and Watkinson, 2001).
When the amount of light available to a plant changes, this plant can react quickly with plasticity in height and SLA (Valladares et al., 2002). The first mentioned functional trait, the plant height, increases when extra light is available (Blondeel et al., 2020a). This happens because plants compete with each other in order to catch the most light and therefore strongly invest in their growth in order to outperform each other (Westoby, 1998; Freckleton and Watkinson, 2001). The same happens for the cover (Blondeel et al., 2020a). In addition, the size of the plant response depends on the amount of light, as Semchenko et al. (2012) also proved: when only 10% light was available, the dry
plant mass was significantly lower than in full sunlight. More light led to an increase in biomass production (Jagodzi´nski et al., 2016). Contrastingly, 25% daylight would hardly make a difference compared to full sun when it comes to dry weight (Semchenko et al., 2012). In the already mentioned experiment of Blondeel et al. (2020a), also the SLA was examined. They found that the mean SLA generally decreased with increased light available for shade-tolerant species.
Apart from a change in functional traits, there may also be a change in the community composition according to De Frenne et al. (2015). In a context of (global) warming, extra light would cause cold-tolerant species to be dominated more quickly by warmth-preferring species (see further, thermophilization 4.3). It is hence stated that a shortage of light (or shade of trees) can cause a delayed change in the understorey community and a delayed understorey response to global change (De Frenne et al., 2015).
4.2.3 Temperature in the understorey
The prevailing temperature in the understorey is a last important aspect that can influ-ence the herb layer. For example, Blondeel et al. (2020a) and Maes et al. (2020) showed that higher temperatures significantly increased the plant height of the understorey. The SLA of vernal species on the other hand increased significantly in the heat experiment of Blondeel et al. (2020a). Another experiment by Maes et al. (2020) also investigated the effect of SLA at higher temperatures, but for naturally-occurring species in the forest. They found that a higher temperature caused the SLA to decrease. This can possibly be explained by the fact that SLA shows a trade-off between mass-based net photosynthetic capacity (biomass production) and resource conservation (Westoby, 1998; Reich et al., 1997). In environments where sufficient resources (e.g. nutrients and water) are present, plants mainly have a high SLA and consequently a faster turnover rate and shorter leaf lifespan (Westoby, 1998; Wright et al., 2004; Ordo˜nez et al., 2009). In more stressful environments such as warm areas with a water shortage, plants will want to conserve their resources as much as possible so that thicker leaves with a longer lifespan (sclero-phyllous) can be useful (= low SLA) (Westoby, 1998; Wright et al., 2004; Ordo˜nez et al., 2009; Maes et al., 2020).
4.3
Thermophilization and community shift
4.3.1 Definition
Thermophilization is defined as the shift within plant communities to warmth-adapted/ southern-xeric species due to climate change (Helm et al., 2017; Stevens et al., 2015; De Frenne et al., 2013b). As a result, the abundance of the forest species of colder/ north-temperate regions is said to be decreasing, while the species adapted to warmer conditions are increasing their dominance with rising temperatures (Stevens et al., 2015; De Frenne et al., 2013b).
4.3.2 Driving factors
Forest disturbances and changes in forest structure cause a shift in the degree of ther-mophilization since they modify the microclimate of the understorey (Stevens et al., 2015). De Frenne et al. (2013b) state that high canopy densities during the growing season provide more shade and reduce the temperature near the forest floor. The ther-mophilization rate is therefore lower and the introduction of warmth-adapted species is attenuated. On the contrary, cold-adapted species are less sensitive to shifts in canopy cover and their responses are more variable (De Frenne et al., 2013b). So it can be stated that when disturbances occur, this thermophilization reduction is reversed (Stevens et al., 2015; De Frenne et al., 2013b).
Thermophilization will probably take place even more when heat waves increase in fre-quency and duration, resulting in an increase in evapotranspiration and a drier soil. According to a long-term study by Helm et al. (2017), a shift in the understorey species composition was observed, even in a relatively humid mountain climate (Austria). This is probably because of limited water availability. Thermophilization and drought are there-fore important drivers for understorey community shifts. They are in fact independent drivers for community shifts, whether or not forest disturbances take place.
4.3.3 Climate lag
As climate change accelerates, it is more difficult for plants to track suitable climates along latitudinal than along elevational gradients as the isotherms are further apart over latitudes than over heights (De Frenne et al., 2013a). This greater latitudinal distance to be bridged, causes both species migration and community shifts to lag more behind the global warming (De Frenne et al., 2013a).
Nevertheless, there appears to be a climatic lag in relation to climate change (De Frenne et al., 2013b). This includes a slowdown in forest community responses (or even no response at all) towards rising temperatures because of the microclimate buffering effect (De Frenne et al., 2013b). As mentioned earlier in section 4.2.2, a low light availability (tree shade) is mainly responsible for this slowdown and climatic lag. Only when extra light is added, the directional plant community response to climatic warming accelerates (De Frenne et al., 2015). As a result, when the light regime changes, the plant community also changes (Helm et al., 2017).
4.3.4 Effects of thermophilization
De Frenne et al. (2013b) already investigated whether community shifts took place as a result of climate change (thermophilization). For this survey, 1409 experimental plots over 29 forested regions across Europe and North America were investigated for which at least two vegetation surveys were carried out over a period of 12 to 67 years. During their
research, they found that one third of the species originally present in the plots already had been replaced by other, often more warm-adapted species.
As a result of global warming, changes in daily or seasonal temperature patterns are likely to occur. This change in patterns may actually first influence the phenological processes within plants, prior to thermophilization, making them more resemblant to warm-adapted species (Gilliam, 2016). The herb layer will have to deal with several changes (e.g. changes in the growth and reproduction processes of plants, and processes that must keep the plants alive) (De Frenne et al., 2015; Blondeel et al., 2020a), until the environment becomes too unfavourable for them.
5
Research questions
In spring 2019, a transplantation and a light and warming experiment were performed in forests across five regions in Europe (Sweden to Italy) for the FORMICA (FORest MICroclimate Assessment) project. The aim of this research was to investigate whether a change in the response of understorey herbs to climate change occurred and whether forest microclimates could buffer these changes. Within the framework of this thesis, the following research questions were investigated:
• What effect does a forest microclimate have on the species persistence and the performance of herb layer species across a north-south gradient in Europe?
• What is the effect of experimental warming and/or light addition on the response of the understorey community within forest microclimates across a north-south gradient in Europe?
6
Methodology
6.1
Experimental multigradient approach
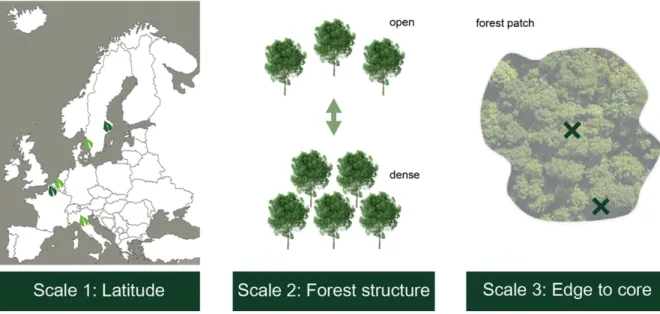
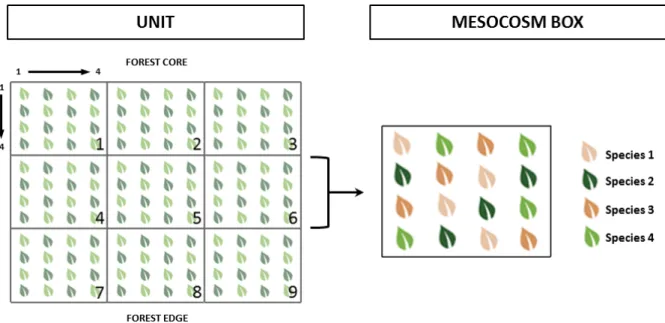
This study on forest microclimates was conducted across Europe on three different scales: a latitudinal gradient, a forest structure gradient and an edge-to-core gradient (Fig. 6).
Figure 6: Experimental multigradient approach: experiment on three scales: 1) latitudinal gradient, 2) forest structure gradient, 3) edge-to-core gradient
Twenty experimental plots were distributed along the three climatic gradients. Five regions were selected along the latitudinal gradient in order to naturally incorporate the effect of the macroclimate (from central Sweden, 59°N to central Italy, 43°N). This transect was approximately 1700 km wide. In each region, four plots were installed in forest stands with following requirements: a minimum area of 4 ha (to allow an edge-to-core gradient) and a mesic deciduous forest dominated by oaks (Quercus robur, Quercus petraea, Quercus cerris, Quercus pubescens) possibly accompanied by other species such as Fagus sylvatica, Fraxinus excelsior, Castanea sativa, Populus tremula, Betula pendula, Acer sp. and Tilia sp..
Subsequently, the four plots of each region were divided over two different forest stands: two each in an open and a dense forest. These stands differed in vertical forest structure and canopy openness. The dense stands were ideally structurally more complex (e.g. present shrub and secondary tree layer) and a total canopy cover of 90-95% was intended. The open stands were ideally structurally more simple (e.g. absent shrub and secondary tree layer) and a canopy cover of less than 70% was being pursued (Figure 7).
Figure 7: Photos of the forests in the experiment with on the upper row the complex forest stands, and on the lower row the structurally simple forest stands. The different forests are in (a) Stockholm (b) Halmstad (c) Ghent (d) Amiens (e) Florence (© Van Loo J., De Blaere R. and Vaneenooghe S.)
The last division was made within the two previous types of forests where one plot was positioned in the forest edge and the other in the core. The edge plots were located in the south-directed forest edge (SW or SE were also allowed) and were located at ±5 m from the edge between the last line of bigger trees. In addition, forest edges adjacent to grassland, farmland or gardens were preferred. The plot in the forest core, on the other hand, was installed at ±100 m from the edge plot and all other forest edges, and towards the centre of the forest patch. According to this multigradient approach, transplantation experiments were set up in forests in France (Amiens) and Sweden (Stockholm). In Bel-gium (Ghent), Italy (Florence) and Sweden (Halmstad) the transplantation experiments were extended with a light and warming experiment (see sections 6.2 and 6.3).
6.2
Transplantation experiment
Transplantation experiments were set up in forests in Sweden (Stockholm and Halmstad), Belgium (Ghent), France (Amiens) and Italy (Florence) in April and May 2019. This experiment was carried out by transplanting a selection of herbaceous species with iden-tical origin to forests of several European regions within and beyond the borders of their natural distribution area. This may reveal the role of forest microclimates on herbaceous species persistence and their range limits.
6.2.1 Species selection strategy
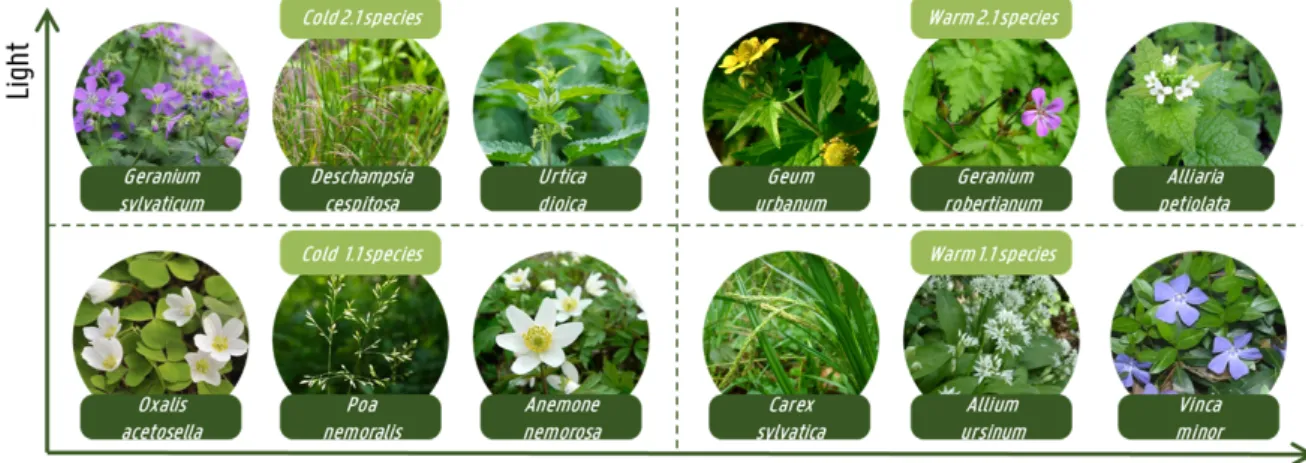
In this transplantation experiment regarding macro- and microclimates, the variation in light and warmth preference of herbaceous species was used (and traced via functional traits) to investigate how species react to different macro- and microclimate situations and how this differs according to the natural properties (e.g. thermal tolerance and light preference) of these species. Therefore, the decision was made to select twelve species based on fundamental species properties such as their thermal tolerance and light preference (Figure 8).
Figure 8: Figure with the twelve selected species, grouped and arranged according to their light (y-axis) and temperature (x-axis) preference. The 2.1 species group refers to forest generalists, the 1.1 species group to forest specialists.
A first division was made using the mean annual temperature within the distribution range of 426 European plant species: species were assigned to the cold (MAT < 13.6°C), respectively warm group (MAT > 13.6°C). In this way, species with different thermal tolerances were selected. The MAT for every species was obtained by first establishing a Gaussian thermal tolerance curve based on its distribution range. From this curve, 1000 bootstrap replicates were generated and from these 1000 replicates, the MAT and the 95% confidence intervals were calculated for each species. The final MAT of 13.6°C was obtained by averaging the 426 species-specific MAT’s. Also the mean temperature range was calculated from the replicates and was equal to 11,7°C. This enabled the division into temperature generalists (> 11.7°C) and temperature specialists (< 11.7°C). As a second property, the light preference of herbaceous species was studied. This was done based on a division into 1.1 species (= forest specialists) and 2.1 species (= forest generalists) (Heinken, 2019), and into Ellenberg Light Indicator Values (Table 1). Both methods resulted in a similar grouping of species regarding their light preference.
Based on the thermal tolerance and light preference classifications from the previous paragraph, four conceptual species groups were created: warm 1.1, warm 2.1, cold 1.1 and cold 2.1. In each conceptual group, three species were retained that possess the
specific group characteristics (Figure 8). The choice to put three species in each of the four groups was made in order to obtain a more general study.
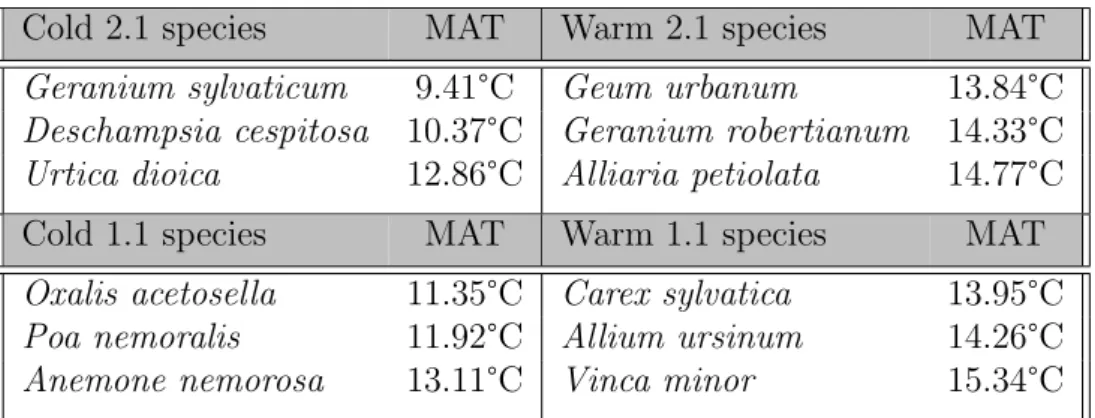
Table 1: Selected species and their MAT, classified in the four conceptual species groups
Cold 2.1 species MAT Warm 2.1 species MAT
Geranium sylvaticum 9.41°C Geum urbanum 13.84°C
Deschampsia cespitosa 10.37°C Geranium robertianum 14.33°C
Urtica dioica 12.86°C Alliaria petiolata 14.77°C
Cold 1.1 species MAT Warm 1.1 species MAT
Oxalis acetosella 11.35°C Carex sylvatica 13.95°C
Poa nemoralis 11.92°C Allium ursinum 14.26°C
Anemone nemorosa 13.11°C Vinca minor 15.34°C
Other plant characteristics (such as temperature specialists or generalists, CSR-classification, Colonization Capacity Index (CCI) and Recovery Rate (RR), life forms, range edges to south and north, and plant functional traits) were also taken into account in order to create communities consisting of a diverse mix of species.
• The temperature specialists (respectively generalists) turned out to be the most similar to the warm adapted species (respectively cold adapted species). The pro-portion of generalists-specialists is reasonably balanced in this study.
• Concerning the CSR classification, the 1.1 (forest) species appeared to be mainly stress-tolerant whereas the 2.1 (forest and open vegetation) species have a more competitive/dominant character.
• The 1.1 species have a rather positive CCI and negative RR, which is typical for old forest species (Verheyen et al., 2003; De Frenne et al., 2011a). The opposite is true for the 2.1 species.
• At least one graminoid species and two herb species were selected in each group, except for the warm 2.1 species group.
• In order to obtain transplantations both within and beyond the natural distribution range of the species, species with a distribution area that do not cover Europe from our most northern site (Stockholm) to our most southern site (Firenze) were preferred.
• For the plant functional traits, diverse species with a varying range of seed mass, plant height, and SLA were combined so that there was enough variation in func-tional trait values within each planted community. This was especially important since the functional traits are investigated in this study.