Netherlands Environmental Assessment Agency, October 2009
Policy Studies
How do biodiversity and poverty relate?Decision makers face this challenging question when they explore ways of simulta-neously achieving the Millennium Development Goals and the CBD 2010 targets for biodiversity conservation. Reducing poverty while conserving biodiversity – a ‘win-win’ – can be reached locally. However, such a positive impact is hard to realise if all trade-off effects elsewhere and in the future are considered. Most resource-use systems follow a similar pattern. Decreasing poverty coincides with decreas-ing biodiversity, creatdecreas-ing a ‘win-lose’ situation, up to a certain threshold. Then, the correlation shifts to increasing poverty with decreasing biodiversity, and becomes ‘lose-lose’.
The relationship between biodiversity and poverty largely knows 16 determinants, characterising socio-economic context, ecosystems and production processes. Market integration, access to capital, management skills and productivity divide all cases into two types of resource-use system: market-oriented and capital-driven, or subsistence-oriented and poverty-driven. How these determinants influence biodi-versity and poverty also depends on cross-cutting factors, such as population den-sity and growth, ecosystem sensitivity to degradation, governance, and policies on poverty alleviation and biodiversity protection. Policy interventions may shift nega-tive trends towards a more posinega-tive direction, making them policy driven.
How do
biodiversity and
poverty relate?
An explorative
study
How do biodiversity and poverty relate?
An explorative study
How do biodiversity and poverty relate? – An explorative study
© Netherlands Environmental Assessment Agency (PBL), Bilthoven, October 2009 PBL publication number 555050004
Corresponding Author: Tonnie Tekelenburg; Tonnie.Tekelenburg@pbl.nl
Parts of this publication may be reproduced, providing the source is stated, in the form: Netherlands Environmental Assessment Agency, How do biodiversity and poverty relate? An explorative study, 2009.
This publication can be downloaded from our website: www.pbl.nl/en. A hard copy may be ordered from: reports@pbl.nl, citing the PBL publication number.
The Netherlands Environmental Assessment Agency (PBL) is the national institute for strategic policy analysis in the field of environment, nature and spatial planning. We contri-bute to improving the quality of political and administrative decision-making by conducting outlook studies, analyses and evaluations in which an integrated approach is considered paramount. Policy relevance is the prime concern in all our studies. We conduct solicited and unsolicited research that is both independent and always scientifically sound.
Office Bilthoven PO Box 303 3720 AH Bilthoven The Netherlands Telephone: +31 (0) 30 274 274 5 Fax: +31 (0) 30 274 44 79 Office The Hague PO Box 30314 2500 GH The Hague The Netherlands Telephone: +31 (0) 70 328 8700 Fax: +31 (0) 70 328 8799 E-mail: info@pbl.nl Website: www.pbl.nl/en
Preface 5 The Netherlands Environmental Assessment Agency (PBL)
has been assigned by the Dutch Government to contribute to several publications of international conventions and the UN, such as the Millennium Ecosystem Assessment (2005); CBD’s Global Biodiversity Outlook 2 (2006); UNEP’s Global Environ-ment Outlook 4 (2007), and recently, PBL has been invited to contribute to the meeting of the Club of Rome (2009). The main topics concern sustainable development, the role of environment in reaching the Millennium Development Goals, climate change consequences and adaptation, and the role of biodiversity in development, and, in particular, poverty reduc-tion. PBL contributes with information to improve the quality of policy-making by way of assessing future impacts of deve-lopment on the environment, nature and spatial planning. Poverty alleviation and biodiversity conservation are heavily linked, but the relationship is not well understood. To con-tribute to a theory on the complex relationship between poverty and biodiversity, we have responded to the request of the Directorate General for international Cooperation (DGIS) of the Ministry of Foreign Affairs, by carrying out an explorative research on the basis of 11 in-depth case studies with research and policy counterparts in developing countries.
This study indicates that two intervals exist: biodiversity is being lost while human well-being is improved and poverty is initially reduced, and secondly, biodiversity loss is rea-ching a critical value whereby production drops and human well-being and poverty are both affected negatively. The first interval appears in non-vulnerable ecosystems, the second one in ‘brittle’ ecosystems where poverty is often concentrated.
What do these – simplified – mechanisms imply for socio-economic development policies? Focus aid on the poor, subsistence-based natural-resource users, in a situation with high biodiversity loss and relatively low production, or focus on modern, market-oriented production systems without guarantees of benefits for the poor, or do a bit of both? The world is desperately waiting for evidence-based answers. These insights offer challenges at the national and internati-onal policy levels. We hope that this document will prove to be a source of inspiration for a dialogue between DGIS, other ministries, international environmental organisations, inter-national conventions and research institutes. We thank all our partners for their contributions to this research.
Director, Netherlands Environmental Assessment Agency Prof. dr. M.A. Hajer
Contents 7
Contents
Preface 5 Acknowledgement 9 Summary 11 1 Introduction 15 2 Findings from the literature 17
2.1 Causes of change in biodiversity and poverty 17 2.2 Relationships between biodiversity and poverty 19 2.3 Conclusions of global assessments 22
2.4 Statements of global conventions 24 2.5 Concluding remarks 25
3 Developing a method 27 3.1 Why case studies? 27 3.2 Selection of cases 27 3.3 Conceptual framework 28
3.4 From conceptual framework to indicators 33 3.5 Definition of outcome indicators 33
3.6 Analysis of results from all cases 36 3.7 Joint learning 36
3.8 Significance and uncertainty 36
4 Case studies: results 39
4.1 Outcome indicators for all cases 39 4.2 Scale and trade-off 40
4.3 Causes of change 41 4.4 Description of the cases 42
5 Determinants, patterns and mechanisms 61 5.1 Selection of determinants 61
5.2 Determinant patterns 61 5.3 Mechanisms of change 66
6 Findings, conclusions and further reflections 69 6.1 Relationship between poverty and biodiversity 69 6.2 Determinants and Mechanisms 70
6.3 Further reflections on the biodiversity and poverty relationship 70 6.4 Recommendations for further research 74
Annex 1 Scores of input indicators and outcome indicators of 11 case studies 76
Annex 2 Legend of input indicators 78
Annex 4 Glossary 88
Annex 5 Contact persons of research partners who carried out the case studies 91
Annex 6 Members of the Feedback Group and reviewers of the final draft 92
Literature 93
Acknowledgement 9 The Netherlands Environmental Assessment Agency carried
out this study as part of the International Biodiversity Project 2005–2008. The project was funded by the Netherlands Ministry of Foreign Affairs Directorate-General for Internatio-nal Cooperation, the Ministry of Housing, Spatial Planning and the Environment, and the Ministry of Agriculture, Nature and Food Quality.
We owe many thanks to the members of the Brainstorming Group who provided us with useful ideas and feedback: Wijnand van IJssel (chairman), Antje van Driel, Ron Havinga, Leontine Crisson, Peter Bos, Arthur Eijs, Chris Enthoven, Paul Wolvekamp and Willy Douma. They had the courage to join us in our search for patterns and systematisation in a complex field. They spent time and energy discussing the research with an open mind and a constructive attitude, and shared knowledge, insights and views. Annex 6 lists the members of the Brainstorming Group and their organisations.
We thank our research partners in the developing countries who enthusiastically cooperated in discussing the significance and feasibility of the conceptual models, indicators and deter-minants, and who provided us with the valuable information recorded in the case studies. They organised interdisciplinary working groups and workshops and indefatigably helped us to solve problems and overcome setbacks. They also offered us opportunities to visit case areas and get a personal impression of the local situations. The contact people for the research groups and their organisations are listed in annex 5. Jan Joost Kessler joined the project at an early stage. We highly value his professional contributions to all stages of the project. His experience, knowledge, ideas and views gave input to the kick-off of the case studies; he facilitated workshops, analysed cases, systematized the results of the case studies, wrote background reports and helped us tre-mendously in getting to grips on the conceptual framework, determinants, patterns and mechanisms of the relationship between poverty and biodiversity.
Tjark Struif Bontkes, Adriana Rios and Eric Goewie shared their knowledge and ideas, and wrote background reports. We thank Rob Alkemade, Wilbert van Rooij, Hans Visser, Henk Hilderink, Marcel Kok, Aldert Hanemaaijer, Paul Lucas, Keimpe Wieringa and Eelco Tekelenburg for their valuable contributi-ons and comments. In addition, many colleagues at interna-tional meetings were kind enough to answer our questions
about how biodiversity and poverty relate. Without excep-tion, they thought it over and gave their considered opinions. Finally, we thank Derek Middleton who did an excellent job editing the draft report and Marian Abels and Filip de Blois who did the same editing the figures.
Summary 11 Literature review, a conceptual framework and case studies
Can poverty be reduced while at the same time conserving biodiversity? Decision makers face this challenging question when exploring ways to achieve the Millennium Development Goals and the CBD targets on biodiversity conservation. The aim of this study was to build a theory on the relationship between biodiversity and poverty that explains developments under different conditions. We reviewed the literature on these relationships and on the causes of change in biodiver-sity and poverty, drafted a conceptual framework for this relationship and tested this framework against the results of eleven case studies at subnational scale in developing countries. These cases concern production systems based on the use of natural resources. We cooperated with research partners in these countries, who carried out the case studies and contributed to the overall analysis.
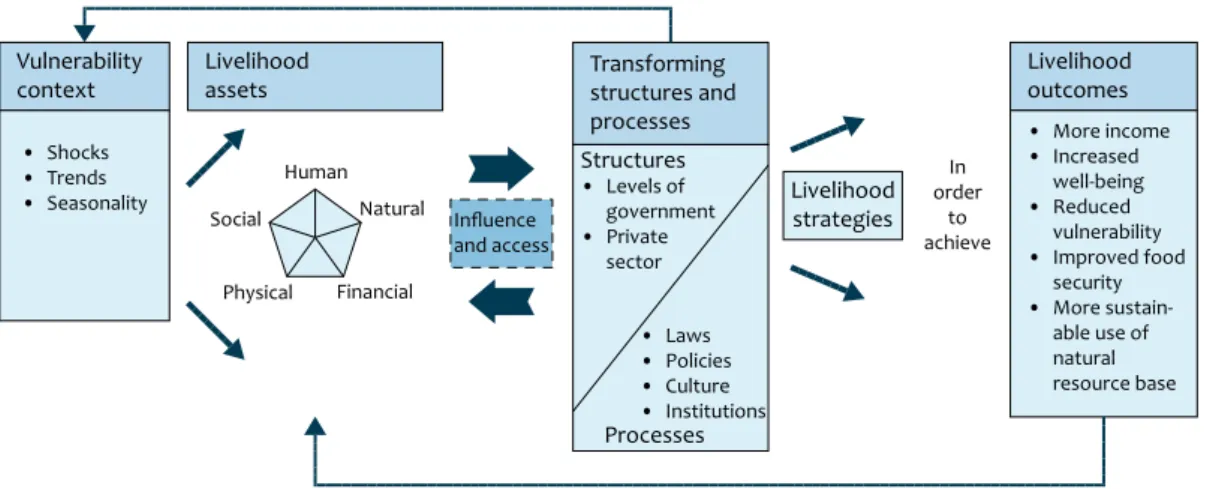
In the conceptual framework the resource use system is central. The actor in this system has access to natural and socioeconomic assets. The resource use system causes changes in biodiversity, goods production, human well-being and poverty. These outcomes feed back into the natural and socioeconomic systems. This conceptual framework was used to define input indicators that characterise the state of the system. Outcome indicators were defined to characterise the changes in biodiversity, goods production, human well-being and poverty. The research partners analysed the cases and gave semi-quantitative scores to the input indicators. They also gave scores to the direction of change of the outcome indicators during the research period, which are favourable, neutral or unfavourable.
Serveral biodiversity-poverty relations found
In both the literature and the case studies, increasing and declining poverty levels coincided with an increase or decline in biodiversity in all possible combinations. We also found shifts in the direction of this relationship over time within the same resource use system. If we unravel the relationship between biodiversity and poverty in 1) the biodiversity–goods production and 2) the goods production–poverty dynamics, we find that:
1) A decline in biodiversity goes together with an increase in goods production and vice versa. Exceptions are cases where pressure put on the ecosystem for the production of goods exceeds the carrying capacity of the ecosystem. If the pres-sure continues, a decline in biodiversity goes together with stagnation or decline in production.
2) The relationship between goods production and poverty is less uniform. An increase in goods production does not automatically lead to better human well-being and poverty reduction. In several cases the profits made from production were taken out of the case area, population growth meant that the profits had to be shared between more people, or inequality led to the exclusion of certain groups from the means of production and income. There were also instances in which human well-being and poverty improved more than could be expected from the production of goods. This could be explained by emigration of poor people from the case area, policy interventions like subsidies, or a delayed reaction at the threshold of a turning point. In the latter case poverty still reduced, but production stagnated because expansion of the production area was halted at the boundaries of protec-ted areas.
None of the cases is completely isolated. Goods, money, people and knowledge may cross the boundaries of the case area, generating trade-off effects that transcend the bounda-ries of the case areas and the time periods investigated. These trade-off effects change the relationship between poverty and biodiversity.
Mechanisms of change by analysis of determinants After the data on all the eleven cases were brought toge-ther, 16 of the 34 input indicators were selected that were relevant for most cases and that reflected well the causes of change that were found in the literature and in the case studies. Some input indicators were dropped for practical reasons, such as a lack of data or ambiguous interpretations. On the basis of these 16 ‘determinants’, the eleven cases were divided into four groups:
1. Resource use systems with high access to capital that produce for the international market, which leads to strong biodiversity loss accompanied by improvement or stagnation in poverty levels: win – lose or neutral – lose trends for changes in respectively poverty and biodiversity. 2. Resource use systems with low market integration, a high
initial poverty level and fast population growth, in which an increase in poverty is accompanied by loss or stagnation of biodiversity: lose – lose or lose – neutral trends.
3. Resource use systems with limited access to capital and low market integration, high population densities and brittle ecosystems, in which a decrease or stagnation in poverty is accompanied by loss of biodiversity: win – lose or neutral – lose trends. These cases tend towards a
bination of increasing poverty and decreasing biodiversity as found in group 2.
4. One resource use system with strong government interference and a relatively low poverty level, in which a decrease in poverty is accompanied by an increase in biodi-versity: a win-win trend.
Market integration, access to capital, management skills and productivity are determinants that divide the cases into two broad groups: market-oriented resource use systems that are
capital driven, with high scores for these determinants; and
subsistence-oriented resource use systems that are poverty
driven, with low scores for these determinants (Figure S.1). Market integration offers opportunities for generating income and reducing poverty. Whether this leads to actual poverty reduction depends on cross-cutting determinants, which are associated with the socioeconomic context of the resource use system. The determinants are: governance, poli-cies on poverty and biodiversity protection, and population density and growth. Strong governance and policy interven-tions may shift negative poverty and biodiversity trends in a more positive direction, but they may also cause dependency on government support. These resource use systems are
policy driven. Weak governance and policies in capital-driven systems may lead to high biodiversity loss without poverty reduction. Although they are in principle transitory and sub-jective in nature, we think that the three contrastive mecha-nisms can easily be observed in practice. This typology may simplify diagnosis for intervention strategies. These insights can be used to set up future case studies and help research teams map existing situations by scoring the selected determinants.
The basic pattern explaind
The ‘brittleness’ of the ecosystem (vulnerability for over-exploitation and ability to recover or self-regenerate) is an important cross-cutting factor too. If natural resources are abundant and brittle in capital-driven systems, this leads to
strong expansion of production and a vast loss of biodiversity. In poverty-driven systems, fast population growth and little management input may have the same effect. If the limits of expansion are reached, either production is intensified, with the risk of overexploitation if ecosystems are brittle, or people and production leave the area.
We assume that all resource use systems follow a limited set of basic patterns of change in biodiversity and poverty (Figure
S.2). These may differ in absolute values and in the ratio of change, but in essence follow the same courses. Hypothetical courses are:
A decrease in poverty combined with a decrease in biodi-versity (win-lose, A > C): production at the cost of biodiver-sity generates income that improves human well-being and reduces poverty.
A decrease in poverty combined with an increase in or conservation of biodiversity (win-win/neutral, B > D/F): biodiversity recovers while human well-being improves because society can afford measures and technology to simultaneously improve production and save biodiversity. An increase in poverty combined with a decrease in biodi-versity (lose-lose, B > E): exploitation leads to degradation of the natural system and productivity declines; population growth and inequality maintain poverty.
Variation of the position of this graph along the axis of bio-diversity is caused by the brittleness of the ecosystem. The variation along the axis of poverty is caused by the vulnera-bility of the socioeconomic system. Together they influence productivity, profitability, population density and equality. There are reasons to assume that a ‘green Kuznets curve’ –reduce poverty while recovering biodiversity- does not exist if all trade-off effects are considered. Technical measures hardly reduce the impact on biodiversity caused by com-modities, such as food, fibre and fish. In essence, humans are in direct competition with their fellow creatures for
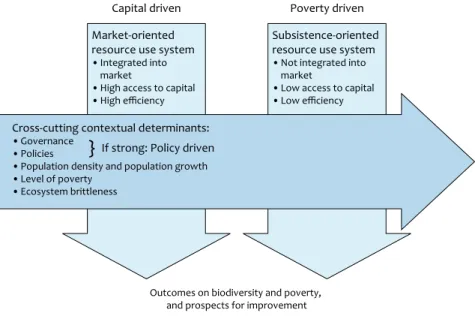
Major mechanisms of change are the drivers capital, poverty and policy.
Figure S.1 Characteristics of the major mechanisms of change
Capital driven Poverty driven
Cross-cutting contextual determinants:
• Governance • Policies
• Population density and population growth • Level of poverty
• Ecosystem brittleness
Outcomes on biodiversity and poverty, and prospects for improvement
Market-oriented resource use system
• Integrated into market
• High access to capital • High efficiency
Subsistence-oriented resource use system
• Not integrated into market
• Low access to capital • Low efficiency
Summary 13 space, energy, minerals, matter and water. This fundamental
competition cannot be removed by technical solutions. Only when the efficiency of resource use systems is suboptimal, so that resources are spoiled or wasted, is it possible to develop a pathway where an increase in goods production and the restoration of biodiversity go together.
Further research to consolidate the findings of this study should focus on the following main areas of study: Verification of determinant patterns, mechanisms and
biodiversity–poverty courses in other cases.
Quantification of the relationship between goods produc-tion, ecosystem services and biodiversity loss for varying production systems and ecosystems.
Investigation of the relationship between poverty in rural and urban areas, and trade-off effects between areas at different scales.
Other mechanisms of change, for example conflicts and the impact of climate change.
The impact of policy interventions in different circumstan-ces, typified by the determinants and mechanisms.
Hypothetical ‘prototype’ courses of change in biodiversity and poverty. Figure S.2 Poverty Biodiversity Win - lose Lose - lose Win - win
Win - neutral / lose less
Hypothetical courses of biodiversity and poverty
High Low Low High A B C D E F
A-F Marking points of development paths
Introduction 15 The Netherlands Environmental Assessment Agency has
studied the relationship between biodiversity and poverty as part of the International Biodiversity project, which ran from 2005 to 2008. This study investigated natural-resource-based livelihoods that are connected to land or water: agriculture, aquaculture, forestry, reforestation, fishery and gathering. The analysis was performed from the point of view of biodi-versity. The report is based on eleven case studies at subnati-onal scale that were carried out in eight developing countries. The Netherlands Environmental Assessment Agency coopera-ted on this with research partners at local research institutes, governmental organisations and NGOs, who carried out the case studies and contributed to the overall analysis. The case studies were on fisheries in Ghana and Kenya, mangrove exploitation in Vietnam, forest use, reforestation and forestry in Vietnam and Costa Rica, soy in Brazil, palm oil in Indonesia, peasant agriculture in Ecuador and Mexico, livestock produc-tion in Nicaragua and cotton in Mali.
The aim of this study was twofold:
1. To build a theory on the relationship between biodiversity and poverty that explains developments under different conditions. The study contributes to the debate as it reviews the literature, drafts a conceptual framework and tests this framework against the results of case studies. 2. To build a joint knowledge base on the relationship
between biodiversity and poverty with our research partners.
The study set out to answer three research questions: 1. How are biodiversity and poverty related under different
conditions?
2. What indicators and what values of these indicators deter-mine this relationship?
3. What mechanisms explain this relationship and indicator values?
Can poverty be reduced while simultaneously conserving bio-diversity? This is the challenge facing decision makers when exploring ways to achieve the Millennium Development Goals (MDGs) and the targets stated in the Convention on Biologi-cal Diversity (CBD). In 2000 the United Nations endorsed the MDGs of halving the population suffering from poverty and hunger by 2015 (MDG1) and ensuring environmental sustai-nability (MDG7). The sixth Conference of the Parties to the CBD decided ‘to achieve by 2010 a significant reduction of the current rate of biodiversity loss at the global and regio-nal level as a contribution to poverty alleviation and to the
benefit of all life on Earth’. This was reconfirmed by the World Summit in Johannesburg, 2002. Many countries, including the Netherlands, have adopted policies on poverty reduction and on the conservation and sustainable use of biodiversity. Planning and implementing such policies at the global and local scales requires a better understanding of the relation-ship between poverty reduction and biodiversity conserva-tion, as these relationships are complex, context-specific and depend on spatial scale and temporal horizon. Local people, especially the poor, depend directly on natural resources for their livelihoods and suffer disproportionately from biodiversity depletion. Policy makers urgently need a better understanding of these relationships in order to implement cost-effective development policies and formulate policies to avoid poverty resulting from biodiversity loss, reduce poverty without biodiversity loss, and restore biodiversity to help reduce poverty.
The relationship between biodiversity and poverty is a key topic in the Global Environmental Outlooks (UNEP, 2002 and 2007b), the second Global Biodiversity Outlook (UNEP-CBD, 2006) and the Millennium Ecosystem Assessment (MEA, 2005a) but is hardly quantified.
This report is a discussion paper. It therefore ends with probable explanations for the observed phenomena and sug-gestions for further research. It aims to bring the conceptual thinking and theory on the relationship between biodiversity and poverty one step further by empirically testing concepts from the literature.
Chapter 2 explores the relationship between poverty and biodiversity in a review of the scientific literature, global assessments and conventions. Drawing on the review, we develop a conceptual framework and a methodology for the case studies in Chapter 3. The 11 case studies are described in Chapter 4. Determinants and patterns that explain the com-bined impact on poverty and biodiversity, and mechanisms of change, are identified in Chapter 5. Chapter 6 contains the findings, conclusions and further reflections. This chapter ends with recommendations on further research.
Findings from the literature 17 A basis for the conceptual model and hypothesis for this
study was obtained by surveying the literature on the causes of changes in biodiversity and poverty (section 2.1) and on the relationship between biodiversity and poverty (section 2.2), as well as the recent Global Assessments (section 2.3) and global conventions on biodiversity and poverty (section 2.4). Section 2.5 contains some concluding remarks.
2.1 Causes of change in biodiversity and poverty
The literature describes many causes of change in biodiver-sity and poverty. These have been grouped into economic, production, social, political and ecological/environmental factors. Many causes are interdependent and mutually linked. No sources were found that gave quantified cause-effect relations.2.1.1 Economic factors
Economic causes can be subdivided into economic growth, market integration and competition.
Economic growth is an indispensable condition for poverty alleviation, not a guarantee (Stiglitz, 2003; Collier, 2007). The ‘trickle down’ effect is not an autonomous process, but needs institutional arrangements. Indeed, various authors found no significant relation between economic growth and improved livelihoods of the poor (UNCTAD, 2002; UNCTAD, 2004 in: Kessler and Abaza, 2006). For example, small farmers are often excluded from the agro-export boom, which may lead to higher food prices and less food security, or they suffer from the effects of environmental degradation (Kirkpatrick and Lee, 2001). Global actors strongly influence the exploita-tion of export commodities (Kessler et al., 2001).
Economic crisis is frequently mentioned as a factor causing deforestation and biodiversity loss, because impoverished people fall back on natural ecosystem exploitation as a safety net (Lambin et al., 2001). Resource collapse and price collapse can both result in increasing exploitation and further resource degradation.
Market growth and global market integration are important factors affecting biodiversity (Geist and Lambin, 2003). Market failures, monopolies and unstable prices affect the
socioeconomic conditions of the production sectors (Con-treras and Hermosilla, 2000). Trade liberalisation does not automatically lead to economic growth (Kessler and Abaza, 2006) and in the least developed countries may even lead to the opposite (Stiglitz, 2002). Openness to trade does not automatically lead to increased trade (Kessler and Abaza, 2006) and export growth does not always significantly reduce poverty (Kessler et al., 2007).
Competition affects the distribution of wealth and poverty. The first producers to adopt a new high-profit technology become winners; the late developers are out-competed and become losers (the treadmill) (Röling, 2000; FAO, 2002; Collier, 2007). The economies of the least developed coun-tries are based on natural resources and not technology. As Southern countries have limited power and leverage, growth in the export sector depresses the prices of primary commo-dities (Muradian and Martinez-Alier, 2001). To cope with decli-ning income, these countries increase production by increa-sing the cultivated area, and by mechaniincrea-sing and intensifying production, which again results in lower prices, and so on. 2.1.2 Production factors
Production factors comprise access to natural resources and ecosystem productivity, management skills and technology, and economic return.
Crop or livestock development depends in the first place on
access to natural resources and ecosystem productivity (Hop-fenberg and Pimentel, 2001; de Vries and Goudsblom, 2002; Kessler et al., 2007). Agricultural systems provide 10–1000 times more food than natural ecosystems (Diamond, 1999), but depend on the services provided by biodiversity as well as the supply of inputs (Angelsen and Wunder, 2003; Kessler and Van Dorp, 1998 in: Kessler and Abaza, 2006) and the genetic traits of crops and livestock (FAO, 2007; Fowler et al., 1990; Jarvis and Hodgkin, 2000). Higher productivity is attained through external inputs, management skills and technology. Mechanisation and intensification (Boserup, 1965) have been able to compensate for the Malthusian repercussions of incre-asing population pressure (Malthus, 1798), but Malthusian and Boserupian processes are not opposing forces; they tend to coexist (Demont et al., 2007). Malthus’ theory that the size and growth of the population depend on the food supply and agricultural methods is supplemented rather than negated
Findings from
by Boserup’s theory that agricultural methods depend on the size of the population. Malthus stated that in times when food production is not sufficient to feed the whole popula-tion, some people will die. Boserup stated that in these times people will find ways to increase productivity by making use of the increasing workforce, machinery, fertilisers, etc. However, technological progress has not banished hunger from the world because the global population has continued to grow and the benefits of technological progress are not equally distributed (Koziell and Saunders, 2001; Wright, 2005). Biodiversity loss increases as the intensity of exploitation increases (Kessler, 2003; Alkemade et al., 2006). Economic
return depends on productivity, cost advantages and market integration (Lambin et al., 2001; Kessler et al., 2007). The poverty rate is highest not only in areas of high population density and degraded natural resources (Dixon et al. 2001), but also in remote areas where population density is low and forests still remain intact (Müller et al., 2006).
There is no solid evidence that participatory forest manage-ment practices contribute to poverty reduction (Fisher, 2007). Forests are safety nets in time of crisis, gap fillers for commu-nities with structurally low incomes from other activities, or permanent sources of income that lift people out of poverty (Cavendish 1999 and 2003). Small to medium-sized forestry enterprises can reduce poverty, whereas industrial forestry can at best protect communities against worsening poverty, but hardly reduce poverty levels (Mayers, 2007; Wardle, 2003). Forest dwelling may be a poverty trap rather than a safety net (Kessler, 2005). It has limited potential for poverty reduction because it is difficult to obtain a high income from non-timber forest products from the commons (Kessler, 2005).
2.1.3 Social factors
The social factors are broken down into distribution of wealth or power, historical poverty, demographic changes and socio-cultural dilemmas.
In essence poverty is the result of an unequal distribution of
food and economic and political power (Millennium Project, 2004a; Millennium Project, 2004b; Contreras and Hermosilla, 2000), but it is also linked to environmental conditions. Poor nutrition (stunting), for example, is most frequently found in areas of high soil degradation (Potting and Bakkes, 2004). However, according to Woodhouse (2002) unequal income distribution, and consequently (relative) poverty, exists every-where, independent of ecosystem features and food supply. Inequality arises as an autonomous process, even from situations in which people have an equal start, and is driven by differences in the physical conditions of land and property, differences in skill levels and just bad luck (sickness, hail, con-flict, etc.). Poverty can also be the result of differences in the roles and rights of men and women, both within households and in the community at large. Women are frequently highly vulnerable to changes in ecosystem services.
Rich and powerful people often take possession of the commons (forest, rangelands), the exploitation rights of which historically belong to local peoples (Raswant et al., 2008; Woodhouse, 2002). This is referred to as the
privati-sation of natural resources (Kessler, 2005) or the enclosure movement (Beresford, 1998). Formal or informal income-redistribution systems counteract this phenomenon.
Past or present poverty in itself has a powerful influence on the level of future impacts on biodiversity and poverty (IFAD, 2001) as people become trapped in a cycle of poverty (Collier, 2007). Indebtedness (Geist and Lambin, 2003) is an important cause of deforestation.
Recent population growth has been exponential and unprece-dented (Klein Goldewijk, 2005), while resources are limited. Demographic dynamics (population density and growth, immigration and emigration) is a key issue related to poverty at the local scale (Contreras and Hermosilla, 2000; Geist and Lambin, 2003).
People are proud of their culture and livelihoods and prefer to be independent and self-sufficient. Respect, self-respect and social acceptance are basic human needs (Maslow, 1943) and basic social and cultural needs should be part of the solution to poverty. Although there is sufficient food to feed the world’s population – the number of overweight people exceeds the number of undernourished people – just redis-tributing goods from the rich to the poor is not the whole answer.
2.1.4 Political factors
Policies were identified on markets, land, production, the environment and social security. Governance and conflict also play an important role.
While free market policies do support national economies (UNCTAD in: Kessler et al., 2007), they can have both posi-tive and negaposi-tive impacts on environmental sustainability, depending on incentives and regulations (Van den Berg and Verbruggen, 1999). The effects of trade policies depend on many contextual factors and the way they are implemented (Kirkpatrick and Lee 2001); there is no one-to-one relationship between policies, measures, production changes, poverty and environment. Young, upcoming economies are fragile and need to be protected against strong economies, which justify economic protection measures in the early stages to avoid poverty (Stiglitz et al., 2002; Collier, 2007).
Land policies (Geist and Lambin, 2003), agricultural expansion
policies and intensification policies (Kessler, 2005) may help to maintain or increase productivity and improve the incomes of natural resource users. However, perverse policies (Contreras and Hermosilla, 2000) may increase inequality in the rural population or promote activities that lead to biodiversity loss (Mayers, 2007). Pauly et al. (1998) elaborates on perverse sub-sidies to global fisheries that induce the depletion of entire fish stocks. Payments for environmental services (Ibarra, 2007), avoided deforestation (Griffiths, 2007) and biodiversity protection may counteract biodiversity loss.
Massive food aid has also created negative side effects. Com-munities have become more and more dependent on aid, which leads to a loss of pride and livelihoods, and even the collapse of some local agricultural economies. From a long-term perspective, food aid may not reduce poverty, but
actu-Findings from the literature 19 ally worsen it (King, 2005). It may keep the recipients alive
and allow the population to grow, but does not enabled them to solve the problem structurally. This problem will become worse if Official Development Aid for poverty reduction and biodiversity protection (~0.7% GDP) is not fully invested in structural solutions (Collier, 2007).
Government weaknesses (Contreras and Hermosilla, 2000), corruption and mismanagement (Geist and Lambin 2003), and failure to update and enforce legislation (Kessler et al., 2001) are some of the governance factors that put a burden on poverty reduction and biodiversity protection. NGOs can play a significant role in improving governance by monitoring and evaluating policies and government performance (Kessler et al., 2001).
Civil war and rebellion may be explained by atypical grievan-ces, such as high inequality, hunger (Messer et al., 2001), lack of political rights or ethnic and religious divisions in society (World Bank, 2003). Low GDP and low income countries are most vulnerable to civil war (Collier and Hoeffler, 2004). Civil war has a negative impact on GDP, income and income distri-bution, poverty, social security, education, public health and foreign investments, and it encourages emigration and the associated loss of intellectual and financial capital, reducing the chances of economic development (Contreras and Her-mosilla, 2000; Collier, 2007). According to Heinsohn (2003), it is not high population density itself that sparks off conflict, but population growth leading to a youth bulge (more than 30% of the population younger than 14 years).
2.1.5 Ecological/environmental factors
Ecosystem stability, brittleness, exploitation and regime shifts were identified as ecological factors.
Most natural ecosystems arefairly stable. This equilibrium is maintained by a wide diversity of organisms pursuing diffe-rent life strategies and inhabiting diffediffe-rent niches, exploiting available flows of materials and energy (Naeem et al., 1995). Ecosystem exploitation may cause resource degradation (Oldeman et al., 1990), but not all natural ecosystems react to disturbance in the same way. Ecosystems can be classified according to their brittleness: the ability to recover or rege-nerate (Savory, 2000). Non-brittle ecosystems are able to self-regenerate following exploitation, while brittle ecosystems do not. Non-brittle ecosystems are generally characterised by higher levels of rainfall and humidity, high fertility and a low chance of erosion. Brittle ecosystems are the opposite; they degrade after human use owing to the persistent leakage of the key elements of ecosystem productivity: nutrients, water, energy, minerals and species (Foley et al., 2005; Haberl et al., 2007; UNEPa, 2007; WRI, 1998; Pauly et al., 1998; Alkemade et al., 2006). The extent of this leakage depends on the intensity and extent of the human activities as well as the sensitivity of the ecosystem to pressure and its resilience. Resilience is the long-term adaptive property of the system to withstand external perturbations without changing its basic structure (based on Gunderson et al., 1995).
Ecosystem services such as carbon sequestration, water holding capacity, soil fertility, soil stability and organic matter
decomposition may decrease after human exploitation or management of the ecosystem that is geared towards maximising the production of a single good at the expense of others (MEA, 2005a). Research on testing community and ecosystem function in situations where biodiversity is still high is complex and results have been inconsistent (Thomp-son and Starzomski, 2007). The consequences of the loss of biodiversity for ecosystem functioning depend on the scale of analysis. Dominant species are often the major contributors to ecosystem goods and services.
Although most natural systems change gradually under human use, dramatic regime shifts are observed too (Schef-fer et al., 2001). Reversing such a shift is often difficult or even impossible, due to positive feedback mechanisms. Examples are the response of shallow lakes to eutrophica-tion, grasslands to grazing pressure, populations to habitat fragmentation, marine systems to fishing pressure, coral reefs to land erosion and overfishing (Gunderson and Pritchard, 2002; Van Nes and Scheffer, 2004). As the level of exploitation or pollution loads increase, systems may slowly lose their resilience without this being noticed. Once the threshold is – unexpectedly – passed, the system collapses. It is difficult to predict the threshold level.
2.2 Relationships between biodiversity and poverty
Four main types of relationship between changes in biodiver-sity and changes in poverty have been described:1. Win–lose: a decline in poverty is accompanied by a decline in biodiversity
2. Lose–lose: an increase in poverty is accompanied by a decline in biodiversity
3. Win–win: a decline in poverty is accompanied by an incre-ase in biodiversity
4. Win more–lose less: a decline in poverty is accompanied by biodiversity conservation policies
Win–lose
The most frequently mentioned relationship is a win–lose trend: a decrease in poverty and increase in human well-being at the expense of biodiversity. Drawing on the results of many scientific studies worldwide, the MEA (2005a) states that changes in ecosystems have led to substantial benefits, especially in food supply and to industries based on the use of natural resources:
Food production has more than doubled since 1960. Food production per capita has grown.
Food prices have fallen.
The agricultural labour force accounts for 22% of the world’s population and half the world’s total labour force. Agriculture accounts for 24% of GDP in low-income
develo-ping countries.
The market value of ecosystem-service industries is about $980 billion per year for food, $400 billion for timber, $80 billion for capture fisheries and $57 billion for marine aqua-culture. For recreational hunting and fishing it is more than $75 billion per year in the United States alone.
According to the Second Sustainability Outlook by the Netherlands Environmental Assessment Agency (MNP, 2008),
biodiversity and human development show inverse trends at global, regional and national scales (Figure 2.1).
According to Boserup (1965) production increment is attained first by expanding the crop area and subsequently by inten-sifying production when no additional land is available to bring into cultivation. Both these processes lead to biodiver-sity loss. The Millennium Environmental Assessment (MEA, 2005b) concludes that the production capability of agricultu-ral systems is undermined by soil erosion, salinisation and loss of agricultural biodiversity. Their effects on food production are masked by increasing use of fertilisers, water and other agricultural inputs. A win–lose situation today may turn into a lose–lose situation tomorrow.
Economic growth can have trade-off effects on biodiver-sity elsewhere. For example, downstream biodiverbiodiver-sity and livelihoods along the Mekong River are threatened by the upstream improvement of navigation, economic corridor development and hydropower development (Lazarus et al., 2006).
Lose–lose
Many cases of increased poverty resulting from biodiver-sity or ecosystem degradation have been described. Coral degradation in the Caribbean has a negative impact on coastal communities, including the loss of fishing livelihoods (UNEP, 2007b). In a ten-year period, 26 commercial fisheries in the Black Sea were destroyed (Shiganova and Vadim, 2002 in: UNEP 2007a). Agricultural land suffers from invasive weeds, such as alang-alang (Imperata cylindrica) in Indonesia and prickly pear cactus (Opuntia ficus-indica) in South Africa (CSIR, 2008).
Arid and semi-arid lands are brittle to human exploitation (MEA, 2005b). They are relatively densely populated in relation to their productive capacity and 10–20% of the land used for agricultural production in arid and semi-arid areas is degraded. People living in these areas suffer from decreasing productivity of livestock and arable farming (Sanchez, 2002). Infant mortality rates1 are high. Forested areas have declined
dramatically in many countries, but 350 million people still depend primarily on local forest for their subsistence and survival (MEA, 2005b).
The poor suffer disproportionately from increasing environ-mental degradation and are particularly susceptible to the impact of natural disasters. The poor identify security as a key concern (DFID, 2000; DFID, EU, UNDP and World Bank, 2002). The turning point from win–lose to lose–lose
The win–lose trend may turn into a lose–lose trend. Exploiting specific goods and services generally causes a chain of ecosys-tem reactions, which in turn may cause the supply of goods to decrease (MEA, 2005b):
The capacity of ecosystems to buffer extreme events has been reduced through loss of wetlands, forests, mangroves.
People increasingly occupy regions exposed to extreme events.
Many services are related to specific biodiversity com-ponents. Degradation leads to the loss of non-marketed benefits from ecosystems. The economic value of these benefits is often high and sometimes higher than the mar-keted benefits.
1 See glossary, Annex 4.
The Human Development Index (HDI) and biodiversity (‘Mean Species Abundance’, MSA) are inversely related (MNP, 2008, adapted). Figure 2.1 1900 1950 2000 2050 0.0 0.2 0.4 0.6 0.8 1.0 HDI The Netherlands Western Europe North America China Brazil India Africa
Human Development Index
Human Development Index and biodiversity
1900 1950 2000 2050 0 20 40 60 80
100 Mean species abundance (%)
Findings from the literature 21 Unsustainable use causes the depletion of the living and
non-living components of the natural world. There are several examples in history linking the degradation of natural resour-ces to the collapse of whole societies (e.g. Mayas, Vikings and Anasazi) (Wright, 2005; Diamond, 2004). However, Diamond (2004) concludes that no known collapse of a culture can be attributed solely to environmental degradation. Other factors were also involved: climate change, hostile neighbours and the ability to respond to environmental problems. Ecosys-tem degradation can rarely be reversed without actions that address one or more indirect drivers of change:
population change (including growth and migration); change in economic activity (including economic growth,
disparities in wealth, and trade patterns);
sociopolitical factors (including factors ranging from the presence of conflict to public participation in decision-making);
cultural factors; technological change.
The turning point from win–lose to win–win
The dominant focus in development policies is economic growth at the expense of the environment, while solving environmental problems which arise as a result is postponed to a later stage (Van Bodegom et al., 2006). Although certain minimum environmental standards are suggested, making a choice between environment and development is seen as inevitable. It is also argued that increasing human well-being and economic growth may drive the development of environ-mental legislation and improve environenviron-mental quality in the future. This is called the environmental Kuznets curve (EKC) (Grossman and Krueger 1995; Yandle et al., 2004 in: Kessler et al., 2007).
It is still debated whether environmental restoration (the ‘grey Kuznets curve’) leads to biodiversity restoration as well, the ‘green Kuznets curve’. According to McPherson and Nies-wiadomy (2005), a green Kuznets curve exists for mammals and birds. The percentage of threatened species rises as income per capita increases from US$12,000 to US$14,000 per year. At higher levels, the percentage of threatened species falls. According to Kahuthu (2006), there is significant evidence of an EKC-type relationship between income per capita and CO2 emissions across countries. The turning point
is far beyond the income level of middle- and low-income countries. As a consequence, it will take developing countries a few decades to reach the EKC turning point. In contrast, forest cover shows no such turning point. Kahuthu found that higher global market integration corresponded with faster deforestation. Gutman (2008) states that critics argue that the ‘get rich first and clean up later approach’ (the ‘Kuznets curve argument’) has seldom worked for rural areas and will never work where irreplaceable natural assets are concerned, with the attendant risks of species extinction, desertification and large landscape level transformations.
Local win–win and impacts elsewhere
If maps of poverty and biodiversity are overlaid, all com-binations of low–high biodiversity with low–high poverty occur. This is true at the national and global scales and can be explained by trade-off effects that disturb the picture. Eco-nomic growth and biodiversity restoration in one place may
cause biodiversity loss elsewhere: the ecological footprint (Wackernagel and Rees, 1996; Wackernagel et al., 2002; Rood and Alkemade 2005; Kessler et al., 2007). Ecological footprints may or may not be situated in poor areas. Rich countries and rich people have a larger footprint than poor countries and poor people (Wackernagel et al., 2006).
Local win–win under pro-poor and pro-conservation policies Natural resources can provide the basis for improving liveli-hoods. At the World Parks Congress in 2003 Wildlife Con-servation Society developed ‘people-centred conCon-servation’, ‘pro-poor conservation’ and other strategies based on the following principles (Adams et al., 2004; Van Bodegom et al., 2006):
Use poverty reduction as a tool for conservation. Compensate and mitigate the negative impacts of
conser-vation on poor people.
Adapt conservation to generate new benefits. Use conservation as a tool for poverty reduction.
‘The view on poverty alleviation and biodiversity conservation shifted in the last decades from separate or contradictable issues towards a “two sides of the same coin”. To date a pragmatic ecosystem approach is followed in search for bio-diversity conservation and simultaneous poverty alleviation’, conclude Van Bodegom et al. (2006) and Reed (2006). There is a shift towards conservation by improving livelihoods, generating alternative livelihoods and compensation for lost benefits. This is because poor people are prepared to invest in the environment if they see tangible benefits and the potential for economic improvement. Emphasis is placed on working with the poor and on improving governance as new evidence challenges entrenched assumptions about poverty– environment interactions (DFID, 2000):
The poor are too poor to invest in the environment. Alt-hough in some cases this is true, there is much evidence to show that when incentives are favourable, even the poor can mobilise enormous resources, particularly labour. The poor do not care about the environment. There are
numerous examples to show poor people often place great value on the environment, both as a resource base and for cultural, aesthetic and religious reasons.
Most environmental degradation is caused by the poor. Globally, most environmental degradation is caused by the non-poor, as the consumption levels of the poor are still low relative to the rich.
Poverty reduction necessarily leads to environmental degradation. Studies have failed to show a common pattern in the linkage between poverty and resource use. The relationship between poverty and the environment is complex and requires context-specific analyses – there is no simple causal relationship. There is sufficient evidence to refute the statement ‘poverty reduction and environ-mental concern are incompatible’.
Win more–lose less
Local Integrated Conservation and Development approaches offer win more–lose less solutions, as opposed to thinking in terms of win–win, win–lose and lose–lose combinations (Bodegom et al., 2006). Sustainable use of natural resources can only be attained if civil society is strengthened, poverty is reduced and policies are oriented to the conservation of
natural resources. Ingredients for success are amenable local traditions, an appropriate mandate and adequate resources, effective enforcement, exceptional conservation interest and long-term commitment (Abbot et al., 2001). Fisher (2005) assumes that:
many cases of community action to improve livelihoods have led to increased conservation (also Abbot et al. 2001); local action results in better conservation than any other
realistic alternative, but does not lead to a perfect conser-vation outcome;
institutional change at different levels is the basis for improved conservation and poverty reduction.
The general development policy of the Directorate-General for International Cooperation (DGIS) at the Dutch Ministry of Foreign Affairs reflects the new paradigm of combined deve-lopment and conservation. This is also true for the biodiver-sity–poverty co-financing channel (TMF, Thematisch
Financie-rings Fonds). Under the overarching goal of poverty reduction, DGIS is committed to safeguarding ecosystems that regulate the basic processes that make life on earth possible (DGIS 2003; DGIS, 2005 in: Bodegom et al., 2006). However, in the short term, poverty reduction will not always be compatible with ecological sustainability and there is no policy document which outlines how to achieve both biodiversity conserva-tion and poverty reducconserva-tion in projects and programmes. The degree of success depends largely on a conducive environ-ment (Van Bodegom et al., 2006), in which:
benefits from the ecosystem are higher than the cost of conservation and management;
the legislative and policy framework is in place; land and resource rights are clear;
power relations are supportive to conservation and resour-ces can be defended against unsustainable exploitation.
2.3 Conclusions of global assessments
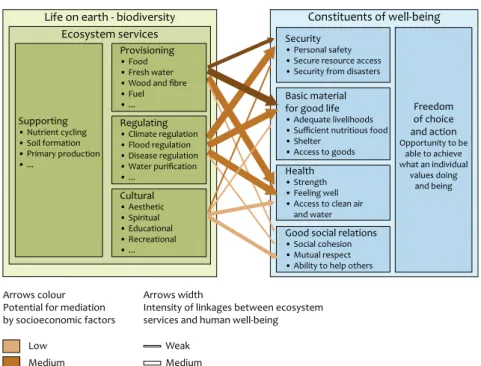
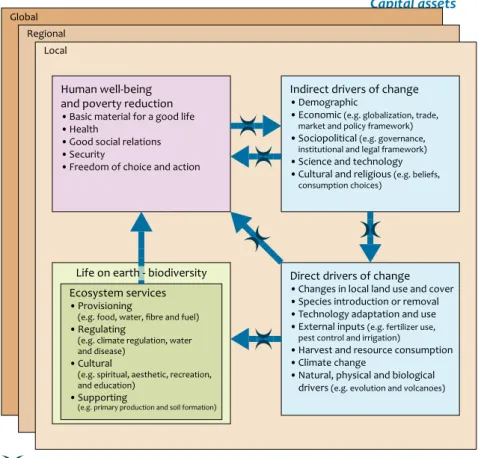
Global assessments have recently given new insights into biodiversity, ecosystem services and poverty, and concep-tual frameworks have been developed for investigating how life on earth is linked to human well-being (Figure 2.2) (MEA, 2003).
The main message of the Millennium Ecosystem Assessment is that human well-being and progress towards sustainable development are vitally dependent upon improving the management of Earth’s ecosystems to ensure their conserva-tion and sustainable use. But at the same time it is observed that the capacity of many ecosystems is diminishing to meet the growing demands for ecosystem services such as food and water. Human actions during the last 50 years have altered ecosystems to an extent and degree unprecedented in human history. The consequences for human well-being have been mixed. Health and wealth have, on average, improved but the benefits are unequally distributed and further improvement may be limited by an insufficient supply of key ecosystem services’ (MEA, 2005a). Approximately 60% of ecosystem services (15 of 24 identified services) are being degraded or used unsustainably (Table 2.1). The degradation of ecosystem services often causes significant harm to human well-being and represents a loss of the natural assets or wealth of a country. To date, 1.1 billion people survive on an income of less than $1 per day; 70% of them live in rural areas where they are highly dependent on ecosystem services. Inequality has increased over the past decade. During the 1990s, the Human Development Index score for 21 countries declined. Water scarcity affects roughly 1–2 billion people worldwide. Desertification affects millions of people.
Ecosystem services and their links to human well-being (MEA, 2003).
Figure 2.2 Linkages between ecosystem services and human well-being
Provisioning
• Food • Fresh water • Wood and fibre • Fuel • ... Regulating • Climate regulation • Flood regulation • Disease regulation • Water purification • ... Cultural • Aesthetic • Spiritual • Educational • Recreational • ... Supporting • Nutrient cycling • Soil formation • Primary production • ... Security • Personal safety • Secure resource access • Security from disasters
Basic material for good life
• Adequate livelihoods • Sufficient nutritious food • Shelter
• Access to goods
Health
• Strength • Feeling well • Access to clean air and water
Good social relations
• Social cohesion • Mutual respect • Ability to help others
Freedom of choice and action Opportunity to be able to achieve what an individual values doing and being Ecosystem services Constituents of well-being Life on earth - biodiversity
Low Medium High Arrows colour Potential for mediation by socioeconomic factors
Arrows width
Intensity of linkages between ecosystem services and human well-being
Weak Medium
Findings from the literature 23 There is evidence that changes being made in ecosystems are
increasing in a nonlinear way (including accelerating, abrupt and potentially irreversible changes), with important conse-quences for human well-being. An example is the collapse of the Atlantic cod stocks off the east coast of Newfoundland in 1992, which forced the closure of the fishery. The depleted stocks may not recover (MEA, 2005a). The degradation of ecosystem services could become significantly worse during the first half of this century and forms a barrier to achieving the Millennium Development Goals. The challenge of rever-sing the degradation of ecosystems while meeting increa-sing demands for their services can be partially met under some scenarios that the Millennium Ecosystem Assessment (MEA) has considered, but these involve significant changes in policies, institutions and practices that are not currently under way. Although many facts and figures are presented on biodiversity, goods and services and human well-being, they are not framed in a causal relationship at the local or global scale (MEA, 2005a).
In the second Global Biodiversity Outlook (UNEP-CBD, 2006) MEA’s generic findings were confirmed, but the biodiversity– poverty relationship was not quantified:
‘The services provided by healthy, bio-diverse ecosystems are the foundation for human well-being.’
‘Biodiversity loss disrupts ecosystem functions, making ecosystems more vulnerable to shocks and disturbance, less resilient, and less able to supply humans with needed services.’
‘The consequences of biodiversity loss and ecosystem disruption are often harshest for the rural poor.’
‘Garnering the political will to halt ecosystem degradation will depend on clearly demonstrating to policy makers and society at large the full contribution made by ecosystems to poverty alleviation efforts and to national economic growth more generally.’
‘Apart from nature’s immediate usefulness to humankind, many would argue that every life form has an intrinsic right to exist.’
The background document of the second Global Biodiversity Outlook states that Sub-Saharan Africa is stuck in a poverty
trap (CBD/MNP, 2007). Africa’s extreme poverty leads to low saving rates and low domestic saving is not offset by high inflows of private foreign capital. The combination of a low domestic saving rate and a high population growth rate has led to stagnation in Africa’s pattern of capital accumulation. This means that to a significant extent, Africa is living off its natural capital.
The Global Environmental Outlook 4 (GEO4) expresses the environment–development paradox: ‘Development that contributes to human well-being depends on the environ-ment while impact from developenviron-ment on the environenviron-ment affects human well-being’ (UNEP, 2007a). Choosing between conserving natural ecosystems and converting ecosystems for agriculture presents a dilemma: the total value of natural ecosystems may be higher for the society in the long term (EFTEC 2005), but ecosystem conversion has higher direct benefits for individual owners. The maximum sustainable yield (e.g. catch of fish) does not coincide with the maximum economic profit. Moreover, loss of wealth due to ecosystem degradation, resource depletion and non-market products is not reflected in traditional economic accounts. A country could fell its forests and deplete its fisheries, and this would be reflected as a positive gain in GDP without registering the corresponding decline in assets. Knowledge about these interlinkages should be used to facilitate the transition to sustainable development. Eradication of extreme poverty and hunger depends on sustainable agriculture, fisheries and forestry, which in turn relies on ecosystem services such as soil fertility and water. GEO4 concludes that investments in environmental management result in increased income for the rural poor and the benefits of early action outweigh the costs. The increased incidence of extreme weather due to climate change is affecting people as well as biodiversity. Other authors have also emphasised the complexity of the relationship between biodiversity and poverty. Reed stressed the multi-actor, multi-domain and multi-scale dimensions in his 3xM approach (Reed, 2006).
Vulnerability of people to poverty depends on exposure to threats, sensitivity to impacts and the ability to cope or adapt 15 out of 24 ecosystem services are being degraded or used unsustainably (MEA, 2005a) Table 2.1
Status
Regulating Services
Air quality regulation i
Climate regulation – global h
Climate regulation – regional and local i
Water regulation
+/-Erosion regulation i
Water purification and waste treatment i
Disease regulation
+/-Pest regulation i
Pollination i
Natural hazard regulation i
Cultural Services
Spiritual and religious values i
Aesthetic values i
Recreation and ecotourism
Service Status Food crops h livestock h capture fisheries i aquaculture h wild foods i Fibre timber +/-cotton, silk +/-wood fuel i Genetic resources i Biochemicals, medicines i Fresh water i
(UNEP, 2007b). Lack of services makes people vulnerable to environmental and socioeconomic changes. This must be seen in the context of patterns (archetypes) of poverty: International trade has increased incomes and reduced
poverty, but the large-scale extraction of natural resources has led to hazardous wastes, environmental impacts and biodiversity loss.
Conflict, violence and persecution force people to move to marginal ecological and economic areas. This is develop-ment in reverse and has also led to degradation of natural resources.
Natural hazards due to climate change and ecosystem des-truction have claimed 1.5 million lives over the last 20 years and affect more than 200 million people annually.
From these global patterns, GEO4 concludes that strong synergies exist between improving human well-being and reducing vulnerability from environmental, development and human rights perspectives. Environmental protection requires a strong focus on human well-being.
The World Resource Institute (WRI, 1998) concludes that ‘ecosystems are – or can be – the wealth of the poor. Har-vests from forests, fisheries and farm fields are a primary source of rural income, and a fall-back when other sources of employment falter. But programs to reduce poverty often fail to account for the important link between environment and the livelihoods of the rural poor. As a consequence, the full potential of ecosystems as a wealth-creating asset for the poor – not just a survival mechanism – has yet to be effecti-vely tapped. Income from ecosystems – or “environmental income” – can act as a fundamental stepping-stone in the eco-nomic empowerment of the rural poor.’ For this to happen, the poor must manage ecosystems so that they support stable productivity over time. Productive ecosystems are the basis of a sustainable income stream from nature, but to tap that income, the poor must be able to reap the benefits of their good stewardship. Unfortunately, the poor are rarely in such a position of power over natural resources because this is usually prevented by an array of governance failures: lack of legal ownership and access to ecosystems, political marginali-sation and exclusion from the decisions that affect how these ecosystems are managed. Without addressing these failures, there is little chance of using the economic potential of eco-systems to reduce rural poverty.
2.4 Statements of global conventions
Global conventions contribute to the discussion by identi-fying problems, defining topics, setting goals and defining sustainable and unsustainable development (UNEP, 1992). In
Our Common Future sustainable development is defined as ‘development that meets the need of the present without compromising the ability of future generations to meet their own needs’ (WCED, 1987). The goal of environmental sustai-nability is to minimise environmental degradation and halt and reverse the processes they lead to (Agenda 21). Environ-mental unsustainability is a situation in which the total sum of nature’s resources is used up faster than it can be repleni-shed. In September 2000, at the United Nations Millennium Summit, world leaders agreed to a set of time-bound and
measurable goals and targets for combating poverty, hunger, disease, illiteracy, environmental degradation and discrimina-tion against women: the Millennium Declaradiscrimina-tion (UN, 2000a; UN, 2000b). The goals are ends in themselves (Millennium Project, 2005) and linkages between the goals are not directly addressed. The goals for hunger and disease are part of human capital and the goal for environmental sustainability is part of natural capital. Poverty traps were identified as one of the four reasons for shortfalls in achieving the goals (Millen-nium Project, 2005) as countries may be too poor to invest in environmental management and poverty reduction.
At the World Summit on Sustainable Development (WSSD, 2002; UN, 2002b) the United Nations recognised that eradicating poverty, changing consumption and production patterns and protecting and managing the natural resource base for economic and social development are overarching objectives of, and essential requirements for, sustainable development. World leaders declared that the ‘deep fault line’ between rich and poor posed a major threat to global prosperity and sta-bility (UN, 2002a). The rapid integration of markets, mosta-bility and capital and increased investment flows had created new opportunities, but the benefits and costs were unevenly dis-tributed. ‘We risk the entrenchment of these global disparities and unless we act in a manner that fundamentally changes their lives the poor of the world may lose confidence in their representatives and the democratic systems to which we remain committed. Biodiversity, which plays a critical role in overall sustainable development and poverty eradication, is essential to our planet, human well-being and to the liveli-hood and cultural integrity of people.’ (WSSD, 2002; UNEP-CBD, 2002).
In April 2002, the Parties to the Convention on Biological
Diver-sity (CBD) committed themselves ‘to achieve by 2010 a signi-ficant reduction of the current rate of biodiversity loss at the global, regional and national level as a contribution to poverty alleviation and to the benefit of all life on Earth’ (UNEP, 2002). The CBD (UNEP-CBD, 2004) states that biodiversity is ‘the foundation upon which human civilisation has been built. In addition to its intrinsic value, biodiversity provides goods and services that underpin sustainable development in many ways, thus contributing to poverty alleviation.’ First, it supports the ecosystem functions essential for life on earth, such as the provisioning of fresh water, soil conservation and climate stability. Second, it provides products such as food, medicines and materials for industry. Finally, biodiversity is at the heart of many cultural values. In 2004, the Conference of Parties adopted seven focal areas and corresponding targets, goals and indicators in decision VII/30. Two of these focal areas relate biodiversity to human well-being: goal 4 on sustainable use and consumption and goal 8 on maintaining the capacity of ecosystems to deliver goods and services and support livelihoods (UNEP-CBD, 2004). It is, however, not clear at what level sustainable use must be set in order to avoid degradation of ecosystem integrity.