Indebted to nature
Exploring biodiversity risks for the Dutch
financial sector
Accountability: De Nederlandsche Bank (DNB) was responsible for the financial data and analyses in this collaborative project, and PBL Netherlands Environmental Assessment Agency (Planbureau voor de Leefomgeving – PBL) supplied the data on nature and the environment. Authors: Joris van Toor, Danijela Piljic, Guan Schellekens - DNB
Mark van Oorschot, Marcel Kok - PBL
Contact: Joris van Toor (j.a.c.van.toor@dnb.nl), Mark van Oorschot (mark.vanoorschot@pbl.nl) With thanks to: Martijn Kramer, Johan Meijer and Sandy van Tol
Indebted to nature: Exploring biodiversity risks for the Dutch financial sector
1 Introduction
5
2 Biodiversity and the financial sector
9
2.1 Decline in biodiversity and eco system services 9
2.2 Transmission to the financial sector 11
3 Physical risks
16
3.1 Loss of ecosystem services 16
3.2 Loss of animal pollination 18
4 Transition risks
21
4.1 The biodiversity footprint of the financial sector 21
4.2 Activities in biodiversity hotspots 22
4.3 The Dutch nitrogen crisis 26
5 Reputational risks
31
5.1 Involvement in controversial activities 31
5.2 Reputational damage due to inadequate information provision about deforestation risks 34
6 Conclusions and recommendations
37
6.1 Conclusions 37
6.2 Recommendations 38
7 References
39
5 The loss of biodiversity has an impact on the
economy. Firstly, the loss of biodiversity threatens the health of ecosystems that provide services to the economy, such as animal pollination of food crops, natural water treatment and fertile soil.1
The Global Assessment of the Intergovernmental Platform on Biodiversity and Ecosystem Services (IPBES), published in 2019, shows that a large proportion of original biodiversity has been lost in many places worldwide.2 For example, deforestation
not only causes nature to deteriorate, it can also cause erosion of fertile soil, rendering agricultural land unusable in the long term. Second, the loss of biodiversity and healthy ecosystems contributes to accelerating climate change. Deforestation is responsible for just over 10% of global greenhouse gas emissions.3 Biodiversity loss is therefore
considered to be one of the greatest risks to society and the economy.4
Biodiversity loss is becoming an increasingly prominent issue on the national and international policy agendas. Over the next year, new
international agreements will be made under the UN Convention on Biological Diversity (CBD) to increase the extent of protected areas worldwide,
1 According to the Millennium Ecosystem Assessment (2005), biodiversity and ecosystems are closely related. Diversity is a structural characteristic of ecosystems and the variation in ecosystems is an element of biodiversity.
2 IPBES (2019a). 3 PBL (2009).
4 See, for example: IPBES (2019), OECD (2019), WEF (2020) and Rockström et al. (2015).
5 See European Green Deal, which states that the objective of a climate-neutral Europe will be translated into a binding legal obligation (the European Climate Law).
6 See EU Biodiversity Strategy 2030.
7 An ecological footprint expresses how great the burden of consumption is on nature and the environment. This includes all the links in the production chain, from raw material to consumption. The footprint is composed of various forms of pressure on nature and the environment, and it is translated into virtual land surface. Also see: Ministry of Agriculture, Nature and Food Quality (7 October 2019).
8 Natura 2000 is a European network of protected nature conservation areas. 9 Ministry of Agriculture, Nature and Food Quality (24 April 2020).
10 In a letter to the Dutch House of Representatives, the Ministry of Agriculture, Nature and Food Quality (7 October 2019) announced its policy for national and international natural areas, nature-friendly business practices and sustainable trade.
to promote the sustainable use of ecosystems and reduce the causes of biodiversity loss. In addition, in its European Green Deal, the European Commission (EC) presented a transition path leading to a climate-neutral Europe in 2050.5 A key part of this
deal is the new biodiversity strategy in which measures are announced, such as setting up a large network of protected areas and restoring damaged ecosystems in the EU.6 In the Netherlands, the
government has announced that, as part of its “Strengthening Biodiversity” programme (Versterken
Biodiversiteit), it is working to improve biodiversity
and halve its ecological footprint by 2050.7 There are
also supplementary measures in place to reduce pressure on the nitrogen-sensitive Natura 2000 areas8 in the Netherlands,9 and companies are being
urged to gain a clear picture of their negative impact on biodiversity, with the aim of lessening that impact.10 National and international policy is part of
the transition to a sustainable economy that preserves biodiversity. This transition has consequences for economic activities that have a negative impact on biodiversity. The Dutch financial sector will experience such consequences through the financing of these economic activities.
1 Introduction
6 In view of the potentially major economic impact of biodiversity loss, it is important that financial institutions build their capacity in time to analyse and manage the risks associated with biodiversity loss. The risks of biodiversity loss for the financial sector do not have to be simply avoided. Financial institutions can make use of various instruments to manage risks and build up resilience. For example, when granting loans, banks can ask companies to address these risks, and through engagement pension funds and insurers can raise awareness of these risks among the companies in which they invest. Furthermore, with a total of over EUR 4,000 billion in lending and investment, financial institutions have the potential to make a positive contribution to achieving sustainable prosperity while maintaining biodiversity.11
Policymakers and supervisory authorities are becoming increasingly aware of the need for a stronger focus on financial risks related to the environment. The EC’s action plan for funding sustainable growth states that sustainability should be an integral part of risk management by financial institutions.12 The EC has therefore asked the three
European supervisory authorities for the financial sector13 for advice on embedding Environmental,
Social and Governance (ESG) factors in the
11 For example, a working group of financial institutions is active in the Sustainable Finance Platform (Platform voor
Duurzame Financiering), identifying risks resulting from the decline in biodiversity and opportunities for restoring
biodiversity (The Sustainable Finance Platform, 2020). 12 EC (2019).
13 The three supervisory authorities (ESAs) are the European Banking Authority (EBA), the European Insurance and Occupational Pensions Authority (EIOPA) and the European Securities and Markets Authority (ESMA). 14 These activities make a positive contribution to at least one of the EC’s six environmental goals, while there is no
negative impact on the other goals. 15 NGFS (2018).
16 PBL’s knowledge of biodiversity has been combined with DNB’s knowledge of the financial sector. The analyses in this report relate to Dutch banks, pension funds and insurers. The methods for the analyses are described in Methods for analyses in Indebted to Nature (2020).
supervisory regulations. Biodiversity is included as part of the environmental factor in the
recommendations made. The EC has also devised a classification system – a taxonomy – for sustainable economic activities.14 This taxonomy helps investors
to understand which economic activities contribute to the environmental goals of the EC. Preserving biodiversity is one of these goals. Finally, 66 central banks and supervisory authorities, which together make up the Central Banks and Supervisors Network for Greening the Financial System (NGFS), showed in 2018 that climate-related and
environmental risks are a source of financial risks and that it is therefore within their mandate to ensure that the financial system can withstand these risks.15
De Nederlandsche Bank (DNB) and PBL
Netherlands Environmental Assessment Agency (Planbureau voor de Leefomgeving - PBL) explore in this report how and to what extent financial institutions are exposed to risks from loss of biodiversity.16 We must emphasise that we have
not studied all the risks resulting from the loss of biodiversity. The results therefore represent a lower limit for total exposure. The choice of the risks to be studied was made partly based on the availability of financial and biodiversity data. This choice therefore
7 Indebted to nature: Exploring biodiversity risks for the Dutch financial sector
does not imply that other risks might be smaller or less relevant. Moreover, potential systemic risks resulting from biodiversity loss and their possible connection with climate-related risks have not been taken into consideration. This report follows up a DNB report Values at risk?, which gave a qualitative description of the risks of biodiversity loss.
9 Indebted to nature: Exploring biodiversity risks for the Dutch financial sector
2 Biodiversity and the
financial sector
Biodiversity is vital to society as well as
the economy. In this chapter we describe
how the decline in biodiversity and
ecosystem services translates into risks
for the financial sector.
2.1 Decline in biodiversity and
ecosystem services
Ecosystem services are the benefits that nature provides to society and the economy.17 They are
usually divided into four categories. Provisioning services are tangible products of ecosystems, such as food, timber and cotton. Regulating services are the benefits of the regulating processes, such as animal pollination, air and water treatment, and soil fertility. Cultural services are the non-material benefits of ecosystems, such as their contributions to education, recreation and tourism. Finally, nature provides supporting services, such as the nutrient cycle, soil conservation and habitat creation, which actually support the other three categories of ecosystem services. Aside from the practical value of nature, which is expressed in ecosystem services, people can also derive value from the existence of nature without making use of it. Nature also has an intrinsic value, which is related to the actual survival of plants and animals, regardless of any value to
17 Ecosystems are complex and dynamic systems of plants, animals and microorganisms, together with the non-living environment, interacting as a functional unit. This definition is taken from Millennium Ecosystem Assessment (2005). 18 IPBES (2019a).
19 Vos, Grashof-Bokdam and Opdam (2014). 20 IPBES (2019b).
21 IPBES (2019a). 22 IPBES (2019a).
human beings. This report takes ecosystem services as the starting point for defining and understanding the relationship between biodiversity and the financial sector.
Biodiversity loss threatens the availability of ecosystem services. In the coming decades, between half a million and a million plant and animal species worldwide are threatened with extinction as a consequence of changing land and sea use, overexploitation of ecosystems, climate change, pollution and invasive species.18 The diversity
of species and types are of crucial importance for ensuring that ecosystems are stable and function well over the longer term.19 Intensive agriculture and
forestry in Europe have contributed to a decline in the delivery of regulating ecosystem services in particular, such as natural water treatment, natural pest control and animal pollination.20 Research
shows that of the 18 ecosystem services studied, more than three-quarters have deteriorated significantly in the last 50 years.21 A number of
ecosystem services cannot be replaced in their entirety, because substitutes often fail to provide the full range of benefits.22 In addition, some
substitutes entail higher costs or can lead to undesirable externalities, such as damage to health and the environment from chemical pesticides as a replacement for natural pest control.
10 The economic consequences of biodiversity loss can be severe, but quantifying them is a complex task. First, knowledge of the interaction between ecosystem services and the economy is limited, partly because an exhaustive overview of ecosystem services on which the economy depends is not available. Second, it is difficult to quantify the impact of biodiversity loss on the supply of ecosystem services. Ecosystems are complex and dynamic systems with tipping points, which can bring about sudden, non-linear changes that are hard to predict, and even the loss of an ecosystem’s ability to function.23 In addition, the loss of an ecosystem
service can, through domino effects and feedback loops, have negative consequences for other ecosystem services.24 Various estimates, which
are subject to uncertainty however, show that the economic value of ecosystem services is considerable.25 This implies that the loss of
ecosystem services can have significant consequences for the economy.26
23 The characteristics of the risks of biodiversity loss are similar to those of climate-related risks. NGFS (2018) states that the characteristics of climate-related risks are so different from those of other structural risks to the financial system that they require a different risk analysis and risk management. This reasoning by NGFS can also be applied to risks resulting from biodiversity loss.
24 Rocha, Peterson, Bodin and Levin (2018).
25 See, for example, Costanza et al. (2014) and OECD (2019).
26 Over the last 30 years, there have been more and more initiatives aimed at quantifying economic losses as a result of the decline in biodiversity. These initiatives include The Economics of Ecosystems and Biodiversity programme (TEEB), the Millennium Ecosystem Assessment (MEA), the Natural Capital Finance Alliance and, more recently, the OECD (2019). 27 IPBES (2019a).
28 IPBES (2019a).
29 There are clear indications that loss of biodiversity and ecosystem services increase the impact of climate-related risks. See, for example: Munang, Thiaw, Alverson, Liu and Han (2013); and Nunez, Arets, Alkemade, Verwer and Leemans (2019). 30 WWF and PWC (2020).
Biodiversity helps to limit climate change, but is at the same time negatively affected by it. By means of ecosystem services, biodiversity plays an important role in limiting climate change. Marine and terrestrial ecosystems are responsible for absorbing 60% of the world’s carbon emissions.27
Mangroves, sea grasses and corals offer protection against negative impacts of climate change, such as flooding.28 At the same time, climate change is
one of the main causes of biodiversity loss.29 This
can lead to ecosystems being disrupted, thereby reducing or even destroying their capacity to provide services. For example, the melting of permafrost in the Arctic leads to increasing greenhouse gas emissions, which can in turn accelerate climate change.
In short, the more the climate changes, the more biodiversity is lost, which then leads to further climate change. It is therefore important to consider climate-related and biodiversity risks in relation to each other.30
11 Indebted to nature: Exploring biodiversity risks for the Dutch financial sector
2.2 Transmission to the financial sector
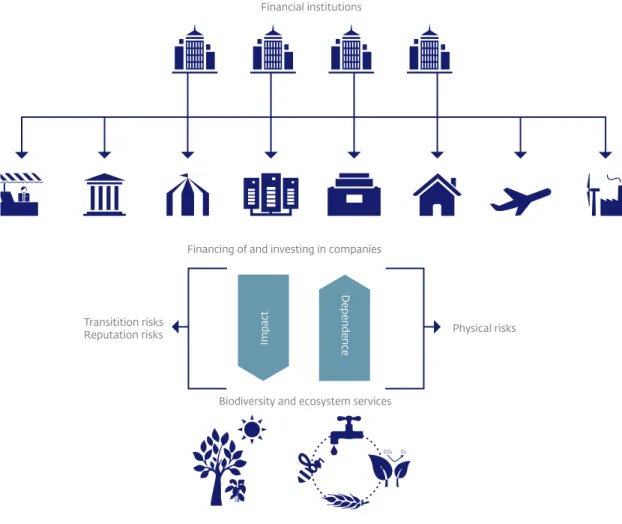
The relationship between biodiversity and financial institutions is indirect and two-way. The financial sector finances companies that are at least partly dependent on ecosystem services for the production of their goods and services. In addition, the sector finances companies that have an adverse impact on biodiversity through their production processes because of changing land and sea use, overexploitation of ecosystems, climate change and pollution.31 The figure below illustrates the relationship.Dependence on declining ecosystem services leads to physical risks. By financing companies that depend on ecosystem services, financial institutions are exposed to physical risks. The loss of ecosystem services can threaten companies’ production processes and this can translate into a deterioration in their financial position.32 For example, around
three-quarters of the 107 food crops most used worldwide, which include vegetables, fruit, cacao and almonds, depend to a greater or lesser extent on animal pollination.33 Moreover, if ecosystems are
used too intensively, this can result in them being unable to recover, or to recover insufficiently. For example, a third of fish stocks are overfished and the careless harvesting of timber worldwide is causing forest degradation.34 Over time, this creates a risk to
the business model of fisheries and timber producers.
31 Progress has now been made in terms of measuring the impact of the exposure of financial institutions to biodiversity. See, for example: Berger et al. (2018) and for an overview of best practices, see, for example, OECD (2019) and EU B@B Platform.
32 UNEP-WCMC and NCFA (2018) 33 Klein et al. (2007).
34 IPBES (2019a).
Impact on ecosystem services and biodiversity can lead to transition and reputational risks. Financing companies with a negative impact on biodiversity and ecosystem services also exposes financial institutions to transition and reputational risks. Financial institutions that invest in companies with a (disproportionately) negative impact run greater reputational risks. Government measures, technological developments or changing consumer preferences aimed at reducing the damage to biodiversity and ecosystems can translate into
transition risks because companies have to adapt to a
new reality. One example of a transition risk is the Dutch nitrogen crisis, in which a legally determined emission allocation to protect nitrogen-sensitive Natura 2000 areas has led to a restriction of activities in various economic sectors.
Physical and transition risks reinforce each other. To limit physical risks, measures need to be taken to prevent the decline in ecosystems and biodiversity. The greater the physical risks, the more essential a transition is, but the measures taken are accompanied by transition risks for the economy. Postponing a transition, however, leads to greater physical risks and means that ultimately, a shorter and more abrupt transition period is necessary, which enhances the transition risks.
12
For financial institutions, the risks resulting from biodiversity loss translate into existing financial risks. Physical risks can jeopardise business continuity, reducing business value and damaging the ability to generate profits and repay debts. For financial institutions, this translates into market and
credit risks. A transition, particularly if it is abrupt, can increase the probability of default on loans and write-downs of investments in companies with production processes that have a negative impact on biodiversity. Furthermore, liability claims or reputational damage can lead to higher operational
Figure 1 Relationship between financial sector, economy, biodiversity and
ecosystem services
Financial institutions
Financing of and investing in companies
Biodiversity and ecosystem services Transitition risks
Reputation risks Physical risks
Dependence
13 Indebted to nature: Exploring biodiversity risks for the Dutch financial sector
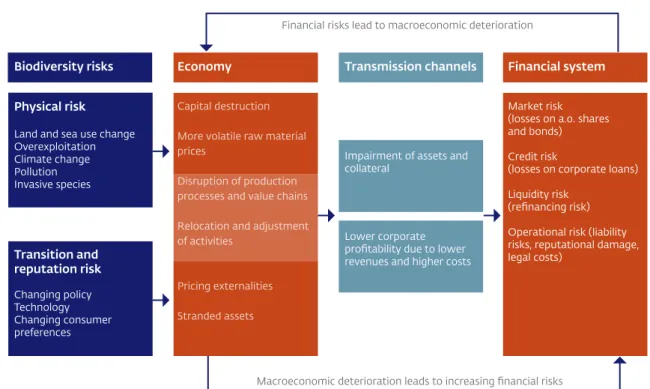
risks. Substantial credit, market and operational risks can additionally make it more difficult for financial institutions to obtain refinancing in the short term (liquidity risks). In turn, financial risks can worsen an economic downturn, which then leads to greater financial risks. Figure 2 gives a schematic overview of the above.
Financial institutions acknowledge the importance of limiting the negative impact of their investment and lending activities. This is important not only from a social and ecological perspective, but also for financial institutions’ risk management. For example, Dutch insurers and pension funds have signed the International Responsible Business Conduct agreements. One of the aims of these agreements is to limit the negative impact of their investments on human rights and
Figure 2 From biodiversity risks to financial risks
Physical risk
Land and sea use change Overexploitation Climate change Pollution Invasive species
Biodiversity risks Economy
Financial risks lead to macroeconomic deterioration
Macroeconomic deterioration leads to increasing financial risks
Financial system
Market risk (losses on a.o. shares and bonds) Credit risk
(losses on corporate loans) Liquidity risk
(refinancing risk) Operational risk (liability risks, reputational damage, legal costs)
Transmission channels
Impairment of assets and collateral
Lower corporate profitability due to lower revenues and higher costs
Transition and reputation risk Changing policy Technology Changing consumer preferences Capital destruction More volatile raw material prices
Disruption of production processes and value chains Relocation and adjustment of activities
Pricing externalities Stranded assets
14 the environment.35 Recently, under the umbrella of
the United Nations Environment Programme Finance
Initiative, several large Dutch banks committed
themselves to the Principles for Responsible Banking.36
They undertake to reduce the negative impact on the environment resulting from their activities, products and services.
35 SER (2018a) and SER (2018b).
36 The Principles for Responsible Banking were launched by 130 banks from 49 countries during the annual United Nations General Assembly of 22 and 23 September 2019. These institutions represent more than USD 47 billion in assets; see https://www.unepfi.org/banking/bankingprinciples/.
16
3 Physical risks
Reduced availability of ecosystem services
is a physical risk for financial institutions.
In this chapter we describe the extent to
which the financial sector is indirectly
dependent on ecosystem services. Using
the example of animal pollination, we
then show how the financial sector is
exposed to reduced availability of this
ecosystem service. In order to obtain a
comprehensive picture of the physical
risks for the financial sector caused by the
loss of ecosystem services, the sector’s
exposure to other ecosystem services
should also be analysed.
3.1 Loss of ecosystem services
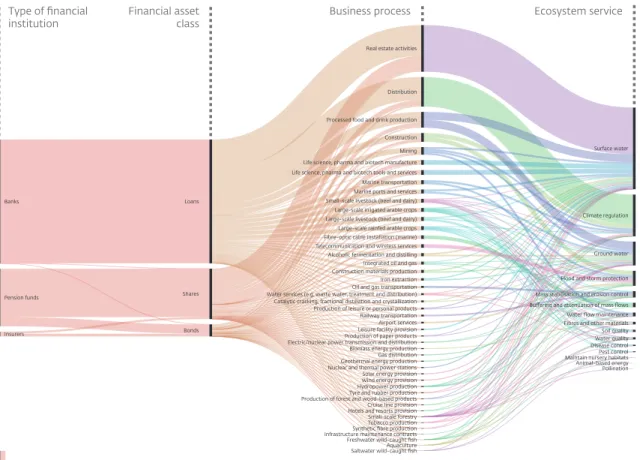
We show how the exposure of Dutch financial institutions depends indirectly on ecosystem services. The ENCORE database37 details thedependencies on 21 ecosystem services for 86 business processes.38 Each business process has a
dependence score for each ecosystem service. The dependence score is allocated based on two factors: the degree to which production processes are disrupted and the projected extent of financial losses if the ecosystem service is lost. The business processes are first linked to economic sectors. Next, the exposure of Dutch financial institutions to those sectors through shares and corporate bonds and loans is determined (see figure 3). Finally, the
37 ENCORE was developed by Natural Capital Finance Alliance in cooperation with UNEP-WCMC to help financial institutions improve their understanding and assessment of risks resulting from the decline in biodiversity and ecosystem services; UNEP-WCMC and NCFA (2018).
38 This analysis is further elaborated in a forthcoming DNB Working Paper and summarized in the method document Methods for analyses in Indebted to nature.
ecosystem services are shown on which these business processes are highly or very highly dependent. This gives us an understanding of the ways in which the Dutch financial sector is indirectly dependent on ecosystem services. Of investments by Dutch financial institutions, a total of EUR 510 billion is highly or very highly dependent on one or more ecosystem services. This represents 36% of the portfolio of more than EUR 1,400 billion we examined. For these investments, the loss of ecosystem services would lead to substantial disruption of business processes and financial losses. The highest dependence is on the ecosystems that provide groundwater and surface water. Of every euro invested, approximately one-quarter is dependent on these ecosystems. It should be noted here that the analysis only considers first-order dependencies of the economic sectors on the ecosystem services. For example, in the database used, the processing of food products (secondary industry) is not directly dependent on animal pollination, but this is of course the case for the cultivation of crops (primary industry) that are used in the secondary industry. This leads to an underestimation of the dependencies of secondary industries on ecosystem services.
The exact level of risk depends on the geographic location of business activities and their value chains. The worldwide decline in biodiversity makes it increasingly likely that ecosystem services will be
17 Indebted to nature: Exploring biodiversity risks for the Dutch financial sector
disrupted or lost. A complicating factor in estimating the associated risks is that disruptions are usually of a local nature. To make a good estimate of the risks facing a specific company, it should be identified for
each location whether there is a heightened risk of disruption of the ecosystem services on which the business activity depends. This can include the possibility of substitution, as in some cases it is
Sources: ENCORE, DNB * The total value of the holdings in shares and bonds (2018-IV), and of the major loans
(2017-IV) by Dutch financial institutions, is EUR 1,421 billion. EUR billion
Figure 3 The financial sector and ecosystem services dependencies per euro
invested*
Airport services Alcoholic fermentation and distilling
Aquaculture Biomass energy production Catalytic cracking, fractional distillation and crystallization Construction
Construction materials production
Cruise line provision Distribution
Electric/nuclear power transmission and distribution Fibre-optic cable installation (marine)
Freshwater wild-caught fish Gas distribution Geothermal energy production
Hotels and resorts provision Hydropower production
Infrastructure maintenance contracts Integrated oil and gas Iron extraction Large-scale irrigated arable crops Large-scale livestock (beef and dairy) Large-scale rainfed arable crops
Leisure facility provision Life science, pharma and biotech manufacture Life science, pharma and biotech tools and services Marine ports and services Marine transportation Mining
Nuclear and thermal power stations Oil and gas transportation Processed food and drink production
Production of forest and wood-based products Production of leisure or personal products
Production of paper products Railway transportation Real estate activities
Saltwater wild-caught fish Small-scale forestry Small-scale livestock (beef and dairy)
Solar energy provision
Synthetic fibre production Telecommunication and wireless services
Tobacco production Tyre and rubber production Water services (e.g. waste water, treatment and distribution)
Wind energy provision
Animal-based energy Buffering and attenuation of mass flows Climate regulation
Disease control Fibres and other materials Flood and storm protection Ground water
Maintain nursery habitats Mass stabilisation and erosion control
Pest control Pollination Soil quality Surface water
Water flow maintenance Water quality Banks Pension funds Insurers Shares Loans Bonds Type of financial
institution Financial asset class Business process Ecosystem service
18 possible to compensate partially for the loss of ecosystem services.39 The increasing availability of
geographic data is making it ever easier to carry out such analyses. Estimates have already been made, for instance, of risks of water shortages, flooding or a lack of animal pollination of agricultural crops.40
3.2 Loss of animal pollination
The disappearance of the animal pollination ecosystem service is a physical risk for the financial sector. More than three-quarters of the most important food crops that ensure our food supplies depend to a greater or lesser extent on animal pollination, for example by bees or birds. It is estimated that 5-8 per cent of current global crop production, with an annual market value of USD 235-577 billion worldwide, is directly attributable to animal pollination.41 The reduction in worldwidecrop production due to declining biodiversity is already visible.42 The loss of crop production can first
of all have a negative impact on the profitability of primary producers. In addition, food processors can face higher or more volatile raw material prices. This can result in a higher risk profile for the financial sector through investments in – or lending to – the agriculture sector and the food production and processing industry.43
39 As previously mentioned, a number of ecosystem services cannot be fully replaced, because in many cases substitutes do not provide the full range of benefits.
40 Also see: DNB (2019), Bank of Italy (2018) and Chaplin-Kramer R. et al. (2019).
41 Value adjusted to 2015 United States dollars taking into account inflation only. Also see: IPBES (2016). 42 Garibaldi, Aizen, Klein, Cunningham and Harder (2011).
43 More volatile food prices are also a key determinant of macroeconomic instability, in particular in low-income countries; see also UNDP (2015).
44 Of the 107 crops from Klein et al. (2007), we include 55 in our analysis. It has been scientifically shown that these 55 crops are to some extent dependent on animal pollination (Klein et al., 2007) and can be linked to international trade data.
Financing companies with pollination-dependent products exposes Dutch financial institutions to the risk represented by the loss of animal pollination. We calculate this exposure in three steps. We first identify which product groups contain any of 55 pollination-dependent crops which, according to the Food and Agriculture Organisation of the United Nations, are crucial to food production.44 This applies to 271 of the
approximately 5000 product groups studied. We subsequently determine the importance of the 271 product groups for the various economic sectors. We approximate the importance per sector as the commercial value of these product groups in relation to the commercial value of all product groups belonging to the sector. Finally, with the help of balance sheet data from financial institutions, we determine the extent of lending to, and investment in, sectors with products that are dependent on pollination.
The exposure of financial institutions to pollination-dependent products totals
EUR 28 billion. Virtually all these products occur in agriculture and in the food processing and textile processing industries. Exposure to pollination-dependent products makes up 27% of the total of more than EUR 100 billion exposure to agriculture and the food processing and textile processing
19 Indebted to nature: Exploring biodiversity risks for the Dutch financial sector
industries. Exposure to some pollination-dependent products is riskier than exposure to others. This is related to the extent to which the yield of a crop that is used for the products depends on animal pollination (pollination dependency ratio). For cacao this ratio is 95%, while for tomatoes it is 5%, for example. Ultimately, the exact level of risk depends
45 Garibaldi et al. (2013) show that the variety of pollinators has a positive effect on the crop yield. This suggests that natural pollination cannot always be fully replaced by, for example, the use of honeybees.
partly on potential mitigation measures. There are ways of managing this risk, such as restoring and creating landscape elements in agricultural areas that are attractive to animal pollinators, deploying domesticated honeybees 45 or growing crop variants
21 Indebted to nature: Exploring biodiversity risks for the Dutch financial sector
4 Transition risks
Financing companies that have a negative
impact on biodiversity and ecosystem
services can lead to a transition risk for
financial institutions. In this chapter we
calculate the worldwide biodiversity
footprint of the Dutch financial sector’s
share portfolio. We then describe the
exposure to transition risks with the help
of two examples: the possible expansion of
protected areas and the measures taken
in response to the Dutch nitrogen crisis.
4.1 The biodiversity footprint of the
financial sector
A biodiversity footprint provides insight into the pressure economic activities put on biodiversity. In this analysis, the biodiversity footprint is expressed as the loss of species and populations in ecosystems as compared with the pristine situation.46 Using the GLOBIO model developed
by PBL, we look at the biodiversity footprint as a consequence of changing land use and greenhouse gas emissions.47 A disproportionately large
biodiversity footprint for financial institutions can serve as an indicator for increased transition risks. We determine the biodiversity footprint of Dutch financial institutions. To this end we calculate the worldwide biodiversity footprint of over 8,000
46 The mean species abundance indicator is a measure of the naturalness of an area and it is used by the OECD, UNEP and the Convention on Biological Diversity, among others.
47 Wilting and Van Oorschot (2017).
48 See the method document Methods for analyses in Indebted to nature for a full description of the method. 49 This is a common attribution method which is also used, for example, in the Partnership for Carbon Accounting
Financials to attribute greenhouse gas emissions to financial institutions.
companies in which Dutch financial institutions invest. With more than EUR 320 billion, these companies represent 80% of the share portfolio of Dutch financial institutions. First, the biodiversity footprint per euro of turnover is determined by sector and by continent. This means that we assume that companies in the same sector, which generate turnover on the same continent, have the same footprint per euro of that turnover. In addition to the impact of companies’ own production processes, the impact of their value chains is also taken into account. As the size and geographic spread of the turnover of companies differ, this results in a biodiversity footprint for each company.48 The
biodiversity footprint of companies in which the Dutch financial sector has an equity interest is allocated to the financial sector in proportion to the market capitalization.49 This produces a biodiversity
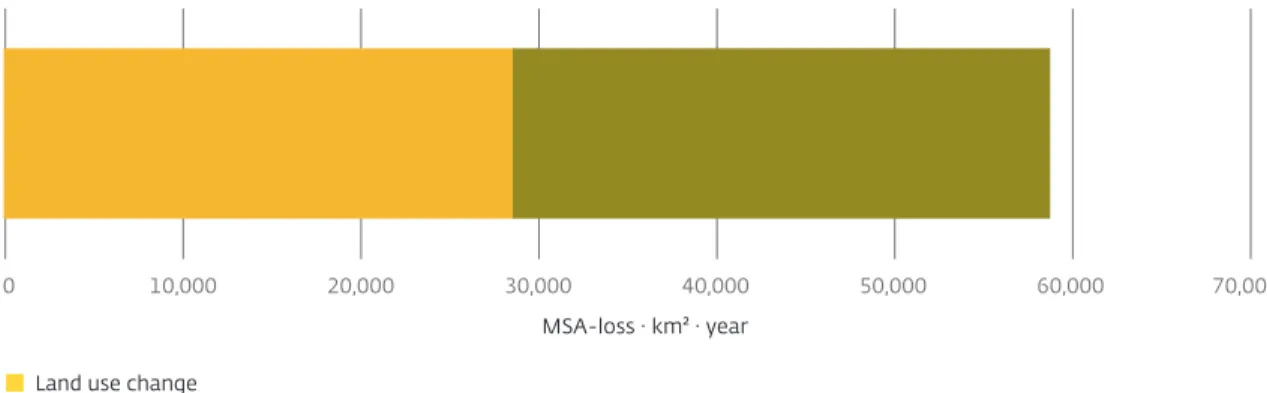
footprint for the Dutch financial sector. The biodiversity footprint of Dutch financial institutions is comparable with the loss of over 58,000 km² of pristine nature (see figure 4). This is an area more than 1.7 times the land surface of the Netherlands. About half of this is the result of changing land use, and the other half is due to greenhouse gas emissions.
The impact on biodiversity of the Dutch financial sector can lead to transition risks. New
22
preferences with a stronger focus on preserving biodiversity require companies with a
disproportionate footprint to make their business processes and their value chain more sustainable. This results in financial institutions that invest in these companies being exposed to transition risks. The biodiversity footprint is a first approximation of this transition risk. The development and use of effective and more context-specific instruments for measuring the biodiversity footprint can give financial institutions a greater understanding of the degree to which their responsible investment and/or financing policy, engagement and exclusions have a real impact on the reduction of the
biodiversity footprint of their portfolios.
50 See, for example: NOS News (2017) and WWF (2018).
4.2 Activities in biodiversity hotspots
Financial institutions run a transition risk as well as a reputational risk through financingcompanies that operate in protected or valuable areas. A transition risk exists when governments decide to designate new areas as protected areas. In that case, business activities in those locations have to be adjusted or even moved, which involves additional costs for the companies involved. In addition to this transition risk, both companies and financial institutions face reputational risk when operating in already protected areas. Examples include Royal Dutch Shell’s oil drilling activities in the Arctic region or British oil company SOCO’s intended activities in Virunga National Park in the Democratic Republic of the Congo.50
Land use change Greenhouse gas emissions
Figure 4 Biodiversity footprint of the Dutch financial sector, 2018-IV*
Sources: PBL, DNB * The shareholdings of Dutch financial institutions for which the sector
classification is available total EUR 397 billion. Data available from these companies, including a geographical breakdown of sales, represent EUR 321 billion.
10,000
0 20,000 30,000 40,000 50,000 60,000 70,000
23 Indebted to nature: Exploring biodiversity risks for the Dutch financial sector
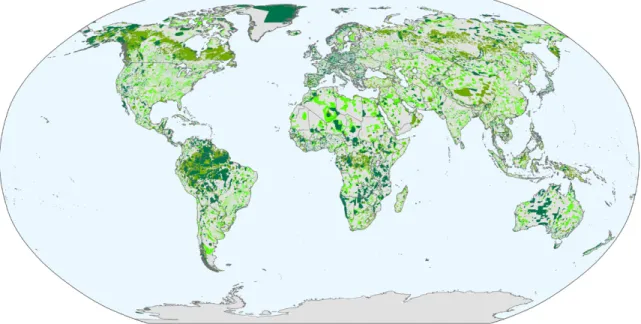
Policy makers are expected to step up measures to protect areas that are important for the conservation of biodiversity. Over the past years, scientists and policymakers have focused
increasingly on the decline in biodiversity and the need to protect it. The publication of the research findings of the IPBES51 has fuelled the sense of
urgency, and the European Commission has announced in its European Green Deal that it will take specific practical steps to protect biodiversity. It is likely that during the meeting of the 168 countries that are parties to the UN Convention on Biological
Diversity in 2021, a decision will be made to increase
the size of protected areas worldwide. The protection of an area covering 30% of the land and inland waters is being discussed.52 This would
represent nearly a doubling of previous commitments to protect 17% of land and inland waters worldwide by 2020 (see box 2).53 Moreover,
since 1990, the size of protected areas worldwide has almost doubled to 15% (see dark green areas in figure 5).54
51 IPBES (2019a).
52 See also de Volkskrant, 14 January 2020.
53 It has also been agreed to protect 10% of coastal and sea areas in 2020. 54 Lewis et al. (2019).
55 The location of any extension of protected areas is the result of national decision-making. The analysis for this is based on an allocation according to ecological criteria (Kok et al., 2020).
56 With the 30% scenario, we align ourselves with the expectation that the number of protected areas is increased to achieve 30% coverage. The 24% scenario is midway between the current objective and that of 30%. Coastal and sea areas are excluded from the analysis.
57 See http://www.keybiodiversityareas.org/kba-data-use.
58 The Alliance for Zero Extinction is a joint initiative of organisations for the conservation of biodiversity in order to pre-vent the extinction of species. To this end, areas are identified and protected that are the last remaining refuge of one or more endangered or critically endangered species.
59 See http://www.intactforests.org/.
60 The areas are selected in such a way that at least 30% of the area of all unique combined land and freshwater eco regions worldwide are protected. In this way, areas with unique characteristics needed for the survival of a specific species are added, rather than areas with more generic features. Also see: Kok et al. (2020).
Because it is uncertain how much land will be protected and which areas will ultimately be granted protected status, we consider two scenarios.55 In these scenarios, either 24% or 30% of
the various types of ecosystems on land and in inland waters are classified as protected areas.56 The areas
yet to be protected in these scenarios are selected on the basis of ecological criteria in a three-step process. The first step involves areas of particular importance for biodiversity which are not yet protected and which have either been identified as key biodiversity
areas57 or designated by the Alliance for Zero
Extinction.58 The second involves areas that have been
classified as Intact Forest Landscapes and that are not yet protected.59 The areas from the first two steps are
included in the 24% scenario. To arrive at coverage of 30%, areas are added in step three in order of the greatest contribution to the goal of conserving biodiversity in different types of ecosystems.60 In
figure 5, current protected areas are dark green. The additional protected areas in the 24% scenario are a lighter shade of green. The bright green areas, which are added to those, belong to the 30% scenario. Henceforth, we will refer to the light and bright green areas in the 24% and 30% scenarios as valuable areas.
24
Sources: UNEP-WCMC, Kok et al. (2020) Current protected areas
Expansion in 30% scenario Expansion in 24% scenario
Figure 5 Current protected areas and scenarios for potential expansion
based on ecological criteria
25 Indebted to nature: Exploring biodiversity risks for the Dutch financial sector
Box 1 Convention on Biological Diversity
The Convention on Biological Diversity (CBD), which entered into force in 1993, provides an international framework for the conservation and sustainable use of biodiversity and a fair distribution of benefits arising from the use of natural resources.61 The convention requires countries to develop and implement
biodiversity policy at national level. At present, 168 countries, including the Netherlands, have signed the convention. Every two years, countries that are parties to the CBD meet at the Conference of the Parties (COP) to review the development and progress in implementing the Convention and to reach further agreements on additional policy.
In 2010, the CBD formulated in its Strategic Plan a biodiversity vision and mission for the period 2011-2020. In addition, 20 targets – the Aichi Biodiversity targets – were formulated, with specific actions for preventing biodiversity loss.62 The Strategic Plan and the targets were agreed following the failure to achieve the
previously stated general objective of significantly slowing the decline in biodiversity by 2010.63 The
European Union elaborated the Aichi targets in the EU 2020 Biodiversity Strategy, and the Netherlands subsequently included them as biodiversity targets in national policy for nature conservation. The biodiversity targets are also part of the Sustainable Development Goals.
The latest evaluation shows that progress has been achieved in only four of the 20 Aichi targets worldwide.64 In the Netherlands, four targets will be met in 2020, while progress on 11 targets will fall
short.65 Despite the protection of over a quarter of the surface area of the Netherlands, the quality of the
natural environment is not satisfactory. Research shows that this is largely due to the fact that the Netherlands is one of the most densely populated countries in the world, where many economic activities take place which put pressure on the environment. In addition, most of the land area is highly productive agricultural land.66
61 During the United Nations Conference on Environment and Development (Earth Summit) in Rio de Janeiro in 1992, in addition to the Convention on Biological Diversity, the Conference also agreed on a Convention on Climate Change and a Convention to Combat Desertification.
62 Also see: https://www.cbd.int/sp/targets/. 63 CBD COP Decision VI/26, Annex, paragraph 11. 64 IPBES (2019a).
65 Sanders, Henkens and Slijkerman (2019). 66 Sanders, Henkens and Slijkerman (2019).
26 In order to assess the exposure of Dutch financial institutions, we document how many companies financed by those institutions operate in
protected or valuable areas. We use a database of FourTwentySeven, with a total of 927,000 business locations worldwide belonging to 1,783 multinational companies. We determined for each business location whether it is situated in one of the following four areas: protected area; valuable area in the 24% scenario; valuable area in the 30% scenario; or non-protected and non-valuable area. The exposure of the Dutch financial sector depends on the equity investments in, and lending to, the 1,783 multinational companies. In total, Dutch financial institutions have EUR 308 billion in shares in these companies and have provided them with EUR 81 billion in loans. This is 71% of the total equity portfolio of Dutch financial institutions and 40% of the Dutch banks’ major loans.
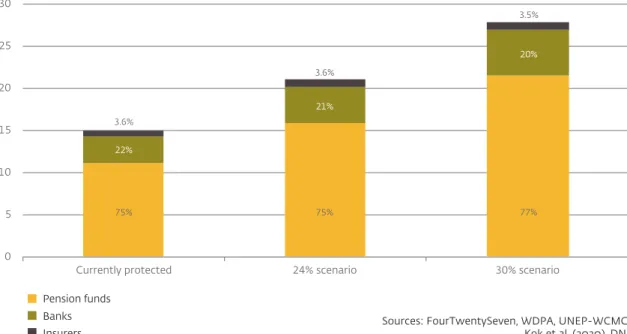
The Dutch financial sector has EUR 15 billion in exposure to companies that are active in already protected areas. In the 30% scenario, this amount rises to EUR 28 billion (see figure 6). The
calculations in this analysis represent a lower limit of the actual exposure of the Dutch financial sector. Banks in particular provide loans to small and medium-sized enterprises, which have not been included in this analysis, because data on their
67 IUCN breaks protected areas down further according to different levels of protection. This ranges from category I, comprising nature reserves and wilderness, to category VI, with areas in which natural resources can be extracted as long as this aids conservation; see https://www.iucn.org/theme/protected-areas/about/protected-area-categories. The following distribution applies for companies in the Dutch financial sector’s portfolio with business locations in these protected areas: IUCN-I – 0.5%, II – 2.4%, III – 1.9%, IV – 36%, V – 35% and VI – 24%.
68 The suspension of licensing has had a negative impact on the construction sector and its supply chain. Nevertheless, it did not immediately impact these sectors negatively, because projects that had already been licensed before the ruling by the Council of State in May 2019 were able to go ahead. It is therefore expected that the negative effects for these sectors will only become apparent from 2020. See, for example: Swart, Buijs and Wolf (2019).
69 Ministry of Agriculture, Nature and Food Quality (24 April 2020).
geographical locations are not available. Pension funds account for about three-quarters of the exposure, followed by banks (around 20%) and insurers (around 3.5%). More than 8% of
multinational companies’ business locations are in protected or valuable areas. This represents approximately 41,600 business locations. It should be noted that most of these business locations are in protected areas where specific economic activities are permitted under certain conditions.67
The number of business locations rises to 57,800 in the 24% scenario, increasing further to 71,600 business locations in the 30% scenario.
4.3 The Dutch nitrogen crisis
The Dutch nitrogen crisis requires a transition to business models that emit less nitrogen. This will result in extra costs and investments for nitrogen-emitting activities. With the ruling of the Council of State in May 2019, licensing for nitrogen-emitting activities on the basis of government policy arising from the Nitrogen Action Programme (Programma Aanpak Stikstof – PAS) was suspended.68 A package
of measures has now been announced to bring about a reduction in nitrogen emissions.69 The way
in which these transition measures will translate into risks for the financial sector depends on two
27 Indebted to nature: Exploring biodiversity risks for the Dutch financial sector
factors. First, the reduction in nitrogen deposition that is necessary is area-specific. 70, 71 Second, it is
still unclear exactly how the costs of the transition will be divided between the private and public
70 According to Wageningen University & Research, in spite of a fall in nitrogen deposition of 45% since 1990, three-quar-ters of the more than 160 Dutch Natura 2000 areas are having to contend with excessive nitrogen deposition. Emission is the nitrogen that is given off, while deposition is the nitrogen that subsequently lands on or in the soil; see RIVM. Excessive amounts of nitrogen on or in the soil in the natural areas that are sensitive to it damage the biodiversity in those locations.
71 According to PBL (2019), the quality of the natural environment in Natura 2000 areas can also be improved with measures other than those targeting nitrogen emissions, for example by raising the groundwater level or reversing the fragmentation of the natural environment.
72 The nitrogen crisis shows that a transition shock can temporarily increase the correlation between sectors that are normally not strongly correlated, such as agriculture and aviation.
sectors. However, the measures show that all nitrogen-emitting sectors have to help achieve the reduction.72
EUR billion
Figure 6 Exposure of Dutch financial institutions to protected and valuable
areas, 2018-IV*
25 30
Sources: FourTwentySeven, WDPA, UNEP-WCMC, Kok et al. (2020), DNB 0 5 10 15 20 Pension funds
Currently protected 24% scenario 30% scenario
* The shareholdings and major loans of Dutch financial institutions total EUR 636 billion and data on business locations are available for EUR 389 billion of this total.
75% 22% 3.6% 75% 21% 3.6% 77% 20% 3.5% Banks Insurers
28
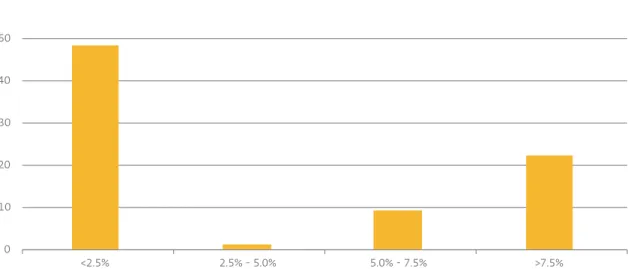
The three large Dutch banks have granted loans totalling EUR 81 billion to sectors with nitrogen-emitting activities (see figure 7).73 These sectors
account for around 39% of total lending in the Netherlands. About 60% of the EUR 81 billion concerns loans to sectors that account for less than 2.5% of Dutch nitrogen emissions through their activities. The exposure to sectors in which activities take place that are responsible for more than 7.5% of emissions, such as dairy farming, is more than EUR 20 billion.74
73 The high concentrations of compounds of nitrogen, nitrogen oxides (NOx) and ammonia (NH3) can be harmful to
humans and the environment. Nitrogen oxides are mainly emitted by traffic, power stations and industry, while emissions of ammonia mainly come from agriculture.
74 The Stall Dairy Cattle (Stallen-Melkvee) category, for which the Dutch Emission Authority records the nitrogen emissions, has been linked to the Dairy cattle breeding (Fokken van melkvee) sector. As this category covers 11% of Dutch nitrogen emissions, the sector comes within the >7.5% category in figure 7.
75 Rockström et al. (2009).
Transition risks for the financial sector can increase if other countries also take measures to limit nitrogen emissions. Excessive nitrogen emissions are not just a Dutch problem, but a worldwide issue. The disruption of the natural nitrogen cycle is one of the nine planetary boundaries that is exceeded at the global level.75
One difference between the Netherlands and other countries is that the legal ruling in the Netherlands has led to additional measures for limiting nitrogen emissions. In addition to this, the fact that various EUR billion
Figure 7 Exposure of the three large Dutch banks to Dutch sectors broken down
according to the share of total Dutch nitrogen emissions, 2017-IV*
50 60
Sources: Dutch Emission Authority, PBL, DNB 0 10 20 30 40 <2.5% 2.5% - 5.0% 5.0% - 7.5% >7.5%
* The value of the estimated loan portfolio of the three large Dutch banks to Dutch sectors is EUR 209 billion.
29 Indebted to nature: Exploring biodiversity risks for the Dutch financial sector
Natura 2000 areas are near locations with
economic activities, combined with a relatively large number of nitrogen-sensitive nature conservation areas in the Netherlands, leads more quickly to problems for biodiversity.76
For Dutch financial institutions, it is important to gain a picture of the sensitivity of their portfolio to transition risks. The economic consequences of transitions are uncertain and depend heavily on how the transition will be shaped. This can lead to risks
76 PBL (2019).
for the financial sector when these consequences are not sufficiently anticipated. With the help of two analyses, we have illustrated the exposure of the financial sector to transition risks. A relocation of business activities that are in or near protected or valuable areas may bring additional costs and, in the worst-case scenario, may jeopardise business continuity. Closer to home, the Dutch nitrogen crisis shows the consequences of an abrupt transition.
31 Indebted to nature: Exploring biodiversity risks for the Dutch financial sector
5 Reputational risks
Providing finance to companies with
activities that cause harm to the
environment leads to reputational risks
for financial institutions. We show the
extent to which financial institutions are
involved in financing companies where
environmental controversies have been
identified. Financial institutions can also
run reputational risks if the companies
that they finance provide them with
inadequate information about biodiversity
risks.
5.1 Involvement in controversial
activities
Financial institutions run a reputational risk if they finance companies that engage in controversial activities. The reputation of
institutions can be damaged, for example, if they are connected with the financing of palm oil companies whose activities contribute to deforestation and the disappearance of animal species.77 In addition,
reputational damage to companies can translate into credit and market risks for financial institutions. For example, the Deepwater Horizon oil spill in the Gulf of Mexico has so far cost the oil company BP USD 65 billion in fines, compensation and legal costs.78
77 Milieudefensie (2018). 78 Also see: Reuters (2018).
79 The dimensions that are included are Biodiversity & Land Use, Toxic Emissions & Waste, Water Stress, Operational Waste (Non-Hazardous), Supply Chain Management and Other.
80 The method is based on the approach in Section 4.4 of DNB (2019).
The number of investments in, and loans to, companies involved in environmental
controversies is an indicator for reputational risk for financial institutions. To assess the reputational risk run by financial institutions, we use the MSCI environmental controversy database. MSCI defines a controversy as an instance or ongoing situation in which a company’s products or operations allegedly have a negative environmental impact. We have only looked at the cases with a negative impact on ecosystem services or biodiversity.79 The severity of a
controversy is a function of the nature and scale of the impact (see table 1 for examples). MSCI keeps a controversy on record if the most recent
developments were less than two years ago, after which its severity rating is reduced incrementally every subsequent year.80
32
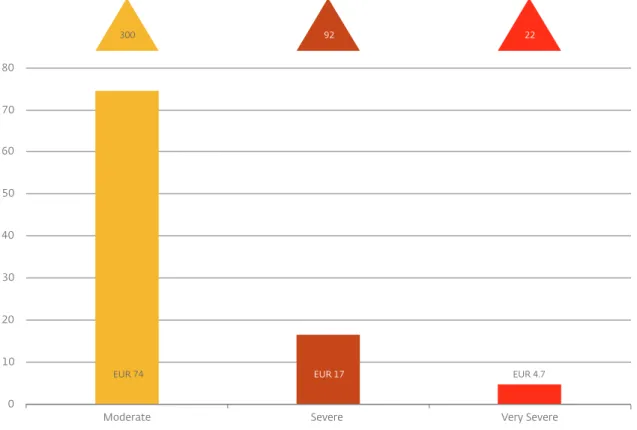
Dutch financial institutions invest in and issue loans to companies for which environmental controversies have been recorded. At the end of 2019, 414 environmental controversies had been detected at companies that had received a total of EUR 96 billion in financing from Dutch financial institutions.81 This is 14% of a total of EUR 700 billion
in financing for which data on environmental controversies are available. Businesses involved in very severe incidents receive financing worth EUR 4.7 billion from Dutch financial institutions (see table 1 and figure 8).
81 When both shares and bonds of a company appear in the MSCI controversies database, every security is counted.
As part of sound risk management, it is important for financial institutions to identify possible environmental controversies in their loan and investment portfolios and act on them. They have a variety of instruments for this purpose, such as due diligence, exclusion policy, engagement and ESG integration for analysing potential investments. Financial institutions must be transparent about the way in which they take account of ESG factors in their investment policy.
Table 1 Examples of environmental controversies by category
MSCI category Description of an environmental controversy at a company
Very severe The company owns a 50% interest in Samarco Mineracao, which operated the failing tail-ings dam. The dam failure resulted in multiple casualties and widespread environmental and property damage, particularly in the village of Bento Rodrigues. Over 600 residents were displaced, and water supplies to thousands of residents in Minas Gerais state were disrupted due to the tailings spill. Mud and mining waste from the tailings dam severely contaminated over 650 kilometres of the Doce river system, smothering fish and other wildlife downstream of the dam.
Severe In February 2018, a heavy storm in Barcarena region, state of Pará, led to the alleged over-flow of Alunorte’s basins and the leakage of water containing red mud from its bauxite tailings dam. Water samples collected by the Health Ministry’s Evandro Chagas Institute (IEC) revealed high levels of lead, sodium and aluminium due to the leakage. During the inspections, technicians also found an irregular pipe purportedly used to drain untreated stormwater to the surrounding area and ultimately flowing into the Murucupi river. Moderate In July 2019, the Driver and Vehicle Standards Agency (DVSA) of the Department of
Trans-port in the United Kingdom requested Nissan Motor Co. (Nissan) to update its Qashqai models. According to the DVSA, the company’s Qashqai diesel cars released amounts of nitrogen oxide 17 times those allowed by the EU. Nissan was criticised by environmental campaign groups for rejecting the agency’s request, as the company stated that it was concentrating its resources on improving its latest models.
33 Indebted to nature: Exploring biodiversity risks for the Dutch financial sector
Number of cases and EUR billion
Figure 8 Exposure of Dutch financial institutions to environmental
controversies, 2019-IV*
70 80
50 60
Sources: ESG Controversies product ©2020 MSCI ESG Research LLC. Reproduced with permission, DNB. 0
10 20 30 40
* The holdings in shares and bonds, as well as the major loans by Dutch financial institutions total EUR 2,332 billion. Data on environmental controversies are available for EUR 700 billion of this total.
Moderate Severe Very Severe
EUR 74 EUR 17 EUR 4.7
92 22
34 It is important that financial institutions remain committed to identifying and addressing
environmental controversies throughout the term of an investment. Finally, the DNB’s Good Practice, with guidance on integrating climate-related risks into banks’ governance, risk management and reporting, can also provide support in integrating broader environmental risks.82
5.2 Reputational damage due to
inadequate information provision
about deforestation risks
We identify the financial sector’s exposure to possible reputational risks based on the extent of information provision by companies regarding deforestation risks. Deforestation is a major factor in the loss of biodiversity and it is also one of the biggest sources of anthropogenic greenhouse gas emissions.83
Companies with products or activities that are associated with deforestation are increasingly coming under scrutiny.84 The Carbon Disclosure Project (CDP)
has developed a reporting standard in the field of deforestation. In 2019 they approached more than 1,400 companies, requesting that they fill in the reporting standard.85 Based on the results of this
reporting standard, we classified the companies according to the extent to which they can represent a reputational risk for financial institutions. We
82 DNB (2020).
83 PBL (2009), IPBES (2019a).
84 Some 80% of deforestation is caused by the expansion of agriculture, in particular due to harvesting of wood, soya and palm oil cultivation, and livestock farming. Also see: Kissinger, Herold and De Sy (2012).
85 The CDP Forests questionnaire is explained in more detail in the method document. The CDP approaches companies that use the following products in their production processes and/or their value chain: rubber, timber, soya, palm oil or livestock products.
86 The information provided by these companies may only be shared with the investors that have access to the CDP database. 87 The quality of these companies’ risk management and mitigation strategies is not examined in this report.
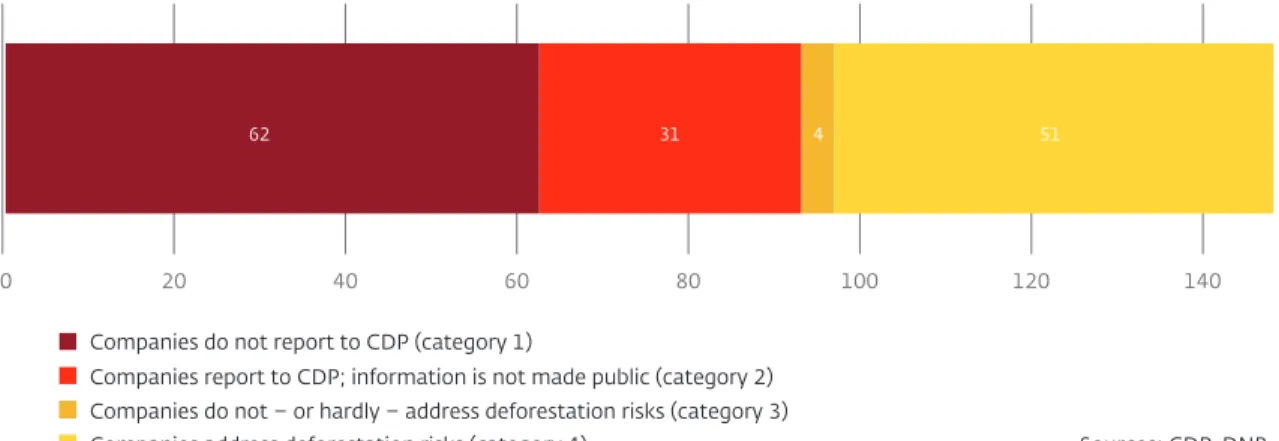
distinguish four categories (see figure 9). Companies that in all likelihood have risky products or activities in their production processes and value chain, but that do not report anything about these to the CDP, represent the highest reputational risk (category 1). Category 2 contains companies that report but do not want this information to be made public, while category 3 consists of companies that report publicly but do not or hardly address deforestation risks. Companies with risky products or activities in their production processes and value chain that take measures to address deforestation risk, represent a managed reputational risk (category 4). The exposure of Dutch financial institutions to these companies is broken down into these four categories.
The exposure of financial institutions to businesses with a heightened reputational risk totals EUR 97 billion. As shown in figure 9, this increased reputation risk is almost entirely due to companies that fail to report (EUR 62 billion) and companies that do not publish the information reported to the CDP (EUR 31 billion).86 At the other
end of the scale there is the exposure totalling EUR 51 billion to companies with a managed reputational risk. Given their activities, these companies are not unaffected by reputational risks, but they adopt measures to identify and document the risks resulting from deforestation and take action to mitigate them.87
35 Indebted to nature: Exploring biodiversity risks for the Dutch financial sector
More complete information from companies regarding their impact on biodiversity helps the financial sector to manage reputational risks. Transparency about biodiversity risks and the impact on biodiversity enables financial institutions to understand better the extent of the reputational risk and how to address it. This can result, for example, in institutions adjusting their conditions for financing, which can lead to better management of deforestation risks by companies.88 The as yet
88 There are institutions that link their financing to specific objectives. Also see: Mishra and Simons (2018). 89 CBD (2016), Van Oorschot, Sewell and Van der Esch (2018).
90 OECD (2019).
limited information provided by companies on their biodiversity risks and their impact on biodiversity is partly caused by the complexity of measuring the impact and risks and the lack of clear regulations obliging businesses to take action on these matters.89 The OECD states that additional efforts
are needed to spur companies on to address biodiversity risks as part of implementing the OECD
due diligence guidelines for responsible business
conduct.90
EUR billion
Figure 9 Exposure of Dutch financial institutions to companies with products
and activities related to deforestation, 2019-IV*
Sources: CDP, DNB Companies do not report to CDP (category 1)
Companies report to CDP; information is not made public (category 2) Companies do not – or hardly – address deforestation risks (category 3)
* The shareholdings and the large loans portfolio of Dutch financial institutions total EUR 1,030 billion. Of this, the exposure to companies from the CDP reporting standard is EUR 148 billion. Note that many companies for which we do not have reporting data do not have products and do not perform activities related to deforestation.
Companies address deforestation risks (category 4) 20
0 40 60 80 100 120 140
37 Indebted to nature: Exploring biodiversity risks for the Dutch financial sector
6 Conclusions and
recommendations
6.1 Conclusions
Biodiversity loss is a driver of financial risks. Financial institutions are exposed to physical risks when they finance economic activities that depend on ecosystem services. The decline in these ecosystem services can jeopardise business
continuity and, by extension, their financial position. In addition, financial institutions are exposed to
transition and reputational risks if companies that they
finance have a disproportionately negative impact on biodiversity. A negative impact that can be traced directly to a company results in reputational damage for the company itself as well as for the financial institutions. Government policy or changing consumer preferences aimed at reducing the damage to biodiversity require companies to undergo a transition. Timely action may require extra investment, while a delay will jeopardise business continuity.
Financial institutions have material exposures to risks resulting from biodiversity loss. First, businesses are dependent on ecosystem services for their production processes, and they run physical risks if one or more of these services are disrupted or lost. Dutch financial institutions have provided worldwide EUR 510 billion in finance to companies that are highly or very highly dependent on one or more ecosystem services. One of these ecosystem services is animal pollination. The financial sector is exposed to the amount of EUR 28 billion to products that depend on pollination.
Second, the sector finances companies that have an
impact on biodiversity. This can lead to reputational
damage to the companies involved and to the financial institutions. For example, the Dutch financial sector has worldwide EUR 96 billion of investments in, or loans to, companies involved in environmental controversies with negative
consequences for ecosystem services or biodiversity. There is additional exposure of EUR 97 billion to businesses with a heightened reputational risk resulting from products or activities related to deforestation. When a negative impact on biodiversity results in new policy or brings about changes in consumer preferences, transition risks arise. The transition to less nitrogen-intensive business models can lead to transition risks for the EUR 81 billion in loans that the three large Dutch banks have made to sectors with nitrogen-emitting activities. Furthermore, a worldwide expansion of protected nature conservation areas may mean that business activities can no longer be carried out in specific places. Financial institutions have exposure of EUR 28 billion to companies operating in areas that are protected or that might come under protection. This can have a significant impact on the risk profiles of these companies.
The multitude of ecosystem services and the many forms of biodiversity require more thorough analysis. The consequences for the financial sector of the loss of many of the existing ecosystem services have not yet been studied. In addition, there are relationships between different ecosystem services that deserve further research. In this context, there should be a special focus on the interaction between climate change and the loss of biodiversity. The expansion of protected areas and
38 the Dutch nitrogen crisis are only two examples of (possible) transitions resulting from (inter)national policy to protect biodiversity. More and better data are essential for obtaining a more complete picture of the risks for the financial sector.
6.2 Recommendations
DNB recommends that financial institutions identify the physical, transition and reputational risks resulting from the loss of biodiversity. Alongside the transmission channels analysed in this report, there are other conceivable channels through which biodiversity loss can be translated into risks for the financial sector. It is important for financial institutions to understand the extent to which and the timescale over which physical, transition and reputational risks resulting from biodiversity loss lead to financial risks and how these risks contribute to the total risk profile. Scenario analyses and stress tests can be useful here, even if there are only limited data available. Through proper due diligence, qualitative credit conditions and engagement, financial institutions can also take measures to limit their exposure to risks resulting
from biodiversity loss, for example when setting their strategy.
It is important to develop consistent and broadly applied standards for measuring and reporting on biodiversity risks. This will require the efforts of a number of parties. First, policymakers, civil society organisations and researchers need to develop an international framework with a number of
indicators to measure biodiversity risks and impact. Second, policymakers and the business community need to develop a reporting standard and ensure that companies report in accordance with this standard. Initiatives in the field of climate risks, such as the Task Force on Climate-Related Financial Disclosure (TCFD), could serve as an example in this endeavour. Due to differences in exposures to biodiversity risks for sectors, a sector-oriented approach is recommended. Third, the financial sector should make efforts to determine biodiversity risks and report on them. Better corporate reporting will help with this. Finally, supervisory authorities must ensure – for example through good practices – that financial institutions report in such a way that they produce a clear picture of their risk profile and resilience.