INTERDISCIPLINARY RESEARCH PROJECT TO EXPLORE THE FUTURE OF GLOBAL FOOD AND NUTRITION SECURITY
Assessment of global land availability:
land supply for agriculture
.
Maryia Mandryk Jonathan Doelman Elke Stehfest
FOODSECURE Technical paper no. 7 November 2015
1
Assessment of global land availability:
land supply for agriculture
Maryia Mandryk, Jonathan Doelman and Elke Stehfest
PBL Netherlands Environmental Assessment AgencyFOODSECURE Technical Working paper no. 7 November 2015
Abstract
We developed a new assessment method of the land supply for agriculture, on a grid scale basis and per region, which takes into account both biophysical, institutional and socio-economic parameters of land availability and suitability for conversion into agricultural production. In many world regions most of the available and suitable land has already been included in agricultural production. Our assessment focuses on the issue of remaining (i.e. potentially available and suitable) agricultural land per region. We first estimated the total available and biophysically suitable land by excluding areas with certain biophysical restrictions (i.e. marginally productive areas, permafrost, steep slopes, wetlands, built-up area). Secondly, we applied institutional parameters of land suitability to exclude protected areas and – in some regions – also intact forests. Thirdly, we used a suitability index to define the potentially available land that is also suitable for conversion to agricultural production from a socio-economic perspective. Subsequently, we subtracted the current agricultural land from the total available and suitable land to derive the remaining (i.e. potentially available and suitable) land per region. As well, we provided the information on the quality and suitability of the available land, based on classes of crop productivity. We also discuss the distribution of global grasslands, in both intensive and extensive agricultural systems, and the effects of this distribution on potentially available land per region.
Our results are applicable for global change analysis and modelling. Accurate estimation of agricultural land currently in use influences the possible impact on regional land use change and associated land use emissions from implementation of land-based mitigation schemes, such as REDD, or other policies (e.g. RED).
Keywords: global land reserve, agricultural area, biophysical and institutional availability
parameters
JEL codes: Q24, Q15, O13
The research leading to these results has received funding from the European Union's Seventh Framework Programme FP7/2007-2011 under Grant Agreement n° 290693 FOODSECURE. This paper is work in progress; comments are welcome. The authors only are responsible for any omissions or deficiencies.
2
1.Introduction
The quality and availability of land and water resources, together with important socio‐ economic and institutional factors, is essential for food security (FAO/IIASA 2012). Increase in global population and GDP drives a growing demand for food, feed and fiber (Bruinsma 2011; Alexandratos and Bruinsma 2012). The extra production needs will be achieved either through land expansion or intensification of existing agricultural land, and will largely depend on the amount of land that is available and suitable for cultivation (Lotze-Campen et al. 2010; Wirsenius et al. 2010; Lambin and Meyfroidt 2011; Alexandratos and Bruinsma 2012; Lambin 2012; Prieler et al. 2013; Eitelberg et al. 2014). At the same time, the perception of approaching the limit in available productive land is growing, highlighting the need for improved information on land availability (Campbell et al. 2008; Lambin et al. 2013; Eitelberg et al. 2014).
In the recent literature on global land availability different definitions of available and suitable agricultural land are found. Lambin et al. (2013) define potentially available cropland (PAC) (sometimes referred to as land reserve, underutilized, or spare land) as the moderately to highly productive land that could be used in the coming years for rainfed farming, with low to moderate capital investments, and that is neither under intensive use, legally protected, nor under intact mature forest cover. This definition excludes areas that could only be put into cultivation with major investments – e.g. irrigation or costly soil reclamation – and for which the ecological cost of conversion in terms of biodiversity and carbon storage is known to be very high – i.e. protected areas and intact or little disturbed forests. Among other criteria found in the literature, (e.g. Van Asselen en Verburg (2013)), which define areas to be excluded from potential agricultural use, are: (i) ‘very severe constraints’ regarding salt excess, nutrient
retention capacity, oxygen availability, rooting conditions or toxicities; (ii) a median slope greater than 45 degrees, (iii) a length of growing period less than 45 days on lands lacking irrigation (irrigation area less than 1%, (from Siebert et al., 2006)); and (iv) classified as urban land system.
Estimates on land availability in the literature are highly variable and debated, given the various constraints beyond biophysical suitability (Fritz et al. 2012). Besides biophysical parameters, social, political (administrative) and economic factors largely define whether land is potentially suitable for the agricultural use. One can think here of security and land tenure issues, institutional arrangements, transaction costs for land conversion, land accessibility, etc. (Lambin et al. 2013).
Current agricultural land plus the potentially available cropland are often referred to as agricultural land supply. Some of the uncertainty in assessing land availability arise from the uncertainty in land cover products, and due to different assumption used. Data
3
quality issues further complicate an accurate analysis of land availability: i.e. in many existing global land cover datasets one grid cell represents one land cover type, whereas in reality, cells often represent mosaics of different land cover/land use types. Ignoring the heterogeneity of the land cover may lead to an under-or overestimation of the actual coverage of specific land covers (Verburg et al. 2011; van Asselen and Verburg 2012). This issue is especially relevant for the agricultural land, which is characterized by a large heterogeneity of different elements: hedgerows, roads, and other infrastructural
elements; grassland and cropland of different intensity levels; wetlands. Letourneau et al. (2012) showed that heterogeneity of agricultural landscapes, including marginal land cover/land use types, often neglected in global impact assessments, is an important factor of land use to be considered in land-use change modelling.
The global availability and quality of land resources can be reflected by the land’s suitability and productivity for the cultivation of major agricultural crops (Fischer et al. 2011). Recently the most complete global assessment of potentially available and
suitable agricultural land has been performed by IIASA/FAO (2012). The results comprise spatially detailed, quantified potentials for individual crops and quality of land resources. The assessments account for population density, land requirements and feasibility of land conversion for agricultural production and market access. It excludes land from
conversion if it is protected for the following reasons: environmental, biodiversity and nature value.
The global land availability assessment requires accurate estimation of agricultural land already in use and the remaining potentially available area for agricultural production. The aim of this research is to assess land supply for agriculture, which takes into account biophysical, institutional and socio-economic parameters of land suitability and the quality and suitability of agricultural land already in use (current agricultural land). Past estimates of PAC have adopted one of the two approaches (Lambin et al. 2013):
‘‘residual approach’’– i.e. estimating the total area that is agro-ecologically suitable and then excluding cultivated areas and, in some cases, intact forests, protected areas and densely populated areas (Ramankutty et al. 2002; IIASA/FAO 2012); and ‘‘categorical approach’’ – i.e. identifying specific categories of land use/cover that could be converted to croplands (Campbell et al. 2008; Cai et al. 2010). In this study we aim at estimation of total and potentially available area for agriculture by a “residual” approach.
We developed a new assessment of the land supply for agriculture, on a grid scale basis and per region. We built a database of map-products (i.e. thematic layers), which are combined in this assessment by partially excluding grid cells with certain characteristics. Our results are applicable for global change analysis and modelling. Compared to the recent most complete assessment of land suitability by (IIASA/FAO 2012) the proposed
4
method has the following novelty aspect. Here we provide the results on how much of the available land has already been in use for agricultural production and whether the current agricultural area fully comply with the criteria used to define the potentially available cropland. We assess land availability and suitability for agricultural production with emphasis on crop productivity versus other biophysical, institutional and socio-economic parameters. We also discuss the distribution of global grasslands in both intensive and extensive agricultural systems, and the effects of this distribution on potentially available land per region.
Similarly to the assessment of IIASA/FAO (2012) we produced ready-to-use maps and land use statistics for global change analysis and modelling at global and regional levels.
2. Method 2.1 General
This study follows the residual approach to estimate global land reserve. We first estimated the total available and biophysically suitable land by excluding areas with certain biophysical restrictions (i.e. marginally productive areas, permafrost, steep slopes, wetlands, built-up area). Secondly, we applied institutional parameters of land suitability to exclude protected areas and –in some regions– also intact forests. Thirdly, we used a suitability index to define the potentially available land that is also suitable for conversion to agricultural production from the socio-economic perspective. Subsequently, we subtracted the current agricultural land from the total available and suitable land to derive the remaining (i.e. potentially available) land per region (see Figure 1 for an illustration).
Figure 1 – Schematic representation of fractions within a grid cell according to the datasets used in the assessment.
5
2.2 Datasets
The analysis is done on a grid basis and uses information from several global datasets (Table 1):
Table 1 – Datasets used in the study
Dataset Source Reference Resolution Unit
land area IMAGE 3.0 Stehfest et al. (2014) 5 arcmin Km2
slopes GAEZ IIASA/FAO (2012) 30 arcsec percentage classes wetlands GLWD Lehner and Döll
(2004) 30 arcsec Category (1-12)
permafrost GAEZ IIASA/FAO (2012) 5 arcmin Km2
built-up area HYDE 3.1 Klein Goldewijk et al.
(2011) 5 arcmin Km
2
bioreserves1 WDPA UNEP-WCMC (2005) 5 arcmin Km2
cropland and
grassland HYDE 3.1 Klein Goldewijk et al. (2011) 5 arcmin Km
2
potential (rainfed) crop yield
IMAGE 3.0 Stehfest et al. (2014) 5 arcmin Index (0-1)
1for regions Japan and Korea forest is included in bioreserves
2.3 Total available and suitable land
To estimate total available and suitable land we first excluded areas with certain biophysical restrictions for agricultural production: marginally productive areas (1); permafrost (2); steep slopes (3); wetlands (4); built-up area (5). We also excluded bioreserves (protected areas) (6), where no agricultural activities are allowed under a special status of the areas. Due to the different types of data sources, either entire grid cells with certain institutional or biophysical restrictions (case of permafrost and
marginally productive areas) or parts of a grid cell (slopes, wetlands, bioreserves, built-up area) are excluded. For slopes and wetlands we first calculated fractions per grid cell at 5 arcmin since these data were originally available at a finer resolution (30 arcsec).
1) Marginally productive areas
Marginally productive areas have been estimated based on the index of relative potential rainfed crop productivity, which relates the crop productivity in a grid cell to the global average crop productivity. The index varies between 0 and 1, and is available for eight IMAGE crop groups. We calculated an average index value from the three most
productive crops per grid cell. We excluded grid cells with the index value below a threshold of 0.1. Crop productivity is a very uncertain parameter in the availability and suitability assessment, as there is not always a direct link between this parameter and the distribution of current agricultural land. We chose 0.1 for the standard assessment, as e.g. with a 0.3 suitability threshold, 40% of Chinese agricultural land would have to be excluded from the land supply.
6 2) Permafrost
All grid cells located in areas with continuous permafrost are have been excluded from the available area, as they are considered unsuitable to sustain agriculture.
3) Steep slope areas
Per grid cell we excluded the areas with slopes larger than 45%. Comparing current agricultural area and slope maps shows that most current agricultural land is in areas with slopes less than 45%. In developed countries areas with slopes larger than 30% were also excluded as they are considered unsuitable for industrialized agriculture.
4) Wetlands
We made different assumptions on availability of grid cells with wetlands for (potential) agricultural use based on the type of wetland. If a large part of a grid cell is wetland, then the entire cell is regarded unavailable, as it is probably not worthwhile developing agriculture in such an area (infrastructure investment etc.). Therefore we excluded grid cells with fractions of wetlands 0.5-1.0. For grid cells with 0.25-0.50 fraction wetlands, the mean of the class (0.38) is assumed to be wetland. Consequently this grid cell fraction was extracted from the available area of a grid cell. For the grid cells within wetland category “lakes” we applied a fractional threshold of less than 0.1 and an extra criterion of more than two lakes per grid cell for a grid cell to be entirely excluded from the globally available land for agriculture. Fractions of “bogs and fens” were also
excluded from the grid cells under wetlands. 5) Built-up area
We excluded fractions of built-up area per cell potentially available for agriculture. 6) Bioreserves
Finally, we excluded grid cell fractions of protected areas with highly protected status. In case of bioreserves we applied an institutional rather than a biophysical constraint, since most of the protected areas are biophysically suitable for crop production. We treat bioreserves with highly protected status as not available for agriculture. In regions Japan and Korea all forest has a protected status and is therefore excluded from the land reserve.
As a result of our analysis we obtained fractions of grid cells representing areas with neither biophysical nor institutional restrictions to crop production, referred to as total available land per grid cell. We summed those fractions per grid cell within the region for those cells where rest fraction was larger than zero. Thus we implicitly overestimate the total available land.
7
Subsequently, we applied a 15% reduction in area to the estimates of total available land per grid cell to account for cell fractions that cannot be used for crop cultivation. Studies have shown that cropland estimates based on raster cells often overestimate the true amount of cropland because they do not account for infrastructure, settlements, and other areas that are unsuitable for crops at the subpixel level (Young 1999; Fritz et al. 2012; Eitelberg et al. 2014).
We used the following land productivity classes in our assessment to represent the quality of the total available land: low (0.1-0.2); medium (0.2-0.3); high (0.3-0.4); very high (>0.4). The classes are based on the index value that refers to the potential rainfed crop yield per grid cell (see also Table 1).
2.4 Socio-economic determinants of available and suitable land
The estimated total available land as calculated in section 2.3 is based on biophysical and institutional parameters exclusively. However, land might not always be attractive or feasible for conversion from a socio-economic perspective, due to, for example, an additional cost when the areas are situated remotely from the current agricultural area (Lambin et al. 2013). Doelman and Stehfest (in preparation, see section 4.2.3 in Stehfest et al. 2014) developed a suitability index that captures four different determinants for allocation of potential future agricultural land use on a grid cell level:
1. potential yield which covers effects of climate and soil (IMAGE model);
2. terrain slope index (IIASA and FAO, 2012) based on SRTM elevation data (Shuttle Radar Topography Mission) from NASA;
3. population density (Klein Goldewijk et al. 2010);
4. accessibility index from JRC (Nelson 2008), which is defined as minutes travel time to major cities (>50,000 inhabitants)
These four independent variables were used in multiple linear regression analysis to investigate the relationship between these land-use determinants and the current land use per region (fractions of crop and grassland in 2005 from (Klein Goldewijk et al. 2011). Based on the logarithmic relationship found for all independent variables except for potential crop yield, where the relation was linear, the suitability index was
calculated.
We used the suitability index to define whether estimated potentially available and suitable land would be also suitable for conversion to agricultural production from a socio-economic perspective. We assumed that the current agricultural area is situated on the suitable land, as defined by the suitability index. We selected areas within total available land per region, with the value of suitability index, where 90% of current
8
agricultural land in the region belongs to. It is implied here that the area that has not yet been converted into agricultural production should have comparable suitability index values as to the current agricultural land in the region, thus indicating its likelihood and socio-economic attractiveness for the conversion. By using the suitability index we improved the accuracy for estimation of potentially available and suitable land for agricultural production.
2.5 Current agricultural land
Following the residual approach, the estimated total available and suitable land includes the agricultural land already in use and the remaining potentially available area for agricultural production. Therefore, an accurate estimation of the current agricultural area is an important methodological step necessary to assess how much of the total available land has not yet been converted for agricultural production.
The current agricultural area in our assessment was represented by a grid-cell specific allocation of crop and grass harvested area from the HYDE 3.1 dataset (Klein Goldewijk et al. 2011). We assumed that the grid fractions with either HYDE crops or grass
comprise the current agricultural area. We applied an additional constraint for grassland, namely a productivity threshold, assuming that all marginally productive grassland areas with productivity below 0.1 value index of potential crop productivity should be excluded from current agricultural area. We subtracted grid fractions representing cropland and grassland from the fractions of total available land to estimate the remaining potentially available land.
The amount of land currently used to satisfy the demand for land-based resources has increased to occupy much of the most productive lands as well as many areas where agricultural production would normally be restricted by biophysical, institutional or socio-economic factors. As a result, current agricultural land is also situated in the areas beyond the availability and suitability parameters, described in sections 2.3 and 2.4. An example is agricultural land on very steep slopes in China (>45%). Next to this, HYDE 3.1 dataset did not account for fractions of wetlands or bioreserves when allocating (sub-) national FAO crop area statistics to grid cells.
3. Results
The results of the analysis are provided in Tables 2 and 3 and Figures 2 - 4.
We estimate the total of 53.093.114 km2 (5309 Mha)to be available for agricultural
production globally (Table 2). This includes land currently used for crop production and land that is potentially available for crop production if converted from its current state. The largest available and suitable land is found in Western Africa, USA, Southern Africa,
9
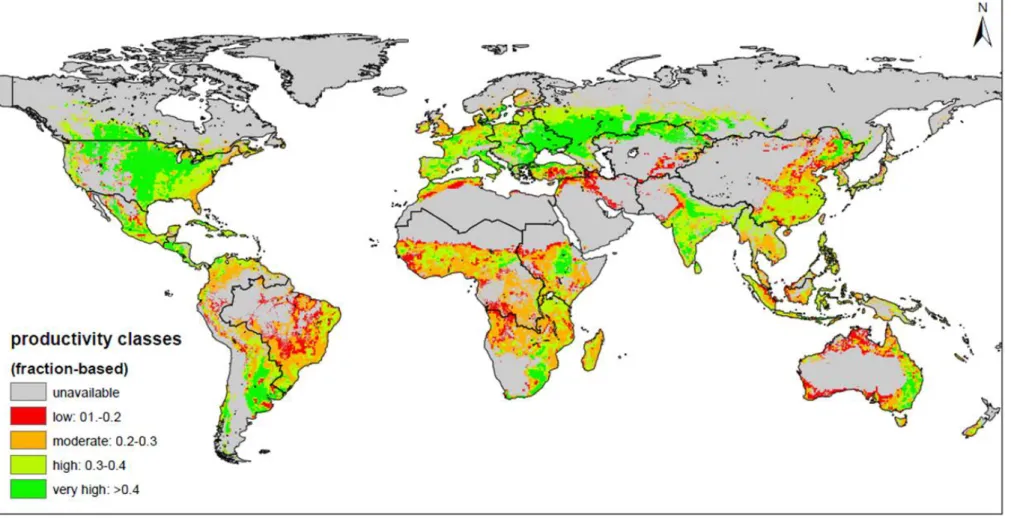
Brazil, Rest South America, and China (Table 2). In terms of the quality of the total available land, defined by the potential crop productivity, the largest reserves of best suited lands for crop production (very high productivity class) are based in the USA and Russia. In many regions (e.g. Middle East Asia, Oceania, Northern Africa, Brazil) a substantial part of the total available land - between 30 and 65% - is represented by land with a low crop productivity, which impedes efficient agricultural production (Figure 2). The regions with a high share of very productive lands are Ukraine, Central Asia (Asia-Stan region), Russia, USA and Canada (Figure 3).
Estimated total available and suitable land has already been included in agricultural production to a different extent, per region (Figure 4 and Table 3). In Northern Africa, Central Asia (Asia-Stan region) and Japan (almost) all available land is already in use for agricultural production, whereas in Indonesia, South-East Asia, Western Africa, Brazil, Rest South America, Canada and Russia there is still a large land reserve. The share of current agricultural land situated in the area beyond our availability and suitability parameters is around 10% in all regions (column 2 in Table 3). In regions Japan and Canada this share is more substantial (i.e. exceeds 20% of current agricultural land in the region), due to steep slopes (case of Japan) and wetlands (case of Canada).
Combining the results on total available and suitable land and on areas already included in agricultural production, we can conclude that expansion of agricultural area can still potentially occur on a large scale in South-East Asia, Indonesia, Western Africa, Canada and Russia. The majority of land in those regions is not yet converted into agricultural production and belongs to the moderate and high productive classes. In Brazil the
available area is of low and moderate productivity, which can potentially impede the land expansion in the region. In other world regions the future increase in agricultural
production can be expected mostly through intensification, since major part of the available and suitable land has already been converted into agricultural land.
10
Table 2 – Total available land per class of crop productivity (in km2 and as a percentage of total available and suitable land)
Total available land Classes of crop productivity
Regions low moderate high very high Total
0.1-0.2 % 0.2-0.3 % 0.3-0.4 % > 0.4 %
Canada 21.853 2 267.914 23 427.708 37 444.255 38 1.161.729 USA 218.978 4 649.847 13 1.474.822 30 2.615.059 53 4.958.705 Mexico 139.823 12 259.401 22 525.171 45 254.020 22 1.178.415 Rest Central America 1.586 0 45.712 10 296.768 62 136.171 28 480.237 Brazil 1.374.582 32 2.087.484 49 774.834 18 61.698 1 4.298.598 Rest South America 461.102 11 1.760.227 40 1.303.849 30 863.468 20 4.388.646 Northern Africa 231.739 34 247.456 36 182.640 27 25.759 4 687.594 Western Africa 1.089.246 20 3.138.743 57 1.185.285 21 110.587 2 5.523.861 Eastern Africa 568.518 17 1.640.183 50 757.782 23 333.805 10 3.300.289 Southern Africa 595.771 13 2.370.587 52 1.188.569 26 366.579 8 4.521.506 OECD Europe 91.958 4 629.801 31 963.182 47 363.986 18 2.048.928 Eastern Europe 33.202 3 119.507 12 549.461 55 296.880 30 999.051 Turkey 146.359 24 156.106 26 196.454 32 112.910 18 611.829 Ukraine region 496 0 7.478 1 96.071 14 567.170 84 671.215 Asia-Stan 272.974 21 161.027 13 196.888 15 639.622 50 1.270.511 Russia region 129.150 4 395.845 11 1.258.225 36 1.743.593 49 3.526.813 Middle East Asia 370.832 67 143.917 26 32.659 6 5.318 1 552.726 India region 214.482 8 465.854 17 1.443.305 53 601.751 22 2.725.392 Korea 10.426 14 24.772 33 22.344 30 17.088 23 74.630 China region 874.360 21 1.334.793 32 1.822.161 43 188.561 4 4.219.875 South East Asia 51.110 3 725.477 47 760.260 49 7.930 1 1.544.777 Indonesia region 132.291 9 688.872 49 556.206 39 42.100 3 1.419.469 Japan 7.212 14 14.086 28 25.384 50 3.788 8 50.469 Oceania 1.108.938 39 1.013.541 35 507.920 18 247.449 9 2.877.848 Total 8.146.987 15 18.348.632 35 16.547.947 31 10.049.548 19 53.093.114
11
Figure 2 - Total available land per class of crop productivity (as a percentage of total available land
12
Figure 3 – Productivity classes of total available land. The classes are defined by the index value that refers to the potential rainfed crop yield per grid cell
13
Table 3 – Percentage of total available and suitable land already in use, total current agricultural land, and percentage of current agricultural land situated in areas which are estimated as not being available or suitable
Regions Current agricultural land Current agricultural land located at unavailable or unsuitable areas [%] Current agricultural land area, [km2] share of current agricultural land in total available and suitable land [%] Canada 21 673.961 58 USA 15 3.634.462 73 Mexico 10 787.589 67
Rest Central America 11 325.809 68
Brazil 7 2.533.921 59
Rest South America 9 2.502.389 57
Northern Africa 19 650.487 95 Western Africa 8 3.134.424 57 Eastern Africa 12 2.536.328 77 Southern Africa 10 2.711.564 60 OECD Europe 9 1.388.428 68 Eastern Europe 8 667.212 67 Turkey 7 407.127 67 Ukraine region 9 526.495 78 Asia-Stan 12 1.179.747 93 Russia region 7 2.141.801 61
Middle East Asia 10 399.069 72
India region 9 2.128.998 78
Korea 10 46.845 63
China region 15 3.351.039 79
South East Asia 5 648.378 42
Indonesia region 5 491.592 35
Japan 43 50.469 100
Oceania 12 1.986.389 69
TOTAL 16 34.904.526 66
4.Discussion
In this paper we assess total area available and suitable for agricultural use, and estimate the area still available for agricultural expansion. In this assessment, we subsequently addressed the following issues:
1. Estimation of total available and suitable land for agricultural production, based on three sets of availability and suitability parameters:
a) Biophysical b) Institutional c) Socio-economic
2. Estimation of current agricultural land, including land beyond availability and suitability parameters
3. Estimation of rest suitable and available land, potentially available for conversion into agricultural production
In each of the steps we had to deal with uncertainties arising from the assumptions made in the method and - in some cases - with inconsistencies of the data sources.
Total available and suitable land
We compared our results on total available land for agriculture with the suitable areas as provided in the assessment of FAO-GAEZ (2012). Land supply estimates from FAO-GAEZ (2012) have been used for global integrated assessment modelling, including those performed by the modelling framework of GLOBIOM (e.g. Havlik et al. 2011). Since GAEZ land suitability statistics are either available per individual crop or per management level, the comparison could not have been performed in absolute terms. We chose winter wheat (intermediate input level, rain-fed) to have a first impression of how close our results are to the estimates from FAO-GAEZ. Naturally, those comparisons are only relevant for the regions, where areal of winter wheat strongly corresponds to the total suitable area. For regions Asia-Stan, Eastern Europe and USA our estimations are 2 to 5 % less area than those of FAO-GAEZ. For OECD Europe we exceed the FAO-GAEZ
estimations of suitable land by 10%. The only large deviation is in Canada, where we estimate 82% less area available for agricultural production based on suitability for winter wheat cultivation. The land supply assessment method of FAO-GAEZ (2012) largely depends on where you put a threshold on the management level, especially for marginally suitable lands. It is therefore almost impossible to make an absolute
estimation of potentially available land per region, given a large uncertainty on the requirements and definition of a management level threshold.
According to the range of results on potentially available cropland reported in a recent review paper of Eitelberg et al. (2014), we produced the highest estimates of total available land for agriculture (exceeding the previous highest reported result of Havlik et al. (2011) by 3%). Since Havlik at al. (2011) focused on potentially available land for cultivation of short rotation tree plantations (biofuels), they used the thresholds of tree growth for estimation of area potentials for biomass plantations and therefore
underestimated potentially available land for crop production.
Studies that estimated global land reserve according to the categorical approach (Campbell et al. 2008; Cai et al. 2010), focused on particular land use and land cover categories, i.e. forest and grassland, without checking where the forest or grassland is located. In this research, we added the availability and suitability parameters –
biophysical, socio-economic and institutional – and therefore we produced more accurate estimates of the total land reserve.
Current agricultural land
Our results on current agricultural land already in use are sensitive to the assumption to exclude marginal grassland areas from the land reserve. If we had included marginal grasslands as part of current agricultural area, we would have obtained a larger land reserve in some regions, e.g. China (see Appendix 1). This, in turn, would also influence the land supply as provided by the IMAGE model to MAGNET model (Figure 5).
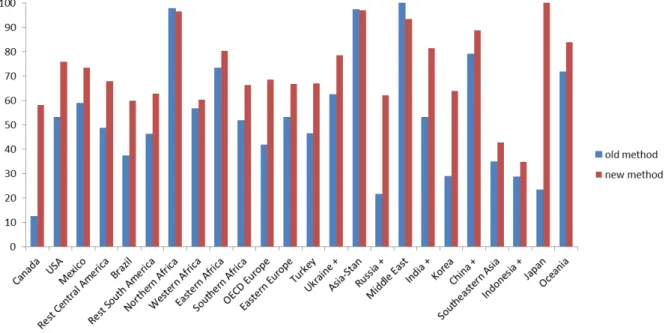
Figure 5 – Revised estimates of the share of land supply already in use
Note: Share of land supply already in use according to the method applied in IMAGE 2.4 (Bouwman et al. 2006), and the new method presented here, for IMAGE 3.0 (Stehfest et al. 2014). Mostly as a result of the improved estimation of total available and suitable agricultural area (the land supply), the percentage of the land supply already in use has changed.
Until 2013 the land supply as provided by the IMAGE model (IMAGE 2.4, Bouwman et al. 2006) generally resulted in underestimation of available land for agricultural production in several regions, especially in Canada and Russia (Figure 5). In Japan and Korea, in contrast, the institutional aspect of protected forests had not been taken into account previously. Therefore, almost 70% of land in those regions had been treated as available for agricultural production. In the new method we show that there is no land reserve in Japan and only 35% available for conversion to agricultural land in Korea.
Due to a certain overlap between land use classes in different datasets we may have situations when certain grid cell fractions belong to different land use classes at the same time. For example, there are overlaps between wetlands and protected areas. Currently, HYDE 3.1 dataset is being revised and the new version of HYDE will include areas of wetlands and steep slope areas per grid cell, thus in many cases certain grid fractions will not be double counted when using wetlands dataset from a different source than that of crops and grassland areas.
Rest suitable and available area and implications for global food security
In general, expansion of agricultural area can still potentially occur on a large scale in South-East Asia, Indonesia, Western Africa, Canada and Russia. The majority of land in those regions is not yet converted into agricultural production and belongs to the
moderate and high productive classes. In Brazil the available area is of low and moderate productivity, which can potentially impede the land expansion in the region. In other world regions the future increase in agricultural production can be expected mostly through intensification, since major part of the available and suitable land has already been converted into agricultural land.
Some studies report that agricultural land area is expected to stabilize by 2050 at roughly 10 percent above the 2010 level: growth in agricultural output mainly relies on technological progress and capital accumulation (Lanz et al. 2014).
According to Alexandratos and Bruinsma (2012) it is often not very relevant to speak of global numbers concerning abundance or scarcity of land resources. Countries that face land scarcities and would need to expand food supplies will not necessarily have access to the productive potential of these lands. This constraint can lead to increased trade or, as recent experience has shown, to investments in land where this is abundant or
eventually to migration. These are not very promising prospects for poor and food-insecure countries with high demographic growth and scarcity of own land and water resources. Thus, local resource scarcities will likely continue to be a major constraint in the quest for achieving food security for all.
References
Alexandratos, N. and J. Bruinsma (2012). World agriculture towards 2030/2050: the 2012 revision. ESA Working paper No.12-03. Rome, FAO.
Bouwman, A., T. Kram and K. Klein Goldewijk (2006). Integrated Modelling of Global Environmental Change: an overview of IMAGE 2.4. PBL Netherlands
Bruinsma, J. (2011). The resources outlook 2050: by how much do land, water and crop yields need to increase by 2050? . Looking ahead in world food and agriculture: Perspectives to 2050. P. Conforti. Rome, FAO.
Cai, X., X. Zhang and D. Wang (2010). "Land Availability for Biofuel Production." Environmental Science & Technology 45(1): 334-339.
Campbell, J. E., D. B. Lobell, R. C. Genova and C. B. Field (2008). "The Global Potential of Bioenergy on Abandoned Agriculture Lands." Environmental Science &
Technology 42(15): 5791-5794.
Eitelberg, D. A., J. van Vliet and P. H. Verburg (2014). "A review of global potentially available cropland estimates and their consequences for model-based
assessments." Global Change Biology.
Fischer, G., E. Hizsnyik, S. Prieler and D. Wiberg (2011). Scarcity and abundance of land resources: competing uses and the shrinking land resource base. SOLAW
Background Thematic Report - TR02, FAO.
Fritz, S., L. See, M. van der Velde, R. A. Nalepa, C. Perger, C. Schill, I. McCallum, D. Schepaschenko, F. Kraxner, X. Cai, X. Zhang, S. Ortner, R. Hazarika, A. Cipriani, C. Di Bella, A. H. Rabia, A. Garcia, M. y. Vakolyuk, K. Singha, M. E. Beget, S. Erasmi, F. Albrecht, B. Shaw and M. Obersteiner (2012). "Downgrading Recent Estimates of Land Available for Biofuel Production." Environmental Science & Technology 47(3): 1688-1694.
Havlík, P., U. A. Schneider, E. Schmid, H. Böttcher, S. Fritz, R. Skalský, K. Aoki, S. D. Cara, G. Kindermann, F. Kraxner, S. Leduc, I. McCallum, A. Mosnier, T. Sauer and M. Obersteiner (2011). "Global land-use implications of first and second
generation biofuel targets." Energy Policy 39(10): 5690-5702.
IIASA/FAO (2012). Global Agro-ecological Zones (GAEZ v3.0). IIASA, Laxenburg, Austria and FAO, Rome, Italy.
Klein Goldewijk, K., A. Beusen and P. Janssen (2010). "Long-term dynamic modeling of global population and built-up area in a spatially explicit way: HYDE 3.1." The Holocene 20(4): 565-573.
Klein Goldewijk, K., A. Beusen, G. van Drecht and M. de Vos (2011). "The HYDE 3.1 spatially explicit database of human-induced global land-use change over the past 12,000 years." Global Ecology and Biogeography 20(1): 73-86.
Lambin, E. F. (2012). "Global land availability: Malthus versus Ricardo." Global Food Security 1(2): 83-87.
Lambin, E. F., H. K. Gibbs, L. Ferreira, R. Grau, P. Mayaux, P. Meyfroidt, D. C. Morton, T. K. Rudel, I. Gasparri and J. Munger (2013). "Estimating the world's potentially available cropland using a bottom-up approach." Global Environmental Change
23(5): 892-901.
Lambin, E. F. and P. Meyfroidt (2011). "Global land use change, economic globalization, and the looming land scarcity." Proceedings of the National Academy of Sciences
108(9): 3465-3472.
Lanz, B., S. Dietz and T. Swanson (2014). "Global population growth, technology, and malthusian constraints: a quantitative qrowth theoretic perspective." Research paper 25. The Graduate Institute Geneva.
Lehner, B. and P. Döll (2004). "Development and validation of a global database of lakes, reservoirs and wetlands." Journal of Hydrology 296(1–4): 1-22.
Letourneau, A., P. H. Verburg and E. Stehfest (2012). "A land-use systems approach to represent land-use dynamics at continental and global scales." Environmental Modelling and Software 33: 61-79.
Lotze-Campen, H., A. Popp, T. Beringer, C. Müller, A. Bondeau, S. Rost and W. Lucht (2010). "Scenarios of global bioenergy production: The trade-offs between agricultural expansion, intensification and trade." Ecological Modelling 221(18): 2188-2196.
Nelson, A. (2008). Travel time to major cities: A global map of Accessibility. Global Environment Monitoring Unit. Ispra, Italy. Available
at http://gem.jrc.ec.europa.eu/, Joint Research Centre of the European Commission.
Prieler, S., G. Fischer and H. van Velthuizen (2013). "Land and the food–fuel
competition: insights from modeling." Wiley Interdisciplinary Reviews: Energy and Environment 2(2): 199-217.
Ramankutty, N., J. A. Foley, J. Norman and K. McSweeney (2002). "The global
distribution of cultivable lands: current patterns and sensitivity to possible climate change." Global Ecology and Biogeography 11(5): 377-392.
Stehfest, E., D. Van Vuuren, T. Kram, L. Bouwman, R. Alkemade, M. Bakkenes, H.
Biemans, A. Bouwman, M. den Elzen, J. Janse, P. Lucas, J. van Minnen, M. Mueller and A. Prins (2014). Integrated Assessment of Global Environmental Change with IMAGE 3.0. Model description and policy applications, The Hague. PBL The
Netherlnands Environmental Assessment Agency.
UNEP-WCMC (2005). World database on Protected Areas. www.unep-wcmc.org/wdpa/. van Asselen, S. and P. H. Verburg (2012). "A Land System representation for global
assessments and land-use modeling." Global Change Biology 18(10): 3125-3148. Van Asselen, S. and P. H. Verburg (2013). "Land cover change or land-use
intensification: Simulating land system change with a global-scale land change model." Global Change Biology 19(12): 3648-3667.
Verburg, P. H., K. Neumann and L. Nol (2011). "Challenges in using land use and land cover data for global change studies." Global Change Biology 17(2): 974-989. Wirsenius, S., C. Azar and G. Berndes (2010). "How much land is needed for global food
production under scenarios of dietary changes and livestock productivity increases in 2030?" Agricultural Systems 103(9): 621-638.
Young, A. (1999). "Is there Really Spare Land? A Critique of Estimates of Available Cultivable Land in Developing Countries." Environment, Development and Sustainability 1(1): 3-18.
APPENDIX
Appendix 1 – Current agricultural land (km2) and percentages in use – an approach
including marginal grasslands in land reserve
Regions Current agricultural land already in
use (% of total available
land)
area, km2 availability beyond
parameters, %
Canada
58
675,120 21USA
76
4,149,349 23Mexico
73
1,073,290 27Rest Central America
68
325,857 11Brazil
60
2,637,290 10Rest South America
63
3,164,069 20Northern Africa
96
1,007,789 47 Western Africa60
3,628,645 16 Eastern Africa80
3,094,154 25 Southern Africa66
3,544,796 24 OECD Europe68
1,430,973 11 Eastern Europe67
667,212 8 Turkey67
413,644 8 Ukraine region78
526,495 9 Asia-Stan97
2,834,548 62 Russia region62
2,257,156 10Middle East Asia
93
2,165,187 79India region
81
2,613,372 23Korea
64
49,225 13China region
89
6,878,955 53South East Asia
43
669,101 6Indonesia region
35
491,743 5Japan
100
51,200 43This project is funded by the European Union under the 7th Research Framework Programme (theme SSH) Grant agreement no. 290693
The FOODSECURE project in a nutshell
Title FOODSECURE – Exploring the future of global food and nutrition security Funding scheme 7th framework program, theme Socioeconomic sciences and the humanities Type of project Large-scale collaborative research project
Project Coordinator Hans van Meijl (LEI Wageningen UR)
Scientific Coordinator Joachim von Braun (ZEF, Center for Development Research, University of Bonn) Duration 2012 - 2017 (60 months)
Short description In the future, excessively high food prices may frequently reoccur, with severe impact on the poor and vulnerable. Given the long lead time of the social and technological solutions for a more stable food system, a long-term policy framework on global food and nutrition security is urgently needed.
The general objective of the FOODSECURE project is to design effective and sustainable strategies for assessing and addressing the challenges of food and nutrition security.
FOODSECURE provides a set of analytical instruments to experiment, analyse, and coordinate the effects of short and long term policies related to achieving food security.
FOODSECURE impact lies in the knowledge base to support EU policy makers and other stakeholders in the design of consistent, coherent, long-term policy strategies for improving food and nutrition security.
EU Contribution € 8 million
Research team 19 partners from 13 countries
FOODSECURE project office
LEI Wageningen UR (University & Research centre) Alexanderveld 5
The Hague, Netherlands
T +31 (0) 70 3358370 F +31 (0) 70 3358196 E foodsecure@wur.nl I www.foodscecure.eu