Spatial policy needs demographic analysis Inaugural Lecture1 By Dorien Manting September 2014
1 This is an English translation of the Dutch spoken inaugural lecture ‘Ruimtelijk beleid kan niet zonder demografische analyse”, that was held at the acceptance of the position of Special Professor of Population Dynamics and Spatial Developments at the University of Amsterdam, Friday 1 November 2013. Translation by Annemieke Righart.
2
Madam Rector, Dean, members of the board of trustees of the chair of Population Dynamics and spatial developments, colleagues, friends, familyi,
Welcome on this special occasion. I am very happy to officially accept, in your presence, the position of special professor at the University of Amsterdam.
The last time I stood in the auditorium of the University of Amsterdam on this exact spot was nearly twenty years ago. At that time, I was defending my doctoral research on cohabitation (Manting, 1994).
At the time of my doctoral research, cohabitation was regarded an alternative; a first step in building a relationship, as a trial period for marriage. Many people regarded cohabitation inappropriate and, therefore, skipped this step. A small group of people considered cohabitation as a permanent alternative for marriage (Manting, 1994, 1996).
The fact that cohabitation was seen as a different form of living together was also apparent from the way the media spoke about it. They used to refer to it as ‘shagging’ instead of cohabitation. This has since changed; that term is not heard any longer. Research into this subject was still in its infancy, twenty years ago. I used to think it was exciting and motivating, as I generally like conducting innovative research. Over the coming years, at the University of Amsterdam, I intend to focus on other, new research subjects. Research that centres around the spatial consequences of demographic behaviour, more specifically from the perspective over the entire course of life. From there, I will zoom in on traffic mobility and urban population developments and the interaction between the two.
Hence the title of my inaugural lecture ‘Spatial policy needs demographic analysis’. On reading the title, some people will think they know this already, while in others it may spark an interest. You may ask ‘Why? Does demographic research allow any room for discussion?’ The answer is both yes and no. Let’s begin with the no. The value of demographic prognosis, the demographic toolkit used for unravelling period, age and cohort effects, and research into demographic developments certainly are not up for discussion. However, there is also a yes; demography is debatable, as sometimes we find it difficult to believe the results from analyses, or we underestimate the power of population changes, and at other times we omit a certain dimension. I will address each of these three aspects.
Demographic analysis: disbelief, underestimation and the forgotten
dimension
Sometimes, we do not believe the results presented to us. This has been our experience, at times, with population prognoses at PBL Netherlands Environmental Assessment Agency. Although the numerous population prognoses carried out in our country are used by many, there is also much discussion on the subject. When
3
in 2006 Van Dam and other researchers published their research into the consequences of demographic shrinkage, many local administrators considered shrinkage of their municipality as inconceivable (Van Dam et al., 2006). Today, only seven years on, shrinkage is no longer disputed, and the focus has shifted towards dealing with its spatial consequences. Indeed, today it is the incidence of growth in certain parts of the Netherlands that is being met with disbelief (will the Randstad really grow by thát much in the coming 30 years?).
The disbelief is also being caused by the crisis. People wander, for example, if prognoses take this fact sufficiently into account. A crisis is an example of a period effect. Demographers, time and again, conclude that crises often lead to postponement but not to abandonment. Residential mobility, divorce, or even having children are some of the things that are postponed in times of economic downturn (De Beer, 2012), but that are subsequently taken up again following economic recovery. Therefore, I think that particularly those that carry out demographic prognosis are very aware of period effects, in addition to age and cohort effects.
Prognoses regularly do not come true. After all, responses to those prognoses may also prevent them from coming true. This thus does not mean that they were incorrect. Their value lies in the fact that they point to future trends. Good prognoses, however, do take cohort, age and period effects into account.
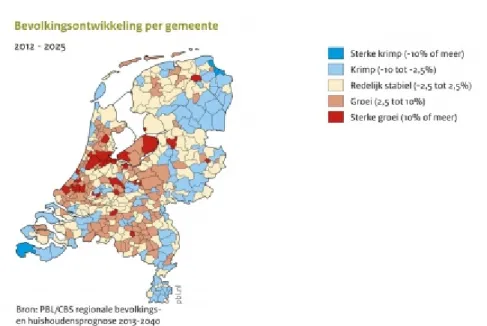
After this introduction I feel no qualms about presenting you with the expected developments up to 2025, according to the PBL and CBS prognosis (Huisman et al., 2013).
Figure 1. Changes in population size per municipality in the Netherlands, 2012–2025 ii
The more red in a certain area, the greater the population growth, according to the PBL-CBS prognosis of 2013 (figure 1). Growth particularly will take place around the Randstad and in the large cities of the Netherlands. And the more blue in a certain area, the greater the amount of shrinkage. The latter is believed to take
4
place, up to 2025, particularly in the Dutch border regions and in the smaller municipalities.
To be clear: despite the marginal notes to future population developments, these population prognoses are used extensively in the Netherlands. In short, it is not the importance of demographic prognoses to spatial policy that is up for discussion, but sometimes rather their outcomes.
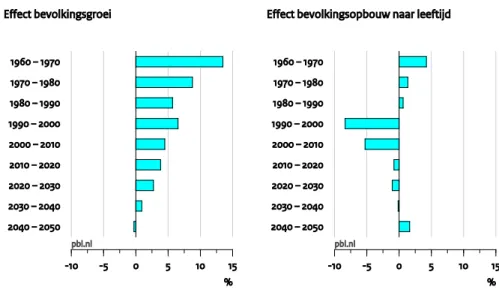
Furthermore, at times, we do not realise the severity of population changes. When recently, at PBL, we researched the consequences of the aging population for spatial developments of aging, we were surprised by the impact of the aging of the large baby-boom generation. Here, I show you an example taken from an analysis by De Groot of the impact of residential mobility on developments in population size and composition (PBL, 2013).
Figure 2. Changes in residential moves per decade, distinguishing between the effect of population size (left) and composition (right)
The left panel of figure 2 shows how the increasing population drove up the residential mobility for decades, but also how the impact of this will decrease in the future – and, ultimately, will even be reversed. The surprising element, however, is in the right-hand panel of the figure, as that shows how the composition of the population already in the 1990s slowed down this residential mobility. This could subsequently be explained by the post-war, baby-boom generation reaching a certain phase in life in which they moved much less often. Before then, from the 1960s onwards, the ‘family formation phase’ of this large generation caused a wave of residential moves. In about 15 years, the outflow of this generation will cause another, somewhat smaller, wave in residential mobility, according to PBL researchers (Eskinasi, 2012; PBL, 2013). Changes to population composition are gradual and thus sometimes go unrecognised. As the previous point indicates, policymakers – when concerned about a decline in residential mobility – must realise that part of the change is structural, autonomous and for the largest part cannot be reversed. This example also shows that demographic analyses, in this case
5
of the effect of changes in population size and composition in population developments, are important for spatial developments and spatial policy.
These examples belong to the more traditional way of conducting demographic analyses, and play a role in the explanation of spatial developments. Here, I would like to discuss the importance of another method of demographic analysis, namely that of demographic and spatial research from a life-course perspective.
According to Majer and Tuma, the core of life-course research is the study of mutually coherent individual processes that taken place throughout people’s lives, over historical periods (Mayer and Tuma, 1990). And to add another complication: according to Runyan (1984) – and I agree, part of the core of life-course research is the study of the impact of earlier life-course events on things that happen in the later course of life. Demographic research from a life-course perspective involves the study of order, timing and frequency of demographic events, such as leaving home, relationships, divorce and starting a family. My ambitions are not so much in analysing the demographic course of life itself, but rather in analysing the spatial consequences of changes to the demographic course of life. This also concerns the remainder of my oration; the importance of developments in demographic events to spatial developments; in particular, to the developments of transport mobility and urbanisation. Today, I will limit this to the importance of changes in the timing of a demographic event: that of having a child. In the coming years, my research will also focus on the impact of other demographic events, such as that of leaving home, on spatial developments.
The transition period from childhood to adulthood
The timing of demographic events, in addition to frequency and order of such events, is central to a certain period in the course of people’s lives, known in the world of demographics as the transition period from childhood to adulthood. This transition period has changed so much over the course of time that demographers such as Billari and Liefbroer (2010) speak of a period that has become ever more complex and more lengthy, and that comes to a close increasingly later in life. They illustrate this for several countries, including the Netherlands. Their analysis shows that this phase both starts earlier and lasts longer. It begins when young people leave home. That age at which half of all Dutch women leave their parental home has moved from 23 for women born in the 1930s to 20 for the generation of the 1970s. The age at cohabitation is also going down; between these generations of women, this type of event has moved from the age of 24 to 22. Other data from the study by Billari and Liefbroer on other types of transitions show that these, in fact, have slowed. The age at which half of the women have their first child has gone up: this was 25 for those born in the 1930s and 30 for the generation of the 1970s. For marriage the age has moved up even further. One of the consequences of all these developments is that the transition period from childhood to adulthood – conform the demographic definition of Billari and Liefbroer (2010) –
6
has extended to beyond people’s 30th birthday. After all, in the Netherlands, many women do not have their first child until well into their thirties.
Timing is only one of the things that have changed. Others are order and frequency. For example, people marry increasingly often after their children are born, instead of before. These developments have been taking place for a long time already. In the mid 1980s, Lesthaeghe and Van de Kaa (1986) already concluded that these changes were being caused by a multitude of cultural, socioeconomic and technological changes. Examples are individualisation, emancipation, increasing prosperity, and the introduction of the contraceptive pill. Their theory – in the world of demographics known as the Second Demographic Transition – has inspired many demographers, both national and international. Latten and Mulder (2012) recently found that developments in the Netherlands pointed to the continued validity of the theory of the Second Demographic Transition. This theory also played a role in my earlier research, at which time the extension of the transition period was also obvious (Manting et al., 1992). Mulder and Manting (1994), at the time, found that a growing number of people had been developing a strategy for postponing in particular the irreversible changes, such as having children. In a recent episode of the Dutch programme Tegenlicht (VPRO, 2013), a woman called Sarah describes the extension of her transition from childhood to adulthood. In the documentary, she said, among other things: ‘Yes, I think that nowadays you can be young for as long as you like. You can postpone choices longer than ever before, and I see many people approaching forty, still wondering whether they want children and about what they truly want to do with their lives’. I expect that Sarah’s observations on her generation – postponing demographic events, in particular the ‘irreversible’ events – will also lead to postponement of behaviour that impacts spatial development.
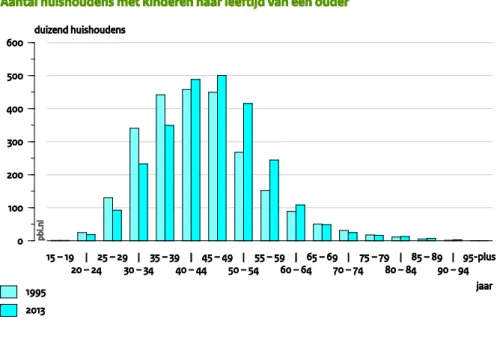
Below, I illustrate the importance of demographic analysis for spatial policy by discussing the consequences of postponing childbirth for developments in transport mobility and urban populations. This does not mean that I consider other demographic changes over the life course to be unimportant in explaining spatial developments, but this choice is made because of time constraintsiii. Before I enter into the spatial consequences, I first would like to elaborate on the postponement of having children. This, logically, leads to increasing numbers of young adults not living as a family. This is reflected in the figure below, based on CBS dataiv. Among young adults under the age of twenty, the number of households with children is negligible.
7
Figure 3. Number of households with children per age of the mother (in thousands)
Major changes can be seen over the course of less than twenty years (figure 3). Not only the number of households with children has become lower among people in their twenties, but so has the number of families among those in their thirties, whereas this number has increased strongly among people in their forties and fifties. This means that, when we compare young adults of today with those of just before the turn of the century, this concerns a group of people who currently hardly live as a family, while before they did so much more often. Because families usually have different spatial behavioural patterns, compared to people living alone, that also means that people in their twenties and thirties currently behave differently from a spatial perspective than in the past; simply because they have no children. I believe that the postponement of starting a family is an often forgotten factor in the study of spatial developments. Below, I present two examples of this fact.
Transport mobility and postponing childbirth
Take the studies that attempt to explain the decline in automobility. Many transport researchers are currently wondering whether this decline is structural or temporaryv. Is it a case of substitution, of people taking bicycles, trains or aeroplanes rather than motorised vehicles, or is it a sign of something else? Automobility had begun to decline in many countries in various parts of the world, just before the onset of the economic crisis (IFMO, 2013; Le Vine and Jones, 2012). This widespread decline is receiving much attention among transport researchers. On the one hand, because – according to my expectation – shrinkage is a phenomenon that is alien to this domain; on the other hand, because it has many consequences for investments in infrastructure and for the environment. The Netherlands is also experiencing a decline in automobility, although the preferred term here is that growth is levelling off (KIM, 2012). Automobility peaked in 2005.
8
Transport researchers are of the opinion that – in addition to demographic developments such as ageing or urban population growth – social, economic, technological and transport-specific factors are responsible for the decline. Particular attention is paid to automobility among young people, as this has been declining for some time now, in the Netherlands as well as in many other countries. No unambiguous conclusions can be drawn yet, as the research in this field has only just begun. Some think that the frequent use of ICT among young people offers an explanation for the decline in mobility, because it competes with car driving, or they assume the decline is being caused by the fact that owning a car is less prestigious than it used to be, or because young people today are more environmentally friendly. Other believe it is due to the uncertain economic circumstances that young people are faced with in many countries (KIM, 2012; Kuhnimhof et al., 2012; Le Vine and Jones, 2012; Metz, 2013). What is seen as another cause of the decline is the increase in the number of young people living in cities, where cars are not always the most suitable mode of transport.
The study into the decline in automobility among young people, however, is still in its infancy. It is a discussion predominantly among traffic experts. The influence of changes in the demographic course of life is only rarely addressed. Some researchers mention the impact of having children on mobility (IFMO, 2013; Kuhnimhof et al., 2012; Lanzendorf, 2010; Le Vine and Jones, 2012; Metz, 2013), but only a few really study this impact (e.g. Lanzendorf, 2010). Above, I concluded that young adults less often have children, and I believe that the postponing childbirth among this age group is a valid additional explanation for the decline in automobility. At this time, I am unable to underpin my hypothesis about the postponement of demographic behaviour with sufficient amounts of empirical longitudinal results. Such empirical results are predominantly available only on a cross-sectional and an aggregate level, not on the individual level that is required for conducting a life-course analysis.
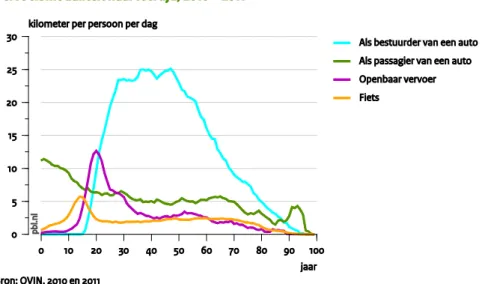
Aggregate data indicate that childlessness is responsible for a decline in automobility among young adults. Firstly, CBS data show that families use and own a car much more often than childless couples or people living alone (Beuningen et al., 2012). Breadwinners not only use the car for their own transportation, but also to take their children to crèches, school or sports. The Netherlands Institute for Social Research (SCP) paints a clear picture of the way in which parents attune their transport movements between home, work and school (Van der Klis, 2013). In particular, the fathers use a car to do so, according to the SCP. Incidental studies have found that the birth of a child indeed leads to more car use and car ownership (Lanzendorf, 2010); in other words, postponement of starting a family leads to a decline in automobility among young adults. I cannot yet prove this point using life-course analyses for the Netherlands, but the following figures do point to this outcome. The data are based on an analysis by Hilbers (PBL, 2013) and show that bicycles are popular among teenagers, public transport is common among people in their twenties, and that particularly those in their thirties, forties and fifties use cars (figure 4).
9
Figure 4. Means of transportation, per age, 2010–2011vi
This last group, as indicated earlier, contains the families. The fact that men in particular use the car to transport their children, in combination with the decline in automobility occurring particularly among young men, is a further indication of postponing childbirth being an important explanation for the decreasing level of car use by young adults. The figure above unfortunately is only a snapshot in time, therefore it does not reflect the changes between age groups over time in history, or between generations. During my inaugural lecture, I used pictures I took on my holidays over the years – not shown here – to show how my mode of transport changed according to my personal demographic life course.
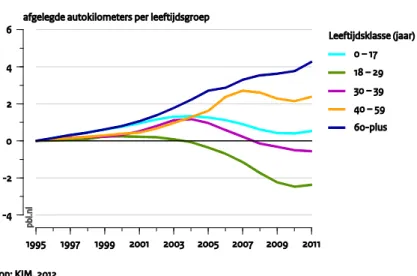
In summary, from the perspective that there are increasingly fewer families among people in their twenties, and these days even in their thirties, it stands to reason that automobility among these age groups has been declining. Equally logical is the assumption that automobility increases among people in their forties and fifties, as these groups contain the highest numbers of families. And this is precisely what can be seen in the data from KiM Netherlands Institute for Transport Policy Analysis, which show that, recently, automobility has been decreasing among those in their twenties and increasing among people over the age of forty (figure 5). These data were obtained from and published by KiM (KiM, 2012), and corrected for changes in numbers per age group (also by KiM).
10
Figure 5. Changes in automobility per age group, relative to 1995
This I consider to be the first evidence of postponement of family formation having an impact on automobility. However, as this concerns an analysis of aggregated data, cause and effect cannot easily be separated. Transport researchers, for example, believe that urbanisation has led to a decline in automobility. But the exact opposite may be true. For instance, research by Karsten (2003) shows that families deliberately choose to live in the city, because then employment, schools and leisure activities are all close by. This would point to urbanisation being the result of changes in automobility rather than the other way round. And the declining automobility among young adults, thus, is not only caused by them delaying childbirth, but also by changes in lifestyle. If this postponement is the main ingredient, then there would be a structural lower automobility among young adults and a higher level of automobility among people in their forties and fifties. However, if behavioural changes are the main cause, this could lead to a declining automobility also for future generations. These two possible causes have different consequences for future investments in infrastructure and for projections of the environmental impact of transport.
The degree to which the postponement of family formation and possibly also other demographic life-course changes really explain the declining mobility among young adults could be researched more effectively using life-course analysis than by comparing such aggregated trends. After all, advantage of the life-course analysis is the fact that also the possible impact on automobility of other changes in the lives of young people can be studied. For example, completing a study, finding a job, living in the city or moving to another municipality. Such events also have an impact on daily commuter traffic. Life-course research, in addition, also makes it easier to disentangle cause and effect and to determine whether something is the result of postponement, catching up or abandonment. Currently, there is hardly any demographic life-course research for traffic mobility. This type of research is still in its infancy, but it is my intention, as Professor of Population Dynamics and Spatial Developments, to bring it into adulthood.
11
Postponement of family formation and the triumph of the city
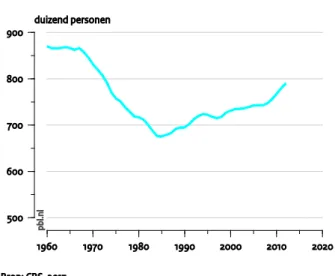
The delay of starting a family, from my point of view, also is an important development explaining recent urban growth. Over the past decades, the number of inhabitants of cities has increased rapidly, both in the Netherlands and in Europe. After the large concerns in the 1960s, 1970s and 1980s over the massive outflow of people leaving the Dutch cities, the current urban population increase has turned these concerns into optimism. Figure 6 shows the shrinkage and growth in the number of inhabitants of Amsterdam, but similar developments are also taking place in other Dutch cities.
Figure 6. Number of inhabitants in Amsterdam, 1950–2013
In the words of famous economist Glaeser (2011) this is called the 'triumph of the city'. Often, urban population growth is considered an indication of the success and popularity of cities. Every scientific field appears to view cities in a different way, reaching varying explanations for this growth. Economists consider the success of cities the result of changes in economic structure, in particular the rise of the new knowledge economy (De Groot et al., 2010). In addition, they argue that the development of prosperity first drove people away from the city, whereas today it drives them in the opposite direction. The reason for this return is that people seek the particular facilities that cities have to offer (De Groot et al., 2010). Spatial planners also consider the changes in spatial policy as one of the explanations. In the past, large-scale housing projects were constructed outside cities, whereas today building takes place mostly within the large cities or along their peripheries. Examples of such policies are the growth core policy of the 1970s and the more recent housing policy that led, among other things, to the development of new neighbourhoods, such as IJburg in Amsterdam. Ecologists, when they consider the triumph of the city, think about the increasingly cleaner urban environment. Demographers also consider various demographic processes when they consider the
12
increase in urban population, such as national and international migration, and mortality and birth rates. The large changes in these areas are depicted by figure 7.
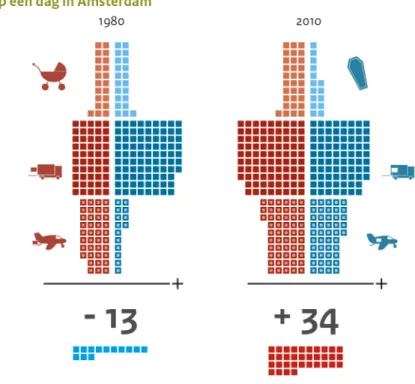
Figure 7. On a given day in Amsterdam
Bron: CBS, 2013
On any given day in 1980, the number of inhabitants of Amsterdam was declining, particularly because many more people were leaving town than we entering it. The blue planes represent the outflow from the city and, on the left side of the figure this plane is much larger than the red plane that represents the inflow. Births and deaths were in equilibrium, with only foreign migration causing a growth in the number of inhabitants. In those days, Amsterdam lost around 13 inhabitants per day. Today, the situation is very different. In the first place, the number of deaths is much lower and many more children are being born in the city. Secondly, immigration and emigration are more balanced, although the level of immigration is still higher than that of emigration. The largest change, however, concerns the inflow into the city, which is much larger than the outflow. In 1980 this was the exact opposite. Currently, the city gains 34 inhabitants per day.
Amsterdam, thus, is growing in particular due to national migration, and more specifically due to the arrival of people in their twenties and thirties. More data are shown in figure 8.
13
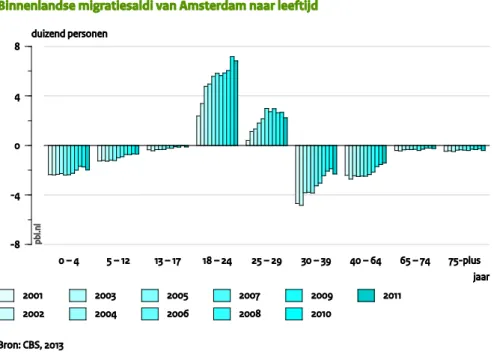
Figure 8. Net internal migration of Amsterdam, per age, 2001–2011
Looking at the internal migration balance of Amsterdam clearly shows how the city grew over the past 10 years, particularly because on balance more 18 to 29 year olds were entering the city than were leaving it. In other age groups the outflow is larger than the inflow, but this difference has become smaller over the years and, thus, also adds to the growth of the city of Amsterdam. For example, still more people in their thirties leave the city than those entering it, although this difference is getting smaller. In the past, many young adults would move to centres of urban growth near the city around the time they were starting their families, in search of cheap family housing. For Amsterdam, the development of a new town, Almere, has been important over the years. Figure 9 shows the developments of people moving between Amsterdam and Almerevii.
14
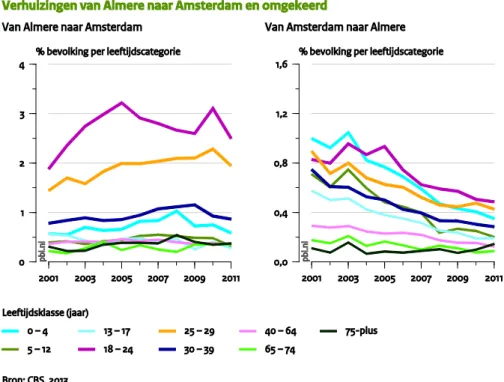
Figure 9. Residential moves between Almere and Amsterdam, per age group, 2001–2011
Since the beginning of this century, ever fewer young adults have started to move to Almere, as is shown in the right-hand figure. This particularly applies to adults in the family-starting phase. The number of people in their twenties and thirties, as well as families with toddlers, from Amsterdam to Almere has been declining since the beginning of the century. Almere apparently is becoming less and less attractive to the inhabitants of Amsterdam. However, for the young inhabitants of Almere, this is the other way round; they move to Amsterdam in increasingly larger numbers. This can be seen in the left-hand figure. For the period before the crisis, this is true for 18- to 24-year olds and, for the entire period including the crisis, for 25- to 29-year olds. Amsterdam was and is increasingly more attractive to young adults from Almere. Here, only the developments for Amsterdam and Almere are shown, but more or less the same applies to Utrecht, The Hague and Rotterdam and the centres of urban growth that surround them. Therefore, the situation described above is by no means unique to Amsterdam and Almere. Suburbanisation towards the centres of urban growth has decreased substantially.
All in all, in addition to changes in births and deaths, the recent growth of cities appears largely to be due to more young adults moving to the cities and fewer people in their twenties and thirties leaving them. Postponement of starting a family seems a logical explanation for the increasing inflow into and the stalled outflow of people in their twenties and thirties. Musterd et al. (2006) concluded this before, when they were studying the developments for Amsterdam around the turn of the century. Because starting a family used to lead to large outflow from the cities and to suburbanisation, the delay of the birth of the first child will now lead to urbanisation. In other words, because more and more people in their twenties delay family formation, this has removed one of the main reasons for them to leave the city between their twentieth and twenty-ninth year. In my opinion, a proper
15
explanation for the recent growth in cities would require more research from a life-course perspective. That is to say, more research into the way in which changes in the lives of young adults – related to the labour market, study, or the housing market – have affected their move towards or away from the cities. Life-course research can help to provide further insight into the way in which changing economic, cultural, social and demographic circumstances for young adults influence urban growth. It may also serve to unravel postponement, catch up and cancellation effects, and help determine whether there are only delay effects, and whether postponement of starting a family also leads to delays in the move away from the city, or if there are also other factors involved. Because, although it is probable that the postponement of starting a family also leads to delayed outflow from the city, there are also other developments. Research by Boterman et al. (2010), for example, shows a small but increasing presence of young families within cities. Which would mean the absence of the automatic departure from the city around the time of family formation. These issues can be addressed effectively by further life-course research.
With the above, I hope to have convinced you of my opinion that attention should be paid to demographic life-course changes when explaining spatial developments. That research in this field is still in its infancy. This does not mean that I do not value other theories on mobility or urban growth. My plea is particularly focused on showing the importance of demographic life-course analysis.
Future research: demographic life-course and spatial developments
Future spatial–demographic life-course research may generate new insights into the question about whether these developments are related to postponement, catch up or cancellation. On an aggregate level, individual changes have large consequences for spatial developments and therefore also for spatial policy. Let me briefly illustrate this by telling you a personal story. For a large part of the 1980s, I lived in Amsterdam. Over the course of time, many of my friends moved away, to growth centres outside the city – to Almere or Zoetermeer. Although we saw how many of our friends moved away, during this phase of life, we were unaware of the fact that this behaviour of our contemporaries led to a massive outflow, away from the city of Amsterdam. This example shows that spatial developments are an accumulation of changes on an individual level. Policies on urbanisation, transport and housing, therefore, are related to the changing life courses of young adults. Insight into the changes in the lives of young adults provides better projections of traffic and transport as well as improved estimations of future tasks for cities and their surrounding areas. Is the crisis responsible for the delayed departure from cities or is this a more structural development? Is the start of a family less often a reason to leave the city and is that the cause of a growing increase in housing demand within cities and corresponding decrease outside cities? Or is this a process of adjustment to the fact that young adults of today stay within the cities for longer than they used to? Are people choosing the city because they wish to avoid regular
16
car use, or do they use their cars less often because they want to remain living in the city? Suburbanisation and the rise of the car have mutually influenced each other (Bertolini, 2009); does this also apply to the increase in urbanisation and the decline in car use?
There is much still to be researched. This takes me to my research ambitions for the coming years. I intend to address the following questions:
To which degree are changes in demographic life course (order, timing, frequency of demographic events) affecting the growth in cities and surrounding areas?
To which degree are changes in demographic life course (order, timing, frequency of demographic events) affecting traffic mobility?
The answers to such research questions require the availability of longitudinal data. It will take a great deal of time and energy to generate such data – even with the use of existing CBS statistics, panels and survey results. My first activities in the coming year will therefore be focused on developing the required data sets.
In summary, spatial policy needs demographic analysis. Perhaps this already seemed obvious. I focused particularly on the forgotten dimension of demography for spatial development: the importance of changes in the demographic life course for spatial development.
Acknowledgements
Madam Rector, colleagues at both PBL and the university, friends, family. There are many people I would like to thank – people who inspired me, aided my research, and supported me whenever the demographic research required large amounts of my time and energy. A number of people I would like to thank in particular. First the Executive Board of the University of Amsterdam, especially the Dean of the Faculty of Social and Behavioural Sciences, for their faith in me. I will do my utmost not to disappoint them. In second place, I thank Joos Droogleever Fortuijn, Sako Musterd and Henk de Feijter of the University of Amsterdam, for their efforts regarding this position and my appointment. I thank my current colleagues at the university for their warm welcome. I look forward to intensifying the collaboration, as many geographical and planning researchers have affinity with demography. In the third place, I thank PBL’s general management, Maarten Hajer and Reinier van den Berg, for contributing to this chair and for offering me the opportunity to combine my professorship with my work as Head of the Department of Urbanisation and Mobility. In addition, I am grateful for the support of many of my PBL colleaguesviii, in particular those in the Department of Urbanisation and Mobility. I am proud of the way in which many PBL researchers over the years have
17
worked with me on the demographic research and its spatial consequences. My special thanks go to my PBL deputy department head – Jan Ritsema van Eck – thanks to whom I have been able to concentrate on my UvA work over the past weeks. I thank Marjolijn Mercx for her support towards the communication around this inaugural lecture, and Simone Langeweg for her editing work. Furthermore, I thank Dick van de Kaa, Henk de Gans, Henk de Feijter and Pieter Hooimeijer and posthumously Anton Kuijsten. They have taught me about all facets of demography and the passion of working on it. I hope to equally inspire today’s students in conducting demographic research. It is a popular subject and the curiosity of the students is a good incentive to maximise their research efforts.
Finally, I thank my family. Hoite always and without question gives me all the room I need for my research and, as such, support me in following my passion. Much of what is discussed above still lies ahead of both Laura and Sacha. I am very curious and look forward to see how my daughters’ futures will develop. With this, I bring my inaugural lecture to a close. Thank you all.
18
ReferencesBeer, J. De , ‘Crisis in de economie, crisis in relatie- en gezinsvorming?’ In: Bevolkingstrends, Centraal Bureau voor de Statistiek, Voorburg, November 2012
Bertolini, L., ‘De Planologie van Mobiliteit’ , Oratie 331, Vossiuspers UVA, Amsterdam, 2009. Beuningen, J. Van, Molnár-in ’t Veld, H.& I. Bouhuijs, Personenautobezit van huishoudens en personen, in: Sociaaleconomische trends, 1e kwartaal 2012, Centraal Bureau voor de Statistiek, pp. 34-46, 2012.
Billari, F.C., & Liefbroer, A.C., ‘ Towards a new pattern of transition to adulthood?’ In: Advances
in Life Course Research, 15(2-3), 59-75, 2010.
Boterman, W.R., Karsten, L. & S. Musterd, ‘Gentrifiers Settling Down? Patterns and Trends of
Residential Location of Middle-Class Families in Amsterdam’, in: Housing Studies, Vol. 25, No. 5, 693-714, September 2010
Dam, F. van, C. De Groot & F. Verwest, Krimp en ruimte. Bevolkingsafname, ruimtelijke gevolgen en beleid, Rotterdam/Den Haag: Nai Uitgevers/Ruimtelijk Planbureau, 2006
Eskinasi, M. , C. De Groot, M. van Middelkoop, F. Verwest & J. Conijn, Effecten van
staatssteunregeling voor de middeninkomens op de woningmarkt – een simulatie, PBL Beleidsstudies, Planbureau voor de Leefomgeving, Den Haag, 2012
Glaeser, E.L., Triump of the City: How our Greatest Invention Makes us Richer, Smarter, Greener, healthier and Happier, Macmillan, London, 2011
Graaf, A. de, Meer gezinnen met ouders boven de vijftig, in: Webmagazine, CBS, www.cbs.nl, 16 mei 2011
Groot, H.L.F. de, G. Marlet, C. Teulings, & W. Vermeulen, Stad en Land, CPB Bijzondere Publicatie, Centraal Planbureau, no. 89, Den Haag, 2010
Huisman, C. , A. de Jong, C. van Duin & L. Stoeldraijer, Regionale bevolkings- en huishoudensprognose 2013-2040, Den Haag, CBS en PBL, 2013
IFMO, ‘Mobility Y’ – The Emerging Travel Patterns of Generation Y, Institute for Mobility Research, Munich, 2013
Karsten, L. ‘Family gentrifiers: challenging the city as a place simultaneously to build a career and to raise children’, Urban Studies, jg. 40, nr. 12, 2573-2584, 2003
KIM Kennisinstituut voor Mobiliteitsbeleid, Mobiliteitsbalans 2012, Ministerie van Infrastructuur en Milieu, Den Haag, 2012
Klis, M. Van der (red), Gezinnen onderweg, Dagelijkse mobiliteit van ouders van jonge kinderen in het combineren van werk en gezin, Sociaal en Cultureel Planbureau, Den Haag, februari 2013 Kuhnimhof, T., Buehler, R., Wirtz, M. & D. Kalinowska, ‘Travel trends among young adults in Germany: increasing multimodality and declining car use for men’, in: Journal of Transport Geography, 24, 443-450, 2012
Lanzendorf, M., ‘Key Events and Their Effect on Mobility Biographies: The Case of the Childbirth’, in : International Journal of Sustainable Transportation, 4:5, 272-292, 2010
Latten, J.J. & C.H. Mulder, partner relationships at the dawn of the 21ste century: The Case of the Netherlands, Paper for the June 2012 European Population Conference, Stockholm, 2012
Le Vine, S. & P. Jones, On the Move, ‘Making sense of car and train travel trends in Britain’, Rac Foundation, December 2012
Lesthaeghe, R. & D.J. Van de Kaa, Twee demografische transities? In: D.J. Van de Kaa & R. Lesthaeghe (Eds.), Bevolking: groei en krimp. Deventer, Van Loghum Slaterus, 1986.
Manting, D., J. Helleman & A.C. Kuijsten, ‘From Youth to Adulthood; Transitions of Female Birth Cohorts in The Netherlands’, in: Population and Family in the Low Countries 1992: Family and labour, Beets, G.C.N., R.L. Cliquet, G. Dooghe & J. de Jong Gierveld (eds), Swets and Zeitlinger,
Amsterdam/Lisse, 1993, 55-76, 1992.
Manting, D. Dynamics in Marriage and Cohabitation. An inter-temporal, life course analysis of first union formation and dissolution. Dissertation, Thesis publishers, Amsterdam, 1994.
Manting, D. The changing meaning of cohabitation and marriage, in: European Sociological Review, vol 12, no. 1. , may, 53-66, 1996
19
Mayer, K.U. & N.B. Tuma, ‘Life course research and event history research: an overview’, in: Mayer, K.U. & N.B. Tuma (eds), Event history analyses in Life course Research, The University of Wisconsin Press, 3-20, 1990
Metz, D. Peak Car and Beyond: The Fourth Era of Travel, in: Transport Reviews: A Transnational Transdisciplinary Journal, 33:3, 255-270, 2013
Mulder, C.H. & D. Manting, Strategies of Nest-Leavers: 'Settling Down' versus 'Flexibility', in: European Sociological Review, Vol. 10 No. 2, September 1994, Oxford University Press, 1994, 155-172.
Musterd, S., Bontje, M. & W. Ostendorf , ‘The changing role of old and new urban centers: The case of the Amsterdam region’, in: Urban Geography, 27, 4, 360-387, 2006
PBL, Vergrijzing en Ruimte, Gevolgen voor de woningmarkt, vrijetijdsbesteding, mobiliteit en regionale economie, Den Haag, 2013
Runyan, W.M., The life course as a theoretical orientation, in W.M. Runyan, Life histories and Psychobiography. Exploration in theory and method, New York, Oxford up, 81-99, 1984
Sarah in Tegenlicht, Mensen van Nu, Documentaire van de VPRO,htpp://tegenlicht.vpro.nl, 2013
i A slightly revised version of my inaugural lecture (spoken in Dutch) of 1 November 2013. I have added a list of references, but
personal photographs and video images have been omitted.
ii Diagram legend is strong decline, decline, more or less stable, growth, strong growth of population size iii A Dutch inaugural lecture may not exceed 45 minutes.
iv This figure is an updated version of the figure in the web article by De Graaf (2011)
v With thanks to UvA colleagues Veronique Van Acker and Lucas Harms and PBL colleague Hans Nijland, for their comments to
an earlier version of ‘Verkeersmobiliteit en uitstel van gezinsvorming’ [Traffic mobility and postponement to starting a family (in Dutch)].
vi Diagram legend As automobilist, auto passenger, with public transport, bicyle
vii The settlement chances are calculated by dividing the annual number of people that move to one of the four large
municipalities by the Dutch population, minus the population of those four large municipalities, on 1 January of a given year. The outflow chances are calculated by dividing the annual number of people leaving the four large municipalities by the population of those four municipalities, on 1 January of a given year (Manting & Huisman (2013)).