Contact: M. Posch
European Air Quality & Sustainability max.posch@mnp.nl
ICP M&M Coordination Center for Effects
M. Posch, J. Slootweg, J.-P. Hettelingh (eds.)
Working Group on Effects of the
Convention on Long-range Transboundary Air Pollution
wge
Report 259101016/2005
ISBN: 9069601281European Critical loads and Dynamic Modelling:
CCE Status Report 2005
This investigation has been performed by order and for the account of the Directorate for Climate Change and Industry of the Dutch Ministry of Housing, Spatial Planning and the Environment within the framework of RIVM-project M259101, ‘UNECE-LRTAP’; and for the account of (the Working Group on Effects within) the trustfund for the partial funding of effect oriented activities under the Convention. Part of this work is supported by the European Commission under Service Contract 070501/2004/380217/MAR/C1.
Netherlands Environmental Assessment Agency (MNP associated with the RIVM), P.O. Box 303, 3720 AH Bilthoven, telephone: +31–30–274 2745, website: www.mnp.nl
Contents
Acknowledgements ... 4
Abstract ... 5
Rapport in het kort... 6
Preface... 7
PART I Status of Maps and Methods 1. Status of European Critical Loads and Dynamic Modelling... 9
2. Summary of National Data... 27
3. Harmonizing European land cover maps ... 47
4. The European Background Database ... 63
5. Use of Critical Loads in Integrated Assessment Modelling... 71
6. Dynamic Modelling of Lakes in Eastern Canada... 77
PART II National Focal Centre Reports ... 85
AUSTRIA... 86 BELARUS... 89 BELGIUM... 95 BULGARIA ... 96 CZECH REPUBLIC... 100 GERMANY... 105 FRANCE ... 109 HUNGARY ... 116 IRELAND ... 121 ITALY ... 125 NETHERLANDS... 129 NORWAY ... 132 POLEN ... 135 SLOVAKIA... 141 SWEDEN ... 142 SWITZERLAND... 148 UNITED KINGDOM... 158
Acknowledgements
The methods and resulting maps contained in this report are the product of collaboration within the Effects Programme of the UNECE Convention on Long-range Transboundary Air Pollution, involving many institutions and individuals throughout Europe. National Focal Centres, whose reports regarding modelling and mapping activities appear in Part II are gratefully acknowledged for their contribution.
In addition the Coordination Center for Effects of the Netherlands Environmental Assessment Agency (MNP) associated with RIVM thanks the following:
•
The Directorate for Climate Change and Industry of the Dutch Ministry of Housing, Spatial Planning and the Environment and Mr. J. Sliggers in particular for their continued support,•
The Working Group on Effects, the Task Force of the International Co-operative Programme on the Modelling and Mapping of Critical Levels and Loads and Air Pollution Effects, Risks and Trends for their collaboration and assistance,•
The EMEP Steering Body for its collaboration,•
The UNECE secretariat of the Convention on Long-range Transboundary Air Pollution for its valuable support, including the preparation of official documentations,Abstract
European Critical Loads and Dynamic Modelling
The analysis of air pollution impacts on environment and health becomes ever more important for the support of air pollution policies also because the health risk op particulate matter has recently become more recognised . A number of air pollution abatement agreements will be reviewed and possibly revised in the near future. These include the UNECE Protocol to Abate Acidification, Eutrophication and Ground Level Ozone, the EC’s National Emissions Ceiling Directive and the UNECE Protocol on Heavy Metals. In support of the review of the first two agreements the report provides updated European maps of critical loads for acidification and eutrophication as well as novel results regarding the temporal delay of damage or recovery of acidification. While decreasing since the 1980s, the exceedance of critical loads for acidification remains a European-wide issue. ‘Acid rain’ may seem yesterday’s problem, but the risk of acidification of ecosystems continues to demand attention. Based on data provided by 14 countries, 95% of the European forest soils are estimated to recover by 2030 provided depositions of sulphur and nitrogen are sufficiently reduced below critical loads. It is noted that the exceedance of critical loads for eutrophication, and allied risks for biodiversity, remain high and widespread. Finally, regarding the Heavy Metals Protocol, the report summarizes recent CCE work on heavy metals. Perhaps unexpectedly, it turns out that critical loads of lead continue to be widely exceeded on a European scale. Part I of this report describes recent European work addressing both temporal and spatial environmental impacts of transboundary air pollution. Part II provides detailed national reports justifying methods and data applied by National Focal Centres to enable the CCE compilation of European maps of critical loads.
Keywords: acidification, atmospheric deposition, CCE background database, critical loads, eutrophication, exceedances, heavy metals, National Focal Centres
Rapport in het kort
Europese Kritische Drempels en Dynamische Modellering
De analyse van effecten van luchtverontreiniging op mens en milieu wordt belangrijker ondermeer omdat de risico’s van fijn stof voor de menselijke gezondheid recentelijk meer worden onderkend. In de komende jaren worden verschillende Europese overeenkomsten over de luchtkwaliteit geëvalueerd en mogelijk herzien. Het betreft ondermeer het UNECE protocol voor de bestrijding van verzuring, vermesting en ozon op leefniveau, de Europese Commissie richtlijn inzake Nationale Emissie Plafonds en het protocol voor zware metalen. Voor de evaluatie van de eerste twee overeenkomsten beschrijft dit rapport de vernieuwde Europese kaarten van kritische drempels voor verzuring en vermesting en nieuwe resultaten van de analyse van tijdsvertragingen van herstel van - en schade door verzuring. Resultaten laten zien dat de overschrijding van kritische drempels voor verzuring weliswaar afnemen sinds 1980, maar dat de spreiding van de risico’s nog altijd grootschalig is. In zijn letterlijke betekenis schijnt ‘zure regen’ een probleem van gisteren te zijn, maar de risico’s van verzuring van ecosystemen blijven om aandacht vragen. Op basis van gegevens van 14 landen is berekend dat herstel van circa 95% van de voornamelijk bosbodems in deze landen in 2030 kunnen herstellen bij vermindering van zure depositie tot de kritische drempels. Met betrekking tot de overschrijding van kritische drempels voor vermesting, en daarmee samenhangende risico’s voor de biodiversiteit, wordt geconstateerd dat deze vrijwel overal in Europa bijna onverminderd hoog blijven. Tenslotte blijken de huidige emissies van lood, cadmium en kwik te hoog. De intuïtie weersprekend worden de kritische drempels van looddepositie grootschalig in Europa overschreden. Deel I van dit rapport beschrijft het Europese werk om de milieueffecten van grensoverschrijdende luchtverontreiniging in ruimte en tijd uit te drukken. Deel II bestaat uit nationale rapportages die de bijdragen onderbouwen van National Focal Centres aan de Europese kaarten van kritische drempels.
Preface
This report describes the results of the call for data on critical loads on acidification and eutrophication and novel outcomes with European applications of dynamic models addressing time delays of recovery from acidification or damage caused by the latter.
In its 17th session in December 1999, the Executive Body of the Convention ‘... underlined the importance of ...
dynamic modelling of recovery’ (ECE/EB.AIR/68 p. 14, para. 51. b) to enable the assessment of time delays of recovery in regions where critical loads stop being exceeded and time delays of damage in regions where critical loads continue to be exceeded.
The Working Group on Effects (WGE), at its 23rd session (Geneva, 1-3 September 2004), approved the proposal
made at the 20th Task Force meeting of the ICP-M&M (Laxenburg, 27-28 May 2004) to issue a call for data on
critical loads for acidification and eutrophication, and for data on dynamic modelling of acidification (EB.AIR/WG.1/2004/2 para. 57c).
The Commission of the European Communities emphasized the importance of the response to the call for data, in particular by the EU Member States. The outcomes of the call are not only used for the support of policy
processes under the Convention (possible revision process of the Gothenburg Protocol), but also have the potential to support the Clean Air for Europe (CAFE) programme under the European Commission (preparation of the revision of the National Emission Ceilings directive).
The CCE issued the call on 24 November 2004, setting the deadline to 28 February 2005. In addition to information provided in the Mapping Manual (www.icpmapping.org), also a detailed instruction document had been compiled by the CCE and distributed to the National Focal Centres and also made available on the CCE website (before 1 May 2005 www.mnp.nl/cce).
The objective of the call, in accordance to the medium-term work plan of the WGE, was to produce an updated database on critical loads and dynamic modelling results which could be made available for use in integrated assessment modelling to support European air pollution abatement policies.
Chapter 1 serves as an executive summary including critical loads for acidification, eutrophication and of heavy metals (latest updates), exceedance maps and dynamic modelling of time delays of acidification impact changes. Chapter 2 analyses the data on critical loads and dynamic modelling submitted by National Focal Centres including an inter-country comparison of data statistics. Chapter 3 addresses the information on land cover and ecosystems that are used under the LRTAP Convention. Chapter 4 describes the latest CCE background database for calculating critical loads for forest soils in Europe. This database could is used to provide critical loads in countries that did not submit any data. Chapter 5 summarizes recent CCE work to identify so-called impact factors that describe the relationship between marginal emission changes and changes in the area exceeded. This chapter particularly addresses the application in the optimization model of the RAINS model. Finally, chapter 6 describes a first tentative Canadian map of critical loads for acidification and eutrophication developed at the Trent
University (Peterborough, Ontario).
Part II provides national reports justifying methods and data applied by National Focal Centres to enable the CCE compilation of European maps of critical loads.
The report is completed with Appendix A, which is a reprint of the ‘instructions’ provided to the NFCs to assist in their response to the call for data.
1. Status of European Critical Loads and Dynamic Modelling
1Jean-Paul Hettelingh, Maximilian Posch, Jaap Slootweg
1.1 Acidification and eutrophication: background
The Working Group on Effects, at its 23rd session (Geneva, 1-3 September 2004), approved the proposal made at
the 20th Task Force meeting of the ICP-M&M (Laxenburg, 27-28 May 2004) to issue a call for data on critical
loads for acidification and eutrophication, and for data on dynamic modelling of acidification (EB.AIR/WG.1/2004/2 para. 57c).
The objective of the call, in accordance to the medium-term work plan of the WGE was to produce an updated database on critical loads and dynamic modelling results which could be submitted to Task Force on Integrated Assessment Modelling (TFIAM).
At the meeting of the Working Group on Effects the representative of the Commission of the European Communities emphasized the importance of the response to the call for data, in particular by the EU member states. The outcomes of the call are not only used for the support of policy processes under the Convention (possible revision process of the Gothenburg Protocol), but also have the potential to support the Clean Air for Europe (CAFE) programme under the European Commission (preparation of the revision of the National Emission Ceilings directive).
The CCE issued the call on 24 November 2004, setting the deadline to 28 February 2005. In addition to information provided in the Mapping Manual (www.icpmapping.org), also detailed instructions had been compiled by the CCE and distributed to the National Focal Centres. It was also made available on the CCE website (www.mnp.nl/cce) and can be found in Appendix A.
The following sections provide a summary of the results of the call for data on critical loads for acidification and eutrophication and dynamic modelling variables, including exceedance maps. A more detailed overview and analysis of national data submissions regarding critical loads and dynamic modelling variables is presented in Chapter 2, whereas country reports can be found in Part II of this report.
1.2 Response to the call for data
In 2005 fourteen parties under the Convention submitted updated data on critical loads of acidity and of nutrient-N, while 13 countries provided dynamic modelling data. Considering earlier submissions of Parties Table 1-1 gives an overview of the year in which the latest update by a NFC was recorded.
The critical loads consist of four basic variables which were asked to be submitted and which were used to support the Gothenburg Protocol. These variables are the basis for the maps used in the effect modules of the European integrated assessment modelling effort: (a) the maximum allowable deposition of S, CLmax(S), i.e. the highest deposition of S which does not lead to ‘harmful effects’ in the case of zero nitrogen deposition, (b) the minimum critical load of nitrogen, CLmin(N) to ensure sufficient nitrogen for plant uptake including nitrogen
immobilisation (c) the maximum ‘harmless’ acidifying deposition of N, CLmax(N), in the case of zero sulphur deposition, and (d) the critical load of nutrient N, CLnut(N), preventing eutrophication of ecosystems.
1 Note that this chapter also includes an update on critical loads of Cd, Pb and Hg in section 1.7 including latest results following the CCE workshop and
Table 1-1. Overview of the year in which a Party submitted the latest update on critical loads for acidification, eutrophication and dynamic modelling data.
Critical loads for Acidification based on data of:
Critical loads for eutrophication based on data of:
Dynamic Modelling data
based on data of:
Austria (AT) 2005 2005 2005 Belgium (BE)1 20031 20031 - Bulgaria (BG) 2005 2005 2005 Belarus (BY) 2005 2005 - Switzerland (CH) 2005 2005 2005 Cyprus (CY) 2004 2004 - Czech Rep. (CZ) 2005 2005 2005 Germany (DE) 2005 2005 2005 Denmark (DK) 2004 2004 - Estonia (EE) 2001 2001 - Spain (ES) 1997 1997 - Finland (FI) 2004 2004 - France (FR) 2005 2005 2005 United Kingd. (GB) 2005 2004 2005 Croatia (HR) 2003 2003 - Hungary (HU) 2004 2004 2004 Ireland (IE) 2005 2005 2005 Italy (IT) 2005 2005 2005 Moldava (MD) 1998 1998 - Netherlands (NL) 2005 2005 2005 Norway (NO) 2005 2005 2005 Poland (PL) 2005 2005 2005 Russia (RU) 1998 1998 - Sweden (SE) 2005 2005 2005 Slovakia (SK) 2003 2003 - Total # parties 11 14 11 14 1 13
1The last update of data from Wallonia is of 2001
Dynamic modelling results submitted in 2005 may be different to the results of 2004 also because depositions of acidifying compounds had to be used which were now computed with the Unified Model on an EMEP50 grid (see Simpson et al., 2003).
1.3 Critical load maps
This section contains maps of critical loads for ecosystems within 50×50 km2 EMEP (EMEP50) grid cells. The
maps are based on updated national contributions from 14 countries. For other countries the most recent data submission was used as listed in Table 1-1. For countries that never submitted critical loads data the European background database (see Chapter 4) has been used.
eq ha-1a-1 < 200 200 - 400 400 - 700 700 - 1000 1000 - 1500 > 1500
CLmax(S) (5th percentile) All ecosystems
CCE/MNP eq ha-1a-1 < 200 200 - 400 400 - 700 700 - 1000 1000 - 1500 > 1500
CLmax(S) (5th percentile) Forests
CCE/MNP eq ha-1a-1 < 200 200 - 400 400 - 700 700 - 1000 1000 - 1500 > 1500
CLmax(S) (5th percentile) (semi-)natural Vegetation
CCE/MNP eq ha-1a-1 < 200 200 - 400 400 - 700 700 - 1000 1000 - 1500 > 1500
CLmax(S) (5th percentile) Surface Waters
CCE/MNP
Figure 1-1. The 5th percentiles of the critical loads for acidity for all ecosystems (top left), forests (top right), semi-natural
vegetation (bottom left) and surface waters. The maps present these quantities on the EMEP50 grid.
Figure 1-1 shows 5th percentile maps of CLmax(S) for all ecosystems combined left), forest ecosystems
(top-right), semi-natural vegetation (bottom-left) and aquatic ecosystems. Low critical loads below 200 eq ha–1a–1 (red
shaded) show up north of 50o latitude. In Sweden low critical loads reflect highly sensitive forest and aquatic
ecosystems. In Belarus low deposition values are needed to protect forests and natural vegetation. In south-western France low critical loads exist for semi-natural vegetation.
Figure 1-2 shows analogous maps for CLnut(N). Low values of the 5th percentile (below 400 eq ha–1a–1) occur
eq ha-1a-1 < 200 200 - 400 400 - 700 700 - 1000 1000 - 1500 > 1500
CLnut(N) (5th percentile) All ecosystems
CCE/MNP eq ha-1a-1 < 200 200 - 400 400 - 700 700 - 1000 1000 - 1500 > 1500
CLnut(N) (5th percentile) Forests
CCE/MNP eq ha-1a-1 < 200 200 - 400 400 - 700 700 - 1000 1000 - 1500 > 1500
CLnut(N) (5th percentile) (semi-)natural Vegetation
CCE/MNP eq ha-1a-1 < 200 200 - 400 400 - 700 700 - 1000 1000 - 1500 > 1500
CLnut(N) (5th percentile) Surface Waters
CCE/MNP
Figure 1-2. The 5th percentiles of the critical loads of nutrient nitrogen for all ecosystems (top left), forests (top right),
semi-natural vegetation (bottom left) and surface waters. The maps present these quantities on the EMEP50 grid.
1.4 Robustness of critical load submissions
Figure 1-3 provides a comparison of the statistics of the national focal centre submissions since 1998 until the year in which the NFC made its last update. The minimum, 5th, 25th (lower quartile), 50th, 75th (upper quartile), 95th
percentiles and the maximum of the critical loads of each country that submitted data are shown in an analogy to the well known ‘Box and Whisker plot’, i.e. a ‘diamond plot’. A diamond plot offers some visual advantages, e.g. when diamonds are overlaid.
Statistics of CLmax(S) are on the left ranging over an interval of 0 to 4000 eq ha-1a-1, while CLnut(N) (right) ranges
from 0 to 2000 eq ha-1a-1. If we focus on the submission of this year and 2004 the following can be said.
Compared to 2004 the median values (shown as vertical line dividing a ‘diamond’) of CLmax(S) in 2005 increased
in Austria, Switzerland, the Czech Republic, France, Norway and Poland, while decreasing in Belarus, Germany, the Netherlands and Sweden. The median value of data for CLnut(N) in 2005 revealed an increase for submissions
from Austria, Bulgaria, Belarus, Germany, France, Italy, Poland and Sweden while the median decreased in the Czech Republic, Ireland and the Netherlands.
The striking increase of Austrian critical loads submitted in 2005 in comparison to earlier submissions is the result of replacing the entire database by another one due to improved knowledge on base cation weathering.
CLmax(S) 1998 2003 2004 2005 AT BE BG BY CH CY CZ DE DK EE ES FI FR GB HR HU IE IT MD NL NO PL RU SE SK 0 1000 2000 3000 4000 eq ha-1a-1 > 4000 CLnut(N) 1998 2003 2004 2005 AT BE BG BY CH CY CZ DE DK EE ES FI FR GB HR HU IE IT MD NL NO PL RU SE SK 0 500 1000 1500 2000 eq ha-1a-1 Minimum 5% 25% Median 75% 95% Maximum
Figure 1-3. Diamond plot of the minimum (left extreme), 5th (left dot), 25th (left corner of diamond), 50th (vertical line in the
diamond), 75th (right corner), 95th (right dot) percentiles and maximum (right extreme) critical loads of CL
max(S) (left) and
CLnut(N) (right) for the national data of (or before) 1998 (light blue), 2003 (turquoise), 2004 (dark blue) and 2005 (purple),
respectively.
Inspecting the range of critical loads submitted since 1998 (which have been used for the support of the Gothenburg protocol) we can see that the last recorded NFC submission of the 5th percentile CLmax(S) was
markedly lower than in 1998 for Belgium, Belarus, the Czech Republic, France, Croatia, Ireland, United Kingdom, the Netherlands and Sweden while the median shifted downwards since 1998 in Belgium, Belarus, United Kingdom, Croatia, Ireland, the Netherlands, Poland and Sweden. Finally, it can be concluded that the
CLmax(S) values between the 25th and 75th percentile (‘the diamond’) generally show a cluster between 1998 and
the last recorded submission. This is most striking in most of the country data of which the median in 2005 has shifted within a range of about 500 eq ha–1a–1 from the median in 1998. With respect to CLnut(N) the 5th percentile
of the last recorded submission decreased with respect to the 1998 data in Belarus, Switzerland, the Czech Republic, Germany, France, Croatia, Ireland, Norway, Sweden and Slovakia. Also for CLnut(N) submissions of data in the range between the 25th and 75th percentile a clustering tendency can be remarked between 1998 and
the latest recorded year for most of the countries. This tendency does not contradict the preliminary assertion that critical loads data have been robust over time.
1.5 Critical load exceedances and robustness
The term exceedance in this section refers to the ‘average accumulated exceedance’ (AAE). The AAE is the area-weighted average of exceedances (accumulated over all ecosystem points) in a grid cell, and not only the
exceedance of the most sensitive ecosystem. An AAE may be computed for all ecosystem categories within a grid cell, but also for one single ecosystem category (such as a forest) in a grid cell for which data points are submitted by an NFC. The European database of critical loads (both submitted and from the back ground database) covers 5,918,115 km2 of ecosystem area (see Table 1-2) part of which is covered by ecosystems of 25 Parties under the
LRTAP Convention that have submitted data over the past 15 years (1,654,876 km2 is covered by critical loads
data from the EU25 of which 18 Member States submitted data).
eq ha-1a-1 no exceedance <200 200 - 400 400 - 600 600 - 800 > 800
2010 Exceedance of acidity CLs All ecosystems
Dep-data: EMEP/MSC-WCCE/MNP
eq ha-1a-1 no exceedance <200 200 - 400 400 - 600 600 - 800 > 800
2010 Exceedance of acidity CLs Forests
Dep-data: EMEP/MSC-WCCE/MNP
eq ha-1a-1 no exceedance <200 200 - 400 400 - 600 600 - 800 > 800
2010 Exceedance of acidity CLs (semi-)natural Vegetation
Dep-data: EMEP/MSC-WCCE/MNP
eq ha-1a-1 no exceedance <200 200 - 400 400 - 600 600 - 800 > 800
2010 Exceedance of acidity CLs Surface Waters
Dep-data: EMEP/MSC-WCCE/MNP
Figure 1-4. Average Accumulated Exceedance for acidity for all ecosystems (top left), forests (top right), vegetation (bottom left) and surface water using acid deposition computed by the EMEP Unified Model for 2010.
Figure 1-4 shows the AAE of acidity with the highest values occurring for exceedances in forest soils mostly north of 50o latitude and for vegetation on the border of the Netherlands and Germany and in the east of the
eq ha-1a-1 no exceedance <200 200 - 400 400 - 600 600 - 800 > 800
2010 Exceedance of nutrient CLs All ecosystems
Dep-data: EMEP/MSC-WCCE/MNP
eq ha-1a-1 no exceedance <200 200 - 400 400 - 600 600 - 800 > 800
2010 Exceedance of nutrient CLs Forests
Dep-data: EMEP/MSC-WCCE/MNP
eq ha-1a-1 no exceedance <200 200 - 400 400 - 600 600 - 800 > 800
2010 Exceedance of nutrient CLs (semi-)natural Vegetation
Dep-data: EMEP/MSC-WCCE/MNP
eq ha-1a-1 no exceedance <200 200 - 400 400 - 600 600 - 800 > 800
2010 Exceedance of nutrient CLs Surface Waters
Dep-data: EMEP/MSC-WCCE/MNP
Figure 1-5. Average Accumulated Exceedance for eutrophication for all ecosystems (top left), forests (top right), vegetation (bottom left) and surface water using deposition of oxidized and reduced nitrogen computed by the EMEP Unified Model for 2010.
Figure 1-5 shows the AAE of critical loads of nutrient nitrogen. It reveals that submitted data on the critical load of nutrient nitrogen focuses on forest soils (top right). The highest exceedances are south of 58o latitude with
peaks in a broad coastal area between northern France and Denmark as well as in the north of Italy. Semi natural vegetation at risk occurs mostly in the border area between the Netherlands and Germany.
Figures 1-4 and 1-5 illustrate the spatial variation of the AAE. The cross border variation of exceedances was shown in Hettelingh et al. (2004) to change in particular due to the application of the EMEP Unified Model which replaced the lagrangian model results. We will not repeat the comparison here between the exceedances computed with the lagrangian and Unified Model. Suffices to say that it was shown that the spatial distribution of
exceedances computed with the Unified Model was robust (areas with high exceedances under the lagrangian remained high under the Unified Model) but that the magnitude of the exceedances increased.
In Figure 1-6 we focus on the influence of the change of acidity critical load since 1998 on the national
distribution of exceedances with particular attention on the occurrence of high national exceedances (the median and 95th percentile of the exceedance distribution in each country).
2000 Exceedance of acidity CLs 1998 CLs 2003 CLs 2004 CLs 2005 CLs AT BE BG BY CH CY CZ DE DK EE ES FI FR GB HR HU IE IT MD NL NO PL RU SE SK 0 250 500 750 1000 1250 1500 1750 2000 eq ha-1a-1
Figure 1-6. Diamond plot of national exceedances for acidity computed with critical load databases from 1998 until 2005, or the latest recorded submission of a National Focal Centre using depositions computed with the EMEP Unified Model and acidifying emissions of 2000.
Figure 1-6 shows that the median of the exceedances with recent critical loads (purple diamonds) compared to the median using 1998 critical loads (light blue) increased in Belarus, the Czech Republic, the Netherlands and in Poland. In the other countries the median exceedance is zero or decreased somewhat in comparison to the distribution of exceedances in 1998 as can be seen for Germany. Since the 1998 submission, the 95th percentile
(the right dot) of the distribution of exceedances increased in Belarus (about +483 eq ha-1 a-1), the Czech Republic
(about +409 eq ha-1 a-1), Poland (about +316 eq ha-1 a-1), Sweden (about +61 eq ha-1 a-1) and the Netherlands
(about +255 eq ha-1 a-1). Exceedances in the Netherlands are the highest in comparison to other countries that
submitted critical load data. A decrease between 1998 and 2005 of the 95th percentile exceedance is seen in
Austria (about -246 eq ha-1 a-1 ), Switzerland (about -73), Germany (about -296 eq ha-1 a-1 ) and France (about
-711 eq ha-1 a-1).
Finally, Figure 1-7 displays the temporal development since 1940 of the Average Accumulated Exceedance of critical loads for acidity on all European ecosystems (top left) and of the ecosystem area percentage that is unprotected by acid deposition (top right). The development of the AAE illustrates the marked decrease of AAE especially on forest soils (brown graph). In 1985 about 60% of the forest soils (broadly distributed in Europe) and more than 40% of the surface waters (in northern Europe in particular) are unprotected. In 2010 these percentages become reduced below 20%. From Figure 1-4 it can be seen that the exceeded forest ecosystems in 2010 are located in about one third of the EMEP grid cells covering pan-Europe.
1950 1960 1970 1980 1990 2000 2010 0 100 200 300 400 500 600 700 eq ha -1a -1 AAE acidity forest vegetation waters 1950 1960 1970 1980 1990 2000 2010 0 20 40 60 80 100
% Area exceeded acidity
forest vegetation waters 1950 1960 1970 1980 1990 2000 2010 0 100 200 300 400 500 600 700 eq ha -1a -1 AAE nutr.N forest non-forest 1950 1960 1970 1980 1990 2000 2010 0 20 40 60 80 100
% Area exceeded nutr.N
forest non-forest
Figure 1-7. The Temporal development between 1945 and 2010 of the Average Accumulated Exceedance (AAE) of critical loads for acidity on all European ecosystems (top left), of the ecosystem area percentage that is exceeded by acid deposition (top right), of the AAE for eutrophication (bottom left) and % of areas unprotected from eutrophication (bottom right).
Figure 1-7 also shows that natural vegetation continues to be at risk of acid deposition after 1995 mostly in Germany, the Netherlands and in the United Kingdom (see Figure 1-4).
With respect to European forest ecosystems at risk of eutrophication, Figure 1-7 (bottom graphs) illustrates that the European AAE has decreased from about 400 to 200 eq ha–1 a–1 between 1985 and 2010 (bottom left graph). In
terms of areas this implies (bottom right map) a reduction of unprotected areas from more than 60% in 1985 to about 45% in 2010. Note that about 10% of natural vegetation remains at risk of nutrient nitrogen as of about 1995. The latter also holds for surface waters, data for which are too limited to produce a meaningful plot from a European point of view.
1.6 Dynamic modelling2
Dynamic modelling and terminology
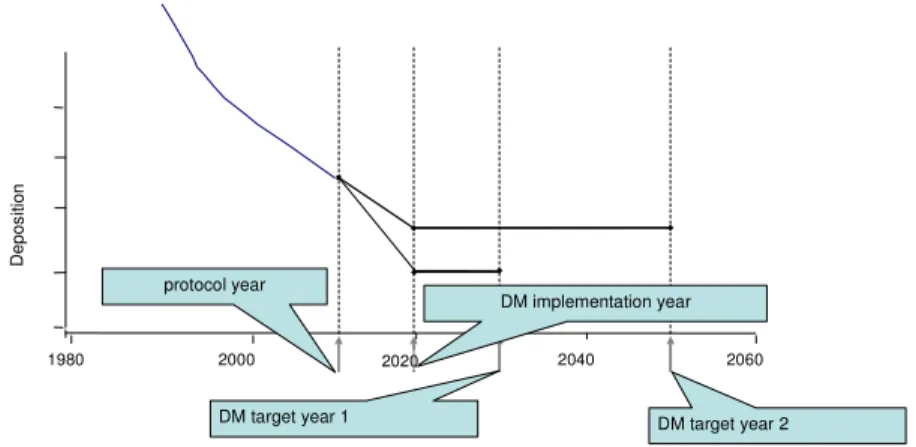
Important dynamic modelling results for possible use by the TFIAM are so-called target loads. A target load is the deposition (path) which ensures recovery by having the prescribed chemical (or, ideally, biological) criterion (e.g., the Al:Bc ratio) be met in a given year and maintained thereafter. The variety of deposition paths to reach a target load is numerous. We restrict to deposition pathways that are characterised by three numbers (years): (i) the protocol year, (ii) the implementation year, and (iii) the target year (see Figure 1-8). The protocol year for
dynamic modelling is the year up to which the deposition path is assumed to be known and cannot be changed any more. This can be the present year or a year in the (near) future, for which emission reductions are already agreed. As protocol year countries were requested to use 2010, the year for which the Gothenburg Protocol and the EU NEC Directive are expected to be in place. The implementation year for dynamic modelling is the year in which all reduction measures to reach the final deposition (the target load) are assumed to be implemented relative to a
new protocol or directive.
1980 2000 2040 2060
protocol year
DM implementation year
DM target year 1 DM target year 2
2020 D ep os iti on
Figure 1-8. Schematic representation of deposition paths leading to target loads by dynamic modelling (DM), characterised
by three key years. (i) The year up to which the (historic) deposition is fixed (protocol year); (ii) the year in which the
emission reductions leading to a target load are implemented (DM implementation year); and (iii) the years in which the
chemical criterion is to be achieved (DM target years) (Source: Posch et al., 2003).
Between the protocol year and the implementation year deposition is assumed to change linearly. After consultation with the chairmen of the ICP M&M, the WGE, the Working Group on Strategies and Review (WGSR) and other Convention representatives, 2020 was chosen as a preliminary implementation year and 2030 and 2050 as target year. A target year for dynamic modelling is the year in which the chemical criterion (e.g., the Al:Bc ratio) is met (for the first time). For scientific and technical purposes countries were also requested to submit a target load for 2100.
In addition to information on target loads and target years, National Focal Centres (NFCs) were also requested to ensure consistency between critical loads and dynamic modelling. This implies that each ecosystem-record in the critical load database should contain data that can be used to compute critical loads and to run the dynamic model. However, to maintain important statistical information on the (distribution of) sensitivity of ecosystems within an EMEP grid cell, NFCs were requested not to leave out records for which only critical loads and no dynamic modelling data are available. Deposition data are based on the Unified Model of EMEP (Simpson et al., 2003). However, no historical data based on the Unified Model of EMEP is yet available. Therefore, the ratio in 2000 of the magnitude of depositions generated by the lagrangian model (on 150×150 km2; Schöpp et al., 2003; EMEP,
1998) to those from the new EMEP Unified Model (on 50×50 km2) were used as a basis to scale the historical
lagrangian deposition trends between 1880 and 2000.
Dynamic modelling results
A geographical representation of the areas for which we received target loads to ensure recovery in 2030, 2050 and 2100 is shown in Figure 1-9. Target loads have been set equal to critical loads in areas which are ‘safe’, i.e. where critical loads are not exceeded or critical limits niot violated (see Table 2-2 columns 7, 11, 15) and in areas where target loads have not been computed. A map showing grid cells in which target loads have been computed is given in Chapter 2 (see Fig 2-2). Target loads are set to 0 in areas where they are infeasible.
eq ha-1a-1 infeasible 0 - 200 200 - 400 400 - 700 700 - 1000 1000 - 1500 > 1500
2030 TLmax(S) (5th percentile) All ecosystems
CCE/MNP eq ha-1a-1 infeasible 0 - 200 200 - 400 400 - 700 700 - 1000 1000 - 1500 > 1500
2050 TLmax(S) (5th percentile) All ecosystems
CCE/MNP eq ha-1a-1 infeasible 0 - 200 200 - 400 400 - 700 700 - 1000 1000 - 1500 > 1500
2100 TLmax(S) (5th percentile) All ecosystems
CCE/MNP eq ha-1a-1 < 200 200 - 400 400 - 700 700 - 1000 1000 - 1500 > 1500
CLmax(S) (5th percentile) All ecosystems
CCE/MNP
Figure 1-9. Location and magnitude of target loads that lead to recovery of 95% of the ecosystem area in 2030 (upper left), 2050 (upper right) and 2100 (lower left). For comparison the 5% map of CLmax(S) is shown as well.
Comparison of target load maps to the critical load map in Figure 1-9 shows grid cells where the 5th percentile
target load values are lower than critical loads values (lower-right map) e.g. in the Czech Republic, France, Germany, the Netherlands, Poland and Sweden. Grid cells where target loads are equal to critical loads do include areas for which dynamic modelling was not performed .
We were able to compute Recovery Delay Times (RDT) under the Base Line Current Legislation (BL-CLE) scenario. It turned out in the CLRTAP-domain that 29.2% (25.7% in EU25) of the area which is not safe now could recover in the future, i.e. 20.2% (21.9%) before 2030, 20.7% (22.5%) before 2050 and 22.3% (24.2) before 2100. We conclude that another 6.9% (1.5 %) of the area which is not safe at present would recover after 2100. Deposition levels would need to be reduced further to either increase the area that recovers before 2100, or to bring closer the year of recovery. How much depositions should be reduced below BL-CLE deposition patterns depends on the year in which recovery is aimed to occur, i.e. on the target load required to obtain recovery in that year. In doing this we found that about 95% of the ecosystems which is not safe now could recover already in 2030 if acid deposition is sufficiently reduced in 2020 (implementation year). This does include ecosystems for
which acid deposition needs to be reduced below critical loads. In chapter 2 a more detailed analysis of dynamic modelling elements is provided.
Figure 1-10 shows a comparison on a country scale between target loads and critical loads in the form of diamond-graphs. CLs and TLs CLmax(S) TLS-2100 TLS-2050 TLS-2030 AT BG CH CZ DE FR GB HU IE IT NL NO PL SE 0 1000 2000 3000 4000 eq ha-1a-1
Figure 1-10. Diamond plot of the distribution of critical loads (light blue) and target load distributions in 2100 (turquoise), 2050 (dark blue) and 2030 (purple).
Figure 1-10 confirms that a marked differentiation between the 5th percentile values (left dot) of target loads and
critical loads are in Switzerland, the Czech Republic, Germany, France, the Netherlands, Poland and Sweden. A decrease of the median values can be seen in the Czech Republic, Germany and the Netherlands in particular. Finally, Table 1-2 provides an overview of trends from 1980 to 2010 of non-protected area in each country, including critical loads from the CCE European background database (EU-DB) for countries that did not ever submit data.
Deposition fields for 1980-2010 were provided by EMEP/MSC-W. The ecosystem area in the CLRTAP domain which is at risk from acidification (left part of Table 1-2) reduces from about 48% (48.6% in the EU25) in 1980 to about 6% (11% in the EU25) in 2010. For the risk of eutrophication (right part of Table 1-2) the percentages go from about 38% (80.5% in the EU25) to 28% (60% in the EU25). The persisting broad European areas that are unprotected from eutrophication point to the requirement of using dynamic models to improve knowledge of the delays by which damage from excessive nitrogen could occur.
Table 1-2. Exceedances of the critical load for acidification (left) and for eutrophication (right) as % of the European ecosystem area for which critical loads are available (including the CCE back ground database), using depositions computed with the EMEP-Unified Model (Simpson et al., 2003) from 1980 to 2010 on the basis of the BL_CLE scenario (totals include Andorra, Liechtenstein and San Marino).
Area NOT protected from acidification (%)
Area NOT protected from eutrophication (%) country - CLmax(S) Ecoarea (km2) 1980 1990 2000 2010 country - CLnut(N) Ecoarea (km2) 1980 1990 2000 2010 AL 6,334 0.9 0.9 0.0 0.0 AL 6,334 100.0 100.0 100.0 99.9 AT 35,745 35.2 16.7 1.0 0.3 AT 35,745 99.8 99.8 97.2 87.8 BA 10,241 70.4 65.3 52.7 45.2 BA 10,241 99.9 99.9 99.7 99.6 BE 7,282 99.2 96.3 51.3 24.8 BE 7,282 97.5 97.1 95.1 93.8 BG 52,032 0.0 2.7 0.0 0.0 BG 52,032 100.0 100.0 99.0 99.3 BY 107,841 96.0 91.1 63.7 58.4 BY 107,841 75.8 76.0 58.6 59.9 CH 11,792 59.4 38.7 19.2 13.2 CH 22,790 91.4 90.9 81.6 71.8 CY 4,434 - - 0.0 0.0 CY 4,434 - - 89.1 89.0 CZ 11,178 99.4 99.3 78.6 47.1 CZ 11,178 100.0 100.0 99.5 98.6 DE 104,186 94.6 93.3 61.7 41.5 DE 104,186 99.0 98.7 97.6 96.8 DK 3,136 98.4 94.8 31.6 8.2 DK 3,136 100.0 100.0 93.8 85.4 EE 21,416 0.0 0.0 0.0 0.0 EE 22,377 99.9 99.8 45.2 34.0 ES 85,175 4.3 2.9 1.0 0.1 ES 85,175 72.2 82.3 87.9 81.6 FI 265,919 39.0 15.6 1.5 1.0 FI 239,507 77.1 74.7 36.0 28.3 FR 180,102 24.5 21.3 14.7 7.9 FR 180,102 98.4 98.6 97.9 97.2 GB 77,129 75.4 67.1 33.9 16.5 GB 73,649 40.9 35.9 28.5 24.0 GR 9,288 11.3 15.2 10.5 6.8 GR 9,288 100.0 100.0 100.0 100.0 HR 6,931 96.7 80.7 10.7 1.2 HR 7,009 75.3 68.8 52.5 44.0 HU 10,448 10.0 5.3 0.2 0.0 HU 10,448 100.0 100.0 98.5 87.5 IE 8,933 41.0 33.6 24.6 12.9 IE 8,933 86.7 86.1 88.3 85.1 IT 125,477 1.2 0.0 0.0 0.0 IT 125,477 76.9 78.1 71.3 65.1 LT 17,651 92.5 89.7 76.6 68.1 LT 17,651 100.0 100.0 100.0 100.0 LU 821 99.9 78.7 33.2 22.2 LU 821 100.0 100.0 100.0 100.0 LV 27,321 56.3 46.8 24.7 14.8 LV 27,321 100.0 100.0 97.9 96.4 MD 11,985 37.5 22.7 2.7 2.7 MD 11,985 0.2 0.2 0.1 0.1 MK 5,068 47.4 47.4 42.9 17.3 MK 5,068 100.0 100.0 100.0 100.0 NL 7,295 87.6 86.7 84.7 81.7 NL 4,334 98.1 98.1 94.3 90.5 NO 386,692 42.4 33.8 15.5 11.3 NO 317,025 10.5 9.7 3.1 1.5 PL 88,383 99.9 97.3 57.5 38.8 PL 88,383 99.5 99.3 97.8 97.0 PT 21,221 10.0 12.4 10.8 4.6 PT 21,221 81.9 92.4 94.4 92.1 RO 62,807 67.7 49.5 7.2 5.8 RO 62,807 100.0 100.0 99.1 99.5 RU 3,516,432 46.4 24.3 1.1 1.1 RU 3,516,432 19.0 21.7 11.2 12.4 SE 517,818 58.7 45.3 13.7 7.8 SE 223,771 56.6 55.1 17.6 10.3 SI 5,264 70.1 51.2 2.2 0.0 SI 5,264 100.0 100.0 100.0 100.0 SK 19,253 80.1 71.5 24.4 13.5 SK 19,253 100.0 100.0 100.0 99.6 UA 63,600 93.1 82.1 27.8 22.7 UA 63,600 100.0 100.0 100.0 100.0 YU 21,307 53.6 52.8 42.8 30.5 YU 21,307 100.0 100.0 100.0 100.0 EU25 1,654,876 48.6 38.7 17.8 11.0 EU25 1,328,936 80.5 80.4 65.2 60.5 CLRTAP 5,918,115 48.1 31.2 8.5 6.1 CLRTAP 5,533,584 38.2 39.9 28.5 28.0
1.7 Update of European critical loads of heavy metals3
A detailed description of the response by the National Focal Centres, of European maps on critical loads of cadmium, lead, and mercury as well as of preliminary exceedance maps can be found in a collaborative report between CCE and MSCE (Slootweg et al., 2005). The deadline of the call for data on critical loads of heavy metals was 31 December 2004. However, results were sent to the CCE until a few weeks before the CCE workshop and meeting of the Task Force of the ICP M&M (Berlin, 25-29 April 2005). Updates that were made following that meeting could not be incorporated in Slootweg et al. (2005). Therefore this section addresses issues and summarizes recent results that were compiled following these ICP meetings.
Table 1-3. Overview of the country response on the call for critical loads of cadmium, lead and mercury and the 5 effects.
Effect number* Cd Pb Hg Country Country code 1 2 3 4 1 3 4 1 3 5 Austria AT x x x x x x x Belarus BY x x Belgium BE x x x x x x x x x Bulgaria BG x x Cyprus CY x x x x x x Czech Republic CZ x x x Finland FI x France FR x x Germany DE x x x x x x x Italy IT x x Netherlands NL x x x x x Poland PL x x x Russia RU x x x x Slovakia SK x x x Sweden SE x x x x x Switzerland CH x x x x x Ukraine UA x x United Kingdom GB x x Total 18 10 5 14 1 10 14 1 5 7 3
*1 = protect ground water (human health); 2 = limit content in food (human health); 3 = protect micro-organism (terrestrial ecosystem health); 4 = protect algae (aquatic ecosystem health); 5 = content in fish (human health). See UBA (2004) and Slootweg et al. (2004) for details.
Belgium, the Czech Republic, Germany, Poland, Slovakia, Sweden and the Ukraine sent updated data to the CCE between 29 April 2005 and 15 May 2005. A summary of the final country participation is given in Table 1-3. Following a recommendation of the 21st Task Force meeting on Modelling and Mapping (Berlin, 28-29 April
2005) maps of critical loads should separate the protection against adverse health effects (effects 1, 2) from the protection against adverse ecosystem effects (effects 3 and 4). The result is shown in Figure 1-11 that gives the maps of critical loads of cadmium (top), lead (middle) and mercury (bottom) that will protect 95% of the ecosystems against adverse effects on human health (left) and on ecosystems (right). Figure 1-11 shows that ecosystem effects prevail as endpoint for critical loads that have been submitted.
3 Part of this work has benefited from help in kind from Germany in 2005 under MNP-CCE project M259101/02/ entitled “Support of reporting obligations
Furthermore, the meeting reviewed the use of the CCE background database (see Slootweg et al., 2005; chapter 3). In order to provide reliable effect-based information on the risk of air pollution impacts (exceedances) on a pan-European scale the need for a representative cover of Europe with critical loads for acidity, nutrient nitrogen and more recently heavy metals is considered a necessity.
g ha-1a-1 < 1 1 - 2 2 - 3 3 - 4 > 4
CL(Cd) (5th percentile) Human health (eff.1&2)
CCE/MNP g ha-1a-1 < 1 1 - 2 2 - 3 3 - 4 > 4
CL(Cd) (5th percentile) Ecosystem health (eff.3&4)
CCE/MNP g ha-1a-1 < 5 5 - 10 10 - 20 20 - 30 > 30
CL(Pb) (5th percentile) Human health (eff.1&2)
CCE/MNP g ha-1a-1 < 5 5 - 10 10 - 20 20 - 30 > 30
CL(Pb) (5th percentile) Ecosystem health (eff.3&4)
CCE/MNP g ha-1a-1 < 0.05 0.05 - 0.10 0.10 - 0.20 0.20 - 0.30 > 0.30
CL(Hg) (5th percentile) Human health (eff.1&2)
CCE/MNP g ha-1a-1 < 0.05 0.05 - 0.10 0.10 - 0.20 0.20 - 0.30 > 0.30
CL(Hg) (5th percentile) Ecosystem health (eff.3&4)
CCE/MNP
Figure 1-11. Maps of critical loads of cadmium (top), lead (middle) and mercury (bottom) that will protect 95% of the ecosystems against adverse effects on human health (left) and on ecosystems (right). Dark shaded areas indicate the occurrence of sensitive ecosystems.
Table 1-4 gives an overview of the percentage of national ecosystem areas that are at risk of health effects (effects 1 and 2) in countries that submitted critical loads of cadmium, lead and/or mercury. Table 1-5 gives an overview of the percentage of national ecosystem areas that are at risk of ecosystem effects (effects 3 and 4) in countries that submitted critical loads of cadmium, lead and/or mercury.
Table 1-4. Percentages of national ecosystem areas that are at risk of health effects in countries that submitted critical loads
of cadmium, lead and/or mercury.
Cadmium (Cd) Lead (Pb) Mercury (Hg)
Country Eco area (km2) at risk (%) 1990 at risk (%) 2000 Eco area (km2) at risk (%) 1990 at risk (%) 2000 Eco area (km2) at risk (%) 1990 at risk (%) 2000
AT 61,371 0.0 0.0 61,371 24.0 0.0 61,371 0.0 0.0 BE 5,228 0.0 0.0 5,228 62.3 18.2 5,228 22.7 6.1 BG 48,330 42.0 14.8 48,330 99.9 77.2 - - - CH 2,200 0.0 0.0 2,218 72.0 2.3 - - - CY 7,973 1.3 0.8 7,973 74.1 70.4 7,973 4.2 4.1 CZ 25,136 1.1 0.5 25,136 93.1 19.9 25,136 7.4 1.9 DE 290,003 1.4 0.1 290,003 79.0 7.4 290,003 17.9 4.8 NL 19,471 0.1 0.0 19,471 89.2 0.1 - - - RU 425,425 0.0 0.0 650,575 3.3 2.5 - - - SE 22,050 0.0 0.0 - - - - UA 18,002 0.0 0.0 18,002 91.6 41.4 - - - EU25 431,232 1.1 0.1 409,182 71.8 8.1 389,711 14.2 3.9 Europe 925,190 2.7 0.8 1,128,308 33.8 8.3 389,711 14.2 3.9
Table 1-5. Percentages of national ecosystem areas that are at risk of ecosystem effects in countries that submitted critical
loads of cadmium, lead and/or mercury.
Cadmium (Cd) Lead (Pb) Mercury (Hg)
Country Eco area (km2) at risk (%) 1990 at risk (%) 2000 Eco area (km2) at risk (%) 1990 at risk (%) 2000 Eco area (km2) at risk (%) 1990 at risk (%) 2000
AT 61,371 0.0 0.0 61,371 48.7 11.1 32,601 39.2 11.7 BE 5,237 0.0 0.0 5,237 63.0 12.8 5,228 100.0 83.5 BY 121,128 9.1 0.1 121,128 100.0 10.2 - - - CH 9,411 0.0 0.0 9,393 99.0 24.1 11,611 80.2 44.4 CY 7,973 0.0 0.0 7,973 80.9 78.4 - - - DE 290,003 0.1 0.0 290,003 83.8 9.0 99,866 97.0 59.8 FR 170,638 0.1 0.0 170,638 93.7 9.8 - - - GB 50,075 0.5 0.0 50,075 25.9 6.0 - - - IT 278,128 0.0 0.0 278,128 0.3 0.0 - - - NL 22,314 0.0 0.0 22,314 98.4 21.5 - - - PL 88,383 0.5 0.0 88,383 73.5 14.7 88,383 100.0 99.9 RU 1,393,300 1.1 0.2 1,194,125 70.8 51.0 - - - SE 151,432 0.0 0.0 151,432 60.5 1.9 152,074 56.0 22.9 SK 19,253 2.6 1.1 19,253 52.3 22.6 19,253 99.0 65.3 EU25 1,144,807 0.1 0.0 1,144,807 56.3 7.4 397,405 77.4 51.2 Europe 2,668,646 1.0 0.1 2,469,453 65.7 28.7 409,016 77.4 51.0
Tables 1-4 and 1-5 show that the risks of effects of lead are more widespread than those of cadmium. Comparison of Tables 1-4 and 1-5 also reveals that the area of excess deposition of Pb in 2000 is strongly reduced in
comparison to 1990. In Europe 33.8 % of the ecosystem area in 1990 is subjected to excess deposition of Pb for human health effects, which is reduced to 8.3% in 2000 (see Table 1-4). The risk for ecosystem effects of Pb in 1990 and 2000 is 65.7% and 28.7%, respectively (see Table 1-5).
To ensure this, the use of a European background database containing relevant European forest soil information was used in the past for countries that never submitted critical loads data on acidity and nutrient nitrogen. In the nineties critical loads for other air pollution compounds were not computed yet. The use of these background data, noted by the Task Force on Mapping already in 1993 (EB.Air/WG.1/R.85 paragraphs 5 and 26) has led to
European maps of critical loads that were approved by the WGE since 1994. Critical load maps, based on national contributions and background data when national data were not available, have then been used in the support of
the assessment of areas at risk during negotiations of the 1994 Oslo protocol (only sulphur) and the 1999 Gothenburg protocol.
This historic practice regarding the use of the European background database has also been the guiding principle for the CCE to compile a European background data base of critical loads of heavy metals. The result is shown in Figure 1-12. Areas that are sensitive for cadmium (top left) are generally located in the south of Europe. Areas that are most sensitive to lead (top right) are in the north, while the risk of mercury (bottom left) turns out to be widespread with particularly sensitive areas in the north of Europe. The Task Force recommended using the European Background database for the assessment of exceedances in countries that did not submit data and do not object to this. In this section, the risk of heavy metal deposition is only computed for countries that submitted data. This is reflected in Tables 1-4 and 1-5.
g ha-1a-1 < 1 1 - 2 2 - 3 3 - 4 > 4
CL(Cd) (5th percentile) EU-DB: Forests/Effect 3
CCE/MNP g ha-1a-1 < 5 5 - 10 10 - 20 20 - 30 > 30
CL(Pb) (5th percentile) EUDB: Forests/Effect 3
CCE/MNP g ha-1a-1 < 0.05 0.05 - 0.10 0.10 - 0.20 0.20 - 0.30 > 0.30
CL(Hg) (5th percentile) EU-DB: Forests/Effect 3
CCE/MNP
Figure 1-12. The 5th percentile map of critical loads for forest soils of cadmium (top left), lead (top right) and mercury
based on the CCE European background database (see Slootweg et al., 2005, chapter 3).
1.8 Conclusions
In 2005 fourteen parties under the LRTAP Convention submitted updated data on critical loads of acidity and of nutrient-N, while 13 countries (10 EU countries) provided dynamic modelling data for acidification. Including results of 2004 dynamic modelling data are available for 14 parties under the Convention (11 EU Member States). Critical load exceedances were computed with depositions computed with the EMEP Unified Model. Results reveal that still 8.5% of the ecosystem area in pan-Europe and 17.8% in the EU25 are still at risk of acidification in 2000. For eutrophication the risk stretches over an even larger area covering 28.5% and 65.2%, respectively. Dynamic modelling of the risk for acidification indicates that about 95% of the ecosystems concerned could
recover already in 2030 if acid deposition is sufficiently reduced in 2020. This does include ecosystems for which acid deposition needs to be reduced below critical loads. It is recommended that dynamic modelling should be carried out for the remaining unprotected pan-European area for which results are not yet available to identify areas that can become protected in one of the target years. The persisting high exceedances of critical loads for eutrophication point to the requirements of using dynamic models to improve knowledge on time delays of damage and recovery.
Critical loads for cadmium, lead and mercury were successfully computed and mapped by 18 Parties of the LRTAP Convention. Critical loads for cadmium, lead and mercury were computed by 17, 17 and 10 countries, respectively. The methodology that was recommended in the call for data was carefully reviewed and documented in the Mapping Manual of the ICP on Modelling and Mapping (UBA, 2004). The methodology enabled the assessment of ecosystem specific critical loads to protect human or environmental health. These critical loads were compared to preliminary computations of ecosystem specific deposition of the respective metals in 1990 and 2000. The robustness of deposition results can not yet well be established due to the uncertainty of reported emissions. Bearing these uncertainties in mind, it is shown that atmospheric deposition of cadmium does not cause widespread risk in 2000, that the risk of lead deposition decreases since 1990 but is still widespread in 2000 and, finally, that the risk caused by mercury remains important without much change throughout the years in most of the countries that provided data on mercury.
References
EMEP (1998) Transboundary acidifying air pollution in Europe, MSC-W Status Report 1998 – Parts 1 and 2. EMEP/MSC-W Report 1/98, Norwegian Meteorological Institute, Oslo, Norway
Hettelingh J-P, Posch M, Slootweg J (2004) Status of European critical loads and dynamic modelling, in: Hettelingh JP, Posch M, Slootweg J (eds.), Critical loads and dynamic modelling results, CCE Progress Report, 2004. RIVM Report 259101014, Bilthoven, The Netherlands, pp .9-20, www.mnp.nl/cce Posch M, Hettelingh J-P, Slootweg J (eds) (2003) Manual for dynamic modelling of soil response to atmospheric deposition. Coordination Center for
Effects, RIVM Report 259101012, Bilthoven, Netherlands, pp.71 www.mnp.nl/cce
Posch M, Hettelingh J-P, De Smet PAM (2001) Characterization of critical load exceedances in Europe. Water Air Soil Pollut. 130: 1139-1144. Schöpp W, Posch M, Mylona S, Johansson M (2003) Long-term development of acid deposition (1880–2030) in sensitive freshwater regions in Europe.
Hydrol Earth Syst Sci 7: 436–446
Simpson D, Fagerli H, Jonson JE, Tsyro S, Wind P, Tuovinen, JP (2003) Transboundary Acidification Eutrophicationand Ground Level Ozone in Europe, Part 1 Unified EMEP Model Description, EMEP Status Report 2003, EMEP-Report 1/2003-PART I, Norwegian Meteorological Institute, Oslo, Norway
Slootweg J, Hettelingh JP, Posch M, Dutchak SV, Ilyin I (eds.) (2005) Critical loads of cadmium, lead and mercury in Europe. MNP-Report 259101015, RIVM, Bilthoven, The Netherlands, www.mnp.nl/cce
Tarrasón L, Jonson JE, Fagerli H, Benedictow A, Wind P, Simpson D, Klein H (2003) Transboundary Acidification Eutrophication and Ground Level Ozone in Europe, Part III: Source-receptor relationships. EMEP Report 1/2003-PART III, Norwegian Meteorological Institute, Oslo, Norway
UBA (2004) Manual on methodologies and criteria for modelling and mapping critical loads & levels and air pollution effects, risks and trends. UNECE Convention on Long-range Transboundary Air Pollution, Federal Environmental Agency (Umweltbundesamt), Berlin www.icpmapping.org
2. Summary of National Data
Jaap Slootweg, Maximilian Posch, Maarten van ’t Zelfde* *Institute of Environmental Sciences (CML), Leiden, the Netherlands 2.1 Introduction
The Working Group on Effects (WGE) ‘… approved calls for data for … critical loads of acidification and eutrophication and target loads (in early 2005)’ (EB.AIR.WG.1.2004.2.e). In this call, with a deadline of 28 February 2005, the Coordination Center for Effects (CCE) requested National Focal Centres (NFCs) to submit data with only a few changes/additions since the previous call (compare with Hettelingh et al., 2004); inter alia: • The implementation year changed from 2015 to 2020;
• The values of several output variables from dynamic modelling for 5 key years and 2 different scenarios (‘Gothenburg’ and ‘Background’) were requested;
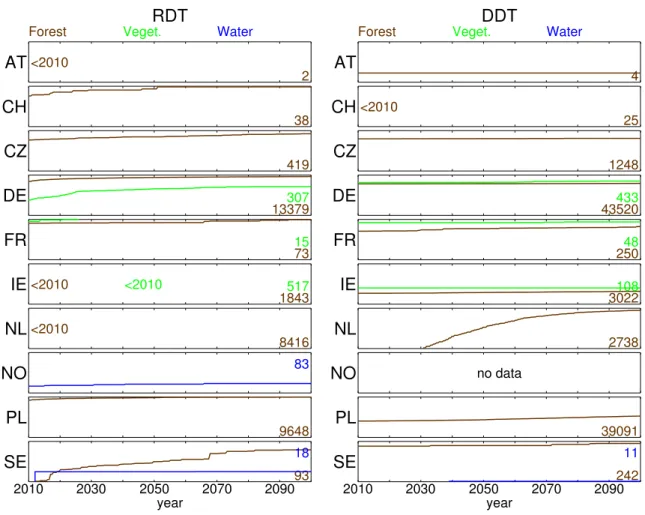
• The computation of Damage Delay Times (DDT) and Recovery Delay Times (RDT) was requested; • Updated software provided by the CCE enabled NFCs to perform consistency checks on their data before
submission.
The full text of the ‘Instructions for Submitting Critical Loads and Dynamic Modelling Data’, which was sent to the NFCs with the call for data, is reproduced in Appendix A.
This Chapter reports on the results of the call for data (critical loads and dynamic modelling results) and shows statistical analyses of some of the most interesting variables.
2.2 National responses
A total of 14 countries updated their critical loads (CLs), and all except one also updated and extended their dynamic modelling (DM) results. Of these, the Czech Republic, Ireland and Switzerland submitted DM data for the first time. Altogether, critical load data are now available from 25 NFCs, and from these 14 have provided dynamic modelling results. Table 1-1 in Chapter 1 shows the most recent submission date for each NFC. Table 2-1 shows details about the 2-14 submissions following this call for data. The table lists the number of records and the total area covered for each ecosystem type. The EUNIS ecosystem classification system was applied by all countries, and for this overview the numbers are aggregated to EUNIS level 1.
Table 2-1. Type and number of ecosystem records for which data were provided in this call for data.
Acidity CLs Nutrient N CLs Dynamic Modelling Country Country Area
(km2)
EUNIS
level 1 # ecosyst Area (km2) # ecosyst Area (km2) # ecosyst Area
(km2) Austria 83,858 Forest 496 35,745 496 35,745 496 35,745 Belarus 207,595 Forest 8,631 93,305 8,631 93,305 Grassland 1,779 15,257 1,779 15,257 Wetlands 100 773 100 773 total 10,510 109,334 10,510 109,334 Bulgaria 110,994 Forest 87 52,032 87 52,032 83 47,887
Czech Republic 78,866 Forest 2,257 11,178 2,257 11,178 2,257 11,178
France 543,965 Forest 3,840 170,657 3,840 170,657 3,840 170,657 Grassland 81 1,580 81 1,580 80 1,553 Wetlands 67 5,123 67 5,123 67 5,123 Other 156 2,741 156 2,741 156 2,741 total 4,144 180,102 4,144 180,102 4,143 180,074 Germany 357,022 Forest 100,954 100,954 100,954 100,954 100,954 100,954 Grassland 1,520 1,520 1,520 1,520 1,520 1,520 Shrub 310 310 310 310 310 310
Acidity CLs Nutrient N CLs Dynamic Modelling Country Country Area
(km2)
EUNIS
level 1 # ecosyst Area (km2) # ecosyst Area (km2) # ecosyst Area
(km2) Wetlands 1,195 1,195 1,195 1,195 1,195 1,195 Other 2,16 216 216 216 216 216 total 104,195 104,195 104,195 104,195 104,195 104,195 Ireland 70,273 Forest 17,242 4,254 17,242 4,254 17,242 4,254 Grassland 6,895 2,050 6,895 2,050 6,895 2,050 Shrub 6,847 2,631 6,847 2,631 6,847 2,631 total 30,984 8,936 30,984 8,936 30,984 8,936 Italy 301,336 Forest 714 89,560 714 89,560 714 89,560 Grassland 185 23,027 185 23,027 185 23,027 Shrub 210 12,822 210 12,822 210 12,822 Water 1 6 1 6 1 6 Other 19 463 19 463 19 463 total 1,129 125,878 1,129 125,878 1,129 125,878 Netherlands 41,526 Forest 90,155 5,635 42,686 2,668 76,222 4,764 Grassland 14,112 880 14,112 880 10,135 633 Shrub 5,675 355 5,675 355 5,540 346 Wetlands 1,637 104 1,637 104 1,101 69 Water 417 5 Other 5,148 322 5,148 322 3,839 240 total 116,727 7,295 69,675 4,334 96,837 6,052 Norway 323,759 Forest 662 67,011 Water 2,324 322,150 131 20,535 Other 35,418 318,762 total 2,986 389,161 35,418 318,762 131 20,535 Poland 312,685 Forest 88,383 88,383 88,383 88,383 88,383 88,383 243,307 Forest 150,208 19,748 151,815 19,896 Grassland 99,451 20,010 119,062 21,897 Shrub 78,550 24,669 78,985 24,785 Wetlands 18,682 5,455 19,079 5,506 Water 1,717 7,790 320 1,190 United Kingdom Other 10,299 2,119 41,285 Forest 260 11,612 9,886 9,886 260 11,612 Grassland 9,488 9,488 Shrub 1,640 1,640 Wetlands 1,727 1,727 Water 100 180 49 49 Switzerland total 360 11,792 22,790 22,790 260 11,612 449,964 Forest 25,442 225,264 25,442 225,264 542 24,400 Water 3,084 284,819 234 6,724 Sweden total 28,526 510,084 25,442 225,264 776 31,124 Grand Total 3,166,435 739,392 1,711,786 774,750 1,361,137 329,994 672,790
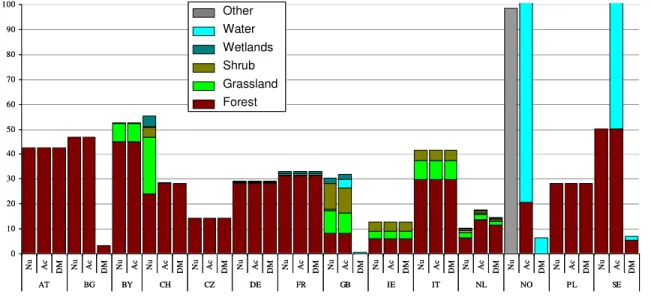
Figure 2-1 shows the same information in the form of bar charts, with the coverage of the different ecosystems relative to the total country area. The figure clearly shows that forests are the most widely used ecosystem, and that dynamic modelling is sometimes applied to a subset only, for which enough input data are available at a national scale.
0 10 20 30 40 50 60 70 80 90 100 N u A c D M Nu Ac DM uN Ac Nu Ac DM uN Ac DM Nu Ac DM Nu Ac DM Nu cA DM Nu Ac DM Nu Ac DM Nu Ac DM Nu Ac DM Nu Ac DM Nu Ac DM AT BG BY CH CZ DE FR GB IE IT NL NO PL SE Other Water Wetlands Shrub Grassland Forest Other Water Wetlands Shrub Grassland Forest 0 10 20 30 40 50 60 70 80 90 100 N u A c D M Nu Ac DM uN Ac Nu Ac DM uN Ac DM Nu Ac DM Nu Ac DM Nu cA DM Nu Ac DM Nu Ac DM Nu Ac DM Nu Ac DM Nu Ac DM Nu Ac DM AT BG BY CH CZ DE FR GB IE IT NL NO PL SE Other Water Wetlands Shrub Grassland Forest Other Water Wetlands Shrub Grassland Forest
Figure 2-1. National distributions of ecosystem types for which data have been submitted for acidification (Ac), eutrophication (Nu) and dynamic modelling (DM).
The spatial coverage of Europe with critical load and dynamic model calculations can be seen in Figure 2-2 for all 25 NFCs. It shows that the dynamic modelling effort is concentrated in areas with the highest CL exceedances (mainly central and north-western Europe).
CLs only DynMod +TL calcs
CCE/MNP
Figure 2-2. Map displaying the EMEP50 grid cells for which critical loads have are available from national submissions (25 NFCs). Coloured (green and red) cells indicate that also dynamic modelling has been performed (for at least one ecosystem); red cells that also target loads have been calculated.
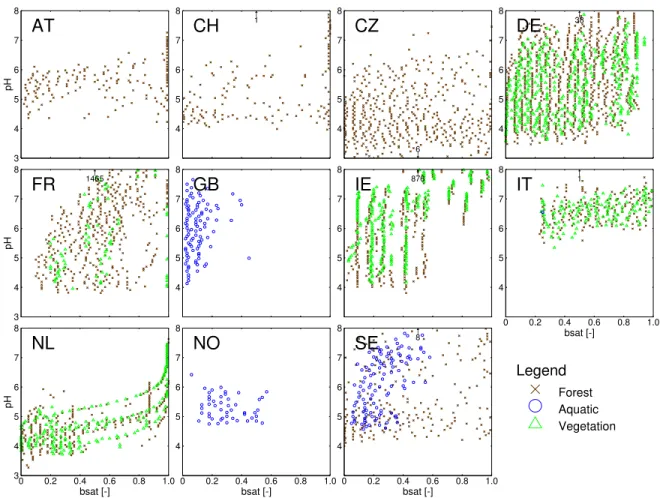
A key quantity in determining a critical load is the chemical criterion linking soil (water) chemistry to the ‘harmful effects on specified sensitive elements of the environment’. Figure 2-3 summarizes the critical values that NFCs selected in their critical load calculation. The area plotted is relative to the total area of all submitted ecosystems with a maximum critical load for sulphur. Not plotted are the following criteria:
• [ANC], which has been used for all aquatic ecosystems;
‘Other’ or ‘missing’ criteria. An increasing number of ecosystems is considered to be limited by different, or a combination of two or more criteria.
Al:Bc ratio (or Bc:Al ratio)
0% 20% 40% 60% 80% 100% AT BG CH CY CZ DE FI FR HU IT NL SE Other Water Wetlands Shrub Grassland Forest Other Water Wetlands Shrub Grassland Forest [Al] 0% 20% 40% 60% 80% 100% CZ DE PL pH 0% 20% 40% 60% 80% 100% BG DE FR GB IE Bc:H ratio 0% 20% 40% 60% 80% 100% DE GB
Figure 2-3. Area, relative to the total area of submitted ecosystems for acidity, for a selection of chemical criteria, broken down by ecosystem types.
2.3 Critical load maps and distributions
All 2005 national submissions contained critical loads for nutrient nitrogen, CLnut(N). Figure 2-4 shows the
critical load in two ways. On the left are maps of CLnut(N) for the 5th, 25th, and 50th percentile in the 50×50 km
EMEP grid cells, and on the right the cumulative distribution functions for each country, separately for 3 ecosystem classes, are plotted. The black dashed line, with the legend ‘EU-DB’, gives the distribution of CLnut(N) as computed with the European background database held at the CCE. This dataset is described in Chapter 4. EU-DB contains only data on forests, and thus only the national contribution for forest (the brown line) should be compared with it. The numbers at the right of the CDFs is the number of ecosystem records for the indicated ecosystem type.
Most of the sensitive areas in the 5th percentile also show sensitive in the 25th and even in the map showing the
median values. The CDFs show relatively steep functions, also demonstrating this phenomenon. This means that reductions in these areas, if exceeded, are likely to be efficient. The 5th percentile is also shown in Figure 1-3
(Chapter 1), where it is mapped next to the 5th percentile for subsets of ecosystem types: forests, (semi-) natural
eq ha-1a-1 < 200 200 - 400 400 - 700 700 - 1000 1000 - 1500 > 1500 CLnut(N) (5th perc.) CCE/MNP eq ha-1a-1 < 200 200 - 400 400 - 700 700 - 1000 1000 - 1500 > 1500 CLnut(N) (25th perc.) CCE/MNP eq ha-1a-1 < 200 200 - 400 400 - 700 700 - 1000 1000 - 1500 > 1500 CLnut(N) (50th perc.) CCE/MNP
AT
BG
BY
CH
CZ
DE
FR
GB
IE
IT
NL
NO
PL
SE
CLnut(N)
0 400 800 1200 1600 2000 eq ha-1a-1Forest Veget. Water EU-DB
496 87 8631 1879 12855 9886 49 2257 3241 100954 304 3840 227425 151815 17242 13742 4141 714 26572 42686 417 35418 88383 25442
Figure 2-4. Critical loads of nutrient nitrogen from the 14 NFCs which responded to the last call The EMEP50 maps of the
5th, 25th and 50th percentile on the left and the cumulative distributions for 3 ecosystem classes on the right
eq ha-1a-1 < 200 200 - 400 400 - 700 700 - 1000 1000 - 1500 > 1500 CLmax(S) (5th perc.) CCE/MNP eq ha-1a-1 < 200 200 - 400 400 - 700 700 - 1000 1000 - 1500 > 1500 CLmax(S) (25th perc.) CCE/MNP eq ha-1a-1 < 200 200 - 400 400 - 700 700 - 1000 1000 - 1500 > 1500 CLmax(S) (50th perc.) CCE/MNP
AT
BG
BY
CH
CZ
DE
FR
GB
IE
IT
NL
NO
PL
SE
CLmax(S)
0 400 800 1200 1600 2000 eq ha-1a-1Forest Veget. Water EU-DB
260 100 2257 3241 100954 304 3840 196683 150208 1717 17242 13742 414 >2000 1 714 90155 26572 663 2324 88383 25442 3143 496 >2000 87 8631 1879
Figure 2-5. Maximum critical loads of sulphur from the 14 NFCs which responded to the last call The EMEP50 maps of the
5th, 25th and 50th percentile on the left and the cumulative distributions for 3 ecosystem classes on the right
(EU-DB=European background data base).
In Figure 2-5 the same maps and functions are displayed for the maximum critical load of sulphur, CLmax(S),
chosen as a representative quantity for the acidity critical load function. The Figure shows that the ecosystems most sensitive to acidification are mostly located in the Nordic countries and Scotland.
Finally, in Figure 2-6 these maps and functions are shown for the minimum critical load of N, CLmin(N). This
quantity, which also is part of the critical load function of acidity, is (in most cases) the sum of net N uptake by vegetation and the long-term immobilisation of N. The maps and graphs show that this quantity has a much more narrow distribution than CLmax(S).
eq ha-1a-1 < 200 200 - 400 400 - 700 700 - 1000 1000 - 1500 > 1500 CLmin(N) (5th perc.) CCE/MNP eq ha-1a-1 < 200 200 - 400 400 - 700 700 - 1000 1000 - 1500 > 1500 CLmin(N) (25th perc.) CCE/MNP eq ha-1a-1 < 200 200 - 400 400 - 700 700 - 1000 1000 - 1500 > 1500 CLmin(N) (50th perc.) CCE/MNP
AT
BG
BY
CH
CZ
DE
FR
GB
IE
IT
NL
NO
PL
SE
CLmin(N)
0 400 800 1200 1600 2000 eq ha-1a-1Forest Veget. Water EU-DB
496 87 8631 1879 260 100 2257 3241 100954 304 3840 196683 150586 1717 17242 13742 4141 714 90155 26572 663 2324 88383 25442 3143
Figure 2-6. Minimum critical load of nitrogen from the 14 NFCs which responded to the last call The EMEP50 maps of the
5th, 25th and 50th percentile on the left and the cumulative distributions for 3 ecosystem classes on the right
(EU-DB=European background data base).
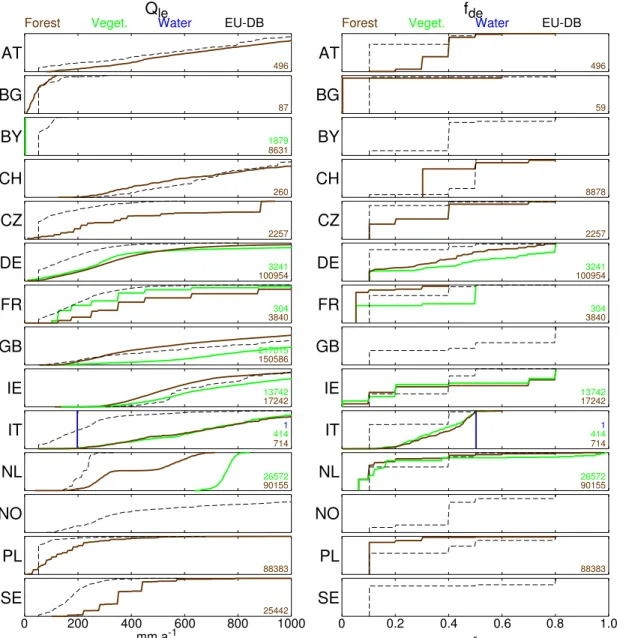
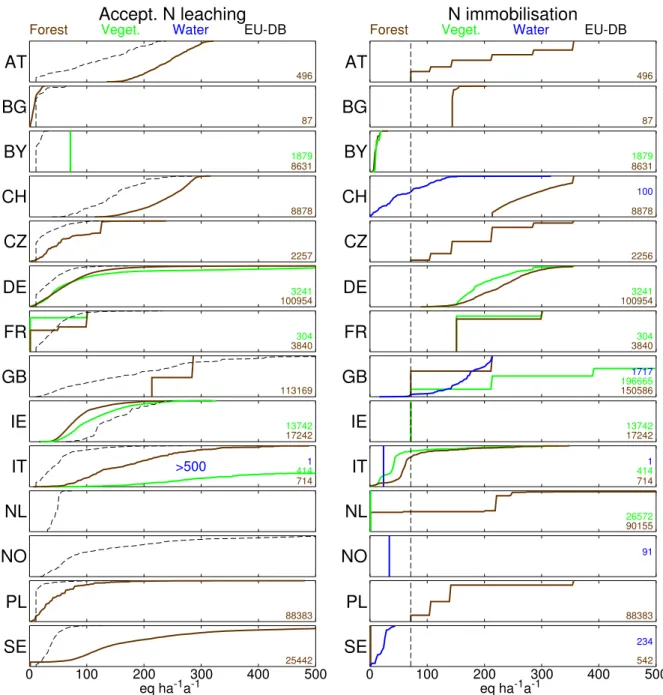
2.4 Input variables for critical loads and dynamic modelling
The soil and other site specific parameters, which are used in critical load and dynamic model calculations, have been asked in the call for data to enable consistency checks and inter-country comparisons. In most cases the differences between counties can easily be explained, and it is the hope of the CCE that some differences or peculiarities in distributions shown in this section may lead to improvements in future data submissions. Important element fluxes in the Simple Mass Balance (SMB) model are weathering, leaching, uptake and N