European Environmental Priorities: an Integrated Economic and Environmental Assessment
199
0
0
Hele tekst
(2) 2. European Environmental Priorities. Abstract The economic assessment of priorities for a European environmental policy plan focuses on twelve identified prominent European environmental issues such as climate change, chemical risks and biodiversity. The study, commissioned by the European Commission (DG Environment) to a European consortium led by the RIVM, provides a basis for priority setting for European environmental policy planning in support of the sixth Environmental Action Programme. This programme follows up the current fifth Environmental Action Programme called ‘Towards Sustainability’. The analysis is based on an examination of the cost of avoided damage, environmental expenditures, risk assessment, public opinion, social incidence and sustainability. The study incorporates information on targets, scenario results, and policy options and measures, including costs and benefits. The following main conclusions emerged from the results. According to current trends, the European Union will be successful in reducing pressures on the environment if all existing policies are fully implemented and enforced. However, damage to human health and ecosystems can be substantially reduced with accelerated policies. The implementation costs of these additional policies will not exceed the environmental benefits and the impact on the economy will be manageable. This means that future policies will have to focus on least-cost solutions and follow an integrated approach. Nevertheless, these policies will not be adequate for achieving all policy objectives. The major problems remaining are the excess load of nitrogen in the ecosystem, exceedance of air quality guidelines (especially for particulate matter), noise nuisance and biodiversity loss..
(3) European Environmental Priorities. 3. Acknowledgements The Environment Directorate General of the European Commission has launched this study that started in 1997. The scenario computations have been finalised in September 1999. The primary aim of the study was to provide, from a welfareeconomic perspective, priorities for different policy targets and policy options in a new European Environmental Action programme (the sixth EAP). To succeed a complex and difficult project such as this, a consortium with economic and environmental expertise was created. The core team of this consortium included the following institutes and individuals: • • • •. National Institute of Public Health and Environment (RIVM, the Netherlands): Prof. Jean-Paul Hettelingh (project manager in 1997 and 1998); Keimpe Wieringa (project manager from 1999); Bronno de Haan; Bart Strengers; Economics for the Environment (EFTEC, UK): Prof. David Pearce; Alexandra Howarth; National Technical University of Athens (E3Mlab of ICCS-NTUA, Greece): Prof. Pantelis Kapros and Leonidas Mantzos; International Institute for Applied Systems Analysis (IIASA, Austria): Janusz Cofala.. The study is the result of the efforts and contributions of many, both within and outside the consortium, including: Markus Amann (IIASA), Bert Bannink (RIVM), Arthur Beusen (RIVM), Gert-Jan van den Born (RIVM), Ben ten Brink (RIVM), Floor Brouwer (LEI), Fiammetta Cocuzza (EFTEC), Hans Eerens (RIVM), Christian Fischer (EEA-ETC/Waste), Tannis Hett (EFTEC), Camiel Heunks (RIVM), Chris Heyes (IIASA), Kees Klein Goldewijk (RIVM), Guus de Hollander (RIVM), Jochem Jantzen (TME), Zbigniew Klimont (IIASA), Peter Kristensen (NERI), Conchi Lallana (WRi), Fred Langeweg (RIVM), Johan Lembrechts (RIVM), Ece Ozdemiroglu (EFTEC), Addo van Pul (RIVM), Tinus Pulles (TNO), Paul Rump, Coen Sedee (TME), Harry Slaper (RIVM), Rob Sluyter (RIVM), Winand Smeets (RIVM), Dan Varey (EFTEC), Guus Velders (RIVM), Antoon Visschedijk (TNO), Arnold van Vliet (RIVM), Detlef van Vuuren (RIVM), Mrs. Marianne Weismann (RIVM), Jaap van Woerden (RIVM), Mrs. Ruth de Wijs (RIVM). A critical review of the results was performed throughout the study. The Peer Review group has met four times during the course of the project. This group consisted of Jose Carbajo (European Bank for Reconstruction and Development, UK), Frank Convery (University College Dublin, Ireland), Sylvie Faucheux (University of Versailles, France), Rui Ferreira dos Santos (DCEA, Portugal), Wim Hafkamp (Eramus University the Netherlands), Angela Köppl (Austrian Institute of Economic Research, Austria), Alberto Majocchi (University of Pavia, Italia), Thorvald Moe (OECD, France), Tomas Otterstrom (Ekono Energy, Finland), Domenico Siniscalo (Fondazione Eni Enrico Mattei, Italy), Mikael Skov Andersen (CESAM, Danmark), Rolf-Ulrich Sprenger (IFO, Germany), Thomas Sterner (Dept. of Economics and.
(4) 4. European Environmental Priorities. commercial law, Sweden), Aviel Verbruggen (University of Antwerpen, Belgium), Tomasz Zylicz (Warsaw University, Poland). The team worked closely together with the European Environment Agency (EEA) in order to exchange data and scenario results. Our liaison officer in Copenhagen was Mrs. Teresa Ribeiro. The second interim report of the study was delivered to the EEA in 1998 to provide scientific support to the 1999 report Environment in the European Union at the turn of the century. The study was co-ordinated by the Environment Directorate-General of the European Commission. The Consortium benefited from the contacts and meetings with Marco Berti, Jos Delbeke, Rob Donkers, Kevin Flowers, Ger Klaassen, Matti Vainio and Marc Vanheukelen, all in the Environment DG..
(5) European Environmental Priorities. 5. CONTENTS 1. Summary and Conclusions 1.1. Main Findings 1.1.1. Are current policies adequate 1.1.2. What can technology contribute to closing the gap 1.1.3. Are the environmental policy targets achievable 1.1.4. Are the new targets economically reasonable 1.1.5. What are the key policy responses 1.1.6. Spillovers 1.1.7. EU Enlargement 1.2. Findings per Environmental Issue 1.2.1. Global Environmental Issues 1.2.2. Continental Environmental Issues 1.2.3. Regional and Local Environmental Issues 1.2.4. Cross-sectional Environmental Issues. 2. Introduction 2.1. Environmental Problems of Europe 2.2. Study Objectives. 3. Environmental Results 3.1. Socio-economic Developments 3.2. Global Environmental Issues 3.2.1. Stratospheric ozone depletion 3.2.2. Climate change 3.3. Continental Environmental Issues 3.3.1. Nuclear accidents 3.3.2. Acidification and eutrophication 3.3.3. Tropospheric ozone 3.3.4. Chemicals and particulate matter 3.4. Regional and Local Environmental Issues 3.4.1. Water Quantity and Quality 3.4.2. Coastal zones 3.4.3. Waste Management 3.4.4. Soil degradation 3.5. Cross-sectional Environmental Issues 3.5.1. Biodiversity 3.5.2. Human health, air quality and noise 3.6. Summarising the Results. 9 9 10 11 13 14 15 16 18 19 19 22 28 31 33 33 34 39 39 44 44 45 54 54 55 63 67 75 75 79 82 86 88 88 92 99.
(6) 6. European Environmental Priorities. 4. Economic Appraisal 4.1. Macroeconomic assessment 4.1.1. Macroeconomic Implications of the Technology Driven scenario 4.1.2. Macroeconomic Implications of the Accelerated Policy scenarios 4.1.3. Summarising the results 4.2. Benefits 4.2.1. Accelerated Policy scenario 4.2.2. Technology driven scenario 4.2.3. Total benefit estimates 4.3 Cost benefit assessment 4.3.1. Benefit cost ratios 4.3.2. Environmental issues recommended for further control 4.3.3. The remaining environmental problems. 5. Policy Responses 5.1. Policies 5.2 Environmental issues with AP scenarios: policy package 5.3. Remaining evironmental issues 5.4. Distributional impact 5.5. Subsidairity 5.6. Menu of key policy initiatives. 6. Methodology and Approach 6.1. DPSIR analysis 6.2. Scenarios, targets, and projections 6.3. Economic appraisel 6.4. Consortium expertise and role 6.5. Information gaps and uncertainties. 105 105 106 108 112 115 115 124 126 127 127 133 136 139 139 142 152 159 162 164 167 167 169 172 175 177. Acronyms and abbreviations. 181. References. 183. Appendix A Overview scenario results and targets 189 Appendix B Overview EU-legislation: Policies in place and in the Pipeline 193.
(7) European Environmental Priorities. Technical Reports (published separately) 1. Stratospheric Ozone Depletion 2. Climate Change 3. Nuclear Accidents 4. Acidification, Eutrophication and Tropospheric Ozone 5. Chemicals, particulate matter and human health, air quality and noise 6. Water Quantity and Quality 7. Waste management 8. Soil Degradation 9. Biodiversity 10. Methodology Cost Benefit Analysis and Policy Responses 11. Socio-Economic Trends, Macro-Economic Impacts and Cost Interface 12. Enlargement. 7.
(8) 8. European Environmental Priorities.
(9) European Environmental Priorities. 1. Summary and Conclusions. 1.1. Main findings. 9. Current trends show that if all existing policies are fully implemented and enforced, the European Union will be successful in reducing pressures on the environment. However, damage to human health and ecosystems can be substantially reduced with accelerated policies. The implementation costs of these additional policies will not exceed the environmental benefits and the impact on the economy is manageable. This requires future policies to focus on least-cost solutions and follow an integrated approach. Nevertheless, these policies will not be adequate for achieving all policy objectives. Remaining major problems are the excess load of nitrogen in the ecosystem, exceedance of air quality guidelines (especially particulate matter), noise nuisance and biodiversity loss. For climate change, the development of a policy strategy for the period after the year 2010 will become crucial, as further emission reductions are necessary and low-cost solutions will be exhausted. EU enlargement will alleviate some of the environmental problems and increase total benefits. However, enlargement may also add to environmental problems if, for example, perverse EU subsidy regimes are extended to Accession countries. These main findings represent the major conclusions of an assessment of the current trends and future policy priorities in the European Union (EU) carried out by a Study Consortium in commission by the European Commission. The report represents a component in the preparation of a new Environmental Action Programme, the successor to the 1992 EC Programme of Policy and Action in Relation to the Environment and Sustainable Development ‘Towards Sustainability’, the so-called Fifth Environmental Action Programme (5th EAP). The 5th EAP was built on the following: • Environmental considerations were to become central to the formulation and implementation of both macroeconomic and sectoral policies (integration); • To this end, new policy instruments for the achievement of convergence between economic and environmental objectives were to be utilised. The current assessment acknowledges these themes and also relies on the next: • The balance between economic and environmental considerations should be central to new environmental and sectoral policies; • New policies should address the underlying causes of environmental problems such as market, institutional and information failures and • Policy implementation costs should not exceed environmental benefits. To support the preparation of the next EAP, an economic and environmental analysis was carried out on the future priorities of European environmental policies. This analysis looked at environmental trends, persistency of problems and their underlying causes, definition of new policy targets, robustness of policy responses, environmental expenditures, monetary damage, monetary benefits, efficiency, effectiveness, risk assessment and macro-economic impacts..
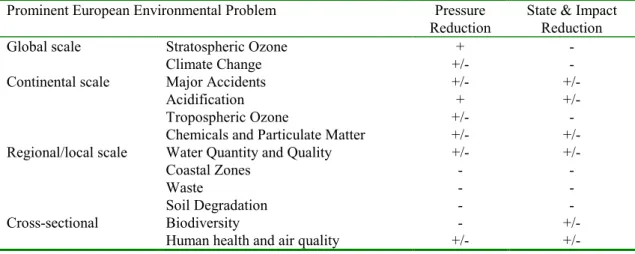
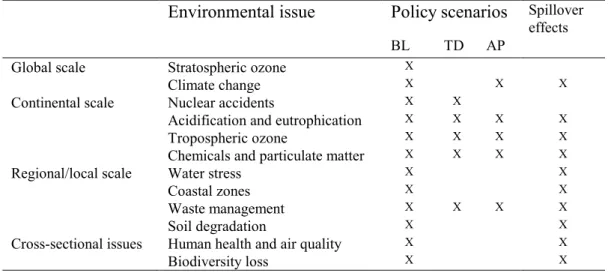
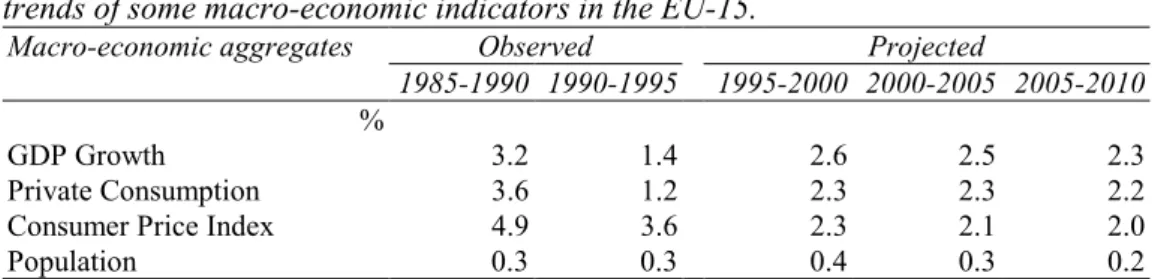
(10) 10. European Environmental Priorities. The study undertaken has addressed the following five key questions: 1. Are current policies adequate? 2. What can technology contribute to solving the policy gaps as identified? 3. Are the new targets chosen for this study achievable? 4. If so, are these targets economically reasonable? 5. What policy responses and instruments can be recommended?. 1.1.1. Are current policies adequate?. A Baseline scenario has been constructed to assess the adequacy of current 5EAP policies and to identify remaining problems. This scenario has been derived in close co-operation with the European Environment Agency (EEA). The Baseline is, therefore, consistent with the EEA report, Environment in the European Union at the turn of the century (EEA, 1999). The Baseline scenario includes all existing and proposed EU policies in the pipeline as of August 1997, and shows the results of these policies, assuming that all are fully implemented. The following conclusions can be listed (see also Table 1.1.1). • •. • • • • •. •. The EU will continue to reduce pressures on the environment during the forecasting period. Ensuring this progress requires full implementation and enforcement of current policies. Most of the key 5EAP targets have already been achieved and are only relevant for 2000. Current 5EAP policies (assuming full implementation) will be successful for the issues of stratospheric ozone depletion, nature conservation and water stress. Some policy gaps like climate change, waste and tropospheric ozone remain in the Baseline scenario. Additional policy initiatives are required if progress towards sustainability is to be achieved. In the case of chemicals, primary particulate matter (PM), water quality and air quality, the assessment reveals mixed success through enforcement of existing policies. With respect to stratospheric ozone depletion, the inherent time lags mean that positive recovery and impact trends will most probably not occur until after 2020. In a few areas, notably those pertaining to natural resources such as biodiversity, soil degradation and coastal zones, the lack of specific policy targets or sustainable levels inhibits the measurement of performance. Despite significant reduction of acidification, eutrophication, and ozone exposure, pressure will remain high on biodiversity in Europe's natural areas, which make approximately 50% of its territory. Pressure exerted by climate change is increasing and is expected to become a major factor in Northern Europe. The Bird's and Habitat Directive endorse the targets of the 5th Environmental Action Program. Their implementation will protect nature especially against increasing exploitation and habitat loss in about 10% of the EU territory. Given the ongoing high pressures, it is probable that the loss of biodiversity, which is currently observed in all European countries, will continue. From the Baseline scenario, it seems clear that transport will be the major driving force affecting environmental trends and target achievement during the outlook.
(11) European Environmental Priorities. •. 11. period. Although the agricultural and industrial contributions will decrease, their overall contribution to environmental deterioration remains high. For this study, new policy targets for 2010 have been set. These targets are stricter than those in the 5EAP; current policies are not sufficient for these targets. Some of the targets have already been adopted (e.g., the Kyoto targets for the climate change issue) and for some adoption is in progress (e.g., targets for acidification). Not all environmental issues have new targets. The study restricts itself to those issues which require new initiatives, where benefits are expected to be up on costs, and where sufficient information is available.. Table 1.1.1: Summary of Baseline results per environmental issue in 2010 Environmental issue. Major current policy. Ozone depletion Climate change Nuclear accidents Biodiversity Acidification Chemicals and PM Water quantity and quality Waste management Tropospheric ozone Coastal zones Air quality and noise Soil degradation. Montreal Protocol + amendments National policies Seveso Directive; nuclear safety standards Habitat and Birds Directive Second sulphur protocol National policies Nitrate directive, Urban wastewater directive National policies VOC control protocol, NOx protocol Bathing Water Directive National policies National policies. Pressure trends. Impact trends. + +/? + +/+. ? + +/-. Distance to 5EAP targets + +/? + +/+/+. +/+ +/-. +/+/+/-. +/+/+/NA. Legend: + , effective policy in reducing trends in EU or where a ‘policy gap is no longer present’ - , policy not effective in reducing trends or where a 'policy gap is present' +/- , more-or-less stabilising trends or where a ‘policy target is almost achieved, but not completely’ NA, not available; the issue of soil degradation was not included in the 5EAP. 1.1.2. What can technology contribute to closing the gap?. A second scenario has been developed to assess the maximum feasible reduction of environmental pressures using a set of measures based on the full application of available technology (mainly ‘end-of-pipe’ technologies), without regard to the costs. The following conclusions can be drawn from this scenario (see Table 1.1.2). •. Full application of available technological solutions (‘end-of-pipe’), without regard to costs, might show considerable improvements for some environmental problems. Technological means can solve these problems, like nuclear risks, acidification, waste management and tropospheric ozone.. •. However, there will be substantial costs. Estimates suggest that yearly environmental expenditures may rise to about € 50 billion over the expected costs under Baseline conditions. Acidification and tropospheric ozone abatement policies will take a lot of the direct costs. Welfare costs are significantly lower: about € 30 billion in 2010. With the implementation of all available technical abatement measures, the environmental expenditures as a percentage of gross domestic product (GDP) will slightly rise. It will only be 1% larger than in the Baseline scenario..
(12) 12. European Environmental Priorities. •. The high costs of end-of-pipe technologies are caused partly by relatively expensive abatement measures. For instance, it will become increasingly expensive to reach an ever-higher abatement level. There will be a decreasing environmental return on additional environmental investment so that a greater proportion of GDP must be used for end-of-pipe abatement measures.. •. For some environmental problems such as climate change, biodiversity and coastal zones, the end-of-pipe technologies available are limited. Without structural changes in consumption and production patterns, sustainable development remains therefore out of reach for solving these problems.. •. Despite all the technical measures, some air pollution problems will not be completely solved: exceedances of air concentration targets for particulate matter still occur. Structural measures at the local level are crucial for meeting all air quality targets.. Table 1.1.2: Summary of environmental and economic effects of the Technology Driven scenario (see section 1.1.2) and the Accelerated Policies scenario (see section 1.1.3) as relative (%) change in comparison to the trend in the Baseline scenario by 2010. Indicator Environmental issue Climate change Acidification Trop. Ozone Waste Chemicals and PM Human health and air quality Biodiversity Stratospheric ozone Nuclear accidents Water quantity and quality Coastal zones Soil degradation. -. Accelerated Policies1). B/C test4). . -57 -50 -34 -582) -63 -34 -59 -3. -14 -37 -43 -27 -47 -27 -39 -31 -3. + ++ ++ ++ ++ 0 0 ++ ++. . . . -90 .. . -11 . . .. (++) (++) (++) (+) (++). . .. . .. (?) (0). Benefits3) € 58 – 98 bln € 42 – 70 bln Welfare costs € 30 bln € 16 bln Benefit/cost ratio 1.9-3.3 2.7-4.5 Full trade variant: welfare costs includes the costs of purchasing permits (€ 4.3 billion). Maximum composting and recycling variant. Total values assuming premature mortality are rated using VOLY and VOSL respectively. Legend: 0 = benefit cost (B/C) ratio <1; + = B/C ratio >1; ++ = B/C ratio >2; B/C ratio in parentheses = expert judgement.. Economy. 1 2 3 4. GHG emissions Ecosystem exposure Health exposure Ecosystem exposure Landfill/incineration Dioxin/Furan emissions HMs emissions Primary PM emissions PM10 exposure above target level Noise nuisance Pressure on nature Ozone Depl. Sub. Unsafe reactors -. Technology Driven.
(13) European Environmental Priorities. 1.1.3. 13. Are the new environmental policy targets achievable?. A third scenario has been developed to assess the achievability of the new targets as set down for this study. The scenario consists of structural and behavioural measures, mainly energy conservation and fuel switch. Structural measures in the transport sector are included in this scenario but are not substantial. Structural agricultural measures are almost absent, mainly as a consequence of the choice of problems for which new targets were selected (new targets were not set for issues where the agricultural sector is the main driving force). The following conclusions can be drawn from the scenario results (see also Table 1.1.2). •. Implementing additional policies based on least-cost solutions and considering specific policy targets for climate change, acidification, tropospheric ozone, waste management and human health and air quality (especially, particulate matter) might show considerable improvements to the environment, but to a lesser extent than applying all available ‘end-of- pipe’ technologies. Ecosystems and human health will benefit from this improvement. All the targets set for this study are achievable, with only one exception: the stringent target for particulate matter, which is almost unachievable due to high natural background concentrations.. •. Besides the particulate matter problem, there are other environmental problems still remaining after implementation of the suggested additional policies; for example, the nitrogen load in the ecosystem (via air and water), noise nuisance and biodiversity loss. The transport and agricultural sectors are the main contributors to these remaining problems.. •. Some policies have positive effects on other environmental problems without being purposely developed for solving them. Climate change policies have significant impact on acidification, tropospheric ozone, chemicals, primary particulate matter and air quality (see also section 1.1.6). Air quality and tropospheric ozone will also benefit from additional acidification policies. Climate change-related policies make policies required to reach acidification and ozone targets cheaper (by € 6 billion per year). Allowing flexible Kyoto mechanisms will lead to fewer cost savings for these problems (see Fig. 3.3.3), but is – overall more cost-effective.. •. Suggested additional policies are based on a search for least-cost solutions. Structural changes in our production and consumption patterns are almost absent for the target year 2010. Such changes will become crucial for future reductions. Implementing strategies as suggested in this study (mainly technological improvements and fuel switches) will result in additional time needed to prepare our economy for some of these structural changes and ‘to pave the way to sustainability’. However, long-term policy planning (beyond 2010) is therefore required.. •. Some environmental problems have an irreversible character; i.e. impacts and risks such as stratospheric ozone depletion and nuclear accidents are found on a long-term scale. These problems, mainly transboundary, call for international co-.
(14) 14. European Environmental Priorities. ordination. The dilemma policy-makers are facing is the continuing large scientific uncertainty on the nature and causes of some of these problems, such as climate change, biodiversity and chemicals.. 1.1.4. Are the new targets economically reasonable?. As previously stated, additional environmental policies will bring significant improvements to the environment in the EU. What are the economic impacts and benefits of such policies? Our study leads to the following conclusions: •. •. •. • •. •. •. 1. The overall impact of additional environmental policies on economic development is small. The total economic cost of these policies, measured as GDP losses, is considerably lower than the direct costs of investments and other expenditures. A large portion of this direct cost is recycled in the economy. The GDP losses range from € 16 to 30 billion in 2010 (which is from –0.15% to –0.3% of the EU GDP level in 2010). Although the overall impact is small, additional policies will influence the EU economy and will imply changes, like the electricity and energy-intensive sectors (due to more stringent climate change policies) and agriculture (mainly due to the low added value in this sector). These changes are important in distributional terms. Some sectors, such as those supplying environmental services and equipment, will profit from new environmental policies. For climate change, with particular reference to carbon dioxide, efficiency gains may be obtained by using emission permit-trading and joint implementation as a means of approaching a least-cost allocation of the emission reduction efforts among sectors and countries. An emission permit market for the power generation sector could be a first step. The macroeconomic costs for the EU are fairly manageable (while the beneficial spillover effects on other environmental areas of the EU are less, the overall effect is positive). Major monetary benefits can be expected for acidification, nuclear accident control, tropospheric ozone control and air quality improvements, suggesting that environmental policies, at least those focusing on human health, are beneficial. Total benefits of a scenario implementing all available technology are about 20% higher than a scenario with - more modest - accelerated policies1. However, the welfare costs of the technology scenario are considerably higher. The benefit/cost ratio is lower; in both cases benefits exceed costs. Allowing for the Kyoto flexible mechanisms will slightly reduce the total benefit estimates of the Accelerated Policies scenario for climate change, mainly due to lower secondary benefits. The assessment suggests substantial cost savings to EU from trading via the Kyoto flexibility mechanisms, i.e. the trade-off between secondary benefits within the EU versus the cost advantage of trading. Considering the cost-benefits, emission permit trading is more advantageous. For most of the environmental issues the policy implementation costs will not exceed the environmental benefits. Results also suggest some ranking (although uncertainties exist on how benefits and costs are estimated and attributed to the. Total benefits of the maximum technology scenario are underestimated in this study due to exclusion of some PM10 benefits..
(15) European Environmental Priorities. •. •. 15. environmental issues, as there are many interlinkages and spillovers). EU policies focusing on climate change, acidification, waste management and (urban) air quality pay. Biodiversity and water stress might be added to this list, but there exist serious information gaps in these areas. Some major uncertainties are related to the method of benefit assessment. One of these is related to the question of how to monetise mortality, i.e., as ‘death’ or as ‘life years lost’. In the summary tables, this uncertainty has been made explicit by showing both ‘value of statistical life’ (VOSL) and ‘value of life years’ (VOLY) benefit estimates. The analysis shows that the overall cost-benefit estimates are, however, hardly affected by this uncertainty. Only for one environmental problem - tropospheric ozone -, the uncertainty prevents a decision. If the lower estimate of avoided premature mortality is applied, abatement costs would exceed the benefits, while the higher estimate gives the opposite result. For some environmental problems the information on costs (acidification) is on firm grounds, whereas other environmental problems suffer from information weaknesses. Information on accelerated policies for water is observed to be too weak for an economic assessment of these policies. This applies also to policies for biodiversity.. 1.1.5. What are the key policy responses?. Prior to the implementation of further environmental policy initiatives, it is imperative to secure the Baseline. A major effort should be directed towards two key issues: • •. Firstly, if environmental policy incentives are to be effective, removing the disincentives is a priority. For example, the Baseline assumes the removal of all energy subsidies targeted at fossil fuels. Secondly, a major effort should be directed towards full compliance with all existing policies, especially the Bathing Water Directive, the Drinking Water Directive, the Habitats and Birds Directive, and the Directives on harmful substances.. We identified new policy actions in literature. A set of criteria are applied for selecting key policy actions (see Table 1.1.3), as it is very unlikely that any single criterion will be sufficient for this selection process. Rational criteria for selecting robust policy actions are: • Causal (does the policy address the underlying economic failure?); • Effectiveness (pressure reduction, multiple environmental effects); • Efficiency (benefit−cost ratios, cost-effectiveness, benefits, public opinion), • Macro-economic (macro-competitiveness, sectoral competitiveness, employment), and • Jurisdictional (subsidiarity)..
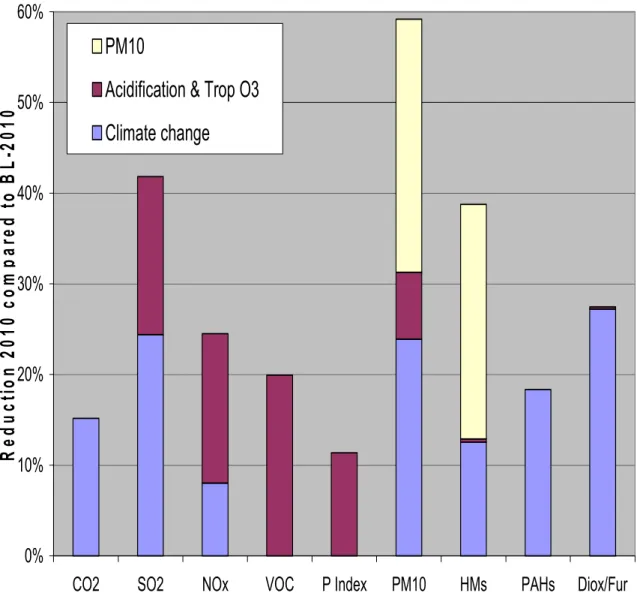
(16) 16. European Environmental Priorities. Table 1.1.3: Menu of key policy initiatives targeting environmental issues Policy initiative. Environmental issue. Accelerated compliance by Annex 5 countries with Montreal Protocol and Amendments. Stratospheric Ozone Depletion. Energy-supply-side policies (carbon-trading energy sector) Energy-demand-side measures (energy standards; aviation tax; carbon / energy tax with negotiated agreement). Climate Change, Acidification, Human health and air quality Climate Change, Acidification, Human health and air quality. Taxes on NOx, SO2 and VOC related to emissions from shipping, industrial processes, off-road vehicles, stationary combustion, and solvent paints. Acidification, Tropospheric Ozone, Human health and air quality. Accelerated substitution of nuclear facilities in Economies in Transition. Nuclear Accidents. Agricultural policy reform: i.e. increased use of agri-environmental schemes and mitigation banking. Biodiversity Loss, Coastal Zone Management. Transport package: i.e. parking charges, differential fuel tax, tradable efficiency permits for car manufacturers, etc.. Acidification, Tropospheric Ozone, Noise. Water pricing with 100% costs to society. Water management. Waste recycling credits. Waste management. Results suggest the conclusion that central policies for transboundary environmental issues have been exhausted or are less cost-effective: few additional policies (in terms of measures) need to be defined for the EU as a whole. An ‘emission ceiling directives’ approach, such as that adopted for acidification, could well serve the implementation of subsidiarity-based measures. Emission trading schemes within the EU forms another example of how cost-effectiveness of policies can be improved. All schemes should also require adequate reporting mechanisms.. 1.1.6. Spillovers. Results of our study clearly show the benefits of an integrated approach policy (i.e. a policy considering spillover effects from one environmental issue to another). Significant cost reductions and increased benefits can be achieved. In other words, environmental targets can be realised easier. Figure 1.1.1 shows the main spillovers between environmental issues. It illustrates that spillovers from climate change to other environmental issues are dominant, especially for acidification, chemicals (i.e. Heavy Metals, PAHs and dioxins/furans) and primary particulate matter (PM10 in figure 1.1.1). It is shown that CO2 emission reduction of 15% compared to the Baseline results in emission reductions beyond 15% for many other substances. CO2 emission reduction measures lead to emission reductions of 24% for SO2, 8% for NOx, 24% for PM10, while SO2, NOx, and VOC control measures lead to auxiliary reduction of more than 7% PM10 emissions and significant reduction of the pressures on natural ecosystems. Measures to reduce the emission of PM10 reduce the emission of heavy metals to the same extend..
(17) European Environmental Priorities. 17. 60%. PM10 Acidification & Trop O3. R e d u c t io n 2 0 1 0 c o m p a r e d t o B L - 2 0 1 0. 50%. Climate change. 40%. 30%. 20%. 10%. 0% CO2. SO2. NOx. VOC. P Index. PM10. HMs. PAHs. Diox/Fur. Figure 1.1.1 Spillover effects of climate change policies; acidification and tropospheric ozone policies and primary PM10 measures in the accelerated policy scenario (no-trade variant). P index is total pressure on biodiversity2.. If, besides the Baseline policies, no climate-change policies were implemented at all, an additional investment in end-of-pipe measures of € 6 billion per year would be needed to reduce the acidifying emissions to a level that would ensure reaching the acidification targets. In terms of welfare loss, this would amount to nearly € 4 billion. It should be noted that the interlinkages - as presented – depend on the formulation of the policy packages. In the accelerated policies scenario, developed in this study, one of the main measures is the switch from coal to gas. This measure dominates the spillover of climate change policies to other environmental issues. All policy packages have been defined and optimised for their own environmental problem. This means – at least in theory – that there is room for further optimising the spillover effects, and, thus, for improving the efficiency of accelerated policies package. 2. At European level, there is insufficient data to assess the status of biodiversity. The presented indicator was constructed to quantify as many as possible facets of the pressures on natural areas. Due to this data availability issue, air quality factors now dominate the indicator, while habitat destruction and habitat disruption lack..
(18) 18. European Environmental Priorities. 1.1.7. EU Enlargement. Although the impact of EU enlargement on the environment was not fully appraised in this study, the following conclusions can be drawn from our findings: •. The EU enlargement can be expected to cause profound changes in the economies of the Accession countries. In countries that are advanced in the implementation of economic reforms (the 'first wave' of accession), energy consumption has dramatically decreased and the energy demand structure requires cleaner fuels. Energy intensities have also decreased.. •. The EU enlargement will have a positive effect on the environmental situation in the Accession countries. Implementation of the Urban WasteWater Treatment Directive in combination with a large effort on sewerage development with tertiary treatment, i.e. nutrient removal, will improve river water quality considerably. Particularly water quality in the Baltic and Black Seas may benefit from this effort. Other environmental problems profiting from EU enlargement are waste management and air pollution.. •. For transboundary problems the EU enlargement will have positive environmental effects within the Accession countries, but also within EU Member States. Approximation of emission control policies in Central and Eastern Europe to those of the European Union will make the achievement of environmental goals within the EU easier and cheaper.. •. Additional benefits as a result of EU enlargement are expected if Accession countries fully comply with the Montreal Protocol; this will help to reduce the health risk associated with stratospheric ozone depletion worldwide. Closing or upgrading unsafe nuclear power plants in Accession countries brings about other benefits. Health risks associated with nuclear accidents will be reduced by almost 90% throughout Europe.. •. In some economic sectors, the environmental performance is expected to improve, but the changes in the transport and agriculture sector may add to the deterioration of environmental quality. These sectors have, so far, not caused major problems in Eastern Europe. However, if, for example, current agricultural subsidy regimes remain unmodified, EU enlargement will lead to additional sectoral growth and, thus, to additional environmental problems, e.g. those of biodiversity loss. Integration of environmental considerations into economic sectors is therefore also crucial in the Accession countries.. •. The approximation process will lead to high investment costs in the Accession countries, certainly in comparison with the available EU funds (e.g. PHARE, Cohesion funds). The effectiveness and efficiency of EU funding could improve if environmental impact assessment and cost/benefit analysis were applied..
(19) European Environmental Priorities. 1.2. Findings per Environmental Issue. 1.2.1. Global Environmental Issues. 19. Stratospheric Ozone Depletion Anthropogenic emissions of chlorine and bromine compounds are the main cause of stratospheric ozone depletion. International agreements, supported by EU regulations, have been effective in reducing the production, use and emissions of ozone-depleting substances. However, the ozone layer is unlikely to recover before around 2050. Consequently, the adverse effects on human health and ecosystems are expected to continue throughout the 21st century. It is generally agreed that in the EU the most effective measures for addressing ozone depletion are already in place. Future EU action, therefore, should support developing countries which have obligations under the Montreal Protocol to restrict their emissions. There are relatively high benefits (including for the EU) to be achieved against reasonable costs. Climate Change Increasing greenhouse gas concentrations may cause the climate to change. Ecosystems, but also the human society, may hardly find time to adapt to these changes such as temperature increase, sea-level rise, changes in rainfall and drought patterns, and the incidence of climatic extremes. Climate change may be irreversible, as there is a considerable time delay between the reduction of greenhouse gas emissions and the stabilisation of atmospheric concentrations. Climate change is addressed through the UN Framework Convention on Climate Change (FCCC), under which the EU committed itself to stabilise CO2 emissions at 1990 levels by 2000. The EU is further committed to reduce the emissions of the main greenhouse gases by 8% in the period of 2008 to 2012 under the Kyoto Protocol. Under the Baseline scenario, GHG emissions are expected to increase by 7% between 1990 and 2010 (see Table 1.2.1). All Member States, except Germany, would emit more CO2; some, such as Portugal and Greece, by more than 50%. For CH4 emissions, significant reductions are anticipated from the coal-mining industry and agriculture, while emissions from landfills will likely increase by 20%. The increase in N2O emissions stems primarily from the transport sector. The most significant growth in the use of halogenated gases is expected in HFC application for refrigeration and foam blowing. It is clear from the Baseline assessment that additional policy measures will be required to meet the Kyoto reduction target. However, it must be stressed that technology improvement under Baseline conditions is of great significance..
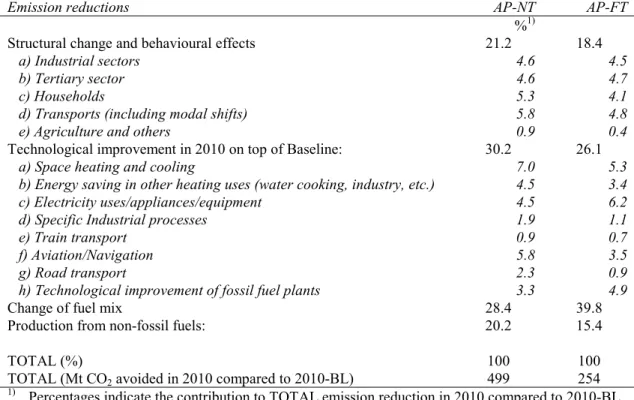
(20) 20. European Environmental Priorities. Table 1.2.1 Main results for Climate Change in 2010 Climate Change. Unit. BL. AP-No trade. AP-Full trade. Emissions CO2 1990=100 108 92 1002) CH4 1990=100 96 92 92 1990=100 109 92 92 N 2O 1990=100 140 92 92 HFC, PFC, SF6 All GHGs 1990=100 107 92 98 Additional direct costs CO2 billion € 92.0 36.3 billion € -0.4 -0.4 Non-CO2 GHGs GDP loss (welfare costs) CO2 billion € 17.1 9.23) Non-CO2 GHGs billion € -0.2 -0.2 15 - 24 11 - 17 Primary + secondary benefits1 billion € 0.9 - 1.4 1.2 - 1.9 Benefit1/Costs ratios 1 Total values assuming premature mortality are rated using VOLY and VOSL respectively. Secondary benefits include emission reductions of SO2, NOx, NH3 (including secondary aerosols), and primary particulate matter. 2 Results credited to the EU, excluding emission trading. If this is included, emissions will be 8% lower than Baseline results. 3 Welfare costs include the costs of purchasing permits (€ 4.3 billion).. In this study, the EU target for climate change has been assessed for two ‘accelerated policies’ variants. In the first variant, ‘no-trade’, the Kyoto Protocol is implemented in all Member State countries according to their commitment, with no provision for emission trading. This assessment is likely to give an indication of the upper limit of the costs associated with achieving the targets. In this variant, CO2 emissions are reduced by almost 15% or 500 Mtonnes compared to Baseline emissions by 2010. The electricity production sector realises about half of the reduction (46%), where the largest contribution comes from a change in fuel mix from oil and coal to natural gas, and non-fossil fuels. Technological improvements in especially aviation, electric appliances and equipment, space heating and cooling, and other heat uses contribute 30% to the total emission reduction. The largest reductions for methane (CH4) are achieved through measures that promote mine gas and landfill methane recovery. For nitrous oxide (N2O), almost 90% of all emission reductions can be achieved by technological improvements in fertiliser production. Technological improvements and the use of alternatives can lead to the largest reductions for halogenated gases. In the second variant, ‘full-trade’, CO2 emission trading is allowed among all Annex B countries. The assessment approaches a least-cost allocation of the combined EU effort to meet the Kyoto targets. This scenario implicitly includes the Joint Implementation and Clean Development Mechanism. Also in this variant, CO2 emission reductions for each EU Member State are based on the Burden Sharing Agreement. However, least-cost considerations and emission trading will revise the obligations for each country. Total CO2 emissions are reduced by 8% in 2010 within the EU compared to Baseline emissions. The remaining reduction obligation of 7% is obtained by buying emission rights from other Annex B countries - mainly the Ukraine and Russia - at a price of € 17.4 per tonne CO2. This full trade provision will hardly shift the relative contributions of the economic sectors. The relative.
(21) European Environmental Priorities. 21. contribution from the electricity production sector is almost 10% higher since the emission reduction options in this sector are relatively cheap. Additional calculations suggest opportunities for a stepwise approach to implement a CO2 emission permit trading system. For example, if the EU power generation sector sets out to establish an emission permit trading system, the permit price in that partial market would be close to the price mentioned above. As shown in Table 1.2.1, CO2-related measures strongly dominate total EU GDP losses in 2010. Although the variants were based on least-cost solutions, there is room for further cost reductions. CO2 emission abatement measures could be replaced partly by (much) cheaper non-CO2 GHG measures. However, uncertainties in both costs and emissions are large. Integrating climate change policies with waste management strategies can further reduce costs. This study shows that significant spillover effects in terms of CH4 emissions from waste management to climate change are possible if landfilling of organic waste is reduced substantially. CO2 emission reductions cause emission reduction of many other pollutants as well. For example, measures that improve energy efficiency result in a lower use of fuels and therefore reduce the emissions of SO2, NOx, particulate matter, heavy metals, etc. Indeed, the monetary benefits of climate change are dominated by its secondary benefits as they cover 85-90% of the total benefits. If a lower premature mortality valuation were applied, the secondary benefits would still cover 75-80% of the total benefits. In Table 1.2.1 benefit-cost ratios vary between 0.9 and 1.9. This seems to justify the conclusion that a loss of economic growth due to climate change policies is offset by its benefits, where secondary benefits in the context of acidification and tropospheric ozone dominate. This conclusion even holds for a policy package that makes limited use of non-CO2 emission reduction measures. To achieve the target for climate change, a mix of regulatory and economic instruments must be implemented. Promising economic instruments are: tradable emission permits for GHGs (starting with CO2 emission trading in the power generation sector), and/or a carbon/energy tax (about € 17.4 per tonne CO2) and an aviation tax on kerosene (about € 0.2 per litre). Promising regulatory measures are: stricter standards on electrical appliances and other equipment, a market regulation for electricity (such as obligations to use renewables), stricter building codes both for houses and offices, incentives to use heat pumps and a continuation and reinforcement of energy conservation programmes for good housekeeping in energy use, heat/steam recovery, insulation etc. Finally, a policy strategy for the period after 2010 becomes crucial. Massive nuclear decommissioning, anticipated to take place after 2010, will boost the demand for electricity produced by fossil fuel power plants putting the attained CO2 emission reduction at risk. The development of structural changes in demand-side management and the use of renewable energy sources are expected to be small in 2010..
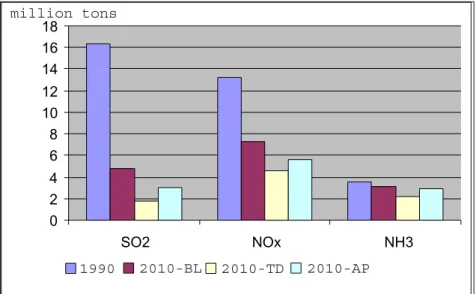
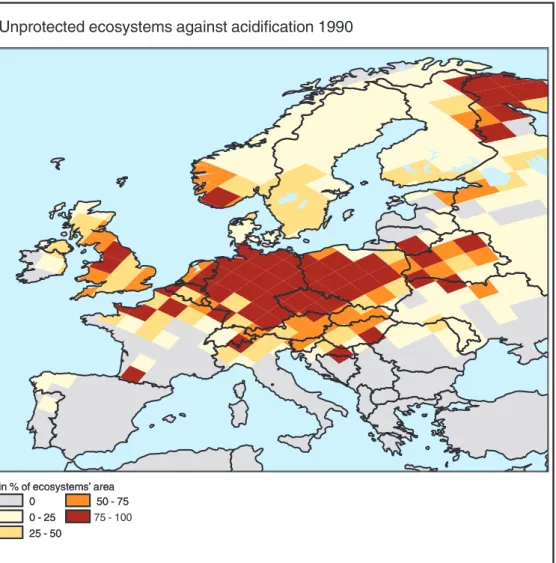
(22) 22. 1.2.2. European Environmental Priorities. Continental Environmental Issues. Nuclear accidents On a continental scale, three major types of accidents having significant adverse environmental implications are nuclear accidents, oil spills and chemical spills. This study focuses on the first one, nuclear accidents. Central and Eastern European Countries are responsible for at least 40 to 50% of the estimated human health risk due to radiation exposure in the EU; this is because the majority of the high-risk reactors are found in Central and Eastern Europe. Under current policies little change is expected in terms of mortality risks. If most of the high-risk nuclear power plants are either closed or upgraded, risks will decrease by almost 90% for Europe as a whole. Costs of upgrading are estimated to be about € 100 million per year. However, these estimates are very uncertain. The upgrading is not justified in economic terms, as the benefits to the EU do not exceed the costs (based on avoided mortality). Yet, it is well known that people are more averse to accidents in which a considerable number of people die, or are injured, than to a series of smaller accidents, each of which produces a few fatalities, even though the total number of fatalities are the same. If this ‘disaster aversion’ is included in the benefits estimates, additional policies become economically efficient. Acidification and Eutrophication Sulphur dioxide (SO2), nitrogen oxides (NOx) and ammonia (NH3) react in the atmosphere to form clouds of acid rain. In many areas, dry and wet deposition of acid rain changes the chemical composition of soil and water threatening ecosystems. Also, it impairs human health and corrodes buildings and structures. Deposition of nitrogen compounds also causes eutrophication. The acidification has, since the 1980s, been effectively tackled by policy measures. The UN ECE Convention on Long-Range Transboundary Air Pollution (LRTAP) reached several international agreements to reduce emissions in a harmonised way. With respect to air pollution control, the EU has adopted emission and fuel-quality standards for its Member States. In addition, many European countries have adopted more stringent national standards and other types of regulations reflecting the seriousness of pollution and national environmental quality priorities. Current policies form an important step towards achieving environmental sustainability for acidification and eutrophication (see Table 1.2.2). Drastic improvements are probable for certain high-risk countries such as Germany (80% to 18%) and Belgium (58% to 23%). With respect to eutrophication, the protection levels are predicted to remain alarmingly low in some countries: below 10% in Belgium, Germany, Luxembourg and the Netherlands. With the adoption of all feasible technical emission control measures, further reductions in emissions and improvements in ecosystem protection are possible. Under such a scenario, SO2, NOx and NH3 emissions are likely to decrease markedly.
(23) European Environmental Priorities. 23. for the 1990 to 2010 period. Consequently, acid deposition exceeding critical loads is expected to affect only 2% of ecosystems in 2010. For eutrophication, the situation also improves, but exceedances remain high. Table 1.2.2: Main results for Acidification and Eutrophication in 2010 Emissions SO2 NOx NH3 Target indicators Exceedance critical loads (acid) Exceedance critical loads (N) Accumulated acidity Additional direct costs SO2 NOx NH3 TOTAL GDP loss Primary + secondary benefits1. Unit BL. TD. AP-nt. AP-ft. 1990=100 29 1990=100 55 1990=100 88. 11 35 60. 17 42 83. 19 43 81. %ecosyst 4.6 %ecosyst 41 109 acid eq 1.6. 2.0 24 0.4. 2.8 36 0.6. 2.9 35 0.6. billion € billion € billion € billion € billion € billion €. 4.7 15.7 14.2 34.6 20.8 40-72. 1.5 2.7 1.4 1.9 1.4 1.6 4.3 6.2 2.6 3.7 16 18 - 33 29 Benefit1/Cost ratios 1.9-3.4 6 - 11 5-9 1 Total values assuming premature mortality are rated using VOLY and VOSL respectively.. For the accelerated policy scenario the target is set at the so-called ‘50% gap closure’. This means that the area of ecosystems not protected against acidification should be reduced everywhere by at least 50% compared to 1990. To achieve this target, exceedance of critical loads at EU level must be reduced to less than 3% in 2010. No targets have been specified for eutrophication. Improvements of eutrophication indicators result from policies needed to meet the acidification target. Table 1.2.2 shows that emissions of SO2 and NOx must be reduced considerably to achieve the 50% gap closure target. Meeting this target hardly reduces the NH3 emissions. This explains why the critical loads for eutrophication remain exceeded. Protection against eutrophication requires the definition of specific N deposition targets. The welfare costs (or GDP loss) in the Technology Driven scenario are estimated to rise almost € 21 billion per year over the costs in the Baseline scenario. However, emission reductions would be large. Even larger than strictly needed to achieve the ‘50% gap closure’ target selected for the Accelerated Policy scenario. Spillovers from climate change policies and the less ambitious target make that the additional welfare costs of the accelerated policies scenario would reduce to between € 2.6 to € 3.7 billion per year. Additional measures under the Accelerated Policy scenarios that are cost-efficient for at least one-third of EU member countries include: limiting the sulphur content of fuels and implementing NOx control measures for national sea traffic; applying stricter controls on emissions from industrial processes other than energy combustion and further reduction of NOx emissions from off-road vehicles through enforcement of standards similar to existing standards for road vehicles..
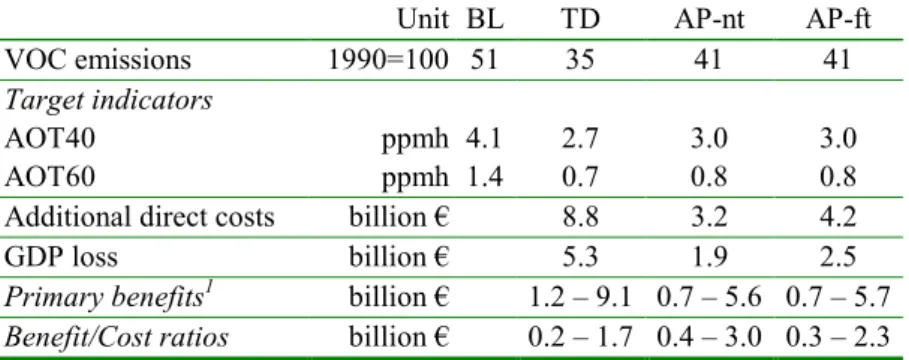
(24) 24. European Environmental Priorities. Independent of the approach to monetise premature mortality (VOLY or VOSL see section 1.1.4), the sum of primary and secondary benefits is (much) higher than welfare costs in all scenarios. This conclusion also holds for the technology driven scenario (TD), where no spillovers from climate change policies are considered (see Table 1.2.2). The results also show that acidification abatement will significantly benefit from climate change policies and this will reduce the costs. Relevant policy instruments to achieve the acidification targets are: NOx emission charges and a sulphur tax levied on the sulphur content of fossil fuels used for energy production. A comparison of costs and benefits suggests this would be economically efficient. For NH3, the situation is complex. The best option probably is to establish a mineral accounting system. Any N-levy should be proportional to farm surpluses and all the main minerals involved. Tropospheric Ozone High tropospheric (ground-level) ozone concentrations are a major indicator of photochemical smog, which impairs vegetation and human health. Ozone is not emitted itself, but it is a product of reactions with (non-methane) volatile organic compounds (VOCs) and NOx. Control of NOx emissions has already been discussed in the context of acidification and eutrophication. In terms of environmental impact, AOT40 - the accumulated ozone exposure above the threshold value of 40 parts per billion (ppb) - is used to assess the potential damage to vegetation. AOT60 is used to define the critical threshold for human health. AOT60 values can also be used to estimate the exposure to peak ozone levels in cities. This will be discussed in the context of human health and air quality. The transport sector is the most important source of NOx emissions, while transport and solvent use in households and industry are the main sources of VOC emissions. The Fifth EAP established 30% reduction targets for NOx (1990 to 2000) and VOC (1990 to 1999). Implementation of existing policies and policies in the pipeline is expected to reduce emission levels even further by 2010. (see Tables 1.2.2 and 1.2.3). These reductions will substantially reduce human and plant exposure to ozone. Table 1.2.3: Main results for tropospheric ozone in 2010; VOC emissions only, for NOx emission reductions see table 1.2.2. Unit BL TD AP-nt AP-ft VOC emissions 1990=100 51 35 41 41 Target indicators AOT40 ppmh 4.1 2.7 3.0 3.0 AOT60 ppmh 1.4 0.7 0.8 0.8 Additional direct costs billion € 8.8 3.2 4.2 GDP loss billion € 5.3 1.9 2.5 Primary benefits1 billion € 1.2 – 9.1 0.7 – 5.6 0.7 – 5.7 Benefit/Cost ratios billion € 0.2 – 1.7 0.4 – 3.0 0.3 – 2.3 1 Benefits assume premature mortality is rated using VOLY and VOSL respectively..
(25) European Environmental Priorities. 25. The full application of existing technology could bring an 80% reduction in 2010 for the human-health related indicator (AOT60). For potential vegetation exposure the most significant improvements occur within large areas in France, Germany, Italy, Portugal and Spain. The additional welfare costs of applying existing technology to further reduce VOC emissions is estimated at € 5.3 billion per year, where it should be realised that these costs were made by non-transport sectors only. We considered VOC emission reductions in the transport sector itself to be a spillover of measures to reduce NOx emissions. However, environmental expenditures in the transport sector can arbitrarily be assigned to NOx control (acidification and eutrophication) or to VOC control (tropospheric ozone). The targets in the accelerated policy scenarios have been taken from the proposal for the National Emission Ceilings Directive, which states that AOT60 (regarding health) should be reduced by two-thirds and AOT40 (regarding vegetation) by one-third until 2010, see the AP values in Table 1.2.3. Welfare costs in the Technology driven scenario rise to more than € 5 billion per year over the Baseline costs. In the accelerated policies scenario the additional costs are less than half of this amount. In all three scenarios, technical measures for controlling VOC emissions that are costefficient for at least one-third of the EU member countries are: further controls of VOC emissions from liquid-fuels processing and distribution; promotion of lowsolvent paints in professional, industrial, and 'do-it-self' applications; and better controls of VOC emissions from 2-stroke engines. The monetary benefits of tropospheric ozone abatement have been assessed, though these are difficult to quantify. The benefit range in Table 1.2.3 reflects the uncertainty with respect to premature mortality. Inclusion of other uncertainties would result in an even broader range. Positive impacts of VOC emission reductions on other environmental issues (i.e. secondary benefits) are considered to be negligible. The benefit-cost ratios of the policy package show that the method of monetising premature mortality is crucial for passing the economic efficiency test. However, the benefit assessment had to disregard some important impacts. Therefore, the benefit estimates may be biased towards underestimation. No additional end-of-pipe measures other than those already in place were found to be cost-efficient in all EU countries. Therefore, a VOC tax might be appropriate to stimulate the implementation of the most cost-efficient measures in each country. Chemicals and particulate matter The number of chemicals that enter the environment is large. Heavy metals (HMs) and persistent organic pollutants (POPs) represent two groups that are of particular importance due to their persistent, bio-accumulative and toxic characteristics. These substances cling to fine dust particles. Emission reductions of particulate matter (PM10) are important to reduce its effect on human health, but also to limit the transport of many chemicals in the atmosphere. Human exposure to particulates (and other substances) is discussed in the context of human health and air quality..
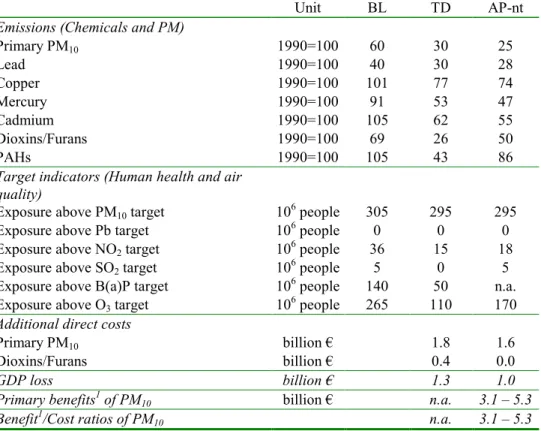
(26) 26. European Environmental Priorities. Emission targets have been established for some HMs and POPs under the auspices of the UN ECE Convention on Long-Range Transboundary Air Pollution (CLRTAP). Countries that signed the protocols on HMs and POPs are under the obligation to stabilise emissions of lead, cadmium, mercury, dioxins/furans and polycyclic aromatic hydrocarbons (PAHs) at 1990 levels. For PM10, the target is set in terms of air concentrations only (i.e. 20 µg/m3 annual average) as also discussed in the context of human health and air quality. Under current policies, substantial emission reductions with respect to 1990 for PM10, lead, dioxins/furans, and to a lesser degree for mercury, are expected by 2010 (see Table 1.2.3). The downward trend in PM10 emissions results primarily from lower transport and stationary combustion emissions due to stricter emission standards and reduced coal use, respectively. The phasing out of leaded petrol explains the reduction in lead emissions. The improvement in emission levels of dioxins/furans is explained by the application of efficient flue-gas cleaning technologies for waste incinerators. Reduced coal use and an abatement programme in the chloro-alkali industry are expected to lower mercury emissions by 2010. Small increases in the emissions of cadmium and PAHs are expected due to growth in road transport (for cadmium) and to higher use of wood fuel in households (for PAHs). Therefore, the achievement of stabilisation targets is not ensured for these gases under Baseline conditions. The technology-driven scenario (TD) assumes full application of the most advanced end-of-pipe emission control technologies, such as high-efficiency electrostatic precipitators, fabric filters and highly efficiently wet scrubbers. This would significantly reduce emissions of all studied hazardous substances (see Table 1.2.4, Technology Driven scenario) and demonstrates the remaining technical potential for further control of emissions. Under the Accelerated Policy scenario, spillover effects from climate change and acidification were analysed first. Climate change policies have the largest impact (about 75%). For HMs, estimated spillover effects are almost completely due to climate change action. The spillover reductions would achieve the emission stabilisation targets for all substances studied, including cadmium, copper and PAHs. The Accelerated Policy scenario also includes full application of advanced abatement technologies for PM10. The largest reduction of PM10 emissions can be achieved through further control of the emissions from major industrial production processes. However, the assessment demonstrates that still a large portion of the European population would be exposed to PM10 levels exceeding the target levels of 20 µg/m3. Total yearly direct costs and welfare costs compared to the Baseline are summarised in Table 1.2.4, where it should be noted that uncertainties are large: i.e., a factor of 2 to 4. Costs of measures to reduce PM10 emissions from transport are evaluated in the context of acidification..
(27) European Environmental Priorities. 27. Table 1.2.4: Main results for chemicals, primary particulate matter and human health and air quality. Unit. BL. TD. AP-nt. Emissions (Chemicals and PM) Primary PM10 1990=100 60 30 25 Lead 1990=100 40 30 28 Copper 1990=100 101 77 74 Mercury 1990=100 91 53 47 Cadmium 1990=100 105 62 55 Dioxins/Furans 1990=100 69 26 50 PAHs 1990=100 105 43 86 Target indicators (Human health and air quality) Exposure above PM10 target 106 people 305 295 295 0 0 0 Exposure above Pb target 106 people 106 people 36 15 18 Exposure above NO2 target 106 people 5 0 5 Exposure above SO2 target 140 50 n.a. Exposure above B(a)P target 106 people 106 people 265 110 170 Exposure above O3 target Additional direct costs Primary PM10 billion € 1.8 1.6 Dioxins/Furans billion € 0.4 0.0 GDP loss billion € 1.3 1.0 1 Primary benefits of PM10 billion € n.a. 3.1 – 5.3 Benefit1/Cost ratios of PM10 n.a. 3.1 – 5.3 1 The benefit assessment assumes that premature mortality is rated using VOLY and VOSL respectively. Benefit/cost ratio of PM10 is overestimated as it compares total benefits, including those of spillovers of climate change and acidification policies, with the direct costs of PM10 emission abatement. Economic instruments in the context of other environmental issues such as the carbon/energy tax, minimum excise duty, the aviation tax and nitrogen and sulphur taxes will also be beneficial in terms of PM10 reduction. With respect to regulations, an appropriate action could be to extend the Integrated Pollution Prevention and Control (IPPC) Directive with binding emission standards for major industrial production installations as they already exist for other major source categories. Such advanced measures for PM10 control will also reduce emissions of heavy metals, dioxins/furans and PAHs..
(28) 28. 1.2.3. European Environmental Priorities. Regional and Local Environmental Issues. Water quantity and quality Human use places severe pressure on Europe’s water resources. Water quality is a major concern throughout Europe, while the level of abstraction represents a further stress in southern countries. Water withdrawals for irrigation can lower water tables and result in salt-water intrusion in coastal areas. Nitrogen pollution of groundwater restricts its use for drinking water, while eutrophication due to excessive nutrient load can lead to algae growth, oxygen deficiencies and fish kills. Coastal zones are areas of the highest biological and landscape diversity on Earth. In this assessment, the coastal zone issue is represented only through the analysis of nutrient loading. Other coastal issues, such as urbanisation, tourism and over-fishing are not taken into account. Water demand seems to be stabilising and the implementation of measures for water quality is in progress. After full implementation of current policies (Nitrates and the Urban Waste Water Treatment Directives), the water quality will show steady improvement. The Biological Oxygen Demand in rivers is falling, though the nitrate load remains a problem. This also means that the biodiversity of marine ecosystems does not benefit from actions to limit excessive nitrogen releases to surface water. Anticipating a need for further environmental improvements, the European Commission proposed the Water Framework Directive. At the moment, neither targets, action plans, nor environmental models are available to assess the impact of the new Directive. The cost−benefit analysis of domestic water supply suggests the need for policy measures that do not focus on investments in new supply schemes, but on demand management and leakage control instead. The first step towards correct water pricing in agricultural water demand management is the removal of subsidies for agriculture and (irrigation) water. There are only a few benefit-estimate studies in Europe on preventing water contamination. They are fairly consistent in suggesting that benefits to avoid contamination could be very high, reflecting the householder’s concern about drinking water. Comparing costs and benefits for avoiding water contamination suggests the B/C ratios could be 1.5 - 15. For coastal zone management cost−benefit estimates are of limited availability and the existing studies do not provide a clear perspective. Waste Management In the EU, waste generation is increasing faster than economic growth. The volume of waste is an indicator of inefficient production processes, low durability of goods and unsustainable consumption patterns. In addition to the resource loss represented by waste quantities, waste management and disposal have significant impacts on the environment including air and water pollution. The accelerated policy (AP) scenario targets EU municipal waste disposal at 50% of composting and recycling. Industrial.
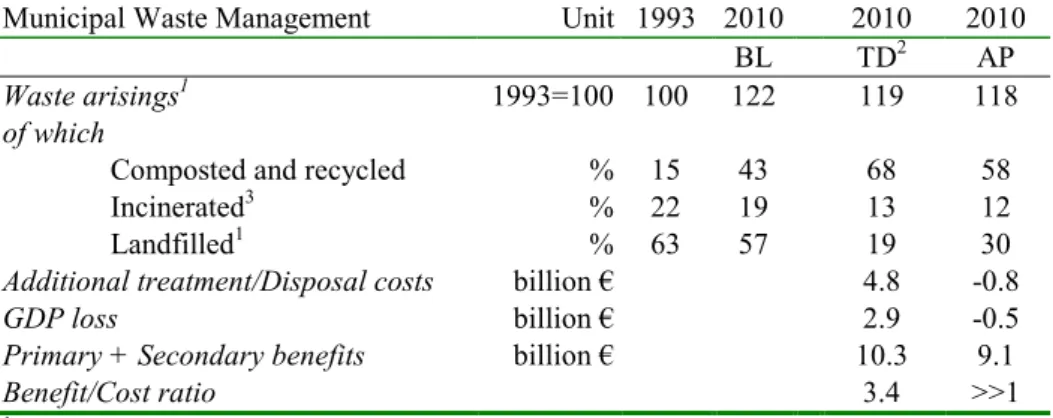
(29) European Environmental Priorities. 29. and hazardous waste has not been included in this study due to lack of harmonised data. However, future policies should focus on these waste streams. Table 1.2.5. Overview of the environmental and economic results of the scenarios for municipal waste management Municipal Waste Management. Unit 1993 2010 BL 1993=100 100 122. Waste arisings1 of which Composted and recycled % % Incinerated3 % Landfilled1 Additional treatment/Disposal costs billion € GDP loss billion € Primary + Secondary benefits billion € Benefit/Cost ratio 1 Including landfilling of incineration waste 2 Maximum composting and recycling 3 Including energy recovery. 15 22 63. 43 19 57. 2010 TD2 119. 2010 AP 118. 68 13 19 4.8 2.9 10.3 3.4. 58 12 30 -0.8 -0.5 9.1 >>1. Current targets controlling the amount of municipal solid waste are unachievable without additional policy responses. The annually generated amount of municipal waste per capita was 534 kg in 1993. This will increase by more than 20% by 2010 (while the target was stabilisation at the 1985 level). Due to the implementation of the Packaging Directive, landfill of waste will decrease, although it remains the dominant route for waste treatment. Recycling will double. In a scenario that focuses on composting and recycling (TD), the share of landfill may decrease to almost 20%, while costs will increase by more than 35% (see Table 1.2.5). This strategy requires additional institutional structures for recycling and composting. Effective separation of waste streams at the source requires the setting up of kerbside collection and introducing systems for glass, paper, plastic, biodegradables and metal. The Accelerated Policy scenario assumes preventive measures for reducing the amount of waste plastic and paper, and composting and recycling at a cost-optimal level. The increase of municipal solid waste occurrences will be limited to almost 5% over the 1993-2010 period. The share of landfill and composting/recycling will be 30% and 60%, respectively, in 2010 (this goes beyond the 50% target set for this scenario). Implementing these policies might lead to cost savings of more than 5% compared with unchanged strategies. Results also suggest that a strategy focusing on composting and recycling is more cost-effective than incineration and landfilling. The AP scenario generates smaller benefit estimates (i.e. € 9.1 billion) than the TD scenario (i.e. € 10.3 billion). However, this is more than counterbalanced by lower costs in the AP scenario. In effect, the net efficiency of the AP scenario is the best. However, the TD policy strategy also passes the cost−benefit test. A strategy focusing on maximum incineration (including energy recovery) is economically inefficient. Waste management policies can significantly contribute to climate change policies by reducing both methane emissions (CH4) from landfills and carbon dioxide emissions (CO2) as a result of (fossil) energy savings due to waste incineration with energy.
(30) 30. European Environmental Priorities. recovery. The AP scenario may generate considerable secondary benefits. The reduction of the amount of biodegradable waste disposed on landfills will reduce methane emissions from landfill sites, estimated at approximately 65 million tonnes of CO2 eq. These benefits are valued at € 440 million. The most promising policy responses in terms of environmental effectiveness and economic efficiency are virgin materials taxes and recycling credit schemes. The virgin materials tax reduces waste at source, whilst the recycling credit scheme addresses the current market failure in this area. In this way, both policies address main underlying causes of the waste management problem. Soil Degradation Soil degradation resulting from human practices reduces or destroys the land’s longterm productivity and life-support function. Degradation of agricultural soils results in lower yields, persistent weed problems and an increasing need for artificial fertilisers. This assessment focuses on the erosion aspects of soil degradation and the threat to future agricultural productivity due to climate change. Soil erosion accounts for about 60% of the degradation problem, which also encompasses such issues as land development, soil contamination and salinity encroachment. About 12% of Europe’s land area is adversely affected by water erosion, while 4% suffers from wind erosion. These problems exist in most European countries, although the concentration of eroded lands is greatest in the Mediterranean region. There is no framework for European soil directives as soil problems are considered to be local and thus best handled at national or even regional level. Current agri-environmental regulations at both the EU and Member State levels hold considerable promise for effectively preventing and mitigating soil erosion. Landowners are encouraged to adopt more extensive management practices such as organic farming, afforestation, pasture extension and benign crop production. Nevertheless, there is a need for policy makers and the public to intensify efforts to combat the pressures and risks to the soil resource. However, damage estimates suggest that soil conservation measures are likely to be cost-ineffective. There is a significant association between soil degradation, and water management and climate change. Global warming and changing rainfall patterns will probably intensify degradation, which, without adequate responses, will magnify the problems of water pollution and clogged downstream watercourses, including reservoirs. Such changes could also result in the more intensive use of marginal soils to compensate for the loss of degraded land. Policy initiatives targeted at other environmental problems will help to alleviate the problem of soil degradation..
(31) European Environmental Priorities. 1.2.4. 31. Cross-sectional Environmental Issues. Biodiversity loss Diversity of ecosystems, species and genes is critical to the functioning of the ecosphere. At present, ecosystems are undergoing unprecedented degradation and loss of species due to the rapid increase in human use of natural resources. Biodiversity considerations are beginning to be integrated into sectoral policies. Despite this positive development, negative impacts will probably continue from such factors as agricultural intensification, mono-specific forestry, urban and transport development, climate change, pollution and the introduction of alien species. Various pressures on nature areas are not included in this study but are just as important, e.g. forestry, fisheries, hunting, extensive grazing, and fire and water management. The implementation of the Bird and Habitat Directive is progressing. Currently, 5.3% and 10.7% of the EU area is protected under this Directive, which is about one-tenth and one-fifth of EU’s nature areas, respectively. In the past, land-use change was the dominant process for biodiversity loss in the EU. This trend has stopped. Nature areas are projected to expand somewhat (from 49% to 51%) due to the ‘setting aside’ of agricultural land. The total environmental pressure on nature areas will decrease by 22% and 31% in the Baseline and the Accelerated Policy scenarios, respectively. This decrease is a spillover effect of the significant decrease in pressures from acidification, tropospheric ozone and eutrophication and, to a lesser extent, to de-fragmentation. Pressure from climate change will increase substantially in the 1990-2010 period. There are no known ‘willingness to pay’ figures for a specific valuation of diversity. However, there is evidence to suggest benefit estimates could be large due to the 'willingness to pay' estimates for habitat and species conservation. Further agricultural policy reform is required to take account of the impacts of or production from the agricultural sector and environmentally destructive technology on biodiversity. The limitations of land-use planning schemes and the earlier MacSharry reforms to the Common Agricultural Policy suggest that new policies will need to target specific issues, such as agri-environmental schemes. Human health: air quality and noise Human health and air quality problems are especially important in cities and large agglomeration. The number of people living in urban agglomerations is steadily increasing in the EU. This results in a greater potential effect on such environmental issues as air, noise, water pollution, concentrated waste levels and restricted amounts of open space. A common analytical framework for modelling such urban stresses is not currently available. This study focuses mainly on concentrations of selected air pollutants in cities and rural areas in the EU and noise nuisance. Regarding noise, more than 30% of the EU population is currently exposed to road noise nuisance. In the future, it is likely that noise levels (both road and air traffic) will increase..
Afbeelding
+7
GERELATEERDE DOCUMENTEN
Sedert 1948, maar veral ná 1960, sou die verband tussen vrees en rasseskeiding nie net sterker in die breë blanke politiek na vore kom nie, maar in besonder in die regse
Since the reliable semantic interpretation of illustrated handwritten heritage collec- tions requires an integrated approach to text and image recognition, this paper describes
Among people with strong prior beliefs, candidate characteristics are evaluated more positive when exposed to the correct news article, than to misinformation.. This effect
Deze worden in een bak gezet, zo dat de potten net onder water staan (afwasteiltjes zijn heel geschikt).. Zaaigoed en jonge planten afscher- men
The first two are policing functions, needed to make sure that PCN- packets admitted into the PCN-domain belong to a flow that has been admitted and to ensure that the
2 Voor het antwoord op een vraag worden door de examinator en door de gecommitteerde scorepunten toegekend, in overeenstemming met het beoordelingsmodel.. Scorepunten zijn
Bij de items die betrekking hebben op de verschillende aspecten van de schoolorganisatie komt ook naar voren dat scholen weinig eisen stellen aan leraren, en ook niet optreden
Empirical power of the score and likelihood ratio tests of no 1-inflation in the positive Poisson model, for various values of and , for the case of no covariates, for n =
