K.A. Mooijman
National Institute for Public Health and the Environment
P.O. Box 1 | 3720 BA Bilthoven www.rivm.com
EU Interlaboratory comparison study
animal feed II (2012)
Detection of Salmonella in chicken feed
Colophon
© RIVM 2013
Parts of this publication may be reproduced, provided acknowledgement is given to: National Institute for Public Health and the Environment, along with the title and year of publication.
Kuijpers A.F.A.
Kassteele van de J.
Mooijman K.A.
Contact:
Angelina Kuijpers
Centre for Zoonoses & Environmental Microbiology (cZ&O)
Angelina.Kuijpers@rivm.nl
This investigation has been performed by order and for the account of the European Commission, Directorate-General for Health and Consumer Protection (DG-Sanco), within the framework of RIVM Project number V/330604/12 European Union Reference Laboratory for Salmonella (EURL) 2012.
Rapport in het kort
EU Ringonderzoek dierenvoeder studie II (2012) Detectie van Salmonella in kippenvoer
In 2012 waren 30 van de 34 Nationale Referentie Laboratoria (NRL’s) in de Europese Unie in staat om hoge en lage concentraties van de Salmonella-bacterie in kippenvoer aan te tonen. Van de vier die daar niet in slaagden heeft één NRL de toegestuurde monsters niet ingezet vanwege organisatorische problemen. Drie labs detecteerden onterecht dat er Salmonella in een blanco monster zat (vals positief). Een van deze drie behaalde een matig resultaat als gevolg van een foutieve verwerking van ruwe data. De twee overige laboratoria scoorden ook tijdens de herkansing een vals positief resultaat, mogelijk
veroorzaakt door een kruisbesmetting tijdens het onderzoek. Vanwege herhaaldelijk slechte prestaties is een van deze NRL bezocht door het overkoepelend orgaan EURL-Salmonella en zijn enkele verbeterpunten aangereikt. In totaal hebben de laboratoria, afhankelijk van de gebruikte methoden, tussen de 94 en 97 procent van de besmette monsters Salmonella aangetoond.
Ringonderzoek verplicht voor Europese lidstaten
Dit blijkt uit het tweede dierenvoederringonderzoek dat het Referentie-Laboratorium van de Europese Unie (EURL) voor Salmonella heeft
georganiseerd. Het onderzoek is in september 2012 gehouden, de herkansing was in januari 2013. Deelname aan het onderzoek is verplicht voor alle NRL’s van de Europese lidstaten die ervoor verantwoordelijk zijn Salmonella op te sporen in diervoeders. Het EURL-Salmonella is gevestigd bij het Nederlandse Rijksinstituut voor Volksgezondheid en Milieu (RIVM).
De laboratoria tonen de Salmonellabacterie aan met behulp van drie
internationaal erkende analysemethodes (RVS, MKTTn en MSRV). Vervolgens moeten zij de studie volgens voorschrift uitvoeren. Elk laboratorium krijgt daarvoor een pakket toegestuurd met kippenvoer (vrij van Salmonella) en referentiematerialen, die geen of verschillende besmettingsniveaus van
Salmonella Enteritidis bevatten. Het kippenvoer en het referentiemateriaal
worden vervolgens samengevoegd en onderzocht. Zogeheten Lenticule discs zijn als referentiemateriaal gebruikt en gaven in voedsel en veterinaire studies goede resultaten.
MKTTn significant betere analysemethode
De resultaten van dit ringonderzoek onderschrijven het nut om met meerdere analysemethoden te werken. De MKTTn bleek namelijk significant betere resultaten te tonen ten opzichte van RVS en MSRV om Salmonella aan te tonen in het kippenvoer. Dit in tegenstelling tot eerdere ringonderzoeken waarbij andere ‘producten’ werden onderzocht, zoals gehakt of een andere soort kippenvoer.
Abstract
EURL Interlaboratory comparison study on animal feed II (2012) Detection of Salmonella in chicken feed
In 2012, it was shown that 30 of the 34 National Reference Laboratories (NRLs) for Salmonella in the European Union were able to detect the presence of
Salmonella in chicken feed, at both low and high levels. Organizational problems
meant that one of the remaining four laboratories was unable to process the samples that it had been sent. The other three laboratories reported false positive results (they detected Salmonella in blank samples). One of these three laboratories made an initial transcription error when processing the raw data, which led to it being rated as ‘moderate’. The remaining two laboratories in this group also reported false positive results during the follow-up study. This was probably caused by cross-contamination during the proficiency test. Due to its consistently poor performance, one NRL was visited by EURL-Salmonella (a central coordinating body), which was able to identify various points for improvement. Depending on the method used, the laboratories detected
Salmonella in 94 to 97 percent of the contaminated samples tested. Interlaboratory comparison study obligatory for European Member States
These were the results obtained in the second interlaboratory comparison study on animal feed, which was organized by the European Union Reference
Laboratory for Salmonella (EURL-Salmonella). The study was conducted in September 2012, with a follow-up study in January 2013. Within the European Member States, all NRLs responsible for the detection of Salmonella in animal feed samples were required to participate in this study. EURL-Salmonella is part of the Dutch National Institute for Public Health and the Environment (RIVM). The laboratories used three internationally accepted analytical methods (RVS, MKTTn and MSRV) to test for the presence of Salmonella in samples. They were required to proceed in accordance with the study protocol. To this end, each laboratory received a package containing chicken feed (free from Salmonella) and a range of reference materials which were either Salmonella-free or which contained different levels of this bacterium. The laboratories were instructed to spike the chicken feed with the reference materials before taking samples for testing. The use of Lenticule discs as reference material gave good results in both the food and veterinary studies.
MKTTn analytical method significantly superior
This study’s results underscore the benefits of using more than just one
analytical method, as MKTTn delivered significantly better results than RVS and MSRV in terms of detecting Salmonella in chicken feed. This is in contrast to earlier studies in which other “products” were analysed, such as minced meat or another type of chicken feed.
Contents
Contents 7
Summary 9
1
Introduction 11
2
Participants 13
3
Materials and methods 15
3.1
Reference materials 15
3.1.1
Batches of lenticule discs 15
3.1.2
Homogeneity of the lenticule discs 15
3.1.3
Stability and robustness of lenticule discs 15
3.1.4
Pre-tests for the interlaboratory comparison study 16
3.2
Chicken feed samples 16
3.2.1
General 16
3.2.2
Total bacterial count in chicken feed 16
3.2.3
Number of Enterobacteriaceae in chicken feed 16
3.3
Design of the interlaboratory comparison study 17
3.3.1
Samples: lenticule discs and chicken feed 17
3.3.2
Sample packaging and temperature recording during shipment 17
3.4
Methods 18
3.5
Statistical analysis of the data 18
3.6
Good performance 19
4
Results 21
4.1
Reference materials 21
4.1.1
Contamination level, homogeneity and stability of the lenticule discs 21
4.1.2
Pre-test for the interlaboratory comparison study 21
4.2
Chicken feed samples 21
4.3
Technical data from interlaboratory comparison study 22
4.3.1
General 22
4.3.2
Accreditation/certification 22
4.3.3
Transport of samples 22
4.3.4
Media 23
4.4
Control samples 26
4.4.1
General 26
4.4.2
Specificity, sensitivity and accuracy rates of the control samples 28
4.5
Results for chicken feed samples artificially contaminated with Salmonella
28
4.5.1
Results per type of lenticule disc and per laboratory 28
4.5.2
Results per selective enrichment medium, lenticule disc and per laboratory
29
4.5.3
Specificity, sensitivity and accuracy rates of the artificially contaminated samples
34
4.6
PCR (Own method) 35
4.7
Performance of the NRLs 36
4.7.1
General 36
4.7.2
Follow-up study 37
5
Discussion 41
6
Conclusions 45
List of abbreviations 47
References 49
Annex 1 Number of positive results of the control samples (lenticule disc without matrix) per laboratory and per selective enrichment medium 52
Annex 2 Number of positive results for the artificially contaminated chicken feed samples (with lenticule disc) per laboratory and per selective
Summary
In September 2012, the European Union Reference Laboratory for Salmonella (EURL-Salmonella) organized the second interlaboratory comparison study on detection of Salmonella in an animal feed matrix: poultry feed, mixed meal for laying hens. Participants were 34 National Reference Laboratories for Salmonella (NRLs-Salmonella): 29 NRLs from 27 EU Member States (MS), 2 candidate EU MSs and 2 NRLs from member countries of the European Free Trade Association (EFTA) and 1 NRL from a third country (non-European).
The most important objective of the study was to test the performance of the participating laboratories for the detection of Salmonella at different
contamination levels in an animal feed matrix. To do so, chicken feed samples of 25 grams each were analysed in the presence of reference materials (being lenticule discs) containing Salmonella at various contamination levels. The performance of the laboratories was compared to criteria of good performance. In addition, a comparison was made between the prescribed methods
(ISO 6579: Anonymous, 2002) and the requested method (Annex D of ISO 6579: Anonymous, 2007). For the prescribed method, the selective enrichment media were Rappaport Vassiliadis Soya broth (RVS) and Mueller Kauffmann Tetrathionate novobiocin broth (MKTTn). For the requested method, the selective enrichment was Modified Semi-solid Rappaport Vassiliadis (MSRV) agar. Optionally, a laboratory could also use a PCR as an additional (own) method for the detection of Salmonella.
In comparison with former EURL-Salmonella interlaboratory comparison studies, a lower number of samples were tested containing only one Salmonella serovar. For the number of samples and their contamination levels, CEN ISO /TS 22117 (Anonymous, 2010) was followed.
Twenty-three individually numbered lenticule discs had to be tested by the participants for the presence or absence of Salmonella. Eighteen lenticule discs had to be examined in combination with each 25 grams of Salmonella negative chicken feed: six lenticule discs contained approximately eight colony-forming units (CFU ) of Salmonella Enteritidis (SE8), six lenticule discs contained approximately 50 CFU of S. Enteritidis (SE50) and six lenticule discs contained no Salmonella at all (blank lenticule discs). The other five lenticule discs, to which no chicken feed had to be added, were control samples, comprising two lenticule discs SE8, one lenticule disc SE50 and one blank lenticule disc. The laboratories found Salmonella in 94-97% of the (contaminated) samples, depending on the used selective enrichment medium. The accuracy rates for the prescribed selective enrichment media for food, MKTTn and RVS, were
respectively 98% and 96%. For the requested method (MSRV), the accuracy rate was 97%. A comparison between the different media did show a significant higher score for the low-level SE contaminated chicken feed samples when analysed with selective enrichment medium MKTTn.
Longer incubation (additional 24 hours) of MSRV resulted in more positive results, which was most clear for the low-level SE contaminated chicken feed samples (8% more positive results).
PCR was used as an own method by five participants. The laboratories scored all tested samples correctly with the PCR method used. One NRL found better results with the PCR than with the bacteriological culture methods.
Thirty out of 34 laboratories achieved the level of good performance at once. One NRL (EU-MS) did not perform the study due to organizational problems and this was considered as an incident. One NRL reported a positive result for a blank sample, which was indicated as a transcription error after the reporting deadline. The performance of this NRL was indicated as moderate. Two
laboratories, one EU-MS and one candidate EU-MS reported false positive, blank control samples. For these two NRLs, a follow-up study was organized in January 2013. One NRL (EU-MS) repeatedly showed deviating results in ring trials with animal feed as a matrix and the EURL-Salmonella visited this laboratory while they performed the follow-up study. Both poorly performing laboratories again found false positive, blank control samples and did not reach the desired
performance level. The EC, DG Sanco was informed about the deviations and the underperformance of both NRLs.
1
Introduction
An important task of the European Union Reference Laboratory for Salmonella (EURL-Salmonella), as laid down in the Commission Regulation EC No 882/2004 (EC, 2004), is the organization of interlaboratory comparison studies to test the performances of the National Reference Laboratories (NRLs) for Salmonella. The history of the interlaboratory comparison studies on the detection of Salmonella, as organized by EURL-Salmonella (formerly called CRL-Salmonella) since 1995 is summarized on the EURL-Salmonella website (EURL-Salmonella, 2013). The objective of the current study, organized by the EURL for Salmonella in
September 2012, was to see whether the participating laboratories could detect
Salmonella at different contamination levels in chicken feed. This information is
important in order to know whether the examination of samples in the EU Member States (MS) is carried out uniformly and whether comparable results can be obtained by NRLs-Salmonella. Additionally, the different methods for the detection of Salmonella in chicken feed were compared.
The prescribed method for detection of Salmonella in a feed matrix is ISO 6579 (Anonymous, 2002). However, as good experiences have been gained with selective enrichment on Modified Semi-solid Rappaport Vassiliadis (MSRV) for the detection of Salmonella spp. in animal faeces (Annex D of ISO 6579:
Anonymous, 2007), as well as for the detection of Salmonella in food and animal feed samples, participating laboratories were also requested to use MSRV for testing the chicken feed.
The set-up of this study was comparable to earlier interlaboratory comparison studies on the detection of Salmonella spp. in veterinary, food and feed samples. Animal feed was artificially contaminated with reference materials, consisting of lenticule discs containing a Salmonella serovar at low level, high level, or no Salmonella at all. Like in the earlier studies, the contamination level of the low-level lenticule discs was close to the detection limit of the method and the level of the high-level samples was approximately 5-10 times above the detection limit. The number of samples tested was lower than in earlier
studies.In total, 18 contaminated chicken feed samples were tested: 6 negative samples, 6 low level samples and 6 high level samples from only one Salmonella serovar (Salmonella Enteritidis). Additional, five control samples (lenticule discs without feed) and two procedure control samples were tested. The number and level of samples tested were in accordance with CEN ISO /TS 22117
2
Participants
Country City Institute / NRL Salmonella
Austria Linz Austrian Agency for Health and Food Safety (AGES) Institut für Tierernährung und Futtermittel, Mikrobiology
Belgium Brussels Veterinary and Agrochemical Research Centre (VAR)
Bulgaria Sophia National Diagnostic Research Veterinary Institute NDRVMI
Croatia Zagreb Croatian Veterinary Institute, Laboratory Microbiology Feed
Cyprus Nicosia Ministry of Agriculture, Natural Resources and Environment
Veterinary Services Laboratory for the Control of Foods of Animal Origin (LCFAO)
Czech Republic
Prague State Veterinary Institute
Denmark Esjberg Danish Veterinary and Food Administration Region South Laboratory, Microbiology
Estonia Tartu Estonian Veterinary and Food Laboratory
Finland Helsinki Finnish Food Safety Authority Evira Research Department, Microbiology Unit
France Ploufragan Anses Laboratoire de Ploufragan, Laboratoire d'Etudes et de
Recherches Avicoles, Porcines et Piscicoles Unite HQPAP
Germany Berlin Federal Institute for Risk Assessment (BFR)
Greece Halkis Veterinary Laboratory of Chalkis
Hellenic Republic Ministry of Rural Development and Food
Hungary Budapest National Food Chain Safety Office, Food and Feed Safety Directorate
Iceland Reykjavik University of Iceland, Keldur Institute for Experimental Pathology
Ireland Kildare Central Veterinary Research Laboratory CVRL/DAF Department of Agriculture
Israel Kiryat Malachi Southern Poultry Health Laboratory
Italy Legnaro PD Istituto Zooprofilattico Sperimentale delle Venezie, OIE
Latvia Riga Institute of Food Safety, Animal Health and Environment
BIOR Animal Disease Diagnostic Laboratory
Lithuania Vilnius National Food and Veterinary Risk Assessment Institute
Luxembourg Ettelbruck Laboratoires de controle et d'essais de l'ASTA Service de microbiologie et biochimie
Malta Valletta Public Health Laboratory (PHL) Evans Buildings
Netherlands, the
Bilthoven National Institute for Public Health and the Environment (RIVM/Cib) Centre for Infectious Diseases Control Laboratory for Zoonoses and Environmental Microbiology-LZO
Netherlands, the
Wageningen Nederlandse Voedsel en Waren Autoriteit (nVWA) Divisie Consument & Veiligheid, Microbiologie Primaire Producten
Country City Institute
Poland Pulawy National Veterinary Research Institute (NVRI) Department of Hygiene of Animal Feeding Stuffs
Portugal* Lisbon Instituto Nacional dos Recursos Biológicos
Bacteriology Laboratory of the Animal Health Unit in LNIV
Romania Bucharest Hygiene and Veterinary Public Health Institute (IISPV)
Serbia Belgrade Institute of Veterinary Medicine of Serbia Department of Food Hygiene
Slovak Republic
Bratislava State Veterinary and Food Institute
Slovenia Ljubljana National Veterinary Institute, Veterinary Faculty
Spain Madrid, Algete Laboratorio Central de Veterinaria
Sweden Uppsala National Veterinary Institute (SVA), Department of Bacteriology
United Kingdom
Addlestone Animal Health and Veterinary Laboratories Agency(AHVLA) Weybridge
United Kingdom
Belfast Agri-Food and Bioscience Institute (AFBI) Veterinary Sciences Division Bacteriology *Laboratory received the samples, but did not perform the study
3
Materials and methods
3.1 Reference materials
3.1.1 Batches of lenticule discs
The reference materials consisted of lenticule discs obtained from the Health Protection Agency (HPA) in Newcastle, United Kingdom. Lenticule discs are microbiological reference materials which are plano-convex discs containing micro-organisms at a defined number in a solid, water soluble matrix (HPA, 2012). They are supplied as a single unit supported on a silica gel insert in a small airtight plastic tube (EURL-Salmonella, 2012b). The discs are lens-shaped and coloured, and therefore easily seen on top of the filter insert. The
Salmonella strains used for the preparation of the lenticule discs originated from
the National Collection of Type Cultures (NCTC) of HPA. Three batches of lenticule discs were prepared by HPA:
• S. Enteritidis (SE) at a level of approximately 8 CFU per lenticule disc: batch NCTC 6676 batch 414-110615B;
• S. Enteritidis (SE) at a level of approximately 50 CFU per lenticule disc: batch NCTC 6676 batch 814-110615R;
• Blank lenticule discs (BL), containing no micro-organisms: batch 000-1229952.
3.1.2 Homogeneity of the lenticule discs
The mean number of organisms of each batch was counted by HPA before the lenticule discs were sent to the EURL-Salmonella. For this, the HPA tested 30 lenticules per batch. The data were reported on the insert of the batch of lenticules and were subjected to a homogeneity test at the EURL Salmonella. It was tested whether the variation in counts between the lenticule discs was less than two times a Poisson distribution, using the following formula:
T2 / (I-1) ≤ 2. Where T2 is a measure for the variation between lenticule discs of one batch and I is the number of lenticule discs (Heisterkamp, 1993).
3.1.3 Stability and robustness of lenticule discs
In the literature, information can be found on the stability of several types of lenticule discs during storage and transport (Boyd et al., 2006 and Desai et al., 2006). Additional tests of the stability of the lenticule discs at elevated
temperatures, as well as tests on the ‘robustness’ of the lenticule discs (mix with different matrices), were performed on the Salmonella lenticule discs at the EURL-Salmonella laboratory earlier (Kuijpers and Mooijman, 2011 and 2013; Kuijpers et al., 2012a).
For the current study, the contamination level of each batch of lenticule discs was verified by the EURL by testing 3 lenticule discs per batch (SE8 and SE50) after storage at - 20°C.
For the counting of the lenticule discs, each lenticule disc was placed onto Colombia agar plates with sheep blood (OXOID PB5008A, Germany). After ten minutes of rehydration of the lenticule disc at room temperature, the resultant ‘drop’ was spread over the plate and incubated at 37°C for 20 to 24 hours. This method is also used by HPA to count the mean number of organisms of each batch of lenticule discs.
3.1.4 Pre-tests for the interlaboratory comparison study
Before organizing the interlaboratory comparison study, it was tested whether
Salmonella could still be detected after mixing a Salmonella lenticule disc with
the matrix (chicken feed). For this, lenticules with two different Salmonella serovars were tested, i.e. Salmonella Enteritidis (SE) and Salmonella
Typhimurium (STM). The batches of the lenticules used for this pre-test were used in earlier studies and more details can be found in the relevant reports (Kuijpers et al. 2012a and Kuijpers and Mooijman 2013). For the pre-test, 6lenticule discs SE8 (batch 414-110615A) and STM6 (batch 323-101021), 2 lenticule discs SE51 (batch 814-110615), STM61 (batch 523-100927) and 2 Blanc lenticule discs were each added to 25 g chicken feed (free from
Salmonella) in 225 ml BPW. Additionally, 2 control samples (lenticule discs
without matrix) of each batch of lenticule discs were tested.
All samples were tested for the presence of Salmonella according the SOP of the study (EURL Salmonella, 2012b), ISO 6579 (Anonymous, 2002) and Annex D of ISO 6579 (Anonymous, 2007) with selective enrichment in RVS, MKTTn and on MSRV.
3.2 Chicken feed samples
3.2.1 General
The chicken feed (poultry feed, mixed meal for laying hens) was obtained from the retail sector and was produced by Kasper Fauna Food, Woerden, in the Netherlands. A batch of seven portions of 4 kg arrived at EURL-Salmonella on 10 July 2012 and was immediately checked for the absence of Salmonella by testing 25 g samples, randomly picked from the seven portions. For the testing for Salmonella, ISO 6579 (Anonymous, 2002) and Annex D of ISO 6579 (Anonymous, 2007) were followed. For this purpose, each sample of 25 g was added to 225 ml of Buffered Peptone Water (BPW). After pre-enrichment at 37 (± 1)°C for 16- 18 hours, selective enrichment was carried out in Rappaport Vassiliadis Soya broth (RVS), Mueller Kaufmann Tetrathionate novobiocin broth (MKTTn) and on Modified Semi-solid Rappaport Vassiliadis (MSRV). Next, the suspect plates were plated-out on Xylose Lysine Deoxycholate agar (XLD) and Brilliance Salmonella agar (BSA) and confirmed biochemically.
After checking the absence of Salmonella, the animal feed was repacked in portions of approximately 550 grams and stored at room temperature.
3.2.2 Total bacterial count in chicken feed
The total number of aerobic bacteria in the chicken feed was investigated. The procedure of ISO 4833 (Anonymous, 2003a) was followed for this purpose. Portions of 20 grams of chicken feed were homogenized into 180 ml of peptone saline solution in a plastic bag. The content was mixed by using a stomacher (for 60 seconds). Next, tenfold dilutions were prepared in a peptone saline solution. Two times 1 ml of each dilution was placed in two empty Petri dishes (diameter 9 cm). To each dish, 15 ml of molten Plate Count Agar (PCA) was added. After the PCA was solidified, an additional 5 ml of PCA was added to the agar. The plates were incubated at 30 (± 1)°C for 72 (± 3) hours and the total number of aerobic bacteria was counted after incubation.
3.2.3 Number of Enterobacteriaceae in chicken feed
In addition to the total count of aerobic bacteria, the Enterobacteriaceae count was determined. The procedure of ISO 21528-2 (Anonymous, 2004) was used for this purpose. Portions of 20 grams of chicken feed were homogenized into
180 ml of peptone saline solution in a plastic bag. The content was mixed by using a stomacher (for 60 seconds). Next, tenfold dilutions were prepared in peptone saline solution. Two times 1 ml of each dilution was placed in two empty Petri dishes (diameter 9 cm). To each dish, 10 ml of molten Violet Red Bile Glucose agar (VRBG) was added. After the VRBG was solidified, an
additional 15 ml of VRBG was added to the agar. These plates were incubated at 37 (± 1)°C for 24 (± 2) hours and the number of typical violet-red colonies was counted after incubation. Five typical colonies were tested for the fermentation of glucose and for a negative oxidase reaction. After this confirmation, the number of Enterobacteriaceae was calculated.
3.3 Design of the interlaboratory comparison study 3.3.1 Samples: lenticule discs and chicken feed
On 17 September 2012 (two weeks before the study) the reference materials (33 individually numbered lenticule discs) and 550 grams of Salmonella negative chicken feed were packed with cooling devices as biological substance category B (UN 3373) and sent by door-to-door courier service to each participant. After arrival at the laboratory, the lenticule discs had to be stored at -20°Cand the chicken feed had to be stored at +5°Cuntil the start of the study. Details about the mailing and handling of the samples and reporting of test results can be found in the Protocol (EURL-Salmonella, 2012a), Standard Operating Procedure (SOP) (EURL-Salmonella, 2012b) and the test report (EURL-Salmonella, 2012c). The protocol, SOP and the test report that was used during the study can be found on the EURL-Salmonella website or can be obtained through the corresponding author of this report.
Five control lenticule discs had to be tested without chicken feed (numbered C1-C5). Eighteen lenticule discs (numbered B1-B18) were each tested in combination with 25 grams of chicken feed (negative for Salmonella). Table 1 shows the types and the number of lenticule discs and chicken feed samples which had to be tested. The number and level of samples tested were in accordance with CEN ISO /TS 22117 (Anonymous, 2010).
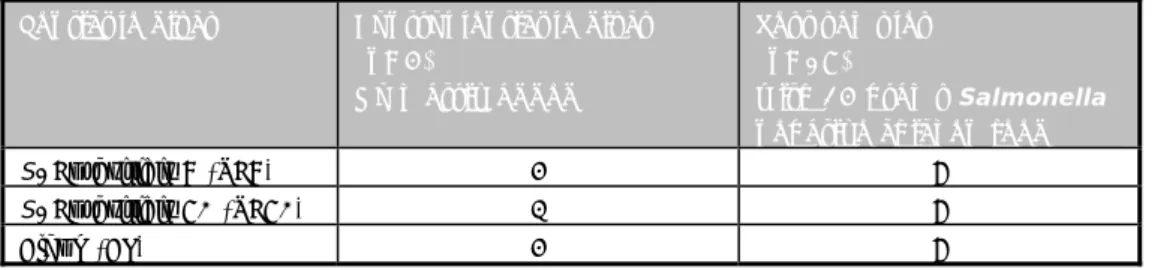
Table 1 Overview of the types and the number of lenticule discs tested per laboratory in the interlaboratory comparison study
Lenticule discs Control lenticule discs (n=5)
No matrix added
Test samples (n=18)
with 25 grams Salmonella negative chicken feed
S. Enteritidis 8 (SE8) 2 6
S. Enteritidis 50 (SE50) 1 6
Blank (BL) 2 6
3.3.2 Sample packaging and temperature recording during shipment
The lenticule discs and the chicken feed were packed in two plastic containers that were firmly sealed with screw caps (biopacks). Both biopacks were placed in one large shipping box, together with three frozen (-20°C) cooling devices. Each shipping box was sent as biological substances category B (UN3373) by door-to-door courier services. For the control of exposure to abusive temperatures during shipment and storage, so-called micro-temperature loggers were used to
record the temperature during transport. These loggers are tiny sealed units in a 16 mm diameter and 6 mm deep stainless steel case. Each shipping box
contained one logger, packed in the biopack with lenticule discs. The loggers were programmed by the EURL-Salmonella to measure the temperature every hour. Each NRL had to return the temperature recorder, immediately after receipt of the parcel, to the EURL. At the EURL-Salmonella, the loggers were read by the computer and all temperatures recorded from the start of the shipment until the arrival at the National Reference Laboratories were transferred to an Excel sheet.
3.4 Methods
The NRLs could use the pre-treatment procedures of the samples as normally used in daily routine analyses (e.g. pre-warming of BPW, different ways of mixing the samples in BPW). According to ISO 6887-4 (Anonymous, 2003c), the chicken feed diluted in BPW needs to stand for 20-30 minutes at 18°C to 27°C before mixing. This was described in greater detail in the SOP of this study (EURL-Salmonella, 2012b).
The prescribed method of this interlaboratory comparison study was ISO 6579 (Anonymous, 2002) and the requested (additional) method was Annex D of ISO 6579 (Anonymous, 2007). In addition to the prescribed methods, the NRLs were also free to use their own methods. This could be different medium
combinations and/or investigation of the samples with alternative methods, such as Polymerase Chain Reaction (PCR)-based methods.
In summary:
Pre-enrichment in:
Buffered Peptone Water (BPW) (prescribed)
Selective enrichment in/on:
Rappaport Vassiliadis Soya broth (RVS) (prescribed);
Mueller Kaufmann Tetrathionate novobiocin broth (MKTTn) (prescribed); Modified semi-solid Rappaport Vassiliadis agar (MSRV) (requested); own selective enrichment medium (optional).
Plating-out on:
Xylose lysine desoxycholate agar (XLD) (prescribed); second plating-out medium for choice (obligatory); own plating-out medium (optional).
Confirmation of identity:
Confirmation by means of appropriate biochemical tests (ISO 6579: Anonymous, 2002) or by reliable, commercially available identification kits and serological tests.
3.5 Statistical analysis of the data
The specificity, sensitivity and accuracy rates were calculated for the control samples and the artificially contaminated samples with chicken feed (negative for Salmonella spp.). The specificity, sensitivity and accuracy rates were calculated according to the following formulae:
Specificity rate: × 100%
Sensitivity rate: × 100%
Accuracy rate: × 100%
Mixed effect logistic regression (Gelman and Hill, 2007) was used for modelling the binary outcomes as a function of a fixed effect part, consisting of the
lenticule discs, enrichment media and isolation media, and a random effect part, consisting of the different laboratories. Mutual differences between media and lenticule discs are shown as odds ratios (OR) stratified by medium. The odds of detecting Salmonella is the probability of detecting Salmonella divided by the probability of not detecting it. An odds ratio is the ratio of the odds of detecting
Salmonella in one group to the odds of detecting it in another group and can be
interpreted as an effect size. Groups are, for instance, two different media. A Bayesian approach was adopted to prevent spurious odds ratios, i.e. zero or infinite odds ratios (Gelman and Hill, 2007). This was done by putting vague prior information on the odds of detecting Salmonella. A priori, the odds were set to 1 with a 95% confidence interval of 0.025 - 40. As a result, the eventual odds and odds ratios will be ‘shrunken’ towards one and values equal to zero or infinity are made impossible.
Results were analysed using the statistical software R (R Development Core Team, 2013).
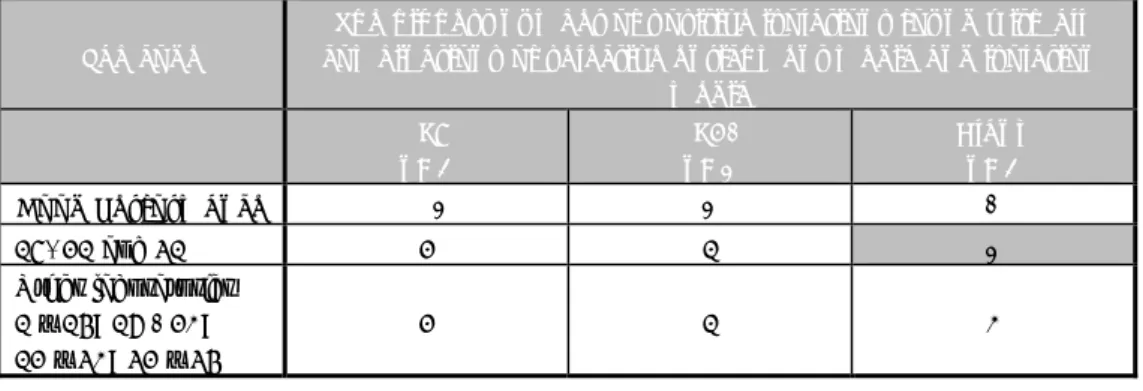
3.6 Good performance
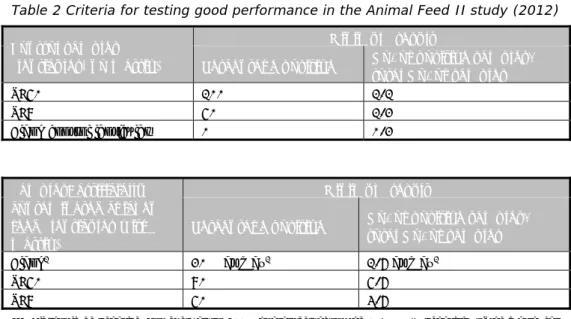
The criteria used for testing good performance in this study are given in Table 2. For determining good performance per laboratory, all combinations of selective enrichment media and isolation media used by the laboratory were taken into account. For example, if a laboratory found for the SE8 lenticule discs with matrix 4/6 a positive with RVS/XLD but no positives with MKTTn or any other selective enrichment or isolation medium, this was still considered a good result. For the blank lenticule discs, all combinations of media used per laboratory were also taken into account. If, for example, a laboratory found 2/6 blank lenticule discs positive with MKTTn/BGA but no positives with the other media, this was still considered a ‘not good’ result.
samples negative (expected) of number Total results negative of Number samples positive (expected) of number Total results positive of Number negative) and (positive samples of number Total negative) and (positive results correct of Number
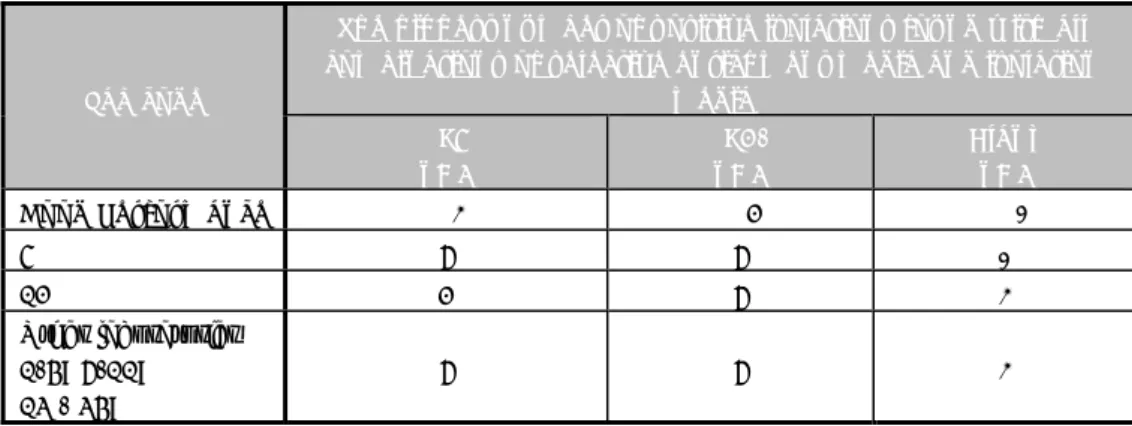
Table 2 Criteria for testing good performance in the Animal Feed II study (2012) Control samples
(lenticules, no matrix)
Minimum result
Percentage positive No. of positive samples/ total No. of samples
SE50 100% 1/1
SE8 50% 1/2
Blank control lenticules 0% 0/2
Samples: artificially contaminated chicken feed (lenticules with matrix)
Minimum result
Percentage positive No. of positive samples/ total No. of samples
Blank1 20% at max1 1/6 at max1
SE50 80% 5/6
SE8 50% 3/6
1: All should be negative. However, as no 100% guarantees about the Salmonella negativity of the matrix can be given, one positive out of six blank samples (20% pos.) will still be considered as acceptable.
4
Results
4.1 Reference materials
4.1.1 Contamination level, homogeneity and stability of the lenticule discs
Table 3 summarises the information on the contamination level of each batch of lenticule discs as tested by HPA and by the EURL-Salmonella. The mean levels, as well as the lowest and highest counts (in CFU) found per batch, are indicated. Additionally, the results of the homogeneity test of each batch as performed by the EURL Salmonella are indicated. The results of the homogeneity test show that each batch fulfilled the pre-set criteria (variation less than two times Poisson distribution).
The verification of the contamination levels of both batches of SE lenticule discs after arrival at the EURL-Salmonella showed values between the minimum and maximum CFU counted by HPA after preparation.
Table 3 Level of contamination and homogeneity of SE lenticule discs
SE8 SE50
Batch number 414-100515B 814-110615R
Date testing lenticules* 01.07.2011 29.06.2012
Number of lenticules tested 30 30
Mean CFU per lenticule 8 50
Min-max CFU per lenticule 3-13 34-65
T2 / (I-1)** 0.73 1.33
Date testing lenticules** 04.09.12 04.09.12
Number of lenticules tested 3 3
Mean CFU per lenticule disc 7 48
Min-max CFU per lenticule 4-10 44-50
CFU = colony forming units
min-max = enumerated minimum and maximum CFU * Tested by HPA
** Tested or Calculated by EURL-Salmonella
formula T2: I is the number of lenticule discs; Demand for homogeneity T2 /(I-1) ≤ 2 (Heisterkamp, 1993)
4.1.2 Pre-test for the interlaboratory comparison study
The pre-test of the full procedure of the interlaboratory comparison study performed at the EURL-Salmonella showed good results. All samples of artificially contaminated chicken feed (with lenticules of SE8, STM6, SE51, STM61 and BL) and control samples with lenticule discs (without matrix) were scored correctly with MKTTn, RVS and MSRV. Eventually, a decision was taken to organize the study with the SE lenticules.
4.2 Chicken feed samples
The batch of chicken feed tested negative for Salmonella and was stored at room temperature on 10 July 2012. On Monday 17 September 2012, the chicken feed was posted to the NRLs. After receipt, the NRLs had to store the chicken feed at 5°C. The number of aerobic bacteria and the number of
Enterobacteriaceae were tested twice; firstly, on the day the chicken feed
arrived at the EURL (10/07/2012) and, secondly, after storage at room
date of the interlaboratory comparison study (28 September 2012). Table 4 shows the results.
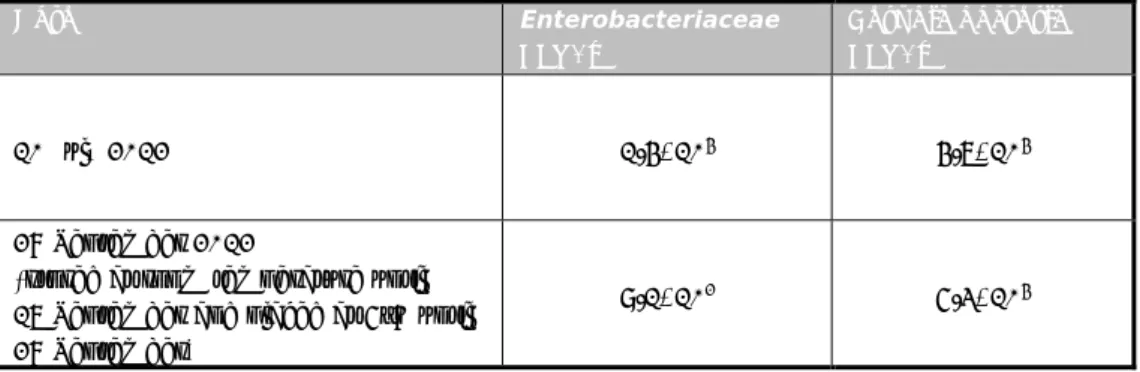
Table 4 Number of aerobic bacteria and the number of Enterobacteriaceae per gram of chicken feed
Date Enterobacteriaceae CFU/g Aerobic bacteria CFU/g 10 July 2012 1.4*104 4.7*104 28 September 2012
(stored at room temperature until 17 September and placed at 5°C until 28 September)
9.1*102 5.3*104
4.3 Technical data from interlaboratory comparison study 4.3.1 General
In this study, 34 NRLs participated: 29 NRLs from 27 EU-MS, two NRLs from members of the EFTA countries, two NRLs of EU candidate MSs and one NRL from a third country. Twenty-nine laboratories performed the study on the planned date (week 40 starting on 1 October 2012). Three laboratories performed the study one week earlier. Laboratory 31 made a mistake with the treatment of four tubes containing reference materials. A second parcel with the relevant samples was sent to the laboratory on 1 October 2012. At last, the laboratory performed the study in three different weeks. One laboratory, of an EU-MS (lab code 28), did not perform the study.
4.3.2 Accreditation/certification
All laboratories, with the exception of laboratory 31 (EU-MS), indicated that they were accredited according ISO/IEC 17025 (Anonymous, 2005). Twenty-four laboratories are accredited for ISO 6579 for the detection of Salmonella in food and animal feedstuffs, 20 of them are also accredited for Annex D of ISO 6579 for different matrices and four of them also mentioned that they were accredited for other methods (e.g. VIDAS). Six laboratories (lab codes 2, 10, 12, 24, 27 and 32) are accredited only for the detection of Salmonella in animal faeces and veterinary samples by using MSRV (Annex D of ISO 6579). One laboratory (lab code 29, non EU-MS) is accredited for the detection of Salmonella in food and faeces by using RVS and MSRV. One laboratory (lab code 6) did not mention the method for which they are accredited. Laboratory 31 is planning to become accredited in 2013.
4.3.3 Transport of samples
Twenty-three participants received the materials within one day of transport. For seven participants (lab codes 1, 3, 11, 13, 14, 19 and 33) the parcel arrived within two days of transport. The transport to both laboratories 7 and 29 took three days and four days to laboratory 10, which is a non EU-MS. The parcel of laboratory 21 (non-EU-MS) was delivered at the airport within one day and placed at -20°Cuntil it arrived at the institute, after eight days of transport, on 25 September 2012.
For the majority of the parcels, the transport temperature did not exceed 5°C. The parcel of laboratory 3 had a transport time of two days, for which the temperature was 22°Cfor 20 hours. For two laboratories (lab codes 7 and 11) the parcels were exposed to a temperature of 9-10°C for 16-20 hours. For two NRLs (lab codes 5 and 26) the date of arrival of the parcel recorded on the test report did not correspond with the date reported by the courier (difference of one day).
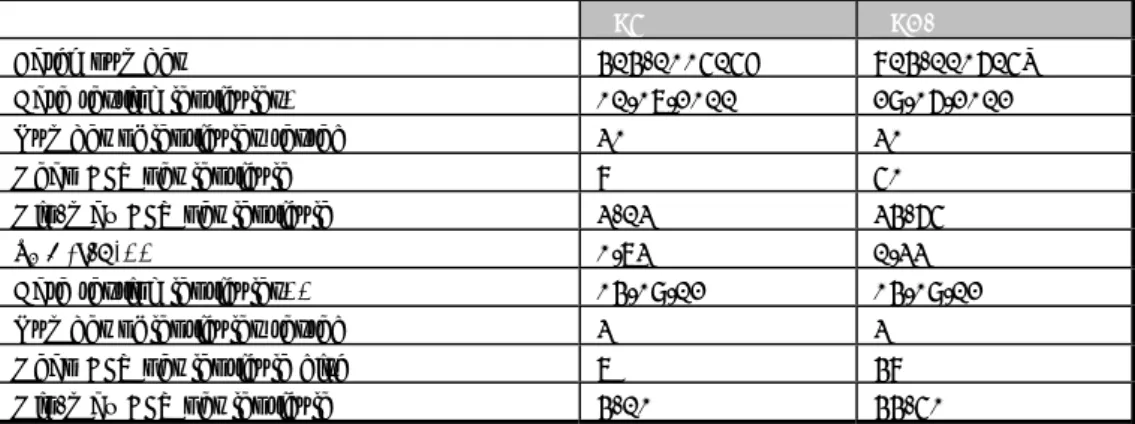
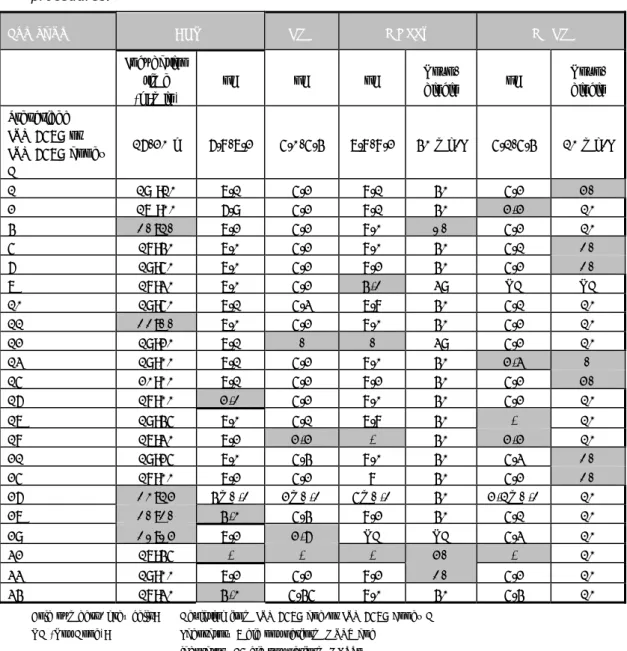
Table 5 Reported technical deviations from the prescribed /requested procedures. Lab code BPW RVS MKTTn MSRV Incubation time (h:min) pH pH pH Novo-biocin pH Novo-biocin Prescribed ISO 6579 or ISO 6579 annex D 16-20 h 6.8-7.2 5.0-5.4 7.8-8.2 40 mg/L 5.1-5.4 10 mg/L 1 19 :10 7.1 5.2 8.1 40 5.2 50 2 17 :00 6.9 5.2 8.1 40 5.5 10 4 20:40 7.2 5.2 8.0 10 5.2 10 5 18:40 7.0 5.2 8.0 40 5.1 20 6 19:50 7.0 5.2 8.2 40 5.2 20 7 18:30 7.0 5.2 7.2 39 ND ND 10 19:50 7.1 5.3 7.8 40 5.1 10 11 22:00 7.0 5.2 8.0 40 5.2 10 12 19:20 7.1 - - 39 5.2 10 13 19:00 7.1 5.2 8.0 40 5.6 0 15 20:00 7.1 5.2 8.2 40 5.2 50 16 18:00 5.2 5.2 8.0 40 5.2 10 17 19:45 7.0 5.1 7.8 40 - 10 18 17:30 7.2 5.5 - 40 5.5 10 21 19:25 7.0 5.4 8.0 40 5.3 20 25 18:00 7.2 5.2 8 40 5.2 20 26 23:45 7±0.2 5±0.2 8±0.2 40 5.4±0.2 10 27 20:20 7.3 5.4 8.2 40 5.1 10 29 21:15 7.2 5.9 ND ND 5.3 10 32 17:45 - - - 50 - 10 33 19:00 7.2 5.2 8.2 20 5.2 10 34 18:30 7.3 5.45 8.0 40 5.4 10
Bold numbers/ grey cells: Deviating from ISO 6579 and/or ISO 6579 Annex D ND (Not Done): Laboratory 7 did not perform MSRV and
laboratory 29 did not perform MKTTn -= No information
4.3.4 Media
Each laboratory was asked to test the samples using the prescribed method (ISO 6579) and the requested (Annex D of ISO 6579) method. Thirty-one participants used the selective enrichment media RVS, MKTTn and MSRV in combination with XLD and a second plating-out medium of their own choice.
Laboratory 29 (non-EU) did not use the prescribed medium MKTTn and laboratory 7 did not use the requested medium MSRV. Six laboratories (lab codes 1, 4, 19, 20, 22, 23 and 33) used more than two isolation media. Table 5 gives information on the pH and the concentration of Novobiocin of the media that were prescribed and requested and on the incubation times. The table only indicates the laboratories who reported deviations.
Five laboratories (lab codes 4, 11, 26, 27and 29) reported a longer incubation time of the pre-enrichment in BPW. Three laboratories (lab codes 16, 27 and 34) reported a deviation of the pH value of BPW.
Two laboratories (lab codes 18 and 29) used a higher pH for the RVS than the prescribed maximum pH of 5.4
Three laboratories (lab codes 7, 10 and 17) used a low pH of 7.2-7.8, the prescribed pH for MKTTn is 7.8-8.2. Two laboratories (lab codes 4 and 33) used MKTTn with a lower concentration of novobiocin and laboratory 32 reported a higher concentration than the prescribed 0.04 g/L of novobiocin.
Six laboratories (lab codes 1, 5, 6, 15, 21 and 25) used MSRV with a higher concentration of novobiocin than the prescribed 0.01 g/L. Laboratory 13 used MSRV without novobiocin. Three laboratories (lab codes 2, 13 and 18) reported a higher pH for the MSRV than the prescribed maximum pH of 5.4.
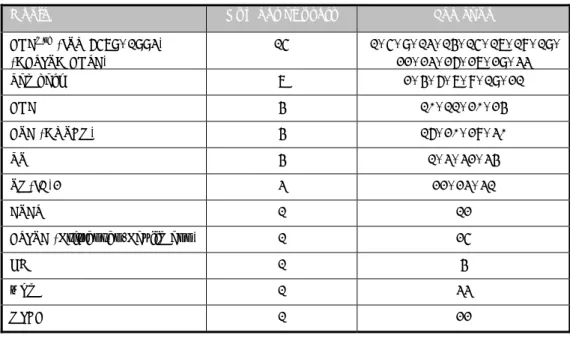
The laboratories 12, 17, 18 and 32 did not always mention the pH of the media. A second plating-out medium of choice was obligatory. Table 6 shows the second plating media used by the participants. Most laboratories used BGA modified (Anonymous, 1993) as a second plating-out medium followed by Rambach agar.
Table 6 Media used as second plating-out medium.
Media Number of users Lab code
BGAmod (ISO 6579, 1993)
(=BPLS= BGPA) 15 1, 5, 9, 13, 14, 15, 17, 18, 19, 22, 23, 26, 27, 29, 33 Rambach 7 2, 4, 6, 7, 8, 19, 21 BGA 4 10, 11, 20, 24 BSA (=OSCM) 4 16, 20, 28, 30 RS 4 1, 3, 32, 34 SM(ID)2 3 22, 23, 31 ASAP 1 12 BPLSA (Kristensen-Kauffmann) 1 25 HE 1 4 MAC 1 33 MLCB 1 22
Explanations of the abbreviations are given in the ‘List of abbreviations’.
The use of an extra plating agar between the ‘isolation’ and the ‘confirmation’ steps was optional. A total of 21 laboratories performed this extra culture step on many different media (e.g. Nutrient agar: ISO 6579, 2002).
All participating laboratories performed confirmation tests for Salmonella: biochemically, serologically or both. Tables 7 and 8 summarize the confirmation
media and tests. Two laboratories (lab codes 2 and 14) performed serological tests only and four laboratories (lab codes16, 23, 26 and 31) performed only a biochemical test.
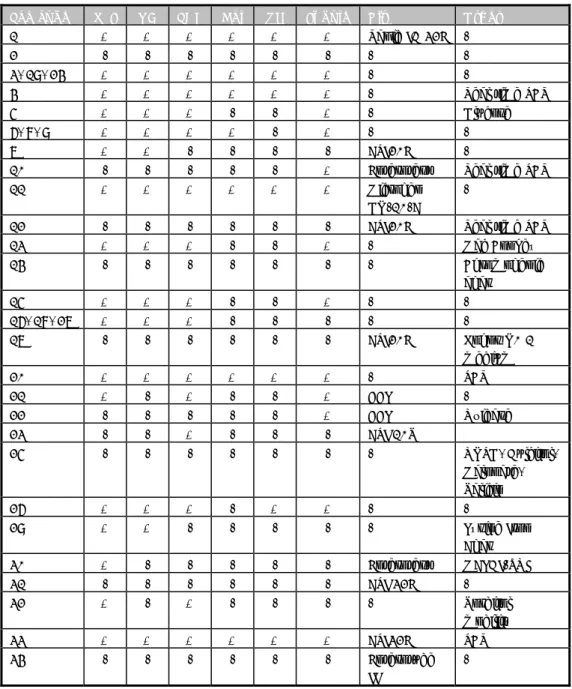
Table 7 Biochemical and other confirmation tests of Salmonella.
Lab code TSI UA LDC Gal VP Indole Kit Other
1 + + + + + + Rapid ID 32E - 2 - - - - - - 3, 19, 24 + + + + + + - - 4 + + + + + + - Real time PCR 5 + + + - - + - Glucose 6, 8, 9 + + + + - + - - 7 + + - - - - API20E -
10 - - - + Enterotest Real time PCR
11 + + + + + + Microgen
GN-10-A -
12 - - - - API20E Real time PCR
13 + + + - - + - Mac Conkey 14 - - - - - Chromogenic agar 15 + + + - - + - - 16, 18, 27 + + + - - - - - 17 - - - - API20E Kohns N0 1 medium 20 + + + + + + - PCR 21 + - + - - + BBL - 22 - - - + BBL Oxidase 23 - - + - - - API 10S 25 - - - - - ONPG, Dulcitol, Malonate, Salicin 26 + + + - + + - - 29 + + - - - Lysine Iron Agar 30 + - - - - - Enterotest MALDI-TOF 31 - - - - API 32E - 32 + - + - - - - Sorbitol mobility 33 + + + + + + API32E PCR 34 - - - - Enterotube II - - = Not done / not mentioned.
Table 8 Serological confirmation of Salmonella.
Lab code Serological
O antigens H antigens Vi antigens
1, 2, 3, 4, 5, 6, 7, 12, 13, 15, 17, 18, 22, 24, 25, 30 + + - 8, 9, 10, 14, 21, 27, 32, 33 + - - 11 + + + 16, 20, 23, 26, 31 - - - 19 - + -
23 Polyvalent Salmonella Serum
29 Latex Agglutination Test
34 Poly A-S + Vi
- = Not done / not mentioned.
4.4 Control samples
4.4.1 General
Twenty-nine laboratories scored correct results for all the control lenticule discs. Table 9 summarizes the highest number of positive isolations found with all combinations of selective enrichment media and isolation media per laboratory (lenticule discs without chicken feed). In Annex 1 more details per laboratory are given on the results found with the selective enrichment media RVS, MKTTn and MSRV in combination with the used isolation media per laboratory.
Table 9 Total number of positive results from the control samples (lenticule disc without animal feed) per laboratory
Lab code
The highest number of positive isolations found with all combinations of selective enrichment media and isolation
media SE8 n=2 SE50 n=1 Blank n=2 Good Performance ≥ 1 1 0 15, 21 and 31 2 1 1 Other laboratories 1 – 14; 16 - 20; 12 – 30; 32 – 34 2 1 0 Bold numbers: deviating results
Grey cell: results are below good performance.
Procedure control without lenticule disc (n=2)
All laboratories correctly analysed the procedure controls as negative: one chicken feed control sample (25 g of chicken feed/no lenticule disc) and one control of BPW only (no animal feed/no lenticule disc).
Blank lenticule discs without addition of chicken feed (n=2)
Thirty laboratories correctly analysed the two blank lenticule discs as negative for Salmonella with all used media. Two laboratories (lab codes 15 and 21) found one blank control lenticule disc to be positive on all used media (MKTTn, RVS and MSRV). One laboratory (lab code 31) found one blank control lenticule positive with selective enrichment in RVS on all used isolation media. With the
other selective enrichment media (MKTTn and MSRV) used this laboratory scored this lenticule disc, inoculated from the same BPW, correctly as negative.
SE8 lenticule discs without addition of chicken feed (n=2)
All participating laboratories except one tested both control lenticule discs containing SE8 and found them to be positive. Laboratory 31 could not detect
Salmonella in one out of two SE8 lenticule discs after selective enrichment on
MSRV, but this laboratory scored all samples correctly with the prescribed selective enrichment media RVS and MKTTn.
SE50 lenticule discs without addition of chicken feed (n=1)
All participating laboratories tested the one control lenticule disc containing SE50 and found it to be positive.
The results of all control samples were compared with the definition of ‘good performance’ (clause 3.6). Three laboratories (lab code 15, 21 and 31) scored below these criteria.
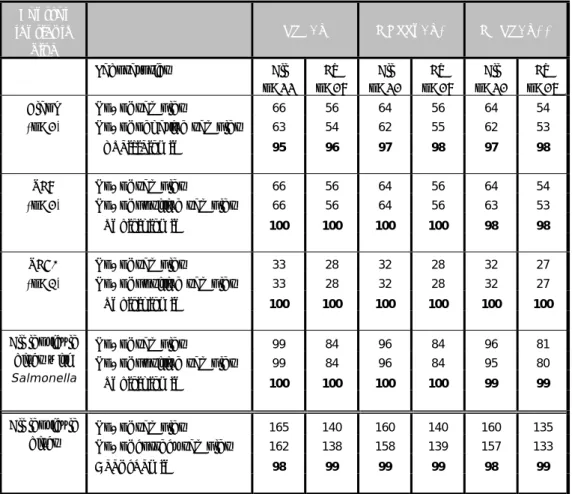
Table 10 Specificity, sensitivity and accuracy rates found with the control samples (lenticule discs without the addition of chicken feed)
Control lenticule disc RVS/X MKTTn/X* MSRV/X** Laboratories All n=33 EU n=28 All n=32 EU n=28 All n=32 EU n=27
Blank No. of samples 66 56 64 56 64 54
(n=2) No. of negative samples 63 54 62 55 62 53
Specificity in% 95 96 97 98 97 98
SE8 No. of samples 66 56 64 56 64 54
(n=2) No. of positive samples 66 56 64 56 63 53
Sensitivity in% 100 100 100 100 98 98
SE50 No. of samples 33 28 32 28 32 27
(n=1) No. of positive samples 33 28 32 28 32 27
Sensitivity in% 100 100 100 100 100 100
All lenticule discs with Salmonella
No. of samples 99 84 96 84 96 81
No. of positive samples 99 84 96 84 95 80
Sensitivity in% 100 100 100 100 99 99
All lenticule discs
No. of samples 165 140 160 140 160 135
No. of correct samples 162 138 158 139 157 133
Accuracy in% 98 99 99 99 98 99
X = isolation medium with the highest number of positives of all used isolation media. *Results without Laboratory 29 (non-EU-MS): they did not use MKTTn
4.4.2 Specificity, sensitivity and accuracy rates of the control samples
Table 10 shows the specificity, sensitivity and accuracy rates for the control lenticule discs without the addition of chicken feed. The rates are calculated for the different selective enrichment media (RVS, MKTTn and MSRV) in
combination with the isolation medium that gave the highest number of
positives. The calculations were performed on the results of all participants and on the results of only the EU-MS (without the results of the EFTA countries, candidate EU-MSs and third countries). No differences were found between these groups.
The maximum possible rates (100%) were found for the SE50 control samples. The sensitivity rate of SE8 was 100% for the prescribed selective enrichment media (MKTTn and RVS). The specificity rate of the blank lenticule discs varied between 95 and 98 per cent.
4.5 Results for chicken feed samples artificially contaminated with Salmonella
4.5.1 Results per type of lenticule disc and per laboratory General
Table 11 gives the results of the Salmonella negative chicken feed samples artificially contaminated with lenticule discs. This table gives the highest number of positive isolations found with the different selective enrichment media (RVS, MKTTn and MSRV) in combination with any isolation medium per laboratory. In Annex 2, more details per laboratory are given on the results found with the selective enrichment media RVS, MKTTn and MSRV in combination with the isolation media used per laboratory.
Table 11 Number of positive results found with the artificially contaminated chicken feed samples per laboratory
Lab code
The highest number of positive isolations found with all combinations of selective enrichment media and isolation
media SE8 n=6 SE50 n=6 Blank n=6 Good Performance ≥ 3 ≥ 5 1 5 6 6 1 12 5 6 0 Other laboratories 1-4; 6-11; 13 - 34; 6 6 0
Bold numbers: deviating results.
Blank lenticule discs with negative chicken feed (n=6)
Thirty-two laboratories correctly did not isolate Salmonella from the blank lenticule discs with the addition of negative chicken feed. One laboratory
(lab code 5) found one blank sample added to negative chicken feed positive for
Salmonella with RVS in combination with both isolation media used. With the
other selective enrichment media used (MKTTn and MSRV), this laboratory scored this sample, inoculated from the same BPW, correctly as negative. In theory, all blanks should test negative
.
However, as no 100% guarantee about the Salmonella negativity of chicken feed can be given, one positive out of six blank samples (80% neg.) will still be considered as acceptable.SE8 lenticule discs with negative chicken feed (n=6)
Thirty-two laboratories were able to isolate Salmonella from all the six lenticule discs containing Salmonella Enteritidis at a level of approximately
8 CFU/lenticule disc in combination with chicken feed with at least one of the media used. Laboratory 12 could not detect Salmonella Enteritidis in three out of six SE8 samples with the prescribed method (RVS and MKTTn). This laboratory scored better results with the requested selective enrichment medium MSRV. Laboratories 17 and 32 could not detect Salmonella in four out of six
SE8 samples with the requested method MSRV. However, with the prescribed method (RVS and MKTTn) they found all SE8 samples to be positive.
SE50 lenticule discs with negative chicken feed (n=6)
All laboratories isolated Salmonella from all the six lenticule discs containing
Salmonella Enteritidis at a level of approximately 50 CFU/ lenticule disc in
combination with chicken feed with at least one of the media used. Three laboratories (lab codes 3, 10 and 17) could not detect Salmonella
Enteritidis in two or more out of six SE50 samples with one of the prescribed or requested methods, but they scored all SE50 samples as positive with at least one of the prescribed methods (RVS and/or MKTTn).
The results of all artificially contaminated chicken feed samples were compared with the definition of ‘good performance’ (clause 3.6). All laboratories fulfilled these criteria for the prescribed media RVS and/or MKTTn.
4.5.2 Results per selective enrichment medium, lenticule disc and per laboratory
Figures 1 and 2 show the number of positive isolations per artificially
contaminated chicken feed sample and per laboratory after pre-enrichment in BPW, selective enrichment in RVS, MKTTn and on MSRV, followed by isolation on a selective plating agar. To determine good performance per laboratory, all combinations of selective enrichment media and isolation media used by the laboratory were taken into account. The results of all artificially contaminated chicken feed samples were compared with the definition of ‘good performance’ (clause 3.6). The black horizontal line in Figures 1 and 2 indicates the border of good performance.
-
= Border of good performanceFigure 1 Results per laboratory for the detection of Salmonella in chicken feed samples artificially contaminated with SE8 lenticule discs (n=6) after selective enrichment in RVS, MKTTn and on MSRV followed by isolation on the ‘best’ selective plating agar.
0
1
2
3
4
5
6
1 2 3 4 5 6 7 8 9 10 11 12 13 14 15 16 17 18 19 20 21 22 23 24 25 26 27 29 30 31 32 33 34
SE8
-
= Border of good performanceFigure 2 Results per laboratory for the detection of Salmonella in chicken feed samples artificially contaminated with SE50 lenticule discs (n=6) after selective enrichment in RVS, MKTTn and on MSRV followed by isolation on the ‘best’ selective plating agar.
Table 12 presents the percentages of positive isolations after 24 hours of incubation for RVS, MKTTn and MSRV and after an additional 48 hours of incubation for MSRV. When MKTTn or RVS was used for selective enrichment, XLD gave 3-5% more positive results than other plating-out media. The majority of the laboratories used BGA(modified) as the second plating-out medium (see Table 6). An extra incubation time of 24 h for MSRV gave on average 6% more positive results and no differences were seen between different plating-out media. For SE8 samples, the percentages of positive results were 83% after 24 h and 91% after 48 h of incubation on MSRV. For the SE50 samples, the percentage was 93% and 98% respectively. The majority of positive results after an additional incubation of 48 h came from laboratories 12 and 32, with respectively eight and six more positive results out of the 12 artificially contaminated samples with Salmonella.
Table 12 Mean percentages of positive results for the detection of Salmonella in the artificially contaminated chicken feed samples after selective enrichment in RVS, MKTTn and on MSRV incubated for 24 hours, and additionally for 48 hours on MSRV, followed by isolation on different plating-out media.
Plating-out medium Selective enrichment medium
RVS MKTTn MSRV
24 h 24 h 24 / 48 h
XLD 91% 96% 88 / 94%
Other (most often BGA) 88% 91% 88 / 94%
Difference XLD/other 3% 5% 0%
Tables 13 and 14 show the differences between selective enrichment media and
isolation media per lenticule as odds ratios (OR). In addition, the 95%confidence intervals and p-values are given.
In Table 13, the odds of finding a positive isolation with the different plating-out media are compared, given a selective enrichment medium. For instance, the odds of finding Salmonella from the SE8 samples after selective enrichment in MKTTn is a factor of 2.28 higher when XLD is used as an isolation medium compared to an isolation medium other than XLD. In general, if MKTTn is used as a selective enrichment medium, the ORs are greater than the ORs of RVS and MSRV. In other words, when MKTTn is used for selective enrichment it is easier to detect Salmonella if XLD is used compared to other isolation media. This is significant for all lenticules. For the other selective enrichment media, RVS and MSRV, there is no significant difference for the detection of Salmonella after plating out on XLD or on another isolation media.
The interpretation of Table 14 is similar to that of Table 13, except that selective enrichment media are mutually compared, given XLD as isolation medium. For instance, the odds of finding Salmonella from all SE8 samples after selective enrichment in RVS is a factor of 0.33 lower than with MKTTn. In general, if MKTTn is used as selective enrichment medium, the chance of finding
Salmonella is greater than when RVS is used. This difference is significant. When
RVS is used as a selective enrichment medium compared to MSRV, this gives a smaller chance (factor 0.7). However, this difference is not significant.
Table 13 Number of positive isolations found with XLD compared with the number of positive isolations found with other isolation media, given a selective enrichment medium
Samples: chicken feed, artificially contaminated with Salmonella positive lenticule discs Selective enrichment medium Compared isolation media Lenticule disc Odds Ratios 95% lower 95% upper p-value* RVS XLD compared with other than XLD SE8 1.58 0.89 2.82 0.11 SE50 1.50 0.63 3.57 0.36 all SE 1.54 0.92 2.63 0.10 MKTTn XLD compared with other than XLD SE8 2.28 1.06 5.21 0.03 SE51 2.71 1.02 7.71 0.05 all SE 2.49 1.32 4.89 0.01 MSRV XLD compared with other than XLD SE8 0.99 0.49 2.01 0.99 SE51 1.72 0.48 7.13 0.42 all SE 1.31 0.62 2.93 0.48 All enrichment media XLD compared with other than XLD SE8 1.53 1.03 2.29 0.04 SE51 1.89 1.01 3.53 0.05 all SE 1.70 1.17 2.47 0.01 * significant difference in case p < 0.05.
Table 14 Number of positive isolations found with a selective enrichment medium compared with the number of positive isolations found with another selective enrichment medium, given that the isolation is on XLD
Samples: chicken feed, artificially contaminated with Salmonella positive lenticule discs Compared selective enrichment media Isolation medium Lenticule disc Odds Ratios 95% lower 95% upper p-value* RVS compared with MKTTn XLD SE8 0.33 0.15 0.70 0.00 SE50 0.56 0.18 1.60 0.29 all SE 0.43 0.22 0.82 0.01 RVS compared with MSRV XLD SE8 0.70 0.36 1.35 0.29 SE50 0.37 0.10 1.21 0.10 all SE 0.51 0.24 1.02 0.06 MKTTn compared with MSRV XLD SE8 2.11 0.95 4.97 0.07 SE50 0.66 0.16 2.53 0.57 all SE 1.18 0.53 2.64 0.68 * Significant difference in case p < 0.05.
Figure 3 shows the performance of each laboratory as odds ratios compared with the mean of all laboratories for the artificially contaminated samples. In this calculation, the blank lenticules are not used. The mean (OR=1) is defined as the odds of detecting Salmonella based on the fixed effects only (lenticule, enrichment medium and isolation medium). Laboratories below the mean have a lower probability of detecting Salmonella. In general, the laboratories performed very well. There is only a small difference between the performance of the laboratories just above the mean (e.g. laboratory 1) or just below the mean
(e.g. laboratory 13). Laboratory 1 missed two lenticule discs on only one of the two isolation media and laboratory 13 missed two lenticule discs on both isolation media used. From the laboratories with a score of OR < 1, ten laboratories scored a significantly lower performance (p < 0.05). The laboratories 10 and 18 showed a lower performance because they missed samples with their second isolation medium, but mostly scored the same samples correctly with XLD. The laboratories 3, 10, 12, 17 and 32 scored a lower number of positive results with one of the selective-enrichment media, but with another selective enrichment medium they scored better results.
Six laboratories, 4, 8, 9, 16, 26 and 33, scored all samples correctly for all media used.
Figure 3 Performance of each laboratory compared to the mean of all laboratories for the artificially contaminated chicken feed samples (without blanks)
4.5.3 Specificity, sensitivity and accuracy rates of the artificially contaminated samples
Table 15 shows the specificity, sensitivity and accuracy rates for all types of lenticule discs added to the chicken feed. The rates are calculated for the different selective enrichment media (RVS, MKTTn and MSRV) with plating-out medium XLD. The calculations were performed on the results of all participants and on the results of only the EU-MS (without the results of the European Free Trade Association countries, candidate EU-MS and third countries (non-EU-MS)). No or only small differences were found between these groups. The specificity rates (of the blank lenticule discs) were 99 -100%. The highest rates were found with MKTTn. This was most clear for the SE8 samples (sensitivity rate 96%). In
general RVS gave the lowest sensitivity rates (94%) followed by MSRV (95%) with the highest sensitivity results for MKTTn (97%).
Table 15 Specificity, sensitivity and accuracy rates for all participating
laboratories of the artificially contaminated chicken feed samples (each lenticule disc added to 25 g of chicken feed) for the selective enrichment in RVS, MKTTn and on MSRV and plating-out medium with highest number of positives.
Lenticule disc with chicken feed RVS/X MKTTn/X* MSRV/X** Laboratories All n=33 EU n=28 All n=32 EU n=28 All n=32 EU n=27
Blank No. of samples 198 168 192 168 192 162
(n=6)
No. of negative
samples 197 167 192 168 192 162
Specificity in% 99 99 100 100 100 100
SE8 No. of samples 198 168 192 168 192 162
(n=6) No. of positive samples 180 154 184 161 175 147
Sensitivity in% 91 92 96 96 91 91
SE50 No. of samples 198 168 192 168 192 162
(n=6) No. of positive samples 193 163 187 165 189 159
Sensitivity in% 97 97 97 98 98 98
All lenticule discs with Salmonella
No. of samples 396 336 384 336 384 324
No. of positive samples 373 317 371 326 364 306
Sensitivity in% 94 94 97 97 95 94
All lenticule discs
No. of samples 594 504 576 504 576 486
No. of correct samples 570 484 563 494 556 468
Accuracy in% 96 96 98 98 97 96
X = isolation medium with the highest number of positives of all isolation media used. * Results without Laboratory 29 (non-EU): they did not use MKTTn
** Results without Laboratory 7 (EU-MS): they did not use MSRV
4.6 PCR (Own method)
Five laboratories (lab codes 4, 10, 12, 20 and 33) applied a Polymerase Chain Reaction (PCR) method as an additional detection technique. All laboratories tested the samples after pre-enrichment in BPW. Two of the four PCR methods were validated. Only laboratory 20 used the PCR routinely. Laboratory 33 did not give any details on the PCR used. Table 16 gives further details on the PCR methods used.
The laboratories scored all tested samples correctly with the PCR method used. One laboratory (lab code 12) did not mention the PCR result for one sample (SE8 with chicken feed). Laboratory 33 tested only 12 of the 25 samples with PCR.
Table 16 Details on Polymerase Chain Reaction procedures, used as their own method during the interlaboratory comparison study by five participants Lab code PCR method: Reference
4 Real time PCR, Microval 2011, Commercial
10 Real time PCR, Not validated, Malorny 2004, Non-commercial
12 Real time PCR, Validated*, Hein 2006, Non-commercial
20 PCR no further information, Validated*, Non-commercial
33 PCR no further information
* Participants indicated that the PCR method has been validated. However, it is not clear whether the method has been validated in accordance with ISO 16140 (Anonymous, 2003b) and no information on the certificate number was given.
4.7 Performance of the NRLs
4.7.1 General
Thirty NRLs fulfilled the criteria of good performance and three laboratories scored below these criteria. As for the determination of good performance, the results of all media were taken into account. It may be that some laboratories did not score well with one medium, but overall still scored a ‘good
performance’. For example, laboratory 20 found, for all samples cultivated on their second isolation medium, one or more negative results independent of the method used (RVS, MKTTn or MSRV), but scored all samples correctly with the isolation medium XLD. One laboratory (lab code 28) did not send in their results. Three laboratories (lab codes 15, 21 and 31) reported one (out of two) positive blank control sample. All blanks should have tested negative.
The four deviating laboratories were contacted by the EURL-Salmonella in November 2012 and asked to give possible explanations for their deviating results and some were asked to perform some additional tests (e.g. biochemical tests, serotyping and phage typing). Laboratory 28 was asked for an explanation for not participating.
Laboratory 15 found one blank control sample (lenticule discs without chicken feed) positive on all media used (RVS, MKTTn and MSRV). The laboratory indicated it had made a transcription error, which was proved by their raw data. Hence, no further actions were considered necessary for this laboratory and their results were indicated as a ‘moderate performance’.
Laboratory 21 found one blank control sample (lenticule discs without chicken feed) positive on all media used (RVS, MKTTn and MSRV). The laboratory checked their procedures, but did not find any omission or a clarification for the (false) positive blank. The laboratory did some extra biochemical and serological tests on the false positive sample and it turned out to be a Salmonella
Enteritidis.
Laboratory 28 gave the following explanation for not performing the study: The laboratory in which the Production and Animal Health Unit and the Technology and Food Safety Unit are situated has been integrated in a newly created Institute. This process caused some difficulties in the coordination of