Evaluation of the 2006 proposal for risk
assessment of persistence of plant
RIVM, P.O. Box 1, 3720 BA Bilthoven, the Netherlands Tel +31 30 274 91 11 www.rivm.nl RIVM Report 601712002/2008
Evaluation of the 2006 proposal for risk assessment of
persistence of plant protection products in soil
AMA van der Linden, RIVM JJTI Boesten, Alterra
TCM Brock, Alterra GMA van Eekelen, CTB MMS ter Horst, Alterra FMW de Jong, RIVM MHMM Montforts, RIVM JW Pol, CTB
Contact:
AMA van der Linden RIVM
Ton.van.der.Linden@rivm.nl
This investigation has been performed by order and for the account of the Netherlands Ministry of Housing, Spatial Planning and the Environment within the framework of project M/601712
‘Consultancy on pesticides and Biocides’. The Alterra contribution has been performed by order and for the account of the Netherlands Ministry of Agriculture, Nature and Food Quality within the framework of research programme BO-06-010 ‘Risk assessment methodology for pesticide registration’. The contribution of Ctgb has been performed for the account of both ministries.
2 RIVM Report 601712002
ISBN: 978-90-6960-197-7
© RIVM 2008
Parts of this publication may be reproduced, provided acknowledgement is given to the 'National Institute for Public Health and the Environment', along with the title and year of publication.
RIVM Report 601712002 3
Abstract
Evaluation of the 2006 proposal for risk assessment of persistence of plant protection products in soil
This report describes the evaluation of the 2006 proposal for the risk assessment of persistence of plant protection products in soil. The proposal considered three protection goals and proposed tiered
assessment and decision schemes for each protection goal. The three schemes appeared to be consistent, both internally and with each other. It was found that both pore water concentrations and total content have to be considered in the soil risk assessment.
The evaluation has been performed for five substances with all available information from both
registration dossiers and open literature. Nevertheless, insufficient information was available to evaluate all aspects of the proposal. In practice this means that pesticide industry has to provide additional information for many dossiers. Furthermore, it was found that existing information often needs to be re-interpreted and a need for standardisation of evaluation of terrestrial (semi-)field experiments was observed. The proposal would require specific expertise and investments of evaluating authorities as well as stakeholders.
To better understand fate and effects of persistent substances, it is recommended to investigate the behaviour of substances in the field over longer periods, to perform exposure concentration
measurements while performing ecotoxicological tests, to develop protocols for testing effects on fungi, and to gain the necessary experience on the conduct and interpretation of (semi-)field studies with respect to the relation between exposure and effects of plant protection products.
Key words:
RIVM Report 601712002 5
Rapport in het kort
Evaluatie van het voorstel uit 2006 voor de risicobeoordeling van persistentie van gewasbeschermingsmiddelen in de bodem
Dit rapport evalueert het voorstel uit 2006 voor de beoordeling van milieurisico’s van
gewasbeschermingsmiddelen die lang in de bodem aanwezig blijven. Dit voorstel beschreef drie beschermdoelen en stelde getrapte beoordelingssystemen (beslisbomen) voor. De uitkomsten van deze beoordelingssystemen bleken consistent. De optie uit het voorstel om de risico’s niet alleen te
beoordelen op basis van het totaalgehalte in de bodem maar ook op de concentraties in het bodemvocht moet worden verplicht.
De evaluatie is uitgevoerd met alle beschikbare gegevens uit toelatingsdossiers en openbare literatuur van vijf stoffen. De gegevens bleken voor verschillende onderdelen van de beslisbomen niet toereikend, waardoor fabrikanten aanvullende gegevens zullen moeten leveren voor veel toelatingsdossiers. Ook moeten beschikbare studies meestal opnieuw worden geïnterpreteerd om de benodigde gegevens voor de nieuwe beoordeling af te leiden. Een goede beoordeling vereist daarom specifieke expertise van zowel aanvragers als beoordelende instanties.
Om gedrag en effecten van persistente stoffen beter te kunnen begrijpen, wordt eveneens aanbevolen het gedrag in het veld over langere duur te onderzoeken, de concentraties in testsystemen te meten, testen met bodemschimmels te ontwikkelen, en ervaring op te doen met (semi-)veldstudies naar de relatie tussen blootstelling en effecten.
Trefwoorden:
beschermdoelen, beslisboom, bestrijdingsmiddelen, ecotoxicologische effecten, persistentie in de bodemporiewater
RIVM Report 601712002 7
Contents
1 Introduction 11
1.1 Remit 11
1.2 Approach 12
1.3 Overview decision trees 12
1.4 Reading guidance 15
2 Carbendazim 17
2.1 Overview of selected carbendazim uses 17
2.2 Relevant fate parameters of carbendazim 17
2.2.1 Physico-chemical properties of carbendazim 17
2.2.2 Assessment of (semi-)field dissipation studies of carbendazim 18
2.3 Trigger values carbendazim 19
2.4 Input for exposure calculations 19
2.5 Ecotoxicological endpoints of carbendazim 20
2.5.1 Ecotoxicological endpoints in line with the FRP 20
2.5.2 Ecotoxicological endpoints in line with the CRP and ETP 22
2.6 CRP effect assessment 30
2.6.1 First tier (standard test species approach) 30
2.6.2 Second tier (SSD approach) 30
2.6.3 Third tier (Model ecosystem approach) 31
2.7 ETP effect assessment 31
2.7.1 First tier (standard test species approach) 31
2.7.2 Second tier (SSD approach) 31
2.7.3 Third tier (Model ecosystem approach) 31
2.8 Carbendazim persistency risk assessment 32
2.8.1 Functional Redundancy Principle 32
2.8.2 Community Recovery Principle 32
2.8.3 Ecological Threshold Principle 33
2.9 Discussion points for risk assessment 33
3 Chlorpyrifos 35
3.1 Overview of selected chlorpyrifos uses 35
3.2 Relevant fate parameters of chlorpyrifos 35
3.2.1 Physico-chemical properties of chlorpyrifos 35
3.2.2 Assessment of field dissipation studies of chlorpyrifos 38
3.3 Trigger values chlorpyrifos 39
3.4 Input for exposure calculations 39
3.5 Ecotoxicological endpoints of chlorpyrifos 41
3.5.1 Ecotoxicological endpoints in line with the FRP 41
3.5.2 Ecotoxicological endpoints in line with the CRP and ETP 43
3.6 CRP effect assessment 45
3.7 ETP effect assessment 46
3.8 Chlorpyrifos persistency risk assessment 46
3.8.1 Functional Redundancy Principle 46
3.8.2 Community Recovery Principle 47
3.8.3 Ecological Threshold Principle 47
8 RIVM Report 601712002
4 Paraquat 49
4.1 Overview of selected paraquat uses 49
4.2 Relevant fate parameters of paraquat 49
4.2.1 Physico-chemical properties of paraquat 49
4.3 Trigger values paraquat 52
4.4 Input for paraquat exposure calculations 53
4.5 Ecotoxicological endpoints of paraquat 54
4.5.1 Ecotoxicological endpoints in line with the FRP 59
4.5.2 Ecotoxicological endpoints in line with the CRP and ETP 59
4.6 Paraquat persistence risk assessment 61
4.6.1 Functional Redundancy Principle 61
4.6.2 Community Recovery Principle 61
4.6.3 Ecological Threshold Principle 62
4.7 Discussion points for risk assessment 62
5 Quinoxyfen 63
5.1 Overview of selected quinoxyfen uses 63
5.2 Relevant fate parameters of quinoxyfen 63
5.3 Trigger values for different protection goals 64
5.4 Input for quinoxyfen exposure calculations 64
5.5 Ecotoxicological endpoints of quinoxyfen 66
5.5.1 Ecotoxicological endpoints in line with the FRP 67
5.5.2 Effect endpoints in line with the CRP and ETP 68
5.6 CRP effect assessment 69
5.7 ETP effect assessment 69
5.8 Quinoxyfen persistence risk assessment 70
5.8.1 Functional Redundancy Principle 70
5.8.2 Community Recovery Principle 70
5.8.3 Ecological Threshold Principle 71
5.9 Discussion points for risk assessment 71
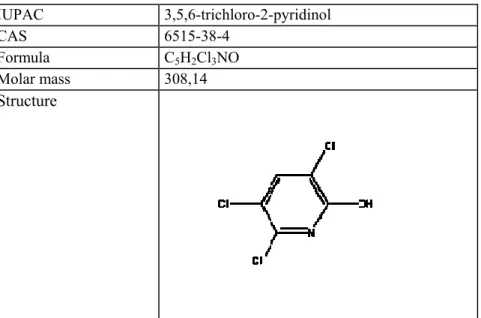
6 TCP (metabolite of chlorpyrifos) 73
6.1 Relevant fate parameters of TCP 73
6.1.1 Physico-chemical properties of TCP 73
6.1.2 Assessment of field dissipation studies of TCP 75
6.2 Trigger values TCP 75
6.3 Input for TCP exposure calculations 75
6.4 Ecotoxicological endpoints of TCP 75
6.4.1 Ecotoxicological endpoints in line with the FRP, CRP and ETP 75
6.5 TCP persistency risk assessment 76
6.5.1 Functional Redundancy Principle 76
6.5.2 Community Recovery Principle 76
6.5.3 Ecological Threshold Principle 77
RIVM Report 601712002 9
7 Discussion, conclusions and recommendations 79
References 87
Appendix 1 Glossary 93
Appendix 2 Details of carbendazim exposure evaluations 95
Appendix 3 Details of chlorpyrifos exposure evaluations 109
Appendix 4 Exposure concentrations in chlorpyrifos toxicity tests 129 Appendix 5 Estimation of pore water concentrations of paraquat in artificial soil 131
Appendix 6 Details of paraquat effect evaluations 133
Appendix 7 Details of the paraquat literature search 141
Appendix 8 Details of quinoxyfen exposure evaluations 145
RIVM Report 601712002 11
1
Introduction
1.1
Remit
The Ministries of VROM and LNV decided in 2006 that the proposal for the risk assessment for persistence in soil as described by Van der Linden et al. (2006) should be evaluated by applying it to a number of relevant plant protection products (PPPs).
The ministries decided also that the exposure part of the proposal should be made fully operational; implying that the necessary scenarios and software for the different exposure tiers had to be developed and also that a calculation procedure and software had to be developed for exposure assessment in ecotoxicological experiments.
The ministries decided that the evaluation should be carried out via a phased procedure. Initially the proposal should be evaluated using the dossier data of three PPPs. After that, the need for evaluating with more PPPs should be discussed with the ministries and agrochemical industry.
The following selection criteria for the first three PPPs were set: 1. different mode of actions;
2. dossiers with more than average information on soil ecotoxicology;
3. part of the PPPs should have a half-life (DT50) longer than 180 days and part should have a half-life
between 30 and 180 days;
4. PPPs should include a soil disinfectant;
5. PPPs should not be all from the same company.
Based on the above criteria, the first three plant protection products considered were paraquat
(Syngenta, herbicide, DT50 in the order of 10 years), quinoxyfen (Dow Chemical Company, fungicide,
DT50 in the order of 1 year), and chlorpyrifos (Bayer Crop Sciences, insecticide, DT50 of a few months).
So selection criterion four was ignored. Interim results for these PPPs were reported in January 2007 and then the ministries and agrochemical industry agreed that it would be meaningful to perform additionally an evaluation of the pesticide carbendazim (not longer registered as a PPP, fungicide, half-life of about 6 months). Carbendazim was selected because much soil ecotoxicological information for carbendazim is available in the literature.
The intention of the evaluation procedure was to assess all possible aspects of the proposed exposure and effect flow charts. As a consequence, the risk assessment procedure was applied going through all tiers of these flow charts as much as possible (so also going to higher tiers if it was already concluded in a lower tier that there was no risk).
Additionally, the ministries of VROM and LNV requested to estimate the extra costs that notifiers would need to make as a result of applying the procedure proposed by Van der Linden et al. (2006). This estimation is reported elsewhere.
In view of the limited experience with field studies on effects on the terrestrial ecosystem, the ministries requested that the risk assessment procedures of such studies should be documented as carefully as
12 RIVM Report 601712002 possible (if possible including recommendations for improvements for these risk assessment
procedures).
1.2
Approach
As stated in section 1.1 the purpose of this study is to evaluate the functioning of the decision trees for the assessment of the persistency of plant protection products in soil. The evaluation was carried out by going through the decision schemes for a total of five substances, four active substances and one metabolite. For each of the substances all proposed schemes were considered, whether or not the scheme was triggered. In more detail, the work included:
1. evaluation of dossier and open literature information with respect to soil fate and soil ecotoxicological aspects of each substance;
2. (re-)interpretation of original experiments, if necessary, taking into account recent guidelines; 3. evaluation of the schemes using the soil fate and soil ecotoxicological values obtained under 1) and
2).
The evaluation under three included whether the fundamental principles of tiered assessments are obeyed.
1.3
Overview decision trees
Report 601506008 (Van der Linden et al., 2006) gives three decision schemes for the evaluation of persistence of plant protection products in soil. The schemes and their coherence are reproduced here for easy reference. Abbreviations are explained in the Glossary (Appendix 1).
protection goal time window trigger
DT50 > 30 days DT50 > 90 days DT50 > 180 days Functional Redundancy
Principle (FRP)
cropping season testing according to FRP (Figure 1.2) testing according to FRP (Figure 1.2) testing according to FRP (Figure 1.2) AND AND Community Recovery Principle (CRP)
two years post last application testing according to CRP (Figure 1.3) testing according to CRP (Figure 1.3) AND Ecological Threshold Principle (ETP)
seven years post last application
testing according to ETP (Figure 1.4) Figure 1.1 Relation between the trigger value for 50% dissipation time (DT50) of the plant protection product
RIVM Report 601712002 13
Figure 1.2 Decision tree for in-crop effect assessment in line with the Functional Redundancy Principle (largely based on EU Guidance Document Terrestrial Ecotoxicology)
no
Functional Redundancy Principle
DT50 > 30 days
PIECs,tc < 0.2 x NOECearthworms or PIECs,pw < 0.2 x NOECearthworms or
effect on SMO < 25%
Standard arthropods HQ < 2
PIECs,tc < 0.2 x NOECcollembolan or PIECs,pw < 0.2 x NOECcollembolan or PIECs,tc < 0.2 x NOECmite or PIECs,pw < 0.2 x NOECmite
no biological significant effect in litter bag study at a relevant PEC
not acceptable, unless ...
acceptable yes yes yes no no no bound residue > 70% mineralization < 5% yes yes
14 RIVM Report 601712002
Figure 1.3 Decision tree for in-crop (in the year post the year of last application) effect assessment in line with the Community Recovery Principle
* The use of PEC is in conformity with the present approach; when more data are available, such as the time to effect, a PECTWA can be used as well. Instead of total content, pore water concentration can be used (see Van der Linden et al., 2006).
** Species sensitivity distribution (SSD method, see Aldenberg and Jaworska, 2000). If a clear sensitive group exists, meaning at least an order of magnitude difference in sensitivity compared to other groups, data for 8 taxa from the most sensitive group can be taken, in conformity with the procedure for the aquatic environment (Campbell et al., 1999). Alternatively, in case of general biocidal activity, the TGD approach can be taken (TGD, 2003). A minimum of 10 NOECs for at least 8 taxonomic groups should be taken. In the TGD an assessment factor of 5 – 1 is applied, to be fully justified on a case-by-case basis (for soil discussion is going on about different trophic levels, the use of functional endpoints (micro-organisms) etcetera).
Community Recovery Principle
DT50 > 90 days
PECs,tc,t=2y* < 0.1 x NOECtc or 0.1 x EC10,s,tc (3 taxa)
herbicide: plant, earthworm, other taxon insecticide: collembola, earthworm, other taxon fungicide: fungus, earthworm, other taxon nematicide: nematoda, earthworm, other taxon
PECs,tc,t=2y *
< median HC5,s,tc
≥ 8 chronic NOECs/EC10,s,tc of representative taxa for the most sensitive group, or TGD** (10 sp of 8 tax groups)
PECs,tc,t=2y*
< acceptable tc or pw concentration derived from (semi)-field experiment simulating a representative agro-ecosystem; effect class I-II and AF of 3 for spatio-temporal extrapolation or
other tailor-made field tests or monitoring
not acceptable acceptable yes yes yes no no no
RIVM Report 601712002 15
Figure 1.4 Decision tree for in-crop (7 years post last application) effect assessment in line with the Ecological Threshold Principle
* The use of PEC is in conformity with the present approach; when more data are available, such as the time to effect, a PECTWA can be used as well. Instead of total content, pore water concentration can be used (see Van der
Linden et al., 2006).
** Species sensitivity distribution (SSD method, see Aldenberg and Jaworska, 2000). If a clear sensitive group exists, meaning at least an order of magnitude difference in sensitivity compared to other groups, data for 8 taxa from the most sensitive group can be taken, in conformity with the procedure for the aquatic environment (Campbell et al., 1999). Alternatively, in case of general biocidal activity, the TGD approach can be taken (TGD, 2003). A minimum of 10 NOECs for at least 8 taxonomic groups should be taken. In the TGD an assessment factor of 5 – 1 is applied, to be fully justified on a case-by-case basis (for soil discussion is going on about different trophic levels, the use of functional endpoints (micro-organisms) etcetera).
1.4
Reading guidance
The evaluation of the assessment method for persistence of plant protection products was carried out by studying five substances in detail, four active substances and one metabolite. This report gives the results of the evaluation study. The study revealed that some changes to the methodology would be appropriate. RIVM report 601712003 (Van der Linden et al., 2008) gives the revised methodology and supersedes RIVM report 601506008 (Van der Linden et al., 2006).
Ecological Threshold Principle
DT50 > 180 days PECs,tc,t=7y * < 0.01 x NOECs or 0.01 x EC10,s,tc (3 taxa) or PECs,tc,t=7y * < 0.1 x NOECs or 0.1 x EC10,s,tc (5 taxa)
Test species: basic set plus 2 additional species from the most sensitive taxonomic group
PECs,t=7y,tc*< lower limit HC5,tc
≥ 8 chronic NOECs/EC10s of representative taxa for the most sensitive group, or TGD** (10 sp of 8 tax groups)
PECs,t=7y,tc*
< acceptable tc or pw concentration derived from (semi)-field experiment simulating a representative agro-ecosystem; effect class I-II and an UF of 9 (3 for spatio-temporal extrapolation in agro-ecosystems and 3 for extrapolation from agro-ecosystem to nature reserve) or
other tailor-made field tests or monitoring
not acceptable acceptable yes yes yes no no no
16 RIVM Report 601712002 This report is organised as follows. This chapter gives the remit of the working group and the proposed evaluation method. Chapters 2 – 6 give the results of the evaluation of the individual substances. Details of specific aspects of these evaluations can be found in the appendices. Chapter 7 gives the overall conclusions of the evaluation project and some recommendations.
Unless stated otherwise in this report, application rates and concentrations concern the substance under investigation.
RIVM Report 601712002 17
2
Carbendazim
2.1
Overview of selected carbendazim uses
Carbendazim controls a wide range of fungal pathogens on cereals, fruits, cotton, tobacco, turf, ornamentals and vegetables. The agricultural use of carbendazim selected for this risk assessment is an application in Brussels sprouts of 0.5 kg ha-1 twice per season in August - September. The minimal interval between twoapplications is ten days according to the Draft Assessment Report (DAR). Both applications are at growth stage BBCH2 49 (other Brassica vegetables, see Appendix 2).
Table 2.1 Selected carbendazim uses
substance crop formulation frequency dose BBCH interception
carbendazim Brussels sprouts Brabant Carbendazim Flowable 2 (15 August, 1 September) 0.5 kg ha-1 49 60%
2.2
Relevant fate parameters of carbendazim
2.2.1
Physico-chemical properties of carbendazim
Table 2.2 Basic data of carbendazim
ISO name CARBENDAZIM
IUPAC methyl benzimidazol-2-ylcarbamate
CAS 10605-21-7
Purity 980 g kg-1 Molecular formula C9H9N3O2 Structure
Molecular mass, vapour pressure and solubility in water (Table 2.2) are taken from the List of End points (SANCO 5032/VI/98 final version of 5 January 2007) of carbendazim.
2 The abbreviation BBCH derives from Biologische Bundesanstalt, Bundessortenamt and CHemical industry. The BBCH-scale is a system for a uniform coding of phonologically similar growth stages of all mono- and dicotyledonous plant species.
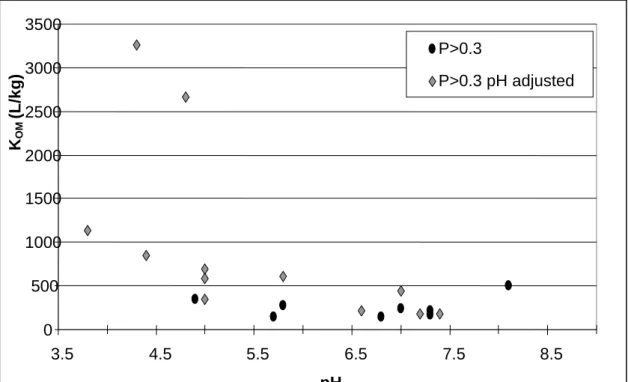
18 RIVM Report 601712002 The List of End points (SANCO 5032/VI/98 final version of 5 January 2007) asserts stronger adsorption at low pH and a pKa of 4.2. In order to estimate parameters for the pH-dependent sorption relationship,
as many sorption studies as possible were gathered from the EU monograph and open literature. Reliability of each measurement in each study was checked using the P-criterion (Boesten, 1990), rendering seven reliable studies. The reliable results from these seven studies were used to fit the relation between pH and the sorption constant KOM (see Appendix A2.1). A KOM,acid of 2073 dm3 kg-1
and a KOM,base of 201.9 dm3 kg-1 were fitted for the protonated (acid) and the neutral molecule (base)
respectively. The default value of 0.9 is taken for the Freundlich exponent.
Concerning half-lives in soil, both laboratory degradation studies and field dissipation studies are available. The monograph did not provide reliable half-lives for degradation (DegT50,lab) from
laboratory experiments. A study was considered not reliable if: • the storage time of the soil before analysis was not specified; • the used dose was not specified;
• the soil moisture content at which the DegT50 is measured was not specified; • the used dose was > 11 mg kg-1 (advised annual dose is 0.45 mg kg-1).
The only reliable value was found in Matser and Leistra (2000). A DegT50,lab of 141 days was measured
(moisture content: 0.22 g g-1) for a soil sample from Droevendaal (Wageningen, the Netherlands).
Normalization to pF2 (field capacity) is not necessary for the Droevendaal sample because the moisture content in the soil is high enough. Relevant fate parameters of carbendazim used in Tier 1 and/or Tier 3 calculations are given in Table 2.3.
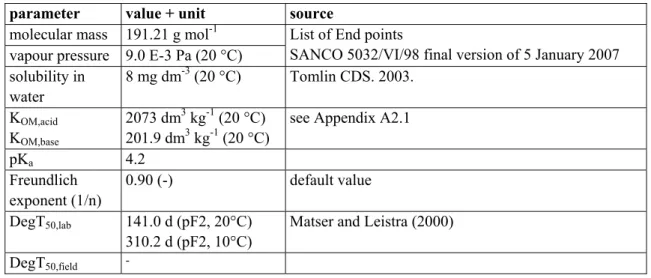
Table 2.3 Relevant fate parameters of carbendazim
parameter value + unit source
molecular mass 191.21 g mol-1 vapour pressure 9.0 E-3 Pa (20 °C)
List of End points
SANCO 5032/VI/98 final version of 5 January 2007 solubility in water 8 mg dm-3 (20 °C) Tomlin CDS. 2003. KOM,acid KOM,base 2073 dm3 kg-1 (20 °C) 201.9 dm3 kg-1 (20 °C)
see Appendix A2.1
pKa 4.2 Freundlich exponent (1/n) 0.90 (-) default value DegT50,lab 141.0 d (pF2, 20°C) 310.2 d (pF2, 10°C)
Matser and Leistra (2000) DegT50,field -
2.2.2
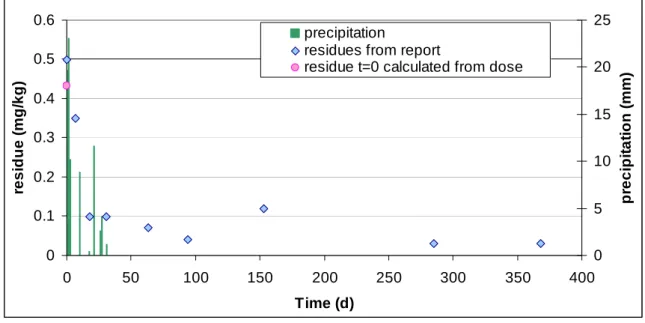
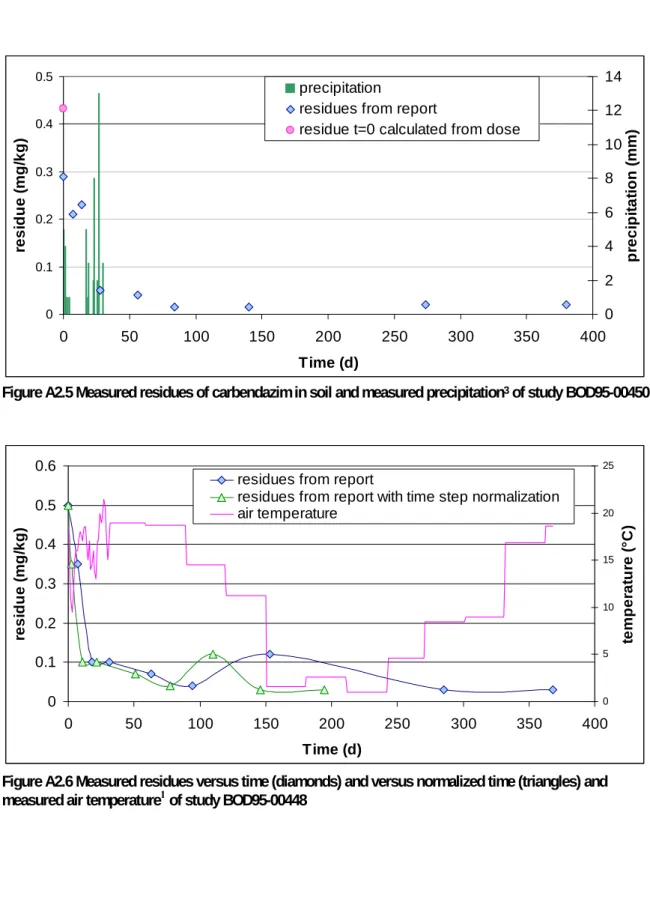
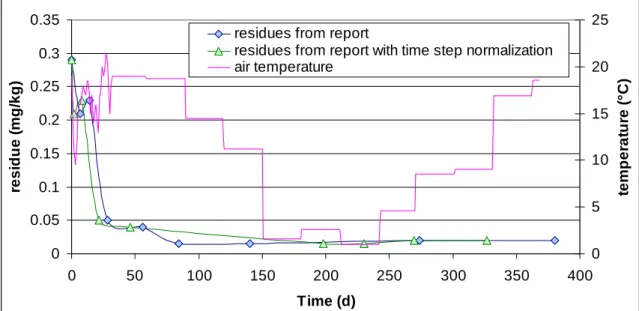
Assessment of (semi-)field dissipation studies of carbendazim
Details of the assessment of the field dissipation studies of carbendazim are given in Appendix 2. Assessment of the field dissipation studies did not result in a reliable estimate of the DegT50,field.
Therefore the result of the available laboratory study is used for the calculation of exposure levels and for comparison with the DegT50 trigger values of the FRP, CRP and ETP. The DegT50,lab value of 141
RIVM Report 601712002 19 DegT50,lab value of 310.2 days (10 °C, pF2; Matser and Leistra, 2000) is used for comparison with the
DT50 trigger values of the FRP, CRP and ETP.
For indoor terrestrial model ecosystems dissipation DT50 values in soil (soil temperature 10 – 14 °C) in
the range of 28.7 – 93.3 days (geometric mean value 49.5 days; n = 8) are reported, while in
corresponding outdoor field validation experiments DT50 values in similar soils (soil temperatures not
reported) in the range of 21.7 – 65.8 days (geometric mean value 40.8 days; n = 4) are mentioned (Jones et al., 2004). However, these values refer to dissipation while DegT50 values are needed. A more
detailed assessment of these field studies and semi-field studies is not possible since the underlying data, which are needed to calculate a DegT50, were not published by Jones et al. (2004).
2.3
Trigger values carbendazim
The DegT50,lab value of 310.2 days (10 °C, pF2; Matser and Leistra, 2000) is used for comparison with
the DegT50 trigger values of the FRP, CRP and ETP. This DegT50 triggers the procedure in line with the
FRP (trigger value DegT50 > 30 d). The risk assessment procedures in line with the CRP (DegT50 > 90
d) and the ETP (DegT50 > 180 d) are triggered as well.
2.4
Input for exposure calculations
PECs
The concentration of carbendazim in soil and/or pore water is needed to assess the risk for soil organisms of persistent substances according to the community recovery principle (CRP) and the ecological threshold principle (ETP). The PECs for spray applications is calculated for the upper 5 cm of
soil. Tier 1
Input for the first tier exposure calculation is the actual worst-case application rate of 0.5 kg ha-1 for each of the two doses given per season. It is assumed that there is no interception by the crop, no tillage and the soil dry bulk density is 1000 kg m-3. The calculation is independent of the crop and the time of
application. For metabolites all available data concerning substance properties are regarded. The following input data are used for the calculation:
Tier 1 input for carbendazim
Active substance:
Worst case DegT50,lab for degradation in soil (20°C): 141 days (based on one laboratory study)
KOM,acid: 2073 dm3 kg-1 (used for calculating total content)
KOM,base: 201.9 dm3 kg-1 (used for calculating pore water concentration)
Molecular weight: 191.21 g mol-1
20 RIVM Report 601712002 GeoPEARL
In the third tier (no second tier developed), the concentration of carbendazim in soil and/or pore water in the potential area of use is evaluated using the spatially distributed model GeoPEARL 3.3.3. Input
variables are the actual worst-case application scheme 0.5 kg ha-1 for each of the two applications given per season to the crop Brussels sprouts (in GeoPEARL represented by the crop ‘vegetables’) and an interception value of 60% (40% to the soil), appropriate for the crop at growth stage BBCH 49. Tillage is included in the calculations.
The date of the yearly first application is 15 August and the date of the yearly second application is 1 September (realistic worst case scheme for this application). The following input data are used for the calculation:
GeoPEARL input for carbendazim Active substance:
worst case DegT50,lab for degradation in soil (20°C)*: 141 days (DegT50,lab used, because a DegT50,field is
lacking) KOM,acid: 2073 dm3 kg-1
KOM,base: 201.9 dm3 kg-1
1/n: 0.9 pKa: 4.2
Non-equilibrium sorption is assumed: Desorption rate coefficient: 0.01 d-1 (default)
Factor relating non-equilibrium and equilibrium sorption, CofFreNeq and CofFreEql: 0.5 (-, default) Saturated vapour pressure: 9.0E-3 Pa (20 °C)
Solubility in water: 8 mg dm-3 (20 °C) Molecular weight: 191.2 g mol-1 Crop: vegetables
Number of plots (minimum 250): 250
Other parameters: standard settings of GeoPEARL 3.3.3 * Only one reliable DegT
50,lab available.
2.5
Ecotoxicological endpoints of carbendazim
2.5.1
Ecotoxicological endpoints in line with the FRP
In the decision tree for in-crop effect assessment in line with the FRP it is first checked if the predicted exposure concentration of the substance leads to toxic effects on earthworms or soil micro-organisms (PIECs,tc < 0.2 * NOECearthworms or effects on SMO < 25%). Application of 0.5 kg ha-1 (2 times) results
in a third-tier PIECs,tc value of 0.876 mg kg-1 (see Table 2.13). In the EU dossier (3 May 2004) the
selected 56-d NOECrepro for earthworms is 1.0 mg kg-1 (Eisenia fetida; Lührs 2001a in EU dossier; see
Table 2.4). The PIECs,tc of 0.876 mg kg-1 is larger than 0.2 * NOECearthworms, so that effects on soil
functions such as organic matter mineralization cannot be excluded.
RIVM Report 601712002 21 1.5 kg ha-1 (= 3 mg kg-1 in the upper 5 cm of the soil; ρb = 1000 kg m-3) no substantial effects on
microbial nitrogen and carbon mineralization can be observed (Carbendazim DAR list of endpoints; Appendix II, 3. Ecotoxicology, 30 September 2004).
According to the FRP decision scheme a litter bag study is required, since the criterion PIECs,tc < 0.2 * NOECearthworms is not met. However, in the EU dossier a litter bag study with
carbendazim in accordance with the EPFES Guidance Document (Römbke et al., 2003) is not available. In Addendum 6 to the Monograph (section B.8.7; DOC 15032/ECCO/BVL/03) results of a litter bag study with the fungicide benomyl are reported (nominal benomyl test concentrations 150, 300 and 750 g ha-1). The main metabolite of benomyl is carbendazim, which is formed rapidly. The litter bags filled with hay (5.0 g dry weight) were exposed on the soil surface during benomyl application and after one hour horizontally buried at a depth of 2 - 5 cm. Initially, small (up to 18% difference relative to controls) and short-term effects on hay decomposition were demonstrated at the benomyl treatment levels of 300 and 750 g ha-1. 193 days after application, statistically significant differences in remaining hay litter between treatments and controls could not be demonstrated anymore. If it is assumed that benomyl is completely transformed into carbendazim these data suggest that the difference in litter mass loss between controls and soils treated once with carbendazim up to 494 g ha-1 (= 0.99 mg kg-1 in the upper 5 cm of the soil; ρb = 1000 kg m-3) will be less than 10% after 12 months. In that case the risk is
considered to be low according to the EPFES Guidance Document (Römbke et al., 2003).
The effects of carbendazim on microbial nitrogen and carbon mineralization and the results of the benomyl litter bag study reported in the EU dossier are more or less in accordance with observed effects of carbendazim on functional endpoints in terrestrial model ecosystems and field soils as reported in the open literature for four different European sites, viz., Amsterdam (the Netherlands), Bangor (UK), Coimbra (Portugal) and Flörsheim (Germany) (Knacker et al., 2004; Förster et al., 2004; Sousa et al., 2004; Van Gestel et al., 2004). Förster et al. (2004) studied the effects of carbendazim application on organic matter (cellulose filter paper) decomposition in soils in indoor terrestrial model ecosystems (TMEs) and in corresponding soils in the field at Flörsheim (Germany). According to Förster et al. (2004) the carbendazim-induced effects on organic matter decomposition in the TMEs and in the field were comparable and followed a clear dose-response relationship. After eight weeks of incubation the differences in weight loss of the cellulose filter paper were most pronounced. The calculated EC50
values for organic matter decomposition after eight weeks were 9.5 and 7.1 kg ha-1 for the grassland TMEs and the grassland field, respectively. The larger impact of the same treatment level in the field compared to the TMEs was attributed to lower moisture levels in the field. The data presented by Förster et al. (2004) suggest that statistically different treatment-related effects on weight loss of cellulose paper do not occur at levels up to 1.08 kg ha-1 (2.16 mg kg-1; upper 5 cm; ρ
b = 1000 kg m-3).
Overall, it can be concluded from the data presented above that effects of two applications of 0.5 kg ha-1 (third tier PIECs,tc of 0.876 mg kg-1) on litter breakdown in soils cannot be excluded but most probably
will be relatively small and short-term. In addition, in the TMEs and field plots mentioned above it was also demonstrated by Van Gestel et al. (2004) that dosages as high as 87.5 kg ha-1 (175 mg kg-1; upper 5 cm; ρb = 1000 kg m-3) did not have a significant impact on soil nutrient cycling. Furthermore, in the
same test systems Sousa et al. (2004) studied the impact of carbendazim application on substrate induced respiration (mg CO2/g dry soil /h), dehydrogenase activity (mg triphenylformazan/g dry soil/h),
phosphatase activity (mg para-nitrophenol/g dry soil /h) and thymidine incorporation
(pmol[3H]thymidine/g dry soil /h). For the endpoints related to microbial activities clear dose-response relationships often could not be observed. More or less consistent NOECs of 1.08 - 3.24 kg ha-1
22 RIVM Report 601712002 (= 2.16 – 6.48 mg kg-1) could be calculated for some test systems (but not at all locations) for
dehydrogenase activity and phosphatase activity. These observations suggest that effects of two applications of 0.5 kg ha-1 (= third tier PIECs,tc of 0.876 mg kg-1) on microbial activity and nutrient
cycling in soils will be negligible.
2.5.2
Ecotoxicological endpoints in line with the CRP and ETP
Chronic laboratory toxicity tests with soil organisms
In Table 2.4 the chronic laboratory toxicity data reported for soil organisms in the EU dossier (in italics) and open literature are reported. The majority of toxicity data reported in Table 2.4 comprise chronic NOEC values for Enchytraeidae (potworms) and Lumbricidae (earthworms). In addition, a chronic toxicity value is available for the arthropod Folsomia candida and the plant Lactuca sativa. Among the soil invertebrates tested worms appear to be the most sensitive.
Table 2.4 Chronic laboratory toxicity data for soil dwelling organisms and carbendazim as reported in the EU dossier (italics) and open literature. In bold the toxicity value used in the dossier to perform the long-term risk assessment.
species formulation OM (%) pH duration (d) endpoint value (mg kg-1) value # (µg dm-3) reference Enchytraeus albidus
(Enchytraeidae) Derosal 10 5.5* 42 ECrepro 10 0.4 3.5* Römbke, 2003
Eisenia andrei
(Lumbricidae) Derosal 10 6 21 NOEC repro 0.6 7.2 Van Gestel et al., 1992
Eisenia fetida (Lumbricidae) Derosal ? 5.5* 28 NOEC repro 0.6 5.2* Römbke, 2003 Eisenia fetida (Lumbricidae) Derosal 10 5.5* 56 NOEC repro 1.00 8.6* Lührs, 2001a Eisenia fetida (Lumbricidae) Derosal 10 5.5* 56 NOEC repro 1.03 8.9* Lührs, 2001b Eisenia fetida (Lumbricidae) Derosal 10 5.5* 56 NOEC repro 1.20 10.4* Lührs, 2002/2003 Eisenia fetida
(Lumbricidae) 10 7.5 28 NOEC repro 2.2 33.7 Vonk et al., 1986
Folsomia candida (Arthropod) technical 10 5.5* 28 NOEC repro 320 2762.7* Heusel, 1993 (in ECCO, 1997) Lactuca sativa (Rooted plant)
1.4 7.5 14 NOEC 46 704.1 Vonk et al., 1986
# Pore water concentration estimated from total soil content
* No information on soil properties: OECD guideline 222 defaults (OM: 10%, volumetric moisture content: 0.5) used to calculated pore water concentration, KOM,pH5.5:1153.3 dm3 kg-1. A volumetric moisture content of 0.5 was used for all calculations.
Too few chronic toxicity data are available to apply the SSD approach to assess the risks for potworms and earthworms (NOEC values for three species only) or soil organisms (NOEC values for four taxonomic groups only). Although carbendazim is a fungicide, reliable chronic laboratory toxicity data for soil fungi are not available.
Acute laboratory toxicity tests with soil organisms
Table 2.5 gives the acute laboratory toxicity data reported for soil organisms in the EU dossier (italics) and open literature. Again, the majority of toxicity data reported in Table 2.5 comprise values for
RIVM Report 601712002 23 worms (Lumbricidae and Enchytraeidae). In addition, additional acute toxicity values are available for the arthropods Trigoniulum corallinus (Diplopoda) and Circoniscus ornatus (Isopoda). Again, among the soil invertebrates tested, worms appear to be the most sensitive. In the EU dossier and open literature reliable acute laboratory toxicity data for soil fungi and carbendazim could not be found.
Table 2.5 Acute carbendazim laboratory toxicity data for soil dwelling organisms as reported in the EU dossier (italics) and open literature
species formulation OM
% days endpoint value mg kg-1 reference Lumbricidae
Eisenia andrei Derosal 10 21 5.7 Van Gestel et al., 1992
? 28 6 Römbke, 2003 technical 10 14 28 5.4 3.9 Vonk et al., 1986 Eisenia fetida 36% SC 10 14 64 Heusel, 1991
Pontoscolex corethurus Derosal 3.5 14
LC50
48.2 Garcia, 2004 Enchytraeidae
Enchytraeus albidus 10 28 LC50 6 Römbke, 2003
Enchytraeus coronatus 10 21 EC50 (RI) 14.1 Arrate et al., 2002
Fridericia ratzeli Derosal ? 28 LC50 3.3 Frampton et al., 2006 Arthropods Trigoniulus corallinus (Diplopoda) 3.5 14 LC50 503.5 Circoniscus ornatus (Isopoda) Derosal 3.5 14 LC50 1000 Garcia, 2004
Field and semi-field tests
Several ecotoxicological (semi-)field tests are reported for carbendazim in a special issue of the scientific journal Ecotoxicology (see Knacker et al., 2004). The reported (semi-)field tests comprise studies in indoor Terrestrial Model Ecosystems (TMEs) and corresponding outdoor field plots representative for four different European sites, viz. Amsterdam (the Netherlands), Bangor (UK), Coimbra (Portugal) and Flörsheim (Germany). We considered these (semi-)field experiments appropriate to use in the risk
assessment procedure on basis of the following criteria: 1. the test systems represented a relevant soil community;
2. the experimental set-up of the experiments was adequately described;
3. the exposure regime in the test systems was well-enough characterized (although a detailed evaluation needs the basic data that underly the scientific publications);
4. the investigated endpoints, particularly Enchytraeidae and Lumbricidae, are reported to be sensitive to the fungicide carbendazim (although structural aspects of soil fungi were not investigated); 5. it was possible to evaluate the observed effects statistically and ecologically (univariate and
multivariate techniques).
Summaries of the consistent ecological threshold levels for carbendazim on structural measurement endpoints in the TMEs and the field plots are reported in Table 2.6 and Table 2.7, respectively. The structural measurement endpoints investigated in the TMEs and field plots mainly concerned soil
24 RIVM Report 601712002 invertebrates. Treatment-related effects on soil microorganisms were only investigated from a
functional point of view (microbial activity like nutrient cycling and carbon mineralization; see section 2.5.1).
For a proper effect and risk assessment the (semi-)field threshold levels in kg ha-1 in Table 2.6 and Table 2.7 are recalculated to obtain higher tier NOEC or LOEC values for the soil invertebrate community in terms of total concentration or pore water concentration in the upper 5 cm of soil. A FORTRAN program was developed to calculate concentrations in ecotoxicological studies (Appendix 8 in Van der Linden et al., 2008). This program is used to calculate the concentrations in the upper 5 cm of the soil. Data on soil properties needed by the program for calculating the concentrations are found in Knacker et al. (2004) and Jones et al. (2004) and presented in Table 2.8.
Table 2.6 Observed ecological threshold levels (expressed in terms of A: dose applied, B: total concent, C: pore water concentration in the upper 5 cm of soil) for carbendazim on structural invertebrate
measurement endpoints in Terrestrial Model Ecosystems NOEC most sensitive structural endpoint for
different soil invertebrate groups
most sensitive structural endpoint in test system location nematodes (Moser et al., 2004a) arthropods (Koolhaas et al., 2004) potworms (Moser et al., 2004b) earthworms (Römbke et al., 2004) Effect class I NOEC Effect class II LOEC A expressed in terms of dose applied (kg ha-1)
Amsterdam 1.08 0.36 – 2.16 2.16 2.16 0.36
(Collembola - community) (Collembola -community) 1.08
Bangor 29.2 0.36 – 2.16 2.16 2.16 0.36 (Acari; community) 1.08 (Acari; community) Coimbra 1.08 (increase !) 2.16 * 1.08 1.08 (earthworm biomass; Nematoda - plant parasites)
> 1.08 ? (earthworm biomass; Nematoda - plant parasites)
Flörsheim 29.2 <0.36 1.08 <0.36
(abundance of potworms)
0.36 (abundance of potworms)
B expressed in terms of total content in the upper 5 cm of the soil (mg kg-1)
Amsterdam 1.73 0.57 – 3.46 3.46 3.46 0.57
(Collembola - community) (Collembola - community) 1.73
Bangor 43.58 0.54 – 3.22 3.22 3.22 0.54 (Acari; community) 1.61 (Acari; community) Coimbra 2.06 (increase !) 4.11 * 2.06 2.06 (earthworm biomass; Nematoda - plant parasites)
> 2.06 ? (earthworm biomass; Nematoda - plant parasites)
Flörsheim 58.40 <0.72 2.16 <0.72
(abundance of potworms) (abundance of potworms) 0.72
C expressed in terms of pore water concentrations in the upper 5 cm of the soil (mg kg-1)
Amsterdam 17.7 5.9 – 35.4 35.4 35.4 5.9
(Collembola - community) (Collembola - community) 17.7
Bangor 770.1 9.5 – 57.0 57.0 57.0 9.5 (Acari; community) 28.5 (Acari; community) Coimbra 82.8 (increase !) 165.5* 82.8 82.8 (earthworm biomass; Nematoda - plant parasites)
> 82.8 ? (earthworm biomass; Nematoda - plant parasites)
Flörsheim 807.8 <10.0 29.9 < 10.0
(abundance of potworms)
10.0 (abundance of potworms) * an observed trend of a treatment-related response that is not statistically different
? an Effect class II concentration cannot easily be derived since treatment-related effects on relevant endpoints were studied at the end of the TME experiment only
RIVM Report 601712002 25
Table 2.7 Observed ecological threshold levels for carbendazim on structural invertebrate measurement endpoints in field plot studies performed in Amsterdam, Bangor, Coimbra and Flörsheim
NOEC most sensitive structural endpoint for
different soil invertebrate groups most sensitive structural endpoint in test system
location nematodes (Moser et al., 2004 a) arthropods (Koolhaas et al., 2004) potworms (Moser et al., 2004 b) earthworms (Römbke et al., 2004) Effect class I
NOEC Effect class II LOEC
A expressed in terms of dosa applied (kg ha-1)
Amsterdam 0.36 >87.5 9.72 3.24 0.36
(Nematoda – omnivores)
> 0.36 ? (Nematoda – omnivores)
Bangor 1.08 >87.5 9.72 1.08
(Nematoda – omnivores) (Nematoda – omnivores) > 1.08 ?
Coimbra 3.24 * >87.5 1.08 * 1.08 *
(abundance earthworms) (maturity index – Nematoda) > 3.24 * ?
Flörsheim 9.72 9.72 3.24 3.24
(biomass earthworms) (biomass earthworms) > 3.24 ?
B expressed in terms of total content in the upper 5 cm of the soil (mg kg-1)
Amsterdam 0.58 >140.0 15.5 5.2 0.58
(Nematoda – omnivores) (Nematoda – omnivores) > 0.58 ?
Bangor 1.6 >130.6 14.5 1.6 (Nematoda – omnivores) > 1.6 ? (Nematoda – omnivores) Coimbra 6.2 * >166.7 2.1* 2.1* (abundance earthworms) >6.2* ?
(maturity index – Nematoda)
Flörsheim 19.4 19.4 6.5 6.5
(biomass earthworms) (biomass earthworms) > 6.5 ?
C expressed in terms of pore water concentrations in the upper 5 cm of the soil (mg kg-1)
Amsterdam 5.9 > 1434.8 159.4 53.1 5.9
(Nematoda – omnivores)
> 5.9 ? (Nematoda – omnivores)
Bangor 28.5 > 2307.6 256.3 28.5
(Nematoda – omnivores) (Nematoda – omnivores) > 28.5 ?
Coimbra 248.3* > 6707.6 82.8* 82.8*
(abundance earthworms) (maturity index – Nematoda) > 248.3* ?
Flörsheim 268.9 268.9 89.6 89.6
(biomass earthworms)
> 185.2 ? (biomass earthworms) * an observed trend of a treatment-related response that is not statistically different
? an Effect class II concentration cannot easily be derived since treatment-related effects on the relevant measurement endpoint were studied at the end of the field plot experiment only (16 weeks post treatment)
It can be concluded from Table 2.6 that in the indoor Terrestrial Model Ecosystems arthropods
(Collembola, Acari) and earthworms/potworms were among the most sensitive measurement endpoints. Unfortunately, arthropod endpoints were only studied for the Amsterdam and Bangor sites. Overall, differences in Effect class I-II values between sites were relatively small. It can be concluded from Table 2.7 that in the outdoor field plots earthworms and Nematoda were among the most sensitive measurement endpoints. Differences in Effect class I values between sites were relatively large. The Amsterdam field plot revealed the lowest Effect class I NOEC, particularly for pore water.
26 RIVM Report 601712002
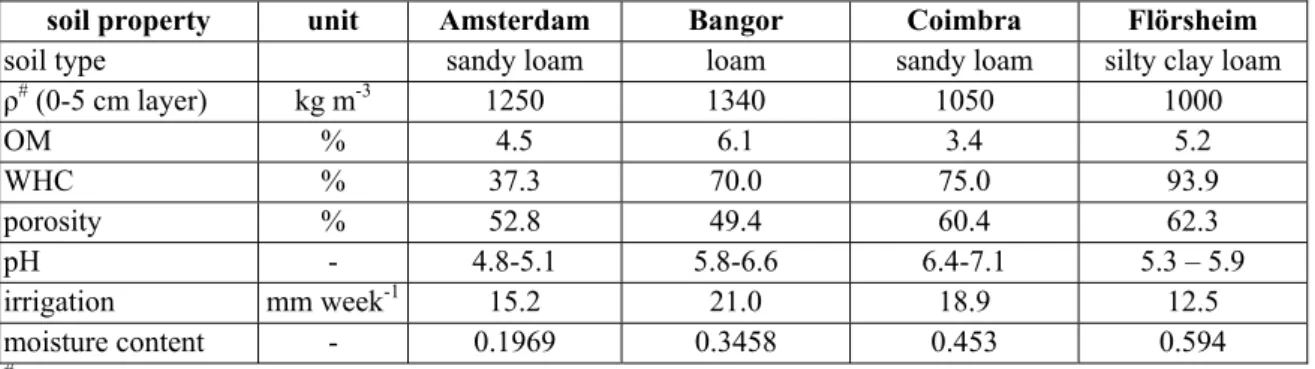
Table 2.8 Properties of Amsterdam, Bangor, Coimbra and Flörsheim soils needed for calculating total contents and pore water concentrations
soil property unit Amsterdam Bangor Coimbra Flörsheim
soil type sandy loam loam sandy loam silty clay loam
ρ# (0-5 cm layer) kg m-3 1250 1340 1050 1000 OM % 4.5 6.1 3.4 5.2 WHC % 37.3 70.0 75.0 93.9 porosity % 52.8 49.4 60.4 62.3 pH - 4.8-5.1 5.8-6.6 6.4-7.1 5.3 – 5.9 irrigation mm week-1 15.2 21.0 18.9 12.5 moisture content - 0.1969 0.3458 0.453 0.594
# dry bulk density
The moisture contents of the soils are calculated from the WHC and the porosity, assuming a density of 2650 kg m-3 for the solids. Field capacity (pF2) is assumed for every locaction because the soils are
irrigated weekly (see Table 2.8). Moisture contents calculated for Flörsheim, a silty clay loam soil situated in a river basin (river Main, Germany), and Amsterdam comply quite well with literature data for such soils (Figure 3.12 in Koorevaar, 1983). Evaluation of the calculated moisture contents at Bangor and Coimbra is not possible as more general data on pF curves of soils for these locations are not available. However, the calculated moisture contents at field capacity are considered acceptable. From a regulatory point of view realistic worst-case concentrations should be calculated. The pore water concentration depends strongly on the value of the sorption coefficient. A higher sorption coefficient gives a lower pore water concentration, consequently worst-case estimates of the test concentrations. The sorption coefficient of carbendazim is pH dependent and the pH differs per location (see Table 2.8; Knacker et al., 2004). Using the fitted relation between KOM and pH and the uncertainty in this relation
(Appendix 2, Figure A2.2) and the lower boundary of the pH range, the KOM per location is calculated
(Table 2.9). A conservative estimate of the KOM is obtained using the upper boundaries of the 95%
confidence intervals of both Kmol and Kanion, the fitted value for the surface acidity effect (PSH) and the
known pKa and relative molar mass (RM, see also Appendix 2, Figure A2.2).
Table 2.9 Sorption coefficients and dissipation half-lives for Amsterdam, Bangor, Coimbra and Flörsheim soils needed for calculating exposure concentrations
pH KOM (dm-3 kg-1) TME ring test field plot study (lower boundary) (higher boundary) mean DT50 (d) mean DT50 (d)
Amsterdam 4.8 2163.9 97.3 65.8
Bangor 5.8 922.1 32.2 32.2
Coimbra 6.4 717.7 39.2 21.7
RIVM Report 601712002 27 DT50 values are needed for the calculations of TWA concentrations and PEC’s at times > 0 days. As
DT50 values are determined in both the TMEs and the field plot studies it was decided to use these DT50
values (Table 2.9).
Since in chronic standard toxicity tests and in the Flörsheim TMEs potworms are the most sensitive organisms, and the duration of the lower-tier test with potworms is 42 days, TWA42 concentrations are
calculated as well. The calculated concentrations are shown in Table 2.10.
Table 2.10 Calculated carbendazim exposure concentrations in the upper 5 cm soil layer of the Terrestrial Model Ecosystems
type of exposure concentration
at time (d)
Amsterdam Bangor Coimbra Flörsheim
Effect class I NOEC Effect class II LOEC Effect class I NOEC Effect class II LOEC Effect class I NOEC Effect class II LOEC Effect class I NOEC Effect class II LOEC PEC total content
(mg kg-1) 0 0.57 1.73 0.54 1.6 2.1 >2.1
? <0.72 0.72 PEC pore water (µg
dm-3)
0 5.9 17.7 9.5 28.5 82.8 >82.8 ? <10.0 10.0 PEC total content
(mg kg-1) 42 0.43 1.3 0.22 0.65 0.98 >0.98
? <0.46 0.46 PEC pore water (µg
dm-3)
42 4.4 13.1 3.8 11.5 39.4 >39.4 ? <6.3 6.3 PECTWA42 total
content (mg kg-1) 0.50 1.5 0.35 1.1 1.45 >1.45
? <0.58 0.58 PECTWA42 pore
water (µg dm-3)
5.1 15.3 6.2 18.7 58.4 >58.4 ? <8.0 8.0 * an observed trend of a treatment-related response that is not statistically different
? an Effect class II concentration that cannot easily be derived since treatment-related effects on the relevant measurement endpoint were studied at the end of the field plot experiment only (16 weeks post treatment)
Table 2.11 and Table 2.12 provide the threshold levels for the most sensitive measurement endpoint in each test system based on estimated concentrations on day 42 and the time weighted average
concentrations over 42 days (TWA42). For the TWA calculations a 42 days time window was adopted
since in the first-tier tests with standard test organisms Enchytraeus albidus was the most sensitive soil dwelling invertebrate. Standard tests with this potworm take 42 days.
28 RIVM Report 601712002
Table 2.11 Calculated carbendazim exposure concentrations in the upper 5 cm soil layer in field plots. type of exposure
concentration
at time (d)
Amsterdam Bangor Coimbra Flörsheim
Effect class I NOEC Effect class II LOEC Effect class I NOEC Effect class II LOEC Effect class I NOEC Effect class II LOEC Effect class I NOEC Effect class II LOEC PEC total content
(mg kg-1)
0 0.58 >0.58 ? 1.6 >1.6 ? 2.1* >6.2* ? 6.5 >6.5 ? PEC pore water (µg
dm-3) 0 5.9 >5.9
? 28.5 >28.5 ? 82.8* >248.3* ?
89.6 >89.6 ? PEC total content
(mg kg-1) 42 0.37 >0.37
? 0.65 >0.65 ? 0.54* >1.6* ? 4.0 >4.0 ? PEC pore water (µg
dm-3) 42 3.8 >3.8
? 11.5 >11.5 ? 21.6* >64.9* ? 55.3 >55.3 ? PECTWA42 total
content (mg kg-1) 0.47 >0.47
? 1.1 >1.1 ? 1.1* >3.4* ? 5.1 >5.1 ? PECTWA42 pore
water (µg dm-3)
4.8 >4.8 ? 18.7 >18.7 ? 45.6* >136.7* ?
71.1 >71.1 ? * an observed trend of a treatment-related response that is not statistically different
? an Effect class II concentration that cannot easily be derived since treatment-related effects on the relevant measurement endpoint were studied at the end of the field plot experiment only (16 weeks post treatment)
Table 2.12 presents a summary of the Effect class I and II threshold concentrations in the TMEs and field plots that will be used in the Tier 3 risk assessment. In this table the lowest values reported for the four TMEs and for the four field plots are given, as well as the geometric mean values for all the TMEs and field plot sites. In calculating these geometric means ‘larger than’ and ‘smaller than’ values were not used. Overall it can be concluded that the lowest Effect class I NOECs are remarkably similar between the TMEs and field plots. However, the geometric mean Effect class I NOECs are
approximately a factor two higher for the field plots when compared with the TMEs. In the TMEs the difference between Effect class I NOECs and Effect class II LOEC’s is relatively small.
Although carbendazim is a fungicide, hardly any information is available on the impact of carbendazim on densities of soil fungi and/or the composition of the fungal community in soils. In the EU dossiers of carbendazim no relevant information could be found on this topic.
RIVM Report 601712002 29
Table 2.12 Lowest and geometric mean calculated exposure concentrations in the upper 5 cm soil layer of the four TMEs (see Table 2.10) and field plot studies (see Table 2.11)
Terrestrial Model Ecosystems field plots type of exposure
concentration
at time (d)
lowest value geometric mean value
lowest value geometric mean value Effect class I NOEC Effect class II LOEC Effect class I NOEC Effect class II LOEC Effect class I NOEC Effect class II LOEC Effect class I NOEC Effect class II LOEC PEC total content
(mg kg-1)
0 0.54 0.72 0.86 1.26 0.58 - 1.89 -
PEC pore water (µg
dm-3) 0 5.90 10.00 16.68 17.15 5.90 - 33.42 -
PEC total content (mg kg-1)
42 0.22 0.46 0.45 0.73 0.37 - 0.85 -
PEC pore water (µg
dm-3) 42 4.40 6.30 8.70 9.83 3.80 - 14.98 -
PECTWA42 total
content (mg kg-1) <0.58 0.58 0.63 0.98 0.47 - 1.31 - PECTWA42 pore
water (µg dm-3) 5.10 8.00 12.27 12.96 4.80 - 23.23 -
- indicates that a geometric mean Effect class II concentration cannot be derived since it mainly concerned ‘larger than’ values
In the open literature it is reported that carbendazim at soil exposure concentrations of 0.5 mg kg-1 (test
duration 4 days) significantly inhibits 32P transport and succinate dehydrogenase activity in external hyphae of arbuscular mycorrhiza species (Glomus intraradices, Glomus claroideum, Glomus
invermaium) in symbiosis with pea (Pisum sativum), while hyphal length densities of these mycorrhiza
species are hardly affected at this exposure level (Kling and Jakobsen, 1997). In a follow-up study, Schweiger and Jakobsen (1998) demonstrated that the threshold level of carbendazim on P uptake by arbuscular mycorrhiza species associated with pea is approximately 0.006 mg kg-1 soil (test duration post treatment 6 days). The impact of this effect on micorrhizal P-uptake for the fitness of the host plant was not investigated, although it was suggested that arbuscular mycorrhizal fungi enhance plant growth by increasing the phosphorous supply to plants. These experiments mainly provide insight in treatment related effects on the physiological performance of mycorrhiza. The possible concentration-response relationship between carbendazim and the structural characteristics of the mycorrhiza community remains to be investigated.
In the open literature it is reported that in clay soil samples from the botanical garden of the Assiut University (Egypt), treated with 0.75 – 6.07 mg kg-1, statistically significant effects on counts of some common fungal species occurred (Abdel-Fattah et al., 1982). At the lowest treatment level
(0.75 mg kg-1, estimated nominal pore water concentration 134.7 µg dm-3) the most pronounced effects
were observed 5 days post carbendazim application for total counts of fungal species and Aspergillus
fumigatus (reduction relative to controls > 50 %), while 10 and 20 days post-treatment statistically
significant effects could not be demonstrated anymore. However, 40 days post treatment a statistically significant reduction of approximately 20% in total counts of fungal species could be demonstrated again in the 0.75 mg kg-1 treatment. At treatment levels of 3.03 and 6.07 mg kg-1 a significant but partial
30 RIVM Report 601712002 reduction in counts of Aspergillus and total fungal species was also observed at the end of the
experiment (80 days post treatment). Although statistically significant reductions in counts were demonstrated for several low abundance species on one or a few sampling days (for example
Aspergillus niger, Humicola grisea, Fusarium solani) in soil samples treated with 0.75 mg kg-1, their
numbers in control soil samples were so low (< 10 per mg) that it is hard to interpret the ecological impact of carbendazim on the densities of these species (Abdel-Fattah et al., 1982). Overall it can be concluded from this experiment that in the soil tested a concentration of 0.75 mg kg-1 (134.7 µg dm-3 (pH 7.4, OM 0.8%)) resulted in a short-term and partial reduction in counts of common fungal species (Effect class II-III).
2.6
CRP effect assessment
On basis of the single species laboratory toxicity tests with soil organisms (Table 2.4 and Table 2.5) it appears that information on the effect of carbendazim on structural measurement endpoints of fungi is lacking, despite the fact that the test substance is a fungicide. Of the soil organism tested worms (Lumbricidae; Enchytraeidae) appear to be more sensitive than arthropods and plants. The semi-field tests (Table 2.6 and Table 2.7) reveal that also Nematoda and the soil arthropod community may comprise sensitive measurement endpoints. The fact that the arthropod community (Collembola, Acari) in some of the indoor TMEs was relatively sensitive might be explained by possible effects via the fungal community. Several soil Collembola and Acari are reported to feed on soil fungi (Koolhaas et al., 2004). Treatment-related effects of carbendazim on structural endpoints of soil fungi were not
investigated in the (semi)field experiments summarised in Table 2.6 and Table 2.7. Some literature data, however, reveal that carbendazim at concentrations as low as 0.01 mg kg-1 may affect the physiological performance of mycorrhiza species (Schweiger and Jakobsen, 1998), while a concentration as low as 0.75 mg kg-1 (134.7 µg dm-3 (pH 7.4, OM 0.8%)) resulted in a short-term and partial reduction in counts of common fungal species (Effect class II-III) in soil samples (Abdel-Fattah et al., 1982). Since this Effect class II-III pore water concentration for soil fungi is more than a factor of 10 higher than the lowest reported Effect class I-II pore water concentration (t = 0) given in Table 2.12, we assume that the lowest Effect class I-II thresholds as reported in Table 2.12 for soil invertebrates can be used in the higher-tier risk assessment.
2.6.1
First tier (standard test species approach)
In case of a fungicide the CRP decision tree requires chronic NOEC/EC10 values for at least a fungus,
an earthworm and another taxon. In the EU dosssiers nor in the open literature chronic NOEC/EC10
values derived from laboratory toxicity tests for a fungus could be found (Table 2.4 and Table 2.5). Consequently, a first tier effect assessment according to the proposed CRP decision tree (to derive a RACCRP) could not be performed.
2.6.2
Second tier (SSD approach)
According to the CRP decision tree the SSD approach cannot be used since less than eight chronic NOEC values are available for different taxonomic groups (assuming that carbendazim has a biocidal toxic mode-of-action) or for the most sensitive taxonomic group (assuming that Lumbricidae and Enchytraeidae are the representative sensitive taxa; or at least as sensitive as fungi). Also the available acute toxicity data are not sufficient to construct an acute SSD, at least when applying the criteria mentioned above.
RIVM Report 601712002 31
2.6.3
Third tier (Model ecosystem approach)
From Table 2.12 it can be concluded that a nominal treatment level of 0.58 – 0.72 mg kg-1 can be
considered as an overall threshold level for effects on soil invertebrates in the indoor TMEs and outdoor field plots. These values correspond with TWA42 concentrations of 0.47 - 0.58 mg kg-1 and peak and
TWA42 pore water concentrations of 5.90 – 10.00 µg dm-3 and 4.80 - 8.00 µg dm-3, respectively. Strictly
speaking this threshold level cannot directly be used in the effect assessment of carbendazim since treatment-related effects on the structure of the fungal community in the semi-field tests were not investigated. Abdel-Fattah et al. (1982), however, reported that a pore water concentration of
134.7 µg dm-3 resulted in short-term and partial reductions in counts of common fungal species (Effect class II-III) in soil samples. Since effects of a carbendazim pore water concentration of 134.7 µg dm-3 on counts of fungal species in soil samples were relatively small and short-term, we decided to use the lowest Effect class I-II threshold levels for invertebrates as derived from the TMEs and field plots in the effect assessment. In addition, in these TMEs and field plots effects on microbial activity and nutrient cycling were much less sensitive than structural responses of soil invertebrates (see section 2.5.2). To derive the RACCRP,s,tc spatio-temporal extrapolation has to be considered when evaluating threshold
concentrations of semi-field tests. If only one valid (semi-)field test is available an AF of 3 has to be applied according to the decision scheme. For carbendazim several (semi-)field tests are available so that it seems fair to use an AF of 1 for spatio-temporal extrapolation when the lowest Effect class I-II threshold value is used. When selecting the lowest Effect class I-II thresholds from the four TMEs and the four field plots the nominal RACCRP,s,tc becomes 0.58 - 0.72 mg kg-1 and the RACCRP,s,TWA42,tc
0.47 - 0.58 mg kg-1. These values correspond with a third-tier nominal RAC
CRP,s,pw of
5.90 - 10.00 µg dm-3 and a RACCRP,s,TWA42,pw of 4.80 - 8.00 µg dm-3.
2.7
ETP effect assessment
2.7.1
First tier (standard test species approach)
A first tier RACETP,s,tc can be derived by applying an AF of 10 to the estimated first-tier RACCRP,s,tc.
Since a RACCRP could not be derived, because of lack of basic data, a RACETP also cannot be derived.
2.7.2
Second tier (SSD approach)
According to the ETP decision tree the SSD approach cannot be used since less than eight chronic NOEC values are available for different taxonomic groups (assuming that carbendazim has a biocidal toxic mode-of-action) or for the most sensitive taxonomic group (assuming that Lumbricidae and Enchytraeidae are the representative sensitive taxa; or at least as sensitive as fungi).
2.7.3
Third tier (Model ecosystem approach)
A third tier RACETP,s,tc can be derived by applying an AF of 3 to the derived third tier RACCRP,s,tc,
resulting in a value of 0.19 - 0.24 mg kg-1. These values correspond with third-tier RAC
ETP,s,pw valuesof
1.97 - 3.33 µg dm-3. In addition, the estimated third-tier RACETP,s,TWA42,tc and RACETP,s,TWA42,pw values
32 RIVM Report 601712002
2.8
Carbendazim persistency risk assessment
2.8.1
Functional Redundancy Principle
Table 2.13 Predicted Environmental Concentrations (PEC) and Regulatory Acceptable Concentrations (RAC) in line with the Functional Redundancy Principle (FRP)
PIEC s,tc PIEC s,pw PEC# s,tc,TWA42 PEC# s,pw,TWA42 RACFRP s,tc RACFRP s,pw RACFRP# s,tc,TWA42 RACFRP# s,pw,TWA42 (mg kg-1) (μg dm-3) (mg kg-1) (μg dm-3) (mg kg-1) (μg dm-3) (mg kg-1) (μg dm-3) Tier 1 5.9 950 5.7 910 * * * * Tier 2 - - - - 0.99** Tier 3 0.88 100 0.83 70
* Litter bag study according to EPFES Guidance Document not available
# TWA period of 42 days chosen because of the duration of the tests with potworms
Within the year of application a third tier PIECs of 0.88 mg kg-1 and 100 µg dm-3 was calculated for
total content and pore water, respectively (Table 2.13). The Tier 3 PIECs are 10 – 15 % of the Tier 1 PIECs, indicating a potential screening function. A litter bag study is required irrespective of the reference temperature of the DegT50, both the DegT50 (10°C, pF2) value of 310.2 days and the DegT50
(20°C, pF2) value of 141 days trigger a litter bag study. However, in the EU dossier a litter bag study with carbendazim that is in accordance with the EPFES Guidance Document (Römbke et al., 2003) is not available. From additional data (see section 2.5.2) it was concluded at a peak concentration level of 0.99 mg kg-1 effects on litter breakdown cannot be excluded but most probably will be relatively small and short-term. These additional data suggest that risks in accordance with the FRP are acceptable, based on the PIECs,tc value.
2.8.2
Community Recovery Principle
Table 2.14 Predicted Environmental Concentrations (PEC) and Regulatory Acceptable Concentrations (RAC) in line with the Community Recovery Principle (CRP)
PEC s,tc,t=2y PEC s,pw,t=2y PEC# s,tc,t=2y,TWA42 PEC# s,pw,t=2y,TWA42 RACCRP s,tc RACCRP s,pw RACCRP# s,tc,TWA42 RACCRP# s,pw,TWA42 (mg kg-1) (μg dm-3) (mg kg-1) (μg dm-3) (mg kg-1) (μg dm-3) (mg kg-1) (μg dm-3) Tier 1 2.7 230 2.6 230 Tier 2 - - Tier 3 0.11 3.4 0.11 3.2 0.58 – 0.72 5.90 – 10.0 0.47 – 0.58 4.80 – 8.00 # TWA period of 42 days chosen because of the duration of the tests with potworms
Two years post last application third tier PECs values are calculated to be 0.11 mg kg-1 and 3.4 µg dm-3
for total content and pore water, respectively. Tier 3 PEC’s are 1 – 5% of Tier 1 PEC’s. These third tier PECs values are lower than the calculated third tier RACCRP values reported in Table 2.14.