Hier komt bij voorkeur een flaptekst te staan, in plaats van deze algemene tekst
Het Planbureau voor de Leefomgeving is hét nationale instituut voor strategische beleidsanalyses op het gebied van milieu, natuur en ruimte.
Het PBL draagt bij aan de kwaliteit van het strategi-sche overheidsbeleid door een brug te vormen tussen wetenschap en beleid en door gevraagd en ongevraagd, onafhankelijk en wetenschappelijk gefundeerd, verken-ningen, analyses en evaluaties te verrichten waarbij een integrale benadering voorop staat.
Planbureau voor de Leefomgeving Locatie Bilthoven Postbus 303 3720 AH Bilthoven T: 030 274 274 5 F: 030 274 4479 E: info@pbl.nl www.pbl.nl
Planbureau voor de Leefomgeving, september 2008 A development agenda beyond 2015 to end global poverty Coming closer to the target year of 2015 for the Millen-nium Development Goals (MDGs), more than one billion people are still living in poverty, without adequate food, safe drinking water and clean energy. Directed to providing basic quality of life, the MDGs are the leading agenda for interna-tional policy on development and sustainable poverty reduc-tion. Undoubtedly, progress has been made but our study has also shown that progress is not sufficient to achieve all goals in all regions by 2015. Many of the goals will not even be achieved by 2030. The most difficult target to achieve is reducing child mortality by two-thirds and requires substan-tial additional development policy efforts.
It is time for the international community to consider a post-MDG development agenda to guide long-term development policies and to end global poverty. In 2015, poverty and hunger may be halved but will still exist, and eliminating health risks and environmental degradation will require additional policy action. Furthermore, new development challenges may arise because demographic, economic and environmental processes are slow moving and their impacts will only become evident after 2015. This report helps to identify these challenges, to explore quanti-tative targets and thus to support the process of creating a development agenda beyond 2015.
Netherlands Environmental Assessment Agency, July 2009
B ey on d 2 01 5: Lo ng -te rm d ev elo pm en t a nd th e M ille nn iu m D ev elo pm en t G oa ls
Beyond 2015:
Long-term development and the
Millennium Development Goals
Beyond 2015:
Long-term development and the
Millennium Development Goals
Beyond 2015: Long-term development and the Millennium Development Goals © Netherlands Environmental Assessment Agency (PBL), Bilthoven, July 2009 PBL publication number 550025004
Corresponding Author: H. Hilderink; henk.hilderink@pbl.nl ISBN: 978-90-6960-230-1
Parts of this publication may be reproduced, providing the source is stated, in the form: Netherlands Environmental Assessment Agency, Beyond 2015: Long-term development and the Millennium Development Goals, 2009.
This publication can be downloaded from our website: www.pbl.nl/en. A hard copy may be ordered from: reports@pbl.nl, citing the PBL publication number.
The Netherlands Environmental Assessment Agency (PBL) is the national institute for strategic policy analysis in the field of environment, nature and spatial planning. We contribute to improving the quality of political and administrative decision-making by conducting outlook studies, analyses and evaluations in which an integrated approach is considered paramount. Policy relevance is the prime concern in all our studies. We conduct solicited and unsolicited research that is both independent and always scientifically sound.
Office Bilthoven PO Box 303 3720 AH Bilthoven The Netherlands Telephone: +31 (0) 30 274 274 5 Fax: +31 (0) 30 274 44 79 Office The Hague PO Box 30314 2500 GH The Hague The Netherlands
Preface 5
Preface
Unfolding global trends and dynamics, and linking policy domains including development cooperation to produce more coherent and effective policies have become integral components of the work of the Netherlands Environmental Assessment Agency (PBL). Our focus is to examine development in terms of sustainable quality of life for all, now and for future generations. In this study, medium-term policy challenges and opportunities are considered in achieving long-term development goals within the framework of environmental sustainability. This study builds on the people-oriented approach of our Sustainability Outlooks (published in 2004 and 2007) which analyse interlinkages between social-cultural (people), ecological (planet) and economic (profit) domains. This approach brings a new dimension to our traditional stronghold of environmental issues in the context of development enabling all people worldwide to have sustainable access to sufficient food, water, energy and clean air.
Our study is appropriate now as the world is half-way to the target year for the Millennium Development Goals (MDGs); the commitment of the international community to eradicate extreme poverty and hunger, to improve education and health, and to ensure gender equality and environmental sustainability. Despite considerable progress, the largely unforeseen global economic crisis will inevitably have major consequences particularly for the Least Developed Countries and could seriously jeopardise MDG achievement. While too premature to assess the far reaching consequences of the current economic crisis, our study has identified challenges and opportunities for long-term development that continue to be determining factors in MDG achievement. By providing information on long-term human development, and identifying entry points for development policies we aim to contribute to policy development in the broader context.
Director, Netherlands Environmental Assessment Agency
Contents 7
Contents
Preface 5 Executive summary 91 Introduction: taking stock and looking into the future
13
2 Development, quality of life and sustainable poverty reduction
17
Different perspectives in the development debate
21
3 Human development in a long-term perspective
25
3.1 Major trends for the coming decades 25 3.2 Implications for the MDGs 30 3.3 Conclusions 39
4 Environment and the MDGs
41
4.1 Sustainable livelihoods and the environment 41 4.2 Food production and malnutrition 43 4.3 Energy and development 46 4.4 Drinking water and sanitation 50 4.5 Conclusions 53
5 Patterns of Vulnerability
55
5.1 A vulnerability approach to development and environment 55 5.2 Vulnerability of smallholder farmers in dryland areas 56 5.3 Vulnerability due to competition between food and biofuels 60 5.4 Conclusions 65
6 Challenges and opportunities for development policies
67
6.1 Main findings of the analyses 67
6.2 Local and national policy options: strengthening livelihoods 68 6.3 International policy options 69
6.4 Different country groups, different policies 73 Appendix 1 GISMO1.0 model
76 References 78 Colophon 83
Executive summary 9
Executive summary
Millennium Development Goals leading framework for development policies The Millennium Development Goals (MDGs) are the leading agenda for internati-onal policy efforts on development and sustainable poverty reduction. This series of quantitative and time-bound targets are directed to reducing extreme poverty and hunger, to improving basic services for people such as health, education and a healthy environment, and to creating a global partnership to enable these goals to be achieved. The international community made a commitment to the MDGs. An integrated, long-term perspective capturing development dynamics
The MDGs have 2015 as a target year. However, underlying long-term dynamics of human development including feedbacks and trade-offs with the environment require targeting beyond 2015. Global environmental changes, demographic tran-sition and income gaps especially have strong implications for MDG achievement in 2015 and beyond. Unlike previous MDG assessments, this study adopted an inte-grated approach (People-Planet-Profit) in which a long-term perspective is taken in exploring short- and medium-term implications and possible actions.
Towards 2015, progress can be observed, but not everywhere, and not enough Analyses with the GISMO model, developed to address long-term human deve-lopment, show progress on many of the MDGs up to and beyond 2015, but this progress is not sufficient to achieve all goals in all regions (Figure E.1). By far the most progress is expected in East Asia, where high economic growth facilitates rapid development and poverty will almost be eradicated by 2015. Considerable progress is also expected in Latin America, the Middle East and North Africa. Poverty will become more concentrated in Sub-Saharan Africa and South Asia. In Sub-Saharan Africa, the MDG target of halving poverty will just be achieved in 2030. Nevertheless, with the relatively high population growth in poorer regions, some 600 million people will have less than one dollar per day in 2015, and this number will reduce to 400 million in 2030. The goal to halve hunger will not be achieved in most developing regions, though improvements are visible. The number of people suffering from hunger reduces only slightly and remains over 700 million until 2030. Furthermore, the largely unforeseen global economic crisis will inevitably have major consequences which could seriously jeopardise MDG achievement. As yet, it is too premature to analyse the effects in a long-term perspective.
Child mortality a difficult goal to achieve
Reduced health risks and improved health services are expected to reduce child mortality in all regions. From as high as 20% children dying before the five years of age, the level in 1990, child mortality in Sub-Saharan Africa is almost halved by
2030. This is a major achievement but far from the MDG target of a two-thirds reduction in 2015 on the 1990 level. Moreover, such a reduction is barely achieved in any developing region, not even in 2030, which indicates the difficulty of this target. Even in an optimistic scenario with high economic growth and agricultural productivity, this reduction is still far from sufficient to reduce the child mortality by two-thirds. A considerable proportion of these child deaths is related to hunger, lack of safe drinking water and sanitation and the use of traditional energy sources which are largely preventable. The lives of millions of children could be saved as a result of higher agricultural productivity, efficient water use and availability of clean and affordable energy. In practice, most of these technologies, including medical technology, are not available in developing countries because of inadequate infra-structure and energy supplies, patents on drugs, and high prices.
Environmental degradation will continue…
A sound natural resource base is one of the most valuable assets for the poor, providing ecosystem goods and services such as fertile soil for agriculture and clean water for drinking and irrigation. But the natural resource base is under constant pressure as population and economic development increase demand for food, water and energy. These trends result in land degradation, pollution of water, soil and air, growing competition for water, and decreasing forest cover and biodiversity. In addition, climate change puts further pressure on land productivity and water availability. As a result, most of the targets set to ensure environmental sustainability (MDG7) will be not met.
…increasing vulnerability and undermining development
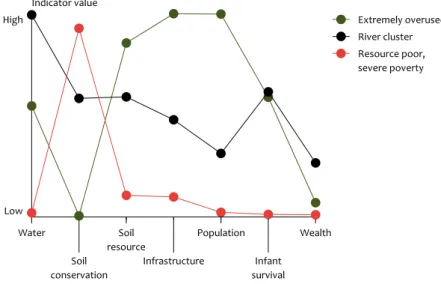
Environmental pressures often coincide, putting already vulnerable groups under even more pressure. Analysis of drylands, for example, shows hot spots with respect to the challenges and trade-offs of improving human development in a fragile environment with limited natural resources and high risks of overexploita-tion. Together with current levels of severe poverty, drylands are a challenge in poverty alleviation and environmental sustainability. Local and national policies are, therefore, needed to reduce people’s sensitivity to shocks in their livelihoods, and to strengthen their coping capacity. International policies need to be comple-mentary in mitigating global environmental change, such as climate change, and in building a supportive international context for national and local implementation of a sustainable development agenda.
Development policies need to be differentiated by target group, phasing and time Differences in national demography, natural resource base and socio-economics need to be incorporated into development policies. For instance, development poli-cies need to take into account the increasing urban shift in poverty, as well as the continuing persistence of rural poverty. Furthermore, the impacts of development policies are not always instantly visible as in the case of education. It takes more than a generation to educate a population, and in doing so, the entire educational system needs to be scaled up to meet increased enrolment. The costs are felt
Projected developments on four key indicators of the Millennium Development Goals. Source: GISMO1.0
Executive summary 11 Policy coherence is important for successful development policies
While Official Development Assistance (ODA) might be the most direct instrument in development cooperation, it is not the only way to stimulate development. This Projected developments on four key indicators of the Millennium Development Goals. Source: GISMO1.0 Figure E.1 East Asia and Pacific South Asia Sub-Saharan Africa Middle East and North Africa Latin America and Caribbean 0 10 20 30 40 50 % population Poverty
Millennium Development Goals
East Asia and Pacific South Asia Sub-Saharan Africa Middle East and North Africa Latin America and Caribbean 0 10 20 30 40 50 % population Hunger East Asia and Pacific South Asia Sub-Saharan Africa Middle East and North Africa Latin America and Caribbean
0 40 80 120 160 200 Under-five deaths per thousand births 1990 2000 2015 2030 Child mortality MDG target 2015 East Asia and Pacific South Asia Sub-Saharan Africa Middle East and North Africa Latin America and Caribbean
0 20 40 60 80 100 % children
is recognised in MDG8 ‘global partnership for development’. For instance, trade and more liberalised world markets can bring additional economic growth to developing countries. But trade liberalisation also brings risks. Countries depending on exports are more susceptible to fluctuations in world markets, while without additional policy, vulnerable groups such as unskilled workers benefit far less from trade liberalisation. This calls for policy coherence that interlinks the various sustainability domains (People-Planet-Profit), connects different scales (from local, livelihood-oriented to international and global aspects), and links short-term actions with long-term effects.
Ending global poverty requires a development agenda beyond 2015
Getting closer to the MDG target year of 2015, the international community needs to start thinking about a post-MDG development agenda to guide long-term deve-lopment policies and to end global poverty. In 2015, poverty and hunger, may be halved but will still exist, and elimination of health risks and environmental degrada-tion will continue to be major concerns. Furthermore, new development challenges may arise because demographic, economic and environmental processes are slow moving and their impacts will only become evident after 2015. The GISMO model can help to identify these challenges, explore quantitative targets and thus support the process of creating a new phase in the development agenda beyond 2015.
Introduction: taking stock and looking into the future 13
Introduction: taking
stock and looking into
the future
In 2000, the international community made a commitment to the Millennium Development Goals (MDGs). This series of quantitative and time-bound targets are directed to reducing extreme poverty and hunger, to improving basic services for people such as health, education and a healthy environment, and to creating a global partnership to enable these goals to be achieved (Table 1.1). The MDGs are also the guiding principle for Dutch and European development policy.
We are now more than halfway to the target year of 2015 for achievement of these goals. This report considers the medium-term policy challenges and opportunities in achieving long-term development goals with a strong emphasis on the role of the environment.
The MDG mid-term review: some success, but not on track
Recent mid-term reviews (UN, 2008c; UN, 2008a) show some key successes, but greater effort is required to achieve the MDGs in all countries. Progress can be observed in reducing absolute poverty worldwide, although many countries remain off-track for meeting the goals by 2015 and inequities are increasing within many countries. This is particularly true for large parts of Africa and parts of Asia where, often in fragile states, a billion people are trapped in poverty (Collier, 2008). Signifi-cant gaps remain in meeting global commitments to provide the enabling environ-ment to accelerate progress in reducing poverty (UN, 2008b).
Financial crisis hampers recent development progress
Africa is lagging behind on almost every goal despite encouraging economic growth over the last ten years, an overall improvement in the policy environment, and stronger macro-economic fundamentals (UN, 2008a). However, the recent financial and economic crisis will affect progress in all developing countries, trapping an additional 53 million people in poverty in 2009. This estimated number is in addition to the further 130-155 million people who became trapped in poverty in 2008 due to higher food and fuel prices (World Bank, 2009a). Development is expected to be affected either directly or indirectly by collapsing global trade, disappearing private capital flows, and lower development assistance (World Bank, 2008a; World Bank, 2009b). The impact of the crisis will strike the poor and most vulnerable hardest
and MDG achievement will be further jeopardised (World Bank, 2009b). However, it is difficult to assess all impacts of recent developments on long-term prospects. Long-term dimensions of major development trends need to be taken into account A stronger policy effort is required to substantially reduce poverty by 2015 and beyond. Thus in dealing with short-term crises, policies need to take a long-term perspective. If this is not done, then MDG achievements may not be sustainable beyond 2015 (Bourguignon et al., 2008). However, achievement of development goals is influenced by the closely related trends of demography, urbanisation, education and global environmental changes. As these are inert and slowly evolving changes, many of today’s policies will only show results after many years or even decades. Thus, these slow changes need to be taken into account in current policies to ensure that development objectives are achieved beyond 2015. This merits an integrated analysis beyond 2015 that also addresses the implications for short- and medium-term policies.
Environment is vital for development
There is increasing recognition of the importance of the environment in develop-ment and human wellbeing (Millennium Ecosystem Assessdevelop-ment, 2005; UNEP, 2007; World Bank, 2008b). A healthy natural resource base and environment is one of the most valuable assets for the poor. In fact, those countries facing serious decline in goods and services provided by ecosystems are also making the slowest progress in achieving the MDGs (Millennium Ecosystem Assessment, 2005). Global and regional environmental changes are taking place at unprecedented rates including climate change, loss of natural resources, land degradation and water stress (UNEP, 2007). The relationship between development and environment, therefore, needs to be at the core of the development debate.
Integrated approach to address development dynamics
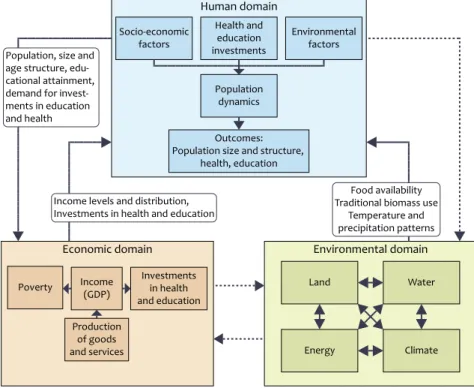
A simple trend analysis is not sufficient to capture long-term socio-economic dynamics and environmental change that determine development in terms of human wellbeing and MDG achievement. Trends from 1990 to 2008 do not provide a sound basis on which to extrapolate outcomes in 2015 and beyond. Therefore, this study has taken an integrated approach in which a long-term perspective is taken in exploring short- and medium-term implications and possible actions. This approach takes account of interactions between the human (‘people’), economic (‘profit’) and environmental (‘planet’) domains. To capture feedbacks and trade-offs between these domains, system dynamics modelling is particularly suitable. Integrated analysis endeavours to bridge scales and to analyse how local outcomes are influenced by national and international policies and vice versa.
Using the GISMO model
The Global Integrated Sustainability Model (GISMO) has been used to make a comprehensive and consistent assessment of the long-term development dynamics and the implications for MDG achievement (Hilderink and Lucas, 2008). The GISMO
Introduction: taking stock and looking into the future 15 and for analysing trade-offs between energy, agriculture and socio-economic
development.
Such a modelling approach is always a simplification of the processes it addresses; people and places are represented by rather abstract and aggregated measures. We are aware of the importance of connecting the macro level represented by regional averages to national and local processes. Therefore, vulnerability analyses have been included using geographical outcomes from, for example, the IMAGE model (Integrated Model to Asses the Global Environment, MNP, 2006). Millennium Development Goals and the targets
Goal Target
1. Eradicate extreme
poverty and hunger 1a: Halve the proportion of people whose income is less than US$ 1 per day1b: Achieve full and productive employment and decent work for all
1c: Halve the proportion of people who suffer from hunger
2. Achieve universal
primary education 2a: Ensure that children will be able to complete a full course of primary schooling
3. Promote gender equality and empower women
3a: Eliminate gender disparity in all levels of education
4. Reduce child mortality 4a: Reduce by two-thirds the under-five mortality rate.
5. Improve
maternal health 5a: Reduce by three-quarters the maternal mortality ratio.5b: Achieve universal access to reproductive health 6. Combat HIV/AIDS,
malaria and other diseases
6a: Have halted and begun to reverse the spread of HIV/AIDS. 6b: Achieve universal access to treatment for HIV/
AIDS for all those who need it
6c: Have halted and begun to reverse the incidence of malaria and other major diseases.
7. Ensure environmental
sustainability
7a: Integrate the principles of sustainable development into country policies and programs and reverse the loss of environmental resources. 7b: Reduce biodiversity loss, achieving a significant
reduction in the rate of loss
7c: Halve the proportion of people without sustainable access to safe drinking water
7d: Have achieved an improvement in the lives of at least 100 million slum dwellers
8. Develop a global partnership for
development
8a: Develop further an open, rule-based, predictable, non-discriminatory trading and financial system
8b: Address the special needs of the least developed countries 8c: Address the special needs of landlocked countries
and small island developing States
8d: Deal comprehensively with the debt problems of developing countries through national and international measures to make debt sustainable in the long term.
8e: In cooperation with pharmaceutical companies, provide access to affordable essential drugs in developing countries.
8f: In cooperation with the private sector, make available the benefits of new technologies, especially information and communications. The eight Millennium Development Goals and the targets, with the targets used in the analyses highlighted
Issues addressed
The report identifies medium-term policy challenges and opportunities to address long-term development dynamics. The following issues are addressed:
Long-term trends and dynamics relevant to human development;
The implications of these trends for MDG achievement up to 2015 and beyond;
Effects of environmental changes on sustainable poverty reduction and MDG
achievement;
Policy options in the short- and medium-term taking the long term into account.
Development, quality of life and sustainable poverty reduction 17
Development, quality
of life and sustainable
poverty reduction
The MDGs are the leading policy framework for development policies that aim at sustainable poverty reduction and a decent standard of living for all. This chapter briefly elaborates the link between development and the MDGs. Building on recent reviews of progress in MDG achievement, various categories of countries are defined for analysis of the long-term dynamics and prospects for future develop-ment policies.
Development, quality of life and the MDGs
Improving quality of life – the extent to which individuals have the ability to live lives they value and the opportunities to do so – lies at the heart of development objectives. There are many ways to express quality of life (Robeyns and van der Veen, 2007). UNDP (2005b) refers to quality of life as the process of widening people’s options through greater opportunities for education, health care, income and employment. The Millennium Ecosystem Assessment (2005) links quality of life to freedom and choices which rest on basic material opportunities, health, envi-ronmental and personal security, and good social relations. These four underlying components are interrelated and reinforcing. Improvements in health, for example, may require expanding livelihood options through more secure access to natural resources as well as security from natural disasters. The MDGs relate to most aspects of quality of life, but are not themselves a definition of wellbeing. Rather, they are a list of accepted priority public responsibilities for the medium term (Jaeger et al., 2007).
Broad support for MDGs but also some criticism
The MDGs as an overarching framework for development helps to focus interna-tional efforts on development and raise public awareness. But while there is broad support, there is also criticism. Bringing the development agenda back to a set of goals and targets might not reflect the complexity of development issues nor do justice to specific situations and characteristics of the countries at stake. Any selec-tion also implies exclusion of topics that are also considered to be relevant. For example, reproductive health is not represented, yet neglecting chronic diseases is considered to be short sighted since such diseases are highly significant in the medium term (Fuster and Voûte, 2005). Further, the importance of environmental
Box 2.1: Global-regional-national aggregation levels
The analyses in this report are done with the Global Integrated Sustainability Model - GISMO (Hilderink and Lucas, 2008). This model distinguishes 27 major world regions, which are aggregated in this report to six main developing regions (Figure 2.1). The regions were aggregated on the basis of aspects such as homogeneity, data avail-ability and practical feasibility. However, a regional breakdown is not always suitable for addressing country-specific characteristics. Other modelling approaches such as International Futures (Hughes and Hildebrand, 2006) and Threshold21 (Millennium Institute, 2004) analyse explicitly the country level. The International Futures model was, for example, used for country-specific poverty projections (Hughes et al., 2008) while the T21 model was used in an analysis of Ghana on the MDGs. While these models have other limitations with regard to applicability and comprehensiveness, they complement the GISMO model. In addition, grid-based outcomes of, for example, the IMAGE model (MNP, 2006) can be used to include a geographic-explicit and more detailed level of information. This provides better insights into local situations. Developing world regions and Dutch partner countries
Latin America and Caribbean Middle East and North Africa Sub-Saharan Africa
South Asia East Asia and Pacific Rest of the world
Antarctica
Dutch partner countries
Development, quality of life and sustainable poverty reduction 19 issues is only partly reflected and there are no clear targets (MNP, 2007). Another issue that is flagged as missing is voice and accountability as an independent goal (Bourguignon et al., 2008). Nevertheless, the MDGs can be considered to be a broad set of goals and targets to reduce poverty in its many dimensions. MDGs to be considered comprehensively
The main challenge for countries is which goals to prioritise and how to achieve these goals, taking into account structural relationships between underlying devel-opment processes. There will be trade-offs as countries prioritise their efforts. A highly relevant question in the context of sustainable development is: Can poverty and hunger be halved by 2015 (MDG1), while ensuring environmental sustainability (MDG7)? The positive interdependency of the various MDGs is illustrated by the goal to achieve universal primary education, which will also indirectly reduce child mortality. Such interrelationships and underlying mechanisms need to be consid-ered in assessment of the MDGs. Thus, the MDGs should be considconsid-ered as an inte-grated part of an overall sustainable development strategy, rather than as a partial policy focused on a single target or a selection of targets.
Sustainable poverty reduction strategies
To achieve a decent quality of life for current and future generations requires poverty reduction to be sustainable. One way of considering people who are potentially most vulnerable and how they cope and adapt is the sustainable liveli-hood approach (Chambers and Conway, 1992). A liveliliveli-hood comprises a person’s means of living which depends on having access to and use of resources and assets. These can include natural resources, technologies, skills, knowledge and capacity, education, sources of credit, and social support networks. Access to these assets is strongly influenced by their vulnerability context. This concerns trends (such as economic, political, and technological), shocks (such as epidemics, natural disasters and civil strife) and seasonality (such as prices, production and employment oppor-tunities). Access is also influenced by the prevailing social, institutional and political environment. The sustainable livelihood approach provides a way of thinking about sustainable poverty reduction strategies and can help to link local processes with higher level policy making.
Different countries, different progress, different policies
A general approach to development policy would not do justice to country-specific circumstances. A country’s development potential is influenced by its geographical location, natural resource endowment as well as the socio-economic situation and culture. Nevertheless, countries do show similarities. In the last decade, several developing countries have achieved relatively high economic growth, and these countries have also made the greatest progress towards MDG achievement. In con-trast, a number of other countries have made little economic progress and thus are behind in MDG achievement. These countries seem to be trapped in a vicious circle of poverty, political instability, or/and an environmental downward spiral (Collier, 2008). Looking ahead, it seems reasonable in long-term sustainable development strategies and policies to differentiate at least between those countries that have experienced economic growth for some time and those countries that have remained behind (Bourguignon et al., 2008; Chronic Poverty Research Centre, 2008; Collier, 2008).
Aggregated developing world regions and partner countries for Netherlands Development Cooperation.
Emerging economies and countries that stay behind
Progress in global poverty reduction is largely due to achievements in East Asia. Countries in this region have experienced relatively high economic growth over the last 20 years and have become a substantial part of the global economy. The main development challenges for this group of countries now include the distribution of increasing welfare, provision of social services such as improving health and educat-ing the population, and environmental problems in relation to the rapid economic growth.
Contrary, MDG achievements are lowest in the poorest regions, such as Sub- Saharan Africa and South Asia, and are extremely low especially in fragile states. This group of countries have experienced hardly any significant economic growth for decades and only in the last five to ten years has there been some economic growth (World Bank, 2007b). The situation in these countries can be explained by various development traps including conflict, abundance of natural resources resulting in the 'resource curse', being landlocked, poorly governed and environ-mentally degraded. As these countries are relative latecomers in the globalisation process, they may have missed the economic opportunities of the last two decades (Collier, 2008). Countries may also face other development traps but the four men-tioned above may well reflect the main challenges for these countries.
International policies taking local options into account
The country groupings could help with regard to international development poli-cies. The eighth and last MDG (global partnership for development) refers to the international community and addresses the international conditions and external support needed for achievement of the other seven MDGs. MDG8 is not so much a goal for domestic development like the other MDGs, but a set of targets for the international community to provide the means for achieving domestic goals. Such international policies will only be effective if coherent and tuned with national and local policies. This is, for example, the case for the rural poor who depend on local environmental resources for their income, either for subsistence or for some form of enterprise, such as farming, tourism, and fishing (WRI, 2008). However, sustain-able management of ecosystems that produce these goods and services can help them to gradually move beyond environmental income alone. Depending on the circumstances, successful local reforms that have captured such opportunities include a combination of factors such as strengthening participatory governance mechanisms and building capacities; adopting better governance, adopting good practices for sustainable production techniques and improving access to markets and credit (Turner et al., 2003). Many of these local reforms are directly related to national and international policies. The key, therefore, is coherence between the policy domains and between levels of policy making.
Intermezzo: Different perspectives in the development debate 21
Different perspectives in
the development debate
There is intense debate amongst practitioners and academics about the objectives approaches to international policy making and development cooperation. This is, for example, witnessed by the large number of publications reflecting a broad range of perspectives on development. These perspectives reflect fundamental uncertainties about how the world functions, different ideas about desired developments outcomes and on policies to be implemented. To address these uncertainties, PBL has developed a methodology which takes account of this plurality of ideas and depicts similarities and contrasts between different perspectives. This intermezzo is intended to give some structure to the development debate, without choosing side. All perspectives reflect aspects of the reality and as such are valuable.Sachs versus Easterly: top-down versus bottom-up
Some, such as Sachs (2005), consider that most countries might escape the poverty trap through a big push of aid and investment that brings economic growth which will trickle down to the poor. Collier (2008) argues that aid can be very helpful but will not be enough to help the bottom-billion, the poorest people caught in different traps that block their development process. In his view, development policies should prioritise this group of countries. The opposite is proposed by Easterly (2006) who concludes that higher economic growth and poverty reduction will only happen with changes from the bottom-up and that development aid has blocked rather than stimu-lated the development process. Others take a middle position that aid works, but aid provision could be improved and made more efficient (Banerjee, 2007; Riddell, 2007). Putting efficiency first, Lomborg (2004) assessed the most economical cost-benefit solutions for the world’s ten major problems, including development issues and aid. Dealing with fundamental uncertainties
The uncertainty concerning future trends is not only the result of statistical uncer-tainty; it is also the result of fundamental differences in the views of how the world functions or works as depicted in the various views described above. One approach to dealing with these different views or perspectives is to use the world view approach to identify different perspectives, for example on development policies (MNP-RIVM, 2004; MNP, 2007). This methodology can be very helpful in positioning and structuring different views on, for example, sustainability issues and has been applied in various scenario studies (de Vries and Petersen, 2009).
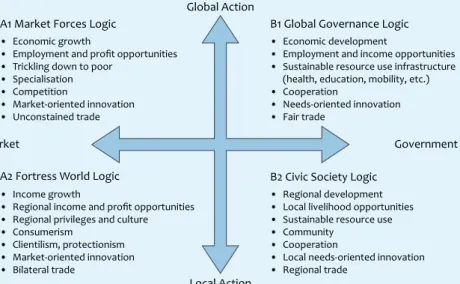
Four resulting world views on development cooperation
The methodology clusters various lines of thought into four world views (Figure I.1) reflecting combinations of two main uncertainties. The four world views differ primarily on the extent to which activities have international interlinkages, that is globalisation versus more regional development, with a stronger bottom-up character (vertical axis), and whether the market or government is the dominant mechanism or player (horizontal axis). The varying ideas about development cooperation include similar uncertainties, bottom-up versus top-down, and different types of actors, more market-oriented or a strong role for government. The four world views can then be regarded as various extremes in the development debate.
Different motives for development cooperation in four world views
Support for international development cooperation can be argued along the lines of the four world views. Development can be seen as:
a way to create new markets and a more efficient world economy (A1);
a moral obligation and to prevent long-term population growth (B1);
a means to avoid a massive migration flow looking for better, basic living condi-
tions and a more stable political situation at the border of current developed regions (A2);
of intrinsic value but only worthwhile when safeguarding a developing country’s
own cultural, socio-economic identity (B2). Dimension and characteristics of the four world views.
Figure I.1 Dimensions of world views on development
Global Action
Local Action Market
A1 Market Forces Logic
• Economic growth
• Employment and profit opportunities • Trickling down to poor
• Specialisation • Competition
• Market-oriented innovation • Unconstained trade
• Income growth
• Regional income and profit opportunities • Regional privileges and culture • Consumerism
• Clientilism, protectionism • Market-oriented innovation • Bilateral trade
• Regional development • Local livelihood opportunities • Sustainable resource use • Community
• Cooperation
• Local needs-oriented innovation • Regional trade
• Economic development
• Employment and income opportunities • Sustainable resource use infrastructure (health, education, mobility, etc.) • Cooperation
• Needs-oriented innovation • Fair trade
B1 Global Governance Logic
B2 Civic Society Logic A2 Fortress World Logic
Intermezzo: Different perspectives in the development debate 23 Different world views have different risks attached
These world views represent stylised views of how the world functions and how the world could be managed. Reality, however, never completely matches these views and each of world views incorporates risks. These risks can also be related to the policy options described in this report. In the A1 world view, the main risk is that free markets and trade liberalisation may not be as beneficial for developing countries and/or particular vulnerable groups as thought. Also, the strong belief in technologi-cal fixes could undermine resource bases because a growing economy requires more inputs, will result in more environmental damage, and the availability of medical technology can be lower then expected. The most risky aspect in the B1 world view is the bureaucracy related to global governance and global institutions which undermine their effectiveness and credibility. In the A2 world view, the focus is on a region’s own identity and development assistance will be downsized resulting in developing coun-tries trapped in situations with no escape. In the B2 world view, there is no global con-nection to do something about global problems, and a strong regional focus may not provide developing countries with sufficient prospects to achieve economic growth.
Human development in a long-term perspective 25
Human development
in a long-term
perspective
A number of closely related long-term development trends are relevant to achieve-ment of the MDGs. In this study, the GISMO1.0 model was used (Hilderink and Lucas, 2008, Appendix A) to analyse these trends and their consequences for MDG achievement in 2015, the target year for most MDGs, and for 2030 in order to provide a long-term perspective (Box 3.1). The focus is on economic development and poverty, education, access to food, improved drinking water and sanitation, improved energy sources, and reducing child mortality.
Major trends for the coming decades
3.1
In identifying medium-term policy challenges and opportunities related to long-term development dynamics, an analysis needs to be made of the long-long-term dynam-ics. Current policies targeting, for example, the MDG for education have a direct effect of providing adequate basic education for all children. However, the indirect effects on economic growth, and on health and fertility levels will mostly be visible in the longer term, beyond the MDG target year of 2015. Given these inertia, some policy actions have to be taken now but some of the benefits will only become apparent in the long term. The major trends and their inertia with respect to human development are addressed, focusing on the main underlying drivers, which are population dynamics (age structure and urbanisation) and economic developments (human capital and income distribution).
Population changes are the result of three components
The three basic processes of population change are fertility, mortality and migra-tion. The profound transformation of decreasing fertility and mortality patterns is generally referred to as the demographic transition. It is part of a much broader process of increasing income levels and education levels, especially education of girls. Migration, however, is less well understood. It is caused by a mix of push and pull factors. The negative or push factors (such as, unemployment) in one place cause people to move elsewhere, while a number of positive or pull factors in other places (such as, economic opportunities) attract migrants.
An incomplete demographic transition results in continuing population increase While many developing countries are completing the demographic transition, Sub-Saharan Africa and to a lesser extend South Asia are lagging behind. Fertility levels in these countries are currently around five children per woman, and have been declining in the last few decades. However, even if fertility levels drop instantly to the replacement level of 2.1 children per woman, the population of Sub-Saharan Africa will have grown 50% by 2050. Therefore, population growth will continue for decades to come in the most deprived parts of the world. With fertility expected to decline further and health to improve, the global population will increase from 6.5 billion now to approximately 8.0 billion people in 2030 (Figure 3.1). The highest growth will occur in Sub-Saharan Africa and South Asia.
Population is not only about numbers but also about structure
Changes in fertility, mortality and migration not only affect the total population but also the population structure. Declining mortality increases life expectancy and thus changes the age structure of the population in favour of the elderly. Decline in fer-tility rates alters the age structure of a population in favour of cohorts of working age, and later towards the elderly. The former can have significant positive impacts on economic growth due to a low dependency ratio - a larger working population compared to the inactive population (children and elderly). The latter, however, increases the dependency ratio, thus putting pressure on economic growth. A period with a relatively low dependency ratio - the demographic window of oppor-tunity - lasted in Europe from 1950 to 2000. This period began in China in 1990 and
Box 3.1: Scenario used in this study
The analysis in this study uses the FAO scenario on food availability (FAO, 2006) and the World Bank scenario on economic growth (2005). Historic developments in regional inequality are taken from the World Bank (Chen and Ravaillon, 2007) and kept constant in our projections. Average food consumption will grow substantially in all developing regions, from 2650 kcal/cap/day in 2000 to 2960 kcal/cap/day in 2030. The largest increase will be in Sub-Saharan Africa and South Asia but in 2030 will lag behind at 2600 kcal/cap/day and 2790 kcal/cap/day, respectively. The relatively high economic growth results from improvements in macroeconomic conditions and investments, and reduction in trade barriers. With an average growth of more than 5% per year, the economy will also grow substantially in all developing regions in the coming decades (Figure 3.3). The highest growth will be in East Asia and Pacific and South Asia but growth in per capita terms will be much lower in Sub-Saharan Africa, the Middle East, and North Africa. These projections date from before the commodity price boom and the global economic crisis, developments that will have a significant effect on the projections but are not included in this report.
All of these developments drive population dynamics including fertility and mortality,
Human development in a long-term perspective 27 is expected to continue until 2015, while India is expected to enter the demographic window in 2010, which may last until 2050. Unfortunately, changes are taking place slowly in Sub-Saharan Africa. This region will not enter the demographic window of opportunity before 2045, making well-needed strong economic growth more difficult.
…and about the place where they live: an increasingly urbanising world
Globally in 2008, the urban population was larger than the rural population for the first time in history. While only 29% of the population was urban in 1950, the global urban population is expected to increase to 60% of the total population in 2030 (Box 3.2). Most of this growth will occur in East Asia and Pacific, South Asia and Sub-Saharan Africa. All of these regions had an urbanisation rate of around 20% in 1970 that is projected to grow by 2030 to 60%, 40% and 50% respectively.
This rapid growth of the urban population has both negative and positive conse-quences (Box 3.2). Today, globally, one in every three city dwellers lives in a slum, totalling about one billion people (UN-Habitat, 2006). Most of these slum dwellers (94%) live in developing regions. People in slums not only lack adequate housing, but also adequate drinking water and sanitation, and sufficient living space with the result that health levels are substantial lower. If current trends continue, the global slum population will reach 1.4 billion in 2020, almost all living in developing regions. Projected increase in global and urban population by region. Source: GISMO1.0
Figure 3.1 1970 1990 2010 2030 0 2 4 6 8 10 billion
Rest of the world East Asia and Pacific South Asia
Sub-Saharan Africa Middle East and North Africa Latin America and Caribbean
Total Population Global population 1970 1990 2010 2030 0 2 4 6 8 10 billion Urban
Human capital is essential for economic growth
The main determinants of long-term economic growth are capital and labour accumulation and productivity increase. Labour accumulation is dependent on demographic changes. Countries that enter the demographic window of opportu-nity have relatively low dependency ratios which give them the potential for higher economic growth. However, this 'demographic bonus' is only a potential advantage because low participation rates or high unemployment may limit the impact of a favourable age structure.
In addition to the demographic potential, education fuels economic growth (Lutz et al., 2008). Education enables countries to adapt technological improvements, thereby increasing both capital and labour productivity. However, children entering primary education take 10 to 20 years before they become economically active, and countries can fully gain from their education.
Not all countries and people profit evenly from global wealth increase
World income inequality has increased dramatically over the last two centuries (Bourguignon and Morisson, 2002). This evolution has been mainly due to a dra-matic increase in inequality across countries and regions, with Western countries showing a much higher growth in per capita income than developing countries. However since the 1950s, several developing countries have experienced economic development. Some have experienced growth rates above 5% for 20 consecutive years. Most African countries have had zero growth in the last 30 years and have only recently shown improvement. The rise in world income inequality would now seem to be over, but this does not mean that a reversal will take place.
Poverty is increasingly urbanised
Cities are generally seen as the engine of economic growth, and therefore attract many people from poorer rural areas. One-quarter of the world’s poor live in urban areas and that proportion has been rising over time (World Bank, 2007a). By foster-ing economic growth, urbanisation has helped to reduce absolute poverty in the
Box 3.2: Urbanisation and the MDGs
The urban-rural distinction in where people live is not only relevant for MDG7 for which drinking water and sanitation has an explicit rural-urban dimension. Other development aspects also have distinct characteristics for urban and rural popula-tions. In general, overall development levels are higher in urban than in rural areas. The UNDP Human Development Index for China’s urban population is 0.81 while for its rural population is 0.67 (UNDP, 2005a). Despite this, the locus of poverty is shifting to cities. In addition, poor urban populations are more prone to malnutrition, while traditionally hunger is most often associated with rural situations. Child mortality is on average lower in urban than in rural areas; yet is as high in urban slum children as in
Human development in a long-term perspective 29
Box 3.3: Income inequality
The Gini coefficient is one of the most commonly used indicators to describe income inequality, indicating income distribution over a country’s population. The more equal a country’s income distribution, the lower its Gini coefficient. The Gini would be zero with absolute equality, and one with absolute inequality. The World Bank has collected poverty and inequality data for most developing countries for the period 1981-2004 (Chen and Ravaillon, 2007; Figure 3.2). The Gini coefficient has increased significantly in East Asia, and also in Latin America and the Caribbean (where it was already the highest in world by far). In China, inequality has increased in both urban and rural areas, although the urban increase has been much larger (Ravallion et al., 2007). Regional Gini coefficients are used in GISMO to determine the income distribution and the population with less than $1 per day and $2 per day (Hilderink and Lucas, 2008). The Gini coefficients for future projections are kept constant at 2000 values because of the lack of future projections and insights to link inequality change to other deter-minants in the model. This has major implications for those regions showing increasing inequalities, such as East Asia and Pacific, where further increase in inequality could slow down poverty reduction.
Regional income inequality and urban-rural inequality for China and India. Source: Chen and Ravaillon, 2007 Figure 3.2 1980 1985 1990 1995 2000 0.0 0.2 0.4 0.6 GINI-coefficient
East Asia and Pacific South Asia Sub-Saharan Africa Middle East and North Africa Latin America and Caribbean
Per region Income inequality 1980 1985 1990 1995 2000 0.0 0.2 0.4 0.6 GINI-coefficient China Rural Urban India Rural Urban
aggregate but has done little for urban poverty. The poor have been urbanising even more rapidly than the population as a whole, with large regional differences. Latin America has the most urbanised poverty problem, and East Asia the least. In contrast to other regions, Africa’s urbanisation process has not been associated with falling overall poverty, both in absolute and relative terms. Together with the reality that rural areas generally remain behind, income distribution within coun-tries has also become more unequal (Box 3.3).
Implications for the MDGs
3.2
The implications of major socio-economic trends and their inertia have been assessed in relation to MDG achievement. In order to better address the underlying determinants and interrelations, the MDGs have been grouped into four clusters: poverty and economic development; education; food, water and energy; and child mortality.
Poverty and economic development 3.2.1
Developing countries are expected to have strong economic growth
Developing countries are projected to have relatively high economic growth (Figure 3.3). For example, the overall economy of China is projected to grow 6% per year between 2000 and 2015, and Sub-Saharan Africa by 4.5% per year. However, per capita income growth is substantially lower given the simultaneous high population growth rates. Taking population growth into account would reduce per capita growth in Sub-Saharan Africa to approximately 2 to 3%. Even with high growth rates, gaps remain. China will take around 50 years of 6% annual growth to reach the per capita income levels that developed countries had in 2000. For Sub-Saharan Africa, this would take around 200 years at annual growth of 4.5%. However, the global economic crisis has already affected all growth rates and thus alters this picture.
Extreme poverty is expected to decrease
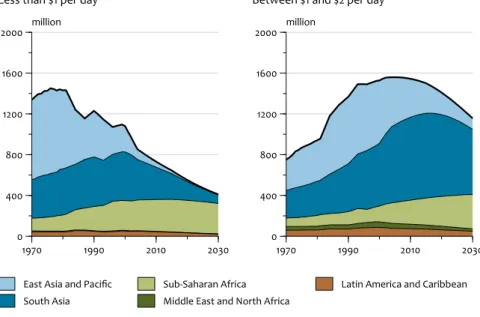
Enormous progress in poverty reduction is expected especially in East Asia, (mostly China) and to a lesser extent in South Asia. The picture is slightly different for Sub-Saharan Africa. The much lower economic growth combined with high popula-tion growth indicates that extreme poverty (people with less than $1 per day) will increase in that region until 2015, and then decreases slowly after that time. Fur-thermore, lifting people out of extreme poverty implies that the population living on between $1 and $2 per day, which is still far from an adequate income level, will increase. In 2030, 1.6 billion will still be living on less than $2 per day, including 400 million people on less than $1 per day (Figure 3.4).
Economic growth is not per se pro-poor growth
Reducing poverty not only depends on economic developments, but also on the
Projected annual total and per capita economic growth, and per capita income. Source: World Bank, 2005
Human development in a long-term perspective 31 Projected annual total and per capita economic growth, and per capita income.
Source: World Bank, 2005
Figure 3.3 East Asia and Pacific South Asia Sub-Saharan Africa Middle East and North Africa Latin America and Caribbean -2 0 2 4 6 8 % per year Total 1990 - 2000 2000 - 2015 2015 - 2030 Per capita 1990 - 2000 2000 - 2015 2015 - 2030
Annual economic growth
Economic growth and income
1990 2000 2010 2020 2030 0 2000 4000 6000 8000 10000
12000 US$ per year
East Asia and Pacific South Asia Sub-Saharan Africa Middle East and North Africa Latin America and Caribbean
Per capita income
possessions and access to markets and services may become more unequal, worsening the position of the lowest income groups in the long term. This calls for specific policies targeted to the poorest people.
Education 3.2.2
Enrolment increases significantly; still 100 million children out-of-school in 2015 The MDG goal of universal enrolment in primary education and all children complet-ing primary education is far from becomplet-ing achieved in most regions. In 2000, almost 150 million children were not attending school. Some progress is expected in the coming decade - with enrolment ratios slightly higher but still with more than 100 million children out of school in 2015. Substantial progress will be made towards 2030, when the enrolment ratios approach 100% and the proportion of children in the total population stabilises.
Educating a population takes more than a generation…
Achieving universal primary education is not equal to achieving an educated popula-tion mainly because of the large inertia in the system. As people who have never had adequate education mostly remain illiterate throughout their lives, it takes a
long time to fully educate a population (Figure 3.5). The average years of schooling increase significantly towards 2030. However, the global population without formal education only starts to decline after 2010 and in Sub-Saharan Africa after 2030. …and a better educated population takes more than universal primary education Striving for universal primary education will also lead to other matters that need to be considered. Firstly, achieving universal primary education will increase demand for secondary and tertiary education with a delay of five to ten years (Dickson et al., forthcoming). This demands additional education infrastructure. Another aspect requiring more attention is the quality of education. The goal should not only be to have every child attending school, but should also include school conditions in terms of pupil-teacher ratio and teacher skills. Without investing in teachers and the quality of education, universal enrolment might not necessarily result in a better educated population.
Food, water and energy 3.2.3
Many people lack adequate access to food, water and energy
People need the natural environment to provide essential goods and services for Projected population living on less than $1 (PPP) per day and between $1 and $2 per day. Source: GISMO1.0
Figure 3.4 1970 1990 2010 2030 0 400 800 1200 1600 2000 million
East Asia and Pacific South Asia
Sub-Saharan Africa Middle East and North Africa
Latin America and Caribbean
Less than $1 per day
Population in poverty 1970 1990 2010 2030 0 400 800 1200 1600 2000 million
Between $1 and $2 per day
Projected average years of schooling and population without formal education. Source: GISMO1.0
Human development in a long-term perspective 33 Projected population living on less than $1 (PPP) per day and between $1 and $2 per
day. Source: GISMO1.0
cases, it is the same people who lack access to these basic goods and services, con-tributing negatively to their wellbeing, with consequences for their health status as one of the testifying factors.
…but significant improvements can be made
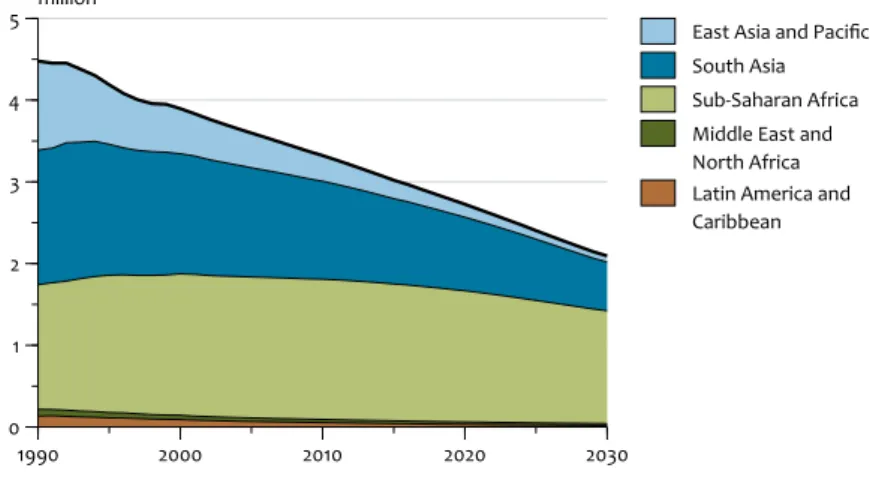
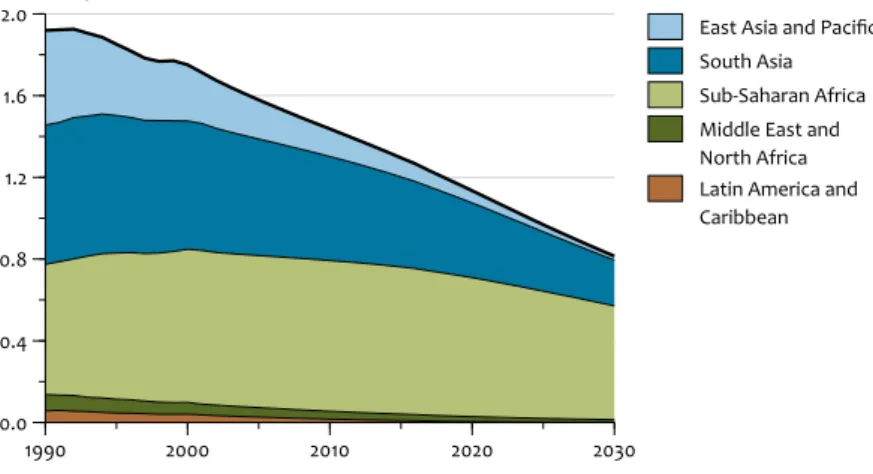
Access to food, drinking water and sanitation and improved energy sources is expected to increase significantly. The main improvements are expected in East Asia and Pacific. Yet, the large increase will still leave a significant proportion of the population without adequate services in Sub-Saharan Africa and South Asia, and especially with respect to improved energy sources. In 2015, 700 million people will be undernourished, 2.5 billion people will depend on solid fuels, and 450 million people will be without improved drinking water and sanitation facilities (Figure 3.6). Increased development at the expense of environment
Over the last 100 years, global human development has been at the expense of the environment, with ecosystems and climate affected most (MNP, 2007). Two-thirds of the world’s productive land has already been brought into use, which, in turn, has caused high levels of biodiversity loss (CBD/MNP, 2007). More than 1.2 billion people live in areas where more than 75% of the river flow is withdrawn, leading to environmental degradation and competition for water (UN, 2008c). Increasing use Projected average years of schooling and population without formal education. Source: GISMO1.0 Figure 3.5 1970 1990 2010 2030 0 2 4 6 8 10 12 years
East Asia and Pacific South Asia Sub-Saharan Africa Middle East and North Africa Latin America and Caribbean
Average years of schooling
Education 1970 1990 2010 2030 0 200 400 600 800 1000 million
East Asia and Pacific South Asia Sub-Saharan Africa Middle East and North Africa Latin America and Caribbean
of modern energy sources is increasing greenhouse gas emissions, which are con-sidered to be responsible for climate change (IPCC, 2007b). In the long term, these global environmental changes can also have repercussions on human development (Millennium Ecosystem Assessment, 2005).
Child mortality 3.2.4
Substantial progress on child mortality can be made
Considerable decreases in child mortality are projected in all regions (Figure 3.7), but are far from sufficient to reduce the mortality rate in children under five by two-thirds, the MDG target. The major health gains are achieved by decreasing traditional health risks, such as lack of adequate access to food, improved drinking water and sanitation, and improved energy sources. Furthermore, improved health services have reduced other health risks such as perinatal conditions and measles. However, these gains will be partly undone by the impacts of HIV/AIDS and urban air pollution.
Environmental health risks remain prominent…
Projected people without adequate access to food, safe drinking water and sanitation, and improved energy sources. Source: GISMO1.0
1990 2000 2015 2030 0 1000 2000 3000 million Hunger
People without adequate access to food, water and energy Figure 3.6
1990 2000 2015 2030 0 1000 2000 3000 million
No drinking water and sanitation
1990 2000 2015 2030 0 1000 2000 3000 million No modern energy
East Asia and Pacific South Asia
Sub-Saharan Africa Middle East and North Africa
Latin America and Caribbean
Human development in a long-term perspective 35 Projected people without adequate access to food, safe drinking water and sanitation, and
improved energy sources. Source: GISMO1.0
sources is especially large. In 1990, these traditional risks accounted for 60% of all child deaths. In Sub-Saharan Africa, their contribution reduces to 54% in 2015 and 50% by 2030. The trend is similar in South Asia, where the traditional health risks account for 55% in 2015 and 51% in 2030. However, these improvements are expected to be partly negated by the devastating effects of HIV/AIDS.
…while decreasing traditional health risks make way for chronic health risks Fewer people living in poverty, a better educated population and improved access to food, improved drinking water and sanitation, and modern energy sources all have positive effects on health. Traditionally, environmental health risks are strongly related to child mortality, while chronic, lifestyle-related health risks relate more to mortality of older people. With decreasing environmental health risks and an aging population, chronic diseases become more prominent with a shift towards the more chronic, lifestyle-related health loss. The challenge may be even greater because infectious and chronic diseases often occur simultaneously. This is also known as the ‘double burden of disease’ (Gaziano, 2007).
Projected child mortality rates by risk factor. Source: GISMO1.0
Figure 3.7 East Asia and Pacific 1990 2000 2015 2030 South Asia 1990 2000 2015 2030 Sub-Saharan Africa 1990 2000 2015 2030 Middle East and North Africa 1990 2000 2015 2030 Latin America and Caribbean 1990 2000 2015 2030 0 40 80 120 160 200 deaths per thousand births
Poverty Hunger Water supply and sanitation Malaria Indoor air pollution Outdoor air pollution HIV/AIDS Other
Considerable investments in health services are needed
Currently, health expenditure is as low as $20-30 per person per year in South Asia and Sub-Saharan Africa, and around $50 per person per year in East Asia. Average health expenditure will increase with increasing incomes. Combined with a growing population, overall spending on health will increase ten times by 2030. This implies an enormous expansion of current health system infrastructure. Thus, it is not only a question of whether such a health system is feasible, it is also essential that people in need of these services have access to them.
MDG achievement 3.2.5
A selection of four indicators is taken as core MDG indicators (Figure 3.8). These indicators include the proportion of population living on less than $1 per day (MDG1), the proportion of population below minimum level of dietary energy con-sumption (MDG1), net enrolment ratios in primary education (MDG2) and under-five mortality rates (MDG4).
Some regions are catching up, others follow but remain behind
Most regions seem to have found a pathway to economic development, showing rapid progress in meeting most targets. Significant progress can be observed in East Asia, where high economic growth rates facilitate rapid development. In addition, Latin America, the Middle East and North Africa have made substantial progress in achieving the MDGs. Although their economic development is projected to be much lower than that of East Asia, these regions started in 1990 with a much higher development level. Finally, Sub-Saharan Africa and South Asia are showing progress on all of the four MDGs, although reaching the targets by 2015 (or even by 2030) appears to be extremely difficult.
Halving poverty and hunger globally just achieved
The world as a whole may just manage to halve poverty and hunger by 2015. This will largely be determined by the enormous progress in China, if the strong economic growth of the last 20 years is maintained. The poverty target could be achieved in most regions, except Sub-Saharan Africa, but the hunger target is more difficult to achieve, and is only met in China. Sub-Saharan Africa will certainly not achieve either of these goals without additional policies and will only come close in 2030 with strong economic growth. However, the results presented are regional averages and developments may be slightly different due to possible changes in future inequalities which have not been taken into account.
Achieving universal primary education is difficult, but trends are promising
While the goal of universal primary education seems difficult to achieve, significant progress has been made over the last few decades. This is especially the case in Sub-Saharan Africa and South Asia, and to a lesser extent also in the Middle East and North Africa. Globally, over 80% of all children now attend school, and this per-centage is projected to increase. If current trends prevail, East Asia and the Pacific, and Latin America and the Caribbean will reach the target by 2015, and the other
Projected developments on four key indicators of the Millennium Development Goals. Source: GISMO1.0
Human development in a long-term perspective 37 Child mortality goal still has a long way to go…
Of the four goals discussed, reducing the under-five mortality rate by two-thirds is the farthest from being achieved (Box 3.4). The only region projected to achieve Projected developments on four key indicators of the Millennium Development Goals. Source: GISMO1.0 Figure 3.8 East Asia and Pacific South Asia Sub-Saharan Africa Middle East and North Africa Latin America and Caribbean 0 10 20 30 40 50 % population Poverty
Millennium Development Goals
East Asia and Pacific South Asia Sub-Saharan Africa Middle East and North Africa Latin America and Caribbean 0 10 20 30 40 50 % population Hunger East Asia and Pacific South Asia Sub-Saharan Africa Middle East and North Africa Latin America and Caribbean
0 40 80 120 160 200 Under-five deaths per thousand births 1990 2000 2015 2030 Child mortality MDG target 2015 East Asia and Pacific South Asia Sub-Saharan Africa Middle East and North Africa Latin America and Caribbean
0 20 40 60 80 100 % children