Published by:
National Institute for Public Health and the Environment
P.O. Box 1 | 3720 BA Bilthoven The Netherlands
Environmental risk limits for
chlorpropham in water
Colofon
© RIVM 2011
Parts of this publication may be reproduced, provided acknowledgement is given to the 'National Institute for Public Health and the Environment', along with the title and year of publication.
J.W. Vonk
C.E. Smit
Contact:
Els Smit
Expertise Centre for Substances
els.smit@rivm.nl
This investigation has been performed by order and for the account of Ministry of Infrastructure and Environment, Sustainable Production Directorate, within the framework of the project "Chemical aspects of WFD"
Abstract
Environmental risk limits for chlorpropham in water
RIVM has derived environmental risk limits (ERLs) for chlorpropham in water. Chlorpropham is used as a herbicide and sprout suppressor. The compound is included in the Dutch decree on water quality objectives in the context of the Water Framework Directive (WFD). The current standard for chlorpropham has to be updated according to the new WFD-methodology. The ERLs in this report are advisory values that serve as a scientific background for the Dutch Steering Committee for Substances, which is responsible for setting those standards. The maximum permissible concentration in water (MPCwater) is the level at which no harmful effects are expected, based on annual average concentrations. This MPC is based on three routes: direct ecotoxicity, secondary poisoning, and consumption of fish by humans. Direct ecotoxicity is the most critical of these three routes and determines the overall MPCwater (4 microgram per litre). The MACeco, water, which protects ecosystems from effects of short term concentration peaks, is 43 microgram per litre. Monitoring data from 2009 and 2010 do not indicate that these levels will be exceeded.
Keywords:
Rapport in het kort
Milieurisicogrenzen voor chloorprofam in water
Het RIVM heeft in opdracht van het ministerie van Infrastructuur en Milieu (I&M), milieurisicogrenzen voor chloorprofam in water bepaald. Chloorprofam is een onkruidbestrijdingsmiddel en wordt ook gebruikt om te voorkomen dat aardappelen voortijdig kiemen. De stof is opgenomen in de Regeling Monitoring Kader Richtlijn Water, waarin staat aan welke eisen oppervlaktewater in
Nederland moet voldoen. De huidige norm voor chloorprofam is niet afgeleid volgens de meest recente methodiek, daarom moeten nieuwe
waterkwaliteitsnormen worden vastgesteld. De Stuurgroep Stoffen stelt deze nieuwe normen vast op basis van de wetenschappelijke advieswaarden in dit rapport.
Het Maximaal Toelaatbaar Risiconiveau (MTR) is de concentratie in water waarbij geen schadelijke effecten te verwachten zijn, gebaseerd op jaargemiddelde concentraties. Hiervoor zijn drie routes onderzocht: directe effecten op waterorganismen, indirecte effecten op vogels en zoogdieren via het eten van prooidieren en indirecte effecten op mensen via het eten van voedsel. De eerste van deze drie levert de laagste waarde en bepaalt daarmee het MTRwater (4 microgram per liter). De Maximaal Aanvaardbare Concentratie (MACeco, water), die het ecosysteem beschermt tegen kortdurende concentratiepieken, is 43
microgram per liter. Op basis van meetgegevens over 2009 en 2010 is er geen aanwijzing dat deze concentraties worden overschreden.
Trefwoorden:
Contents
Summary—9
1 Introduction—11
1.1 Project framework—11
1.2 Current standards for chlorpropham—12
1.3 Methodology—12
1.4 Status of the results—13
2 Information on the substance—15
2.1 Identity—15
2.2 Physico-chemical properties—15
2.3 Fate and behaviour—15
2.4 Bioconcentration and biomagnification—16
3 Human toxicology and ecotoxicological effect data—17
3.1 Human toxicology—17
3.2 Ecotoxicological effect data—17
4 Derivation of ERLs for water—21
4.1 MPCwater and MPCsaltwater—21
4.2 MPCdw, hh – surface water for abstraction of drinking water—23 4.3 MACeco, water and MACeco, saltwater—23
4.4 NCwater and NCsaltwater—23
4.5 SRCeco, water and SRCeco, saltwater—23
5 Conclusions—25 List of abbreviations—29
Annex 1 Detailed BCF data—31
Annex 2 Detailed ecotoxicity data—33 Annex 3 SCOPUS profile—45
Summary
In this report, RIVM presents environmental risk limits (ERL) for chlorpropham in water. Chlorpropham is used as a broad spectrum herbicide and sprout
suppressor. The compound is listed as a specific pollutant in the context of the Water Framework Directive (WFD). The current water quality standard for chronic exposure is 3.3 µg/L. This value dates back to before 2004, and the scientific background is not clear. A maximum acceptable level for peak exposure, which is also required according to the WFD, is not available. Based on the data from the national and European authorisation dossiers and additional information obtained from the open literature, environmental risk limits for chlorpropham in water have been derived that can be used to set updated water quality standards. The methods used are in accordance with the methodology of WFD and INS (International and National environmental quality standards for Substances in the Netherlands).
Five types of ERL are considered, each representing a different protection aim. The Maximum Permissible Concentration (MPC). The MPC represents the
concentration that protects man and environment from adverse effects due to chronic exposure. According to the WFD-methodology, three routes have been taken into account for derivation of the MPC: direct exposure of aquatic organisms, secondary poisoning of predatory birds and mammals, and exposure of humans via fish consumption.
The Maximum Acceptable Concentration for ecosystems (MACeco). The MACeco is the concentration that protects aquatic ecosystems from adverse effects of short-term concentration peaks. The MPC and MACeco are equivalent to the long-term and short-term water quality standards that are indicated as AA-EQS and MAC-EQS in the WFD-guidance. They are derived for both the freshwater and saltwater compartment. The Negligible Concentration (NC). The NC is calculated by applying an
additional factor of 100 to the MPC. The NC represents the concentration at which effects to ecosystems are expected to be negligible and
functional properties of ecosystems are fully safeguarded. In the Dutch policy on substances, the NC is used to define a safety margin that takes combination toxicity into account.
The Serious Risk Concentration for ecosystems (SRCeco). This is the concentration at which serious ecotoxicological risks might occur in aquatic ecosystems.
The Maximum Permissible Concentration in water for drinking water abstraction (MPCdw, hh). The MPCdw, hh represents the concentration at which surface water can be used for production of drinking water without further treatment.
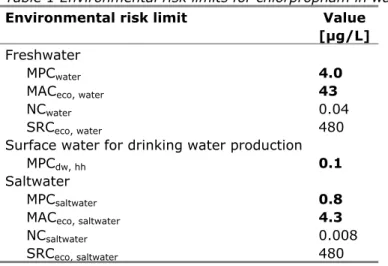
Where applicable, ERLs are derived for freshwater and saltwater. An overview of the newly derived ERLs is presented in Table 1. ERLs that are equivalent to water quality standards required under the WFD are indicated in bold.Based on monitoring data from 2009 and 2010, it is not expected that concentrations in freshwater exceed the newly derived MPC or MAC. Saltwater monitoring data are not available.
Table 1 Environmental risk limits for chlorpropham in water
Environmental risk limit Value [µg/L]
Freshwater
MPCwater 4.0
MACeco, water 43
NCwater 0.04
SRCeco, water 480
Surface water for drinking water production
MPCdw, hh 0.1
Saltwater
MPCsaltwater 0.8
MACeco, saltwater 4.3
NCsaltwater 0.008
1
Introduction
1.1 Project framework
In this report, environmental risk limits (ERLs) for surface water are derived for chlorpropham. Chlorpropham is a herbicide that is considered as a specific pollutant for the Netherlands in the context of the Water Framework Directive (WFD). The compound is listed in the Dutch decree on WFD-monitoring (Regeling monitoring Kaderrichtlijn water). The aim of this report is to present updated risk limits that can be used to set water quality standards in accordance with the WFD. The derivation of the ERLs is performed in the context of the project Chemical aspects of the Water Framework Directive, which is closely related to the project INS (International and national environmental quality standards for substances in the Netherlands). The following ERLs are considered:
- Maximum Permissible Concentration (MPC) – defined in VROM (1999, 2004) as the standard based on scientific data which indicates the concentration in an environmental compartment for which:
1 no effect to be rated as negative is to be expected for ecosystems;
2a no effect to be rated as negative is to be expected for humans (for non-carcinogenic substances);
2b for humans no more than a probability of 10-6 per year of death can be calculated (for carcinogenic substances). Within the scope of the Water Framework Directive (WFD), a probability of 10-6 on a life-time basis is used.
The MPC for water should not result in risks due to secondary poisoning and/or risks for human health aspects. These aspects are therefore also addressed in the MPC derivation. Separate MPC-values are derived for the freshwater and saltwater environment.
- Negligible Concentration (NC) – the concentration in fresh- and saltwater at which effects to ecosystems are expected to be negligible and functional properties of ecosystems are safeguarded fully. It defines a safety margin which should exclude combination toxicity. The NC is derived by dividing the MPC by a factor of 100.
- Maximum Acceptable Concentration (MACeco) for aquatic ecosystems – the concentration protecting aquatic ecosystems from effects due to short-term exposure or concentration peaks. The MACeco is derived for freshwater and saltwater ecosystems.
- Serious Risk Concentration for ecosystems (SRCeco) – the concentration in water at which possibly serious ecotoxicological effects are to be expected. The SRCeco is valid for the freshwater and saltwater compartment.
- Maximum Permissible Concentration for surface water that is used for drinking water abstraction (MPCdw, hh). This is the concentration in surface water that meets the requirements for use of surface water for drinking water production. The MPCdw, hh specifically refers to locations that are used for drinking water abstraction.
The quality standards in the context of the WFD refer to the absence of any impact on community structure of aquatic ecosystems. Hence, not the potential to recover after transient exposure, but long-term undisturbed function is the protection objective under the WFD. Recovery in a test situation, after a limited exposure time, is therefore not included in the derivation of the MPC and MAC.
1.2 Current standards for chlorpropham
The current MPCwater for chlorpropham is 3.3 µg/L. The scientific background of this value is not known, and it is clear that it dates back to 2004 or earlier when the WFD-methodology was not yet adopted.
1.3 Methodology
The methodology for risk limit derivation is described in detail in the INS-guidance document (Van Vlaardingen and Verbruggen, 2007), which is further referred to as the INS-Guidance. The methodology is based on the Technical Guidance Document (TGD), issued by the European Commission and developed in support of the risk assessment of new notified chemical substances, existing substances and biocides (EC, 2003a) and on the Manual for the derivation of Environmental Quality Standards in accordance with the Water Framework Directive (Lepper, 2005). The European guidance under the framework of WFD is currently being revised, the final draft has been approved recently (March, 2011) by the Strategic Coordination Group under the European Water Directors. The risk limits in this report will be used for setting water quality standards that will become effective after the new guidance has come in to force. Therefore, the terminology is harmonised as much as possible and the new guidance is followed in the case it deviates from the INS-guidance. This specifically applies to the treatment of data for freshwater and marine species (see section 4.1.1) and the derivation of the MAC (see section 4.3), for which the new methodology is used (EC, 2011). This also holds for the MPC for surface waters intended for the abstraction of drinking water (MPCdw, hh, see section 4.2). In the
INS-guidance, this is one of the MPCs from which the lowest value should be selected as the general MPCwater (see section 3.1.6 and 3.1.7 of the INS-Guidance). According to the new guidance, the MPCdw, hh is not taken into account for the derivation of the general MPCwater, but specifically refers to locations that are used for drinking water abstraction.
1.3.1 Data sources
The derivation of the ERLs for chlorpropham is based on the data available in the EU-dossier. Data from the Draft Assessment Report (DAR; EC, 2003b) were re-assessed for their reliability in view of the specific use for ERL derivation. Data for formulations were collected at the Ctgb (Dutch Board for Authorisation of Plant Protection Products and Biocides) with permission of the product owners. If evaluated summaries were available, the endpoints were taken from these summaries (Van der Veen, 2008; Hooftman, 2004; CTB, 2004). In a few cases the original study reports were consulted. In addition, an on-line literature search was performed via SCOPUS, available via http://www.scopus.com/. For information on coverage, see http://info.scopus.com/detail/what/. For search profile see Annex 3. This search did result in some additional references from which an endpoint could be derived.
1.3.2 Data evaluation
Ecotoxicity studies were screened for relevant endpoints (i.e. those endpoints that have consequences at the population level of the test species) and thoroughly evaluated with respect to the validity (scientific reliability) of the study. A detailed description of the evaluation procedure is given in section 2.2.2 and 2.3.2 of the INS-Guidance and in the Annex to the draft EQS-guidance under the WFD. In short, the following reliability indices were assigned, based on Klimisch et al. (1997):
Ri 1: Reliable without restriction
’Studies or data … generated according to generally valid and/or internationally accepted testing guidelines (preferably performed according to GLP) or in which the test parameters documented are based on a specific (national) testing guideline … or in which all parameters described are closely related/comparable to a guideline method.’
Ri 2: Reliable with restrictions
’Studies or data … (mostly not performed according to GLP), in which the test parameters documented do not totally comply with the specific testing guideline, but are sufficient to accept the data or in which investigations are described which cannot be subsumed under a testing guideline, but which are nevertheless well documented and scientifically acceptable.’
Ri 3: Not reliable
’Studies or data … in which there are interferences between the measuring system and the test substance or in which organisms/test systems were used which are not relevant in relation to the exposure (e.g., unphysiologic pathways of application) or which were carried out or generated according to a method which is not acceptable, the documentation of which is not sufficient for an assessment and which is not convincing for an expert judgment.’
Ri 4: Not assignable
’Studies or data … which do not give sufficient experimental details and which are only listed in short abstracts or secondary literature (books, reviews, etc.).’ Citations
In case of (self-)citations, the original (or first cited) value is considered for further assessment, and an asterisk is added to the Ri of the endpoint that is cited.
All available studies are summarised in data-tables, that are included as Annexes to this report. These tables contain information on species
characteristics, test conditions and endpoints. Explanatory notes are included with respect to the assignment of the reliability indices.
1.4 Status of the results
The results presented in this report have been discussed by the members of the scientific advisory group for the INS-project (WK-INS). It should be noted that the ERLs in this report are scientifically derived values, based on
(eco)toxicological, fate and physico-chemical data. They serve as advisory values for the Dutch Steering Committee for Substances, which is appointed to set the Environmental Quality Standards (EQSs). ERLs should thus be
2
Information on the substance
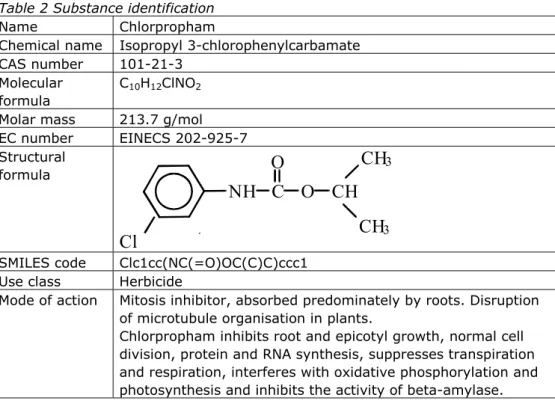
2.1 Identity
Table 2 Substance identification
Name Chlorpropham
Chemical name Isopropyl 3-chlorophenylcarbamate CAS number 101-21-3
Molecular formula
C10H12ClNO2 Molar mass 213.7 g/mol
EC number EINECS 202-925-7 Structural formula
NH C O
O
CH
C l
CH
3CH
3 SMILES code Clc1cc(NC(=O)OC(C)C)ccc1Use class Herbicide
Mode of action Mitosis inhibitor, absorbed predominately by roots. Disruption of microtubule organisation in plants.
Chlorpropham inhibits root and epicotyl growth, normal cell division, protein and RNA synthesis, suppresses transpiration and respiration, interferes with oxidative phosphorylation and photosynthesis and inhibits the activity of beta-amylase.
2.2 Physico-chemical properties
Table 3 Physico-chemical properties
Parameter Unit Value Remark Reference
Water solubility [mg/L] 110 pH 7, 20 °C EC, 2003b
pKa - No dissociation occurs
in water
EC, 2003b
log Kow 3.76 pH 7, 20 °C EC, 2003b
3.51 Cited in EPIWIN Hansch et al., 1995
Vapour pressure [Pa] 2.4 × 10⁻²
20 °C EC, 2003b
Henry’s law constant
[Pa.m3/mol] 0.047 20 °C EC, 2003b
Melting point [°C] 36-49 EC, 2003b
Boiling point [°C] 256-458 EC, 2003b
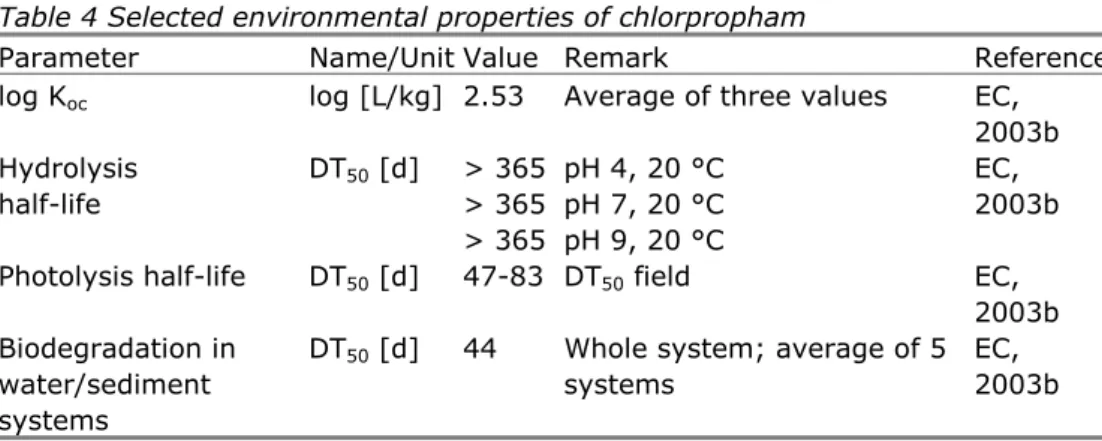
2.3 Fate and behaviour
Table 4 Selected environmental properties of chlorpropham
Parameter Name/Unit Value Remark Reference
log Koc log [L/kg] 2.53 Average of three values EC, 2003b Hydrolysis half-life DT50 [d] > 365 > 365 > 365 pH 4, 20 °C pH 7, 20 °C pH 9, 20 °C EC, 2003b Photolysis half-life DT50 [d] 47-83 DT50 field EC,
2003b Biodegradation in
water/sediment systems
DT50 [d] 44 Whole system; average of 5 systems
EC, 2003b
2.4 Bioconcentration and biomagnification
Based on experimental data, the BCF for fish is 144 L/kg (see Annex 1, Table A1.1). Since the trigger for bioconcentration and biomagnification is exceeded (BCF ≥ 100 L/kg), an MPC for secondary poisoning has to be derived. The MPCsp, water and MPCsp, saltwater for secondary poisoning are derived in Section 4.1.3.
3
Human toxicology and ecotoxicological effect data
3.1 Human toxicology
3.1.1 Human toxicological threshold limits and carcinogenicity
Chlorpropham is assigned: R40 (carcinogen category 3), R48/R22 (ESIS, date of search January 2011). According to the triggers as given in Table 17 of the INS-Guidance, the MPChh food, water should be derived. The ADI is 0.05 mg/kg bw/d, based on the NOAEL of 5 mg/kg bw/d from a 60-week study with dogs and an assessment factor of 100. (List of Endpoints, DAR; EC, 2003b).
3.2 Ecotoxicological effect data
3.2.1 Laboratory data
Detailed aquatic toxicity data for chlorpropham are tabulated in Annex 2. Unbound values are not used in ERL derivation, unless they indicate that the derived value is not protective and consequently the assessment factor should be adapted. The selected valid acute and chronic ecotoxicity data for freshwater organisms are summarised in Tables 5 and 6, data for marine species are presented in Table 7. Organisms are considered marine species if they are representative for marine and brackish water environments and are tested in water with salinity > 0.5 ‰.
It should be noted that in some studies, analytical verification of test
concentration was not performed. At the time the DAR was prepared, this aspect was generally paid less attention to than nowadays. Chlorpropham has a log Kow of > 3, and Henry’s constant is relatively high. This means that problems in maintenance of test concentrations due to sorption and/or volatilisation could be an issue. In some cases where concentrations were measured, there was a decline in concentrations during the test, in other studies concentrations remained constant. The lowest endpoints all refer to nominal concentrations since for those studies no measured concentrations were available, and for that reason they are considered less reliable. Considering all data there was no clear indication that actual concentrations deviate strongly from nominal and it was decided to take these values into account for derivation of risk limits.
Furthermore, it can be argued that when actual concentrations had been
measured, the endpoints might have even been lower. Leaving these studies out of consideration might lead to risk limits that are under-protective.
3.2.2 Field data
Chlamydomonas eugametos
0.43 Cell density Hess, 1980
Desmodesmus subspicatus
3.04 Growth rate Vryenhoef and Mullee, 2009
Navicula pelliculosa 1.65 Growth rate EC, 2003b
Pseudokirchneriella subcapitata
1.65 Geometric mean of 3.3, 1.9, 2.14, 0.90, 1.8, 1.36, 1.13 mg/L (growth rate)
EC, 2003b; Van der Veen, 2008; Hooftman, 2004; CTB, 2004; L’haridon, 2003c; Kuhl and Wydra, 2009b
Macrophytaa
Lemna minor 3.46 Geometric mean of 3.82 and 3.14 mg/L (growth rate)
EC, 2003b Crustacea
Daphnia magna 2.25 Geometric mean of 4.0, 3.7, 8.4, 2.6, 2.3, 4.3, 3.59, 0.47, 2.5, 0.98, 3.51, 0.37 (immobilisation)
EC, 2003b; Van der Veen, 2008; Hooftman, 2004; CTB, 2004; L’Haridon, 2003a; Priestly and Mullee, 2010b; Kuhl and Wydra, 2009a
Pisces
Cyprinus carpio 4.89 Geometric mean of 5.3, 9.2, 2.4 mg/L (mortality) EC, 2003b; Hooftman, 2004
Danio rerio 13.4 Mortality
Lepomis macrochirus 12 Mortality
Micropterus salmoides 10 Mortality
Oncorhynchus mykiss 5.95 Geometric mean of 7.5, 3.91, 6.2, 9.0, 5.92, 4.56 mg/L (mortality)
EC, 2003b; Van der Veen, 2008; L’Haridon, 2003b; Priestly and Mullee, 2010a
Salvelinus fontinalis 8.8 Mortality EC, 2003b
Amphibia
Pleurodeles waltlii 20 Mortality Caporiccio et al., 1981
Triturus helveticus 6.5 Mortality Caporiccio et al., 1981
Xenopus laevis 8.5 Mortality Caporiccio et al., 1981
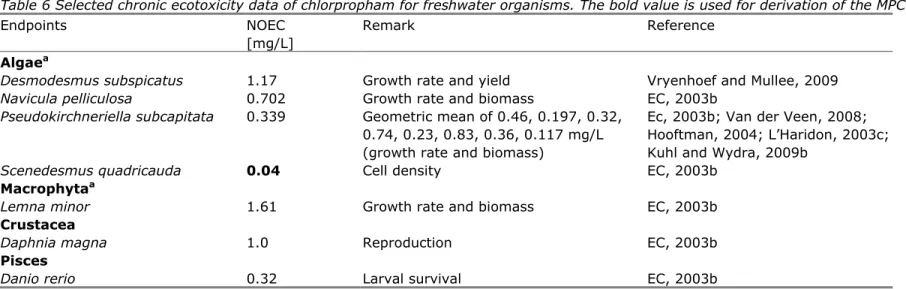
Desmodesmus subspicatus 1.17 Growth rate and yield Vryenhoef and Mullee, 2009
Navicula pelliculosa 0.702 Growth rate and biomass EC, 2003b
Pseudokirchneriella subcapitata 0.339 Geometric mean of 0.46, 0.197, 0.32, 0.74, 0.23, 0.83, 0.36, 0.117 mg/L (growth rate and biomass)
Ec, 2003b; Van der Veen, 2008; Hooftman, 2004; L’Haridon, 2003c; Kuhl and Wydra, 2009b
Scenedesmus quadricauda 0.04 Cell density EC, 2003b
Macrophytaa
Lemna minor 1.61 Growth rate and biomass EC, 2003b
Crustacea
Daphnia magna 1.0 Reproduction EC, 2003b
Pisces
Danio rerio 0.32 Larval survival EC, 2003b
a For studies with algae and Lemna endpoints based on growth rate are preferred over endpoints based on biomass.
Table 7 Selected chronic ecotoxicity data of chlorpropham for marine species. Endpoints NOEC
[mg/L]
Remark Reference Echinodermata
4
Derivation of ERLs for water
4.1 MPCwater and MPCsaltwater
4.1.1 Treatment of data for freshwater and marine species
According to the new WFD-guidance, statistical testing should be performed to detect whether there are differences in sensitivity between the freshwater and marine species. Where a lack of data makes a statistical analysis unworkable, the datasets for organic substances should be pooled. This is the case for chlorpropham, where the marine dataset contains only one endpoint. The combined dataset is used for risk limit derivation.
4.1.2 MPCeco, water and MPCeco, saltwater – ecotoxicity data
NOECs are available for eight species from five taxonomic groups covering at least three trophic levels1. The MPC
eco, water is derived by putting an assessment factor of 10 to the lowest NOEC based on growth rate of 0.04 mg/L for the alga Scenedesmus quadricauda, resulting in an MPCeco, water of 0.004 mg/L = 4 µg/L. The MPCeco, saltwater is derived on the basis of the same dataset. In addition to the data for freshwater species, there is one NOEC from a specifically marine taxonomic group (Echinodermata; NOEC 0.124 mg/L). In this case an assessment factor of 50 is applied to the lowest NOEC, resulting in an MPCeco, saltwater of 0.0008 mg/L = 0.8 µg/L.
4.1.3 MPCsp, water and MPCsp, saltwater – secondary poisoning
Since the BCF value is 144 L/kg, the criterion of BCF ≥ 100 L/kg is fulfilled and the MPC via secondary poisoning is derived. Detailed toxicity data for birds and mammals are presented in Annex 2, Table A2.4. All data originate from the DAR (EC, 2003b). The data on birds cannot be used, since no effects were observed at the highest concentration tested. With respect to the mammal studies, it should be noted that a number of endpoints in Table A2.4 refer to parameters such as changes in haematology or organ weights. The link of these endpoints to population level effects is not clear, according to the guidance relevant
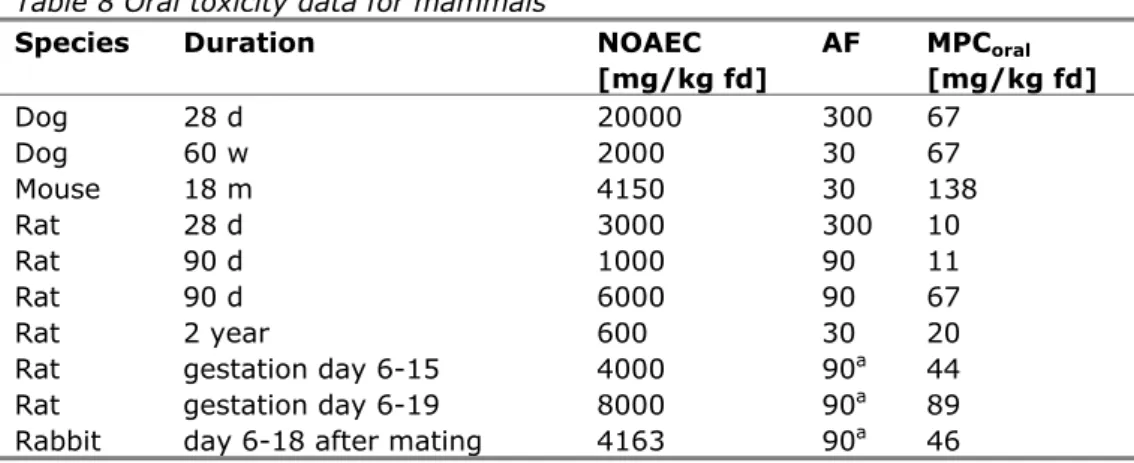
endpoints are mortality, growth and effects on reproduction. Those endpoints are listed in Table 8 below.
1 For a decision on the height of the assessment factor, the WFD-guidance often refers to the number of trophic
levels represented in the dataset. Especially for compounds with a specific mode of action, the use of this term may be complicating because species belonging to the same trophic level may differ greatly in sensitivity because of their different taxonomic position (e.g. crustaceans and insects in case of certain insecticides). When deciding on the AF, the question whether or not the potentially most sensitive taxonomic group is represented in the dataset is more relevant than the trophic level.
Table 8 Oral toxicity data for mammals
Species Duration NOAEC
[mg/kg fd] AF MPCoral [mg/kg fd] Dog 28 d 20000 300 67 Dog 60 w 2000 30 67 Mouse 18 m 4150 30 138 Rat 28 d 3000 300 10 Rat 90 d 1000 90 11 Rat 90 d 6000 90 67 Rat 2 year 600 30 20
Rat gestation day 6-15 4000 90a 44
Rat gestation day 6-19 8000 90a 89
Rabbit day 6-18 after mating 4163 90a 46
a: although involving short-term exposure, an assessment factor of 90 is used because the compound is administered during a critical phase in embryonic development
For rats, the NOAEC values from the 90-days studies (1000 and 6000 mg/kg fd) are higher than the NOAEC from the 2 year study (600 mg/kg fd), but the larger assessment factor for the 90-days studies leads to a lower MPCoral in one case. In such a situation, preference is given to the study with the longest test duration and the lowest assessment factor. The MPCoral,min is therefore set to 20 mg/kg fd.
The MPCsp, water and MPCsp, saltwater are derived as follows:
The MPCoral, min is 20 mg/kg fd.
The BCF value for water organisms is 144 L/kg. The BMF1 is 1 (INS-Guidance Table 12).
Combining this input and using the default parameters as given in the INS-Guidance, the MPCsp, water is 20/ (144 x 1) = 0.14 mg/L = 140 µg/L (Eq. 13 of the INS-Guidance).
The MPCoral,min as described above is used as a representative for the marine environment also. To account for the longer food chain in the marineenvironment, an additional biomagnification step is introduced (BMF2). Since this factor is the same as the BMF1 (= 1), the MPCsp, saltwater is equal to
MPCsp, water = 0.14 mg/L = 140 µg/L. It is not expected that chlorpropham will accumulate in the pelagic food chain.
4.1.4 MPChh food, water – human exposure
Chlorpropham is assigned R40, R48/22. According to the triggers as given in Table 17 of the INS-Guidance, the MPChh food, water should be derived. The
MPChh, food is calculated from the ADI (0.05 mg/kg bw/d), a body weight of 70 kg and a daily fish consumption of 115 g and a maximum contribution of fish consumption to the ADI of 10%. The resulting MPChh, food is 0.1 x 0.05 x 70 / 0.115 = 3.04 mg/kg fd. (see Eq. 15 of the INS-Guidance). Subsequently the MPChh food,water is calculated using the BCF of 144 L/kg and BMF of 1 as 3.04 / (144 x 1) = 0.0211 mg/L = 21.1 µg/L (Eq. 16 of the INS-Guidance). The MPChh food, water is valid for both the freshwater and the marine compartment. 4.1.5 Selection of the MPCwater and MPCsaltwater
The lowest of the three routes – direct ecotoxicity, secondary poisoning and human exposure via fish – is selected as the final MPC. For freshwater as well as the marine environment, direct ecotoxicity is the most critical route. The
4.2 MPCdw, hh – surface water for abstraction of drinking water
Chlorpropham is an organic pesticide. The drinking water standard according to Directive 98/83/EC is 0.1 µg/L. According to the WFD-guidance, a substance specific removal rate should be considered to derive the MPCdw, hh. At present, such information is not available and water treatment is not taken into account. The MPCdw, hh is 0.1 µg/L.
4.3 MACeco, water and MACeco, saltwater
L(E)C50 values are available for 16 species from six taxonomic groups including three trophic levels. The MACeco, water is derived from the lowest acute toxicity value available: the EC50 of 0.43 mg/L for Chlamydomonas eugametos. An assessment factor of 10 can be applied, because the substance has a known mode of action with a broad spectrum of toxic action and thus representatives of the most sensitive taxonomic groups are included in the dataset. The MACeco,water is 0.043 mg/L = 43 µg/L.
For indicative purposes, the derivation of a MACeco,water via Species Sensitivity Distribution (SSD) was also investigated, although the dataset does not meet the criteria that are specified in the guidance. The number of taxa is lower than the minimum of eight that is required, and insects are not represented in the dataset. However, in view of the mode of toxic action insects are not expected to be particularly sensitive or insensitive. The LC50 for Tubifex tubifex was included in the data, although we are not sure whether testing was performed in water. Tetrahymena was also included, although the test was carried out in complex medium. The SSD with ETX had an accepted fit and using an assessment factor of 10, the resulting MACeco,water was 73 µg/L. Although the dataset does not fulfil the requirements for ERL-derivation by means of an SSD, the outcome of this exercise supports the MACeco,water derived by the assessment factor method.
The MACeco, saltwater is derived on the basis of the combined dataset. Since there are no acute data from specific marine taxa, an assessment factor of 100 is applied to the lowest EC50. This results in an MPCeco, saltwater of 0.0043 mg/L = 4.3 µg/L.
4.4 NCwater and NCsaltwater
The NCwater is calculated by dividing the MPCwater by a factor of 100. The NCwater is 0.04 µg/L.
The NCsaltwater is calculated by dividing the MPCsaltwater by a factor of 100. The NCsaltwater is 0.008 µg/L.
4.5 SRCeco, water and SRCeco, saltwater
Since more than three long-term NOECs of all required trophic levels are available, the SRCeco, water is derived from the geometric mean of all available NOECs with an assessment factor of 1. The geometric mean is 0.48 mg/L. Therefore, the SRCeco, water is 0.48 mg/L = 480 µg/L. This value is also valid as SRCeco, saltwater.
5
Conclusions
Based on the available information, environmental risk limits (ERLs) for chlorpropham in freshwater and saltwater are derived according to the
methodology of the WFD and INS. An overview of the derived ERLs is presented in the table below. ERLs that are equivalent to water quality standards required under the WFD are indicated in bold.
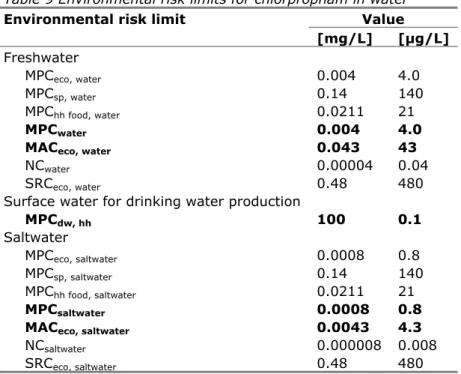
Table 9 Environmental risk limits for chlorpropham in water
Environmental risk limit Value
[mg/L] [µg/L] Freshwater MPCeco, water 0.004 4.0 MPCsp, water 0.14 140 MPChh food, water 0.0211 21 MPCwater 0.004 4.0
MACeco, water 0.043 43
NCwater 0.00004 0.04
SRCeco, water 0.48 480
Surface water for drinking water production
MPCdw, hh 100 0.1 Saltwater MPCeco, saltwater 0.0008 0.8 MPCsp, saltwater 0.14 140 MPChh food, saltwater 0.0211 21 MPCsaltwater 0.0008 0.8
MACeco, saltwater 0.0043 4.3
NCsaltwater 0.000008 0.008
SRCeco, saltwater 0.48 480
The Association of River Waterworks (RIWA) reports monitoring data for the rivers Rhine and Meuse. In 2009, chlorpropham was not detected on any
location above the reporting limit (0.01 - 0.02 µg/L), except for Liege, where the monthly average in June was 0.031 µg/L (RIWA, 2009ab). In 2010,
chlorpropham was not detected above the reporting limit at monitoring stations along the river Rhine (RIWA, 2010). According to the Bestrijdingsmiddelenatlas (www.bestrijdingsmiddelenatlas.nl), the average concentration of chlorpropham has declined from about 15 ng/L in 2001 to around 10 ng/L in 2009. In addition, there are no locations where the 90th percentile of the monitoring data exceeds the standard of 3.3 µg/L. The newly derived MPCwater is slightly higher, and will be compared with the average concentration. The available data thus indicate that the newly derived MPC and MAC for freshwater will not be exceeded. Monitoring data for saltwater are not available.
References
Reference list includes references used in the Annexes.
Bamdad M, Denier D, Bohatier J, Golière, C-A. 2000. Toxicity of the herbicide chlorpropham towards the freshwater ciliated protozoan Tetrahymena pyriformis GL. European Journal of Protistology 36: 319-325.
Caporiccio B, Tournamille J, Michel R. 1981. Etude de la toxicité aiguë de deux phénylcarbamates: le propham et le chloropropham. Comptes Rendus des Séances de la Société de Biologie 175: 496-500.
CTB. 2004. Internal summaries Gro-Stop 300 UL (dossier 3541).
Davis TD, Hardcastle WS. 1959. Biological assay of herbicides for fish toxicity. Weeds 7: 397-404.
EC. 2003a. Technical Guidance Document on risk assessment in support of Commission Directive 93/67/EEC on risk assessment for new notified substances, Commission Regulation (EC), no. 1488/94 on risk assessment for existing substances and Directive 98/8/EC of the European Parliament and of the Council concerning the placing of biocidal products on the market. Ispra, Italy: European Commission Joint Research Centre.
EC. 2003b. European Commission. Draft Assessment Report Chlorpropham. Vol B3, Sections B5 and B9.
EC. 2011. Technical guidance for deriving environmental quality standards. Final draft, January, 2011.
El-Dib MA, Aly OA. 1976. Persistence of some phenylamide pesticides in the aquatic environment - III. Biological degradation. Water Research 10: 1055-1059.
Grimwood M, Murgatroyd C, Smith C. 1995. Proposed environmental quality standards for chlorpropham in water. Final report to the Department of the Environment. DoE 3841/1.
Hess FD. 1980. A Chlamydomonas algal bioassay for detecting growth inhibitor herbicides. Weed Science 28: 515-520.
Hansch C, Leo A, Hoekman D. 1995. Exploring QSAR. Hydrophobic, electronic, and steric constants. ACS Professional Reference Book. Washington DC: ACS.
Holy J. 1998. Chlorpropham [isopropyl N-(3-chlorophenyl)carbamate] disrupts microtubule organization, cell division, and early development of sea urchin embryos. Journal of Toxicology and Environmental Health, Part A 54: 319-333.
Hooftman, RN. 2004. Chorpropham. TNO report CTB-2004-001-C (submitted to CTB).
Klimisch HJ, Andreae M, Tillman U. 1997. A systematic approach for evaluating the quality of experimental toxicological and ecotoxicological data.
Regulatory Toxicology and Pharmacology. 25: 1-5.
Kosanke GJ, Schwippert WW, Beneke TW. 1988. The impairment of mobility and development in freshwater snails (Physa fontinalis and Lymnea stagnalis) caused by herbicides. Comp. Biochemistry and Physiology 2: 373-379. Kuhl R, Wydra V. 2009a. Acute toxicity of Chlorpropham 120 g/L EW to Daphnia
magna in a static 48-hour immobilisation test. IBACON project 51222220. Kuhl R, Wydra V. 2009b. Toxicity of Chlorpropham 120 g/L EW to
Pseudokirchneriella subcapitata in an algal growth inhibition test. IBACON project 51221210.
L’Haridon J. 2003a. Acute toxicity in Daphnia magna under static conditions. CIT Project no. 24302 EAD.
L’Haridon J. 2003b. Acute toxicity in the rainbow trout under static conditions. CIT Project no. 24303 EAP.
L’Haridon J. 2003c. Algal inhibition test. CIT Project no. 24301 EAA. Lepper F. 2005. Manual on the Methodological Framework to Derive
Environmental Quality Standards for Priority Substances in accordance with Article 16 of the Water Framework Directive (2000/60/EC). Schmallenberg, Germany: Fraunhofer-Institute Molecular Biology and Applied Ecology. 47 pp.
Maule A, Wright SJL. 1983. Physiological effects of chlorpropham and 3-chloroaniline on some cyanobacteria and a green alga. Pesticide Biochemistry and Physiology 19: 196-202.
Nishiuchi Y. 1974. Control effect of pesticides to duckweed. Bulletin of the Agricultural Chemicals Inspectorate 14: 69-72.
Priestly SL, Mullee DM. 2010a. CIPC 120 G/L AL: Acute toxicity to rainbow trout (Oncorhynchus mykiss). Harlan Laboratories Ltd, project no. 0722/0112. Priestly SL, Mullee DM. 2010b. CIPC 120 G/L AL: Acute toxicity to Daphnia
magna. Harlan Laboratories Ltd, project no. 0722/10110.
RIWA. 2009a. Jaarrapport 2009. de Rijn. Nieuwegein, the Netherlands: Association of River Waterworks.
RIWA. 2009b. Meetgegevens Maas. http://www.riwa-maas.org/nl/kwaliteitsgegevens_hist_kwgegevens.php
RIWA. 2010. Jaarrapport 2010. de Rijn. Nieuwegein, the Netherlands: Association of River Waterworks.
Sumida S, Yoshida R, Ueda M. 1977. Studies of pesticide effects on Chlorella metabolism III. Effect of isopropyl 3-chlorocarbanilate (chlorpropham) on cell cycle and biosynthesis. Plant and Cell Physiology 18: 9-16.
Van der Veen MC. 2008. Chloorprofam. RIVM Report 11593A01 (submitted to Ctgb).
Van Vlaardingen PLA, Verbruggen EMJ. 2007. Guidance for the derivation of environmental risk limits within the framework of "International and national environmental quality standards for substances in the Netherlands" (INS). Bilthoven, the Netherlands: RIVM. Report no. 601782001. 146 pp. VROM. 1999. Environmental risk limits in the Netherlands. A review of
environmental quality standards and their policy framework in the Netherlands. The Hague, the Netherlands: Ministry of Housing, Spatial Planning and the Environment.
VROM. 2004. (Inter)nationale Normen Stoffen. Den Haag, the Netherlands: Ministerie van Volkshuisvesting, Ruimtelijke Ordening en Milieubeheer. Vryenhoef H, Mullee DM. 2009. CIPC 120 G/L AL: Algal growth inhibition test.
List of abbreviations
ADI Acceptable Daily Intake
BCF Bioconcentration Factor
BMF Biomagnification Factor
ECx Concentration at which x% effect is observed
ERL Environmental Risk Limit
INS International and National Environmental Quality Standards for Substances in the Netherlands
LC50 Concentration at which 50% mortality is observed MACeco Maximum Acceptable Concentration for ecosystems MACeco, water Maximum Acceptable Concentration for ecosystems in
freshwater
MACeco, saltwater Maximum Acceptable Concentration for ecosystems in the saltwater compartment
Marine species
Species that are representative for marine and brackish water environments and that are tested in water with salinity > 0.5 ‰.
MPC Maximum Permissible Concentration
MPCwater Maximum Permissible Concentration in freshwater MPCsaltwater Maximum Permissible Concentration in the saltwater
compartment
MPCeco, water Maximum Permissible Concentration in freshwater based on ecotoxicological data
MPCeco, saltwater Maximum Permissible Concentration in the saltwater compartment based on ecotoxicological data
MPCsp, water Maximum Permissible Concentration in freshwater based on secondary poisoning
MPCsp, saltwater Maximum Permissible Concentration in the saltwater compartment based on secondary poisoning
MPChh food, water Maximum Permissible Concentration in freshwater and saltwater based on consumption of fish and shellfish by humans
MPCdw, hh Maximum Permissible Concentration in water used for abstraction of drinking water
NC Negligible Concentration
NCwater Negligible Concentration in freshwater NOEC No Observed Effect Concentration
NOAEC No Observed Adverse Effect Concentration NOAEL No Observed Adverse Effect Level
SRCeco Serious Risk Concentration for ecosystems
SRCeco, water Serious risk concentration for freshwater and saltwater ecosystems
TGD Technical Guidance Document
Legend to column headings
Purity refers to purity of active substance or content of active in formulation; ag = analytical grade Test type S = static; Sc = static closed; R = renewal; F = flow through; CF = continuous flow; IF =
intermittent flow system
Test water am = artificial medium; dtw = dechlorinated tap water; dw = deionised/dechlorinated/distilled water; nw= natural water; rw = reconstituted water; rtw = reconstituted tap water; tw = tap water
T temperature
Ri Reliability index according to Klimisch et al. (1997); asterisk indicates citation
Table A1.1. Bioconcentration factors for chlorpropham
Species Species properties Purity Analysis Test type Test water pH Hardness CaCO3
T Exp.
time Exp. conc. BCF (based on chlorpropham) BCF type Method Ri Notes Ref.
[%] [mg/L] [°C] [mg/L] [L/kg ww]
Pisces
Oncorhynchus mykiss 1.5- 2.5 g, 4-6 cm >97 LSC;
chlorpropham F tw 60 d 0.005 133 whole fish kinetics 2 1,2,3,4,5,6 EC, 2003b (Caldwell, 2001)
Oncorhynchus mykiss 1.5- 2.5 g, 4-6 cm >97 LSC;
chlorpropham F tw 60 d 0.050 154 whole fish kinetics 2 1,2,3,4,5,6 EC, 2003b (Caldwell, 2001)
Notes
1 U-14C label in the phenyl ring.
2 Depuration time 14 days. 3 According to OECD guidance.
4 The water temperature, hardness and pH were not reported in the summary in the DAR.
5 The BCF values for whole fish based on total radioactivity were: 5 µg/L: 192 L/kg ww and 50 µg/L: 195 L/kg ww. 6 The lipid content of the fish was approx. 5.5%. Therefore no correction for lipid content on the BCF was carried out.
Legend to column headings
A test water analysed Y(es)/N(o)
Test type S = static; Sc = static closed; R = renewal; F = flow through; CF = continuous flow; IF = intermittent flow system
Purity refers to purity of active substance or content of active in formulation; ag = analytical grade Test water am = artificial medium; dtw = dechlorinated tap water; dw = deionised/dechlorinated/distilled
water; nw= natural water; rw = reconstituted water; rtw = reconstituted tap water; tw = tap water
T temperature
Ri Reliability index according to Klimisch et al. (1997); asterisk indicates citation
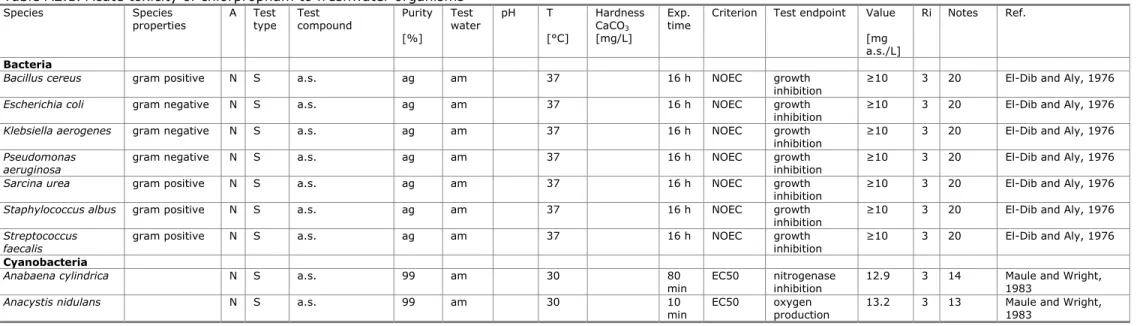
Table A2.1. Acute toxicity of chlorpropham to freshwater organisms
Species Species
properties A Test type Test compound Purity Test water pH T Hardness CaCO3
Exp.
time Criterion Test endpoint Value Ri Notes Ref.
[%] [°C] [mg/L] [mg
a.s./L] Bacteria
Bacillus cereus gram positive N S a.s. ag am 37 16 h NOEC growth
inhibition ≥10 3 20 El-Dib and Aly, 1976
Escherichia coli gram negative N S a.s. ag am 37 16 h NOEC growth
inhibition ≥10 3 20 El-Dib and Aly, 1976
Klebsiella aerogenes gram negative N S a.s. ag am 37 16 h NOEC growth
inhibition ≥10 3 20 El-Dib and Aly, 1976
Pseudomonas
aeruginosa gram negative N S a.s. ag am 37 16 h NOEC growth inhibition ≥10 3 20 El-Dib and Aly, 1976
Sarcina urea gram positive N S a.s. ag am 37 16 h NOEC growth
inhibition ≥10 3 20 El-Dib and Aly, 1976
Staphylococcus albus gram positive N S a.s. ag am 37 16 h NOEC growth
inhibition ≥10 3 20 El-Dib and Aly, 1976
Streptococcus
faecalis gram positive N S a.s. ag am 37 16 h NOEC growth inhibition ≥10 3 20 El-Dib and Aly, 1976
Cyanobacteria
Anabaena cylindrica N S a.s. 99 am 30 80
min EC50 nitrogenase inhibition 12.9 3 14 Maule and Wright, 1983
Anacystis nidulans N S a.s. 99 am 30 10
properties type compound water CaCO3 time
[%] [°C] [mg/L] [mg
a.s./L] Algae
Chlamydomonas
reinhardii N S a.s. 99 am 25 10 min EC50 oxygen production 30.5 3 13 Maule and Wright, 1983
Chlamydomonas
eugametos 10
5 cells/mL N S a.s tg am 6.7 25 48 h EC50 cell density 0.43 2 1, 22 Hess, 1980
Chlorella ellipsoidea N S a.s. am 24 6 d EC50 growth rate 0.50 3 21 Sumida et al., 1977
Desmodesmus
subspicatus 5 x 10
4
cells/mL N S Chlorpropham 1% DP 1.0 am 23 2 ± 243 72 h EC50 growth rate >1.0 4 16,19 Van der Veen, 2008 (Rudolf, 2005) Desmodesmus
subspicatus 5 x 10
4
cells/mL N S Chlorpropham 1% DP 1.0 am 23 2 ± 243 72 h EC50 biomass (AUGC)* >1.0 4 16,19 Van der Veen, 2008 (Rudolf, 2005) Desmodesmus
subspicatus 6.2 x 10
3
cells/mL Y S Chlorpropham 1% DP 1.0 am 8.8-9.4 23 ± 2 243 72 h EC50 growth rate 2.1 4 4,17,19 Van der Veen, 2008 (Rudolf, 2005) Desmodesmus
subspicatus 6.2 x 10
3
cells/mL Y S Chlorpropham 1% DP 1.0 am 8.8-9.4 23 ± 2 243 72 h EC50 biomass (AUGC)* 0.77 4 4,17,19 Van der Veen, 2008 (Rudolf, 2005) Desmodesmus
subspicatus 4.4 x 10
3
cells/mL Y S CIPC 120 G/L AL 11.7 am 7.1-7.3 24 ± 1 - 72 h EC50 growth rate 3.04 2 1,4 Vryenhoef Mullee, 2009 and Desmodesmus
subspicatus 4.4 x 10
3
cells/mL Y S CIPC 120 G/L AL 11.7 am 7.1-7.3 24 ± 1 - 72 h EC50 yield 2.34 2 1,4 Vryenhoef and Mullee, 2009
Navicula pelliculosa 1 x 10⁴
cells/mL Y S a.s. 98.8 am 7.3-7.5 23 ± 2 - 96 h EC50 growth rate 1.65 2 4,7 EC, 2003b (Firth, 2001)
Navicula pelliculosa 1 x 10⁴
cells/mL Y S a.s. 98.8 am 7.3-7.5 23 ± 2 - 96 h EC50 biomass (AUGC)* 1.00 2 4,7 EC, (Firth, 2001) 2003b
Pseudokirchneriella
subcapitata N S a.s. 99.3 am 8.0-8.8 22.5 - 96 h EC50 growth rate 3.3 2 3,4 EC, 2003b (Hanstveit, 1989)
Pseudokirchneriella
subcapitata 1 x 10
4
cells/mL Y S Chlor-IPC EC 400 40 am 7.0-8.1 23 ± 2 - 96 h EC50 biomass (AUGC)* 1.1 2 2,4,6 EC, (Migchielsen, 2001) 2003b Pseudokirchneriella
subcapitata 1 x 10
4
cells/mL Y S Chlor-IPC EC 400 40 am 7.0-8.1 23 ± 2 - 96 h EC50 growth rate 1.9 2 2,4,6 EC, 2003b (Migchielsen, 2001) Pseudokirchneriella
subcapitata 1 x 10
4
cells/mL Y S Chlorproham 400 G/L EC 40.6 am 7.5 ± 0.3
23 34 72 h EC50 growth rate 2.14 2 6,4 Van der Veen, 2008
(L’Haridon, 2005) Pseudokirchneriella subcapitata 1 x 10 4 cells/mL Y S Chlorproham 400 G/L EC 40.6 am 7.5 ± 0.3 23 34 72 h EC50 biomass
(AUGC)* 0.869 2 6,4 Van der Veen, 2008 (L’Haridon, 2005) Pseudokirchneriella
subcapitata 1 x 10
4
cells/mL Y S GRO-STOP HN 300 31.2 am 7.8-8.2 23 24 72 h EC50 growth rate >1.1 2 4,7 Van der Veen, 2008 (Bogers and Van der Waard, 1996)
properties type compound water CaCO3 time [%] [°C] [mg/L] [mg a.s./L] Pseudokirchneriella subcapitata 1 x 10 4
cells/mL Y S GRO-STOP HN 300 31.2 am 7.8-8.2 23 24 72 h EC50 biomass (AUGC)* >1.1 2 4,7 Van der Veen, 2008 (Bogers and Van der Waard, 1996) Pseudokirchneriella
subcapitata 1 x 10
4
cells/mL Y S GRO-STOP (300) EC 31.2 am 8.1-8.3 21-23 24 72 h EC50 growth rate >1.4 2 4,7 Van der Veen, 2008 (Bogers and Van der Waard, 1996) Pseudokirchneriella
subcapitata 1 x 10
4
cells/mL Y S GRO-STOP (300) EC 31.2 am 8.1-8.3 21-23 24 72 h EC50 biomass (AUGC)* >1.4 2 4,7 Van der Veen, 2008 (Bogers and Van der Waard, 1996) Pseudokirchneriella
subcapitata 1 x 10
4
cells/mL Y S GRO-STOP EW 120 11.8 am 7.7-9.0 21.5-23 - 72 h EC50 growth rate 0.90 2 6,4 Hooftman, (Migchielsen, 2002) 2004 Pseudokirchneriella
subcapitata 1 x 10
4
cells/mL Y S GRO-STOP EW 120 11.8 am 7.7-9.0 21.5-23 - 72 h EC50 biomass (AUGC)* 0.49 2 6,4 Hooftman, (Migchielsen, 2002) 2004 Pseudokirchneriella
subcapitata 1 x 10
4
cells/mL Y S Gro-Stop Innovator (300 UL)
32.4 am
7.7-8.3 22-23 - 72 h EC50 biomass (AUGC)* 1.1 2 6,4 CTB, 2004 (Migchielsen, 2002) Pseudokirchneriella
subcapitata 1 x 10
4
cells/mL Y S Gro-Stop Innovator (300 UL)
32.4 am
7.7-8.3 22-23 - 72 h EC50 growth rate 1.8 2 6,4 CTB, 2004 (Migchielsen, 2002) Pseudokirchneriella
subcapitata 1 x 10
4
cells/mL Y S Nogerma Vloeibaar 500 49.3 am 7.4-8.6 23-23.6 - 72 h EC50 growth rate 1.36 2 4,7 L’Haridon, 2003c
Pseudokirchneriella
subcapitata 1 x 10
4
cells/mL Y S Nogerma Vloeibaar 500 49.3 am 7.4-8.6 23-23.6 - 72 h EC50 biomass (AUGC)* 0.86 2 4,7 L’Haridon, 2003c
Pseudokirchneriella
subcapitata 0.5 x 10
4
cells/mL Y S Chlorpropham 120 g/L EW 11.7 am 8.0-9.6 23-24 24 72 h EC50 growth rate 1.13 2 6,4 Kuhl and Wydra, 2009b Pseudokirchneriella
subcapitata 0.5 x 10
4
cells/mL Y S Chlorpropham 120 g/L EW 11.7 am 8.0-9.6 23-24 24 72 h EC50 biomass (AUGC)* 0.62 2 6,4 Kuhl and Wydra, 2009b Scenedesmus
quadricauda - N S Aliacine 400EC 40 am 8.0-8.8 25 - 72 h EC50 growth rate 0.45 3 4,8 EC, 2003b (Kita, 1997)
Protozoa Tetrahymena
pyriformis 1 x 10
4
cells/mL N S a.s. am 28 6 h EC50 growth rate 0.69 3 10 Bamdad et al., 2000
Macrophyta
Lemna minor 4 fronds/plant Y R a.s. >97.5 am
6.5-7.7 25 ± 2 - 7 d EC50 growth rate 3.82 2 1,4,9 EC, 2003b (Bogers, 2000)
Lemna minor 4 fronds/plant Y R a.s. >97.5 am
properties type compound water CaCO3 time
[%] [°C] [mg/L] [mg
a.s./L]
Lemna minor 4 fronds/plant Y R a.s. 98.8 am
6.6-10.4 25 ± 2 - 14 d EC50 growth rate 3.14 2 4,7 EC, 2003b (Firth, 2001)
Lemna minor 4 fronds/plant Y R a.s. 98.8 am
6.6-10.4 25 ± 2 - 14 d EC50 biomass 2.65 2 4,7 EC, 2003b (Firth, 2001) Mollusca
Lymnea stagnalis eggs N S a.s. pa 20 d EC50 egg
development 1.5 3 15 Kosanke et al., 1988
Annelida
Tubifex tubifex N a.s. 7.5 20 48 h LC50 mortality 3.8 4 1,24 Grimwood et al.,
1995
(Applegate et al., 1957)
Crustacea
Daphnia magna <24 h N S a.s. 99.3 rw
7.7-8.1 20 262 48 h EC50 mobility 4.0 2 4 EC, 2003b (Adema and Van
Drongelen-Sevenhuijsen 1989)
Daphnia magna <24 h Y S a.s. 98.1 rw
8.0-8.5 20 148 48 h EC50 mobility 3.7 2 4,7 EC, 2003b (Sved et al., 1992)
Daphnia magna N S Aliacine 400EC 40 rw 7.3 21 152 48 h EC50 mobility 8.4 2 4 EC, 2003b
(Kita, 1997)
Daphnia magna Neonates Y S Chlor-IPC 400
EC 40 rw 7.3-7.9 20-21 - 48 h EC50 mobility 2.6 2 2,4,6 EC, 2003b (Migchielsen, 2001)
Daphnia magna N S a.s. rw - 24 h EC50 mobility 6.5 3 11 Caporiccio et al.,
1981
Daphnia magna <24 h Y S Chlorpropham
1% DP 1.0 rw 7.7-8.1 20 ± 2 250 48 h EC50 mobility >0.62 4 4,7,19 Van der Veen, 2008 (Rudolf, 2005)
Daphnia magna <24 h Y S Gro-STOP 300
HN 31.2 rw 8.2 ±
0.2
20 ±
2 250 48 h EC50 mobility 2.3 2 4,7 Van der Veen, 2008 Bogers and Van der Waard, 1996)
Daphnia magna <24 h Y S Gro-STOP EC
(300) 30 rw 8.1 ± 0.
2
18-20 250 48 h EC50 mobility 4.3 2 6,4 Van der Veen, 2008
(Bogers and Van der Waard, 1996)
Daphnia magna <24 h Y R Chlorpropham
400 G/L EC 40.6 rw 8.1-8.7 20 ± 2 306 48 h EC50 mobility 3.59 2 6,4 Van der Veen, 2008 (l’Haridon, 2005)
Daphnia magna <24 h Y S GRO-STOP 120
properties type compound water CaCO3 time
[%] [°C] [mg/L] [mg
a.s./L]
Daphnia magna <24 h Y S Gro-Stop 300
UL 32.4 rw 7.9-8.2 18-22 - 48 h EC50 mobility 2.5 2 6,4 CTB, 2004 (Migchielsen, 2002)
Daphnia magna 6 - 24 h Y S Nogerma
Vloeibaar 500 49.3 rw 7.9-8.2 19.5-20.3 255-272 48.h EC50 mobility 0.98 2 4,7 L’Haridon, 2003a
Daphnia magna <24 h Y S CIPC 120 G/L AL 11.7 rw
7.8-8.0 21-22 250 48 h EC50 mobility 3.51 2 6,4 Priestly and Mullee, 2010b
Daphnia magna 6-22 h Y S Chlorpropham
120 g/L EW 11.7 rw 7.8-8.0 21 250 48 h EC50 mobility 0.37 2 6,4 Kuhl and Wydra, 2009a
Pisces
Cyprinus carpio 2.9 cm, 0.89 g Y R Chlor-IPC 400
EC 40 7.0-7.5 21-22 250 96 h LC50 mortality 5.3 2 2,4,6 EC, 2003b (Migchielsen, 2001)
Cyprinus carpio 7.5 cm N S Aliacine 400EC 40 7.3 21 109 96 h LC50 mortality 9.2 2 4 EC, 2003b
(Kita,1997) Cyprinus carpio 2.3 ± 0.24 cm,
0.33 ± 0.14 g Y S GRO-STOP EW 120 11.8 rw 7.4-8.2 20.5-21.4 250 96 h LC50 mortality 2.4 2 6,4 Hooftman, 2004 (Migchielsen, 2002) Cyprinus carpio 2.3 cm, 0.15 g Y S Gro-Stop 300
UL 32.4 rw 7.2-8.1 21 250 96 h LC50 mortality 11 3 4, 18 CTB, 2004 (Migchielsen, 2002)
Danio rerio 2.5 cm, 0.23 g N R a.s. 99.3 rw
7.5-8.2 25 262 96 h LC50 mortality 13.4 2 3,4 EC, 2003b (Adema and Van
Drongelen-Sevenhuijsen, 1989)
Lepomis macrochirus 7.5-12.5 cm N S a.s. nw
6.6-7.4 25 ± 1 25-30 48 h LC50 mortality 12 2 1 Davis and Hardcastle,1959 Micropterus
salmoides 7.5-12.5 cm N S a.s. nw 6.6-7.4 25 ± 1 25-30 48 h LC50 mortality 10 2 1 Davis and Hardcastle,1959
Oncorhynchus
mykiss 4.7 cm, 1.4 g Y S a.s. 99.3 rw 8.3 16 230 96 h LC50 mortality 7.5 2 1,2,4,5 EC, 2003b (Bogers, 1993)
Oncorhynchus
mykiss 5 ± 1 cm Y S Chlorpropham 1% DP 1.0 tw 7.8-8.2 2 15 ± 94 96 h LC50 mortality >0.42 4 4,7,19 Van der Veen, 2008 (Rudolf, 2007) Oncorhynchus
mykiss 4.0-5.5 cm, 0.95 g Y R Chlorpropham 400 G/L EC 40.6 dtw 7.7-8.0 14.5 13.6- 153-159 96 h LC50 mortality 3.91 2 6,4 Van der Veen, 2008 (L’Haridon, 2005) Oncorhynchus
mykiss 5.6 ± 0.6 cm, 2.55 ± 1 g Y S Gro-Stop HN 300 31.2 tw 8.0-8.7 14 ± 1 230 96 h LC50 mortality 6.2 2 4,7 Van der Veen, 2008 (Bogers and Van der Waard, 1996) Oncorhynchus
mykiss 4.91 cm, 1.97± 0.2 g Y S Gro-STOP (300) EC 30 tw 7.7-8.7 15.3 14.4- 230 96 h LC50 mortality 9.0 2 4,7 Van der Veen, 2008 (Bogers, 1996) Oncorhynchus
properties type compound water CaCO3 time
[%] [°C] [mg/L] [mg
a.s./L] Oncorhynchus
mykiss 4.2 cm, 0.93 g Y S CIPC 120 G/L AL 11.7 dtw 7.2-8.1 13-14 140 96 h LC50 mortality 4.56 2 4,7 Priestly and Mullee, 2010a
Salvelinus fontinalis 7.4 cm N S Aliacine 400EC 40 7.3 15 109 96 h LC50 mortality 8.8 2 4 EC, 2003b
(Kita,1997) Amphibia
Pleurodeles waltlii larvae N S a.s. rw 24 h LC50 mortality 20 2 12 Caporiccio et al.,
1981
Triturus helveticus adults N S a.s. rw 24 h LC50 mortality 6.5 2 12 Caporiccio et al.,
1981
Xenopus laevis larvae N S a.s. rw 24 h LC50 mortality 8.5 2 12 Caporiccio et al.,
1981 * AUGC = Area Under the Growth Curve
Notes
1 Results based on nominal concentrations.
2 The mean measured concentrations were > 80% of the nominal concentrations. 3 DMSO was used as vehicle.
4 According to OECD guidance.
5 Glycerine PEG ricinoleate was used as vehicle.
6 Results based on nominal concentrations; drop in concentration < 20% during the experiment. 7 Results based on mean measured concentrations.
8 The report was very deficient in data. Replicate results were not reported, therefore no correct EC50 could be calculated.
9 Test solutions were refreshed after 2 and 4 days. In some test solutions with low concentration (0.046 – 0.46 mg/L) the concentration dropped under 67% in the aged solutions. Nevertheless, it was accepted that results were based on nominal concentrations.
10 The ciliate was grown axenically in PPYS medium. Cell density was counted with a Coulter counter. The EC50 was determined by the evaluator from the graphical results of the author. Since the org. C content of the medium was too high, an Ri3 was given.
11 According to AFNOR T90 -301. Test duration too short. Ri = 3 12 20 larvae or 10 adults were kept in 500 mL of water.
13 6-Day old cultures were harvested and suspensions of the cells were incubated with NaHCO3 in the presence of chlorpropham. The oxygen formation was followed for 5-10 min in illuminated suspensions. The exposure period was too short, therefore an Ri=3 was given.
14 6-Day old cultures were harvested and suspensions of the cells were incubated with acetylene. The nitrogenase activity was measured by GLC determination of ethylene production during 80 min. 15 The author gives an EC50 of 15 mg/L but from the data an EC50 = 1.5 mg/L seems more appropriate. Insufficient experimental data are given (no temperature, pH, type of test solution) (Ri = 3). 16 Chlorpropham concentration and pH not measured.
17 Test results based on mean measured concentrations.
18 No concentration measurements were done at t=96 h. A reliable estimation of the LC50 was not possible (Ri = 3).
19 Data in the report were expressed in terms of formulation. Content of chlorpropham in formulation was considered to be too low for extrapolation from 1% to 100% a.s. The data are not used for MAC derivation (Ri = 4).
the author.
22 Test conducted in shake cultures. Cell numbers were determined with a Coulter counter. 23 The test was probably carried out in water.
Species Species
properties A Test type Test compound Purity Test water pH T Hardness CaCO3
Exp.
time Criterion Test endpoint Value Ri Notes Ref.
[%] [°C] [mg/L] [mg a.s./L] Algae Desmodesmus subspicatus 6.2 x 10 3
cells/mL Y S Chlorpropham 1% DP 1.0 a.m. 8.8-9.4 23 ± 2 243 72 h NOEC growth rate 0.18 4 4,7,13 Van der Veen, 2008 (Rudolf, 2005) Desmodesmus
subspicatus 4.4 x 10
3
cells/mL Y S CIPC 120 G/L AL 11.7 am 7.1-7.3 24 ± 1 - 72 h NOEC growth yield rate, 1.17 2 6,4 Vryenhoef Mullee, 2009 and Navicula pelliculosa 1 x 10⁴
cells/mL Y S a.s. 98.8 am 7.3-7.5 23 ± 2 - 96 h NOEC growth biomass rate, 0.702 2 4,7 EC, 2003b (Firth, 2001)
Pseudokirchneriella
subcapitata 1 x 10
4
cells/mL Y S Chlor-IPC EC 400 40 am 7.0-8.1 23 ± 2 - 96 h NOEC growth biomass rate, 0.46 2 4,6 EC, (Migchielsen, 2001) 2003b Pseudokirchneriella
subcapitata - N S a.s. 99.3 am 8.0-8.8 22.5 - 96 h NOEC biomass 0.1 2 3,4,5 EC, 2003b (Hanstveit, 1989)
Pseudokirchneriella
subcapitata 1 x 10
4
cells/mL Y S Chlorproham 400 G/L EC 40.6 am 7.5 0.3 ± 23 34 72 h NOEC growth biomass rate, 0.197 2 6,4 Van der Veen, 2008 (L’Haridon, 2005) Pseudokirchneriella
subcapitata 1 x 10
4
cells/mL Y S GRO-STOP HN 300 31.2 am 7.8-8.2 23 24 72 h NOEC growth biomass rate, 0.32 2 4,7 Van der Veen, 2008 (Bogers and Van der Waard, 1996) Pseudokirchneriella
subcapitata 1 x 10
4
cells/mL Y S GRO-STOP (300) EC 31.2 am 8.1-8.3 21-23 24 72 h NOEC growth biomass rate, 0.74 2 4,7 Van der Veen, 2008 (Bogers and Van der Waard, 1996) Pseudokirchneriella
subcapitata 1 x 10
4
cells/mL Y S GRO-STOP EW 120 11.8 am 7.7-9.0 21.5-23 - 72 h NOEC growth rate 0.23 2 6,4 Hooftman, (Migchielsen, 2002) 2004 Pseudokirchneriella
subcapitata 1 x 10
4
cells/mL Y S Gro-Stop Innovator (300 UL)
32.4 am
22-23 - 72 h NOEC growth rate 0.83 2 6,4 Migchielsen, 2002 (CTB, 2004) Pseudokirchneriella
subcapitata 1 x 10
4
cells/mL Y S Gro-Stop Innovator (300 UL)
32.4 am
22-23 - 72 h NOEC biomass 0.46 2 6,4 CTB, 2004 (Migchielsen, 2002)
Pseudokirchneriella
subcapitata 1 x 10
4
cells/mL Y S Nogerma Vloeibaar 500 49.3 am 7.4-8.6 23-23.6 - 72 h NOEC growth biomass rate, 0.36 2 4,7 L’Haridon, 2003c Pseudokirchneriella
subcapitata 0.5 x 10
4
cells/mL Y S Chlorpropham 120 g/L EW 11.7 am 8.0-9.6 23-24 24 72 h NOEC growth biomass rate, 0.117 2 6,4 Kuhl and Wydra, 2009b Scenedesmus
quadricauda N S Aliacine 400EC 40 am 8-8.8 25 - 72 h NOEC cell density 0.04 2 4,8 EC, 2003b (Kita, 1997)
Macrophyta
Lemna minor 4 fronds
properties type water CaCO3 time
[%] [°C] [mg/L] [mg
a.s./L]
Lemna minor 4
fronds/plant Y R a.s. 98.8 am 6.6-10.4 25 ± 2 - 14 d NOEC growth biomass rate, 1.61 2 4,7 EC, (Firth, 2001) 2003b
Lemna paucicostata N S EC formulation 40(?) am 25 - 7 d NOEC growth 4 3 12 Nishiuchi, 1974
Crustacea
Daphnia magna <24 h Y R a.s. 98.1 rw
7.6-8.4 20 - 21 d NOEC reproduction 0.45 3 4,10 EC, 2003b (Bogers, 1995)
Daphnia magna Y R a.s. 97.7 rw
7.6-8.7 20-21 186 21 d NOEC reproduction 1.0 2 6,4 EC, 2003b (Hooftman,1999)
Pisces
Danio rerio fertilised
eggs Y R a.s. 97.7 rw 7.8-8.4 25 ± 1 186 34 d NOEC larval survival 0.32 2 1,2,4,11 EC, 2003b (Hooftman,1999)
Notes
1 Results based on nominal concentrations.
2 t-Butyl alcohol was used as vehicle.
3 DMSO was used as vehicle. 4 According to OECD guidance.
5 Growth at 0.32 mg/L was significantly inhibited. Therefore a NOEC of 0.1 mg/L is selected as endpoint value. 6 Results based on nominal concentrations; drop in concentration < 20% during the experiment.
7 Results based on mean measured concentrations. 8 Growth at 0.32 mg formulation/L was inhibited for 30%.
9 Test solutions were refreshed after 2 and 4 days. In some test solutions with low concentration (0.046 – 0.46 mg/L) the concentration dropped under 67% in the aged solutions. Nevertheless, it was accepted that results were based on nominal concentrations.
10 There are several deficiencies in the test. Ten test animals per treatment instead of forty (OECD Guideline 202). In view of this low number of test animals, the statistical analysis on mortality data is considered not relevant. From the available data a nominal NOEC for reproduction of 0.45 mg/L could be derived. These results are however not reliable and not useful for risk evaluation.
11 ELS test.
12 The content of the formulation was not reported (Ri = 3).
13 Data in the report were expressed in terms of formulation. Content of chlorpropham in formulation was considered to be too low for extrapolation from 1% to 100% a.s. The data are not used for MAC derivation (Ri = 4).
Species Species
properties A Test type Test compound Purity Test water pH T Salinity Exp. time Criterion Test endpoint Value Ri Notes Ref.
[%] [°C] [‰] [mg
a.s./L] Echinodermata
Lytechinus
pictus fertilised eggs N S a.s. am 18 8 h NOEC cytoskeletal and developmental aberrant mitotic spindles,
deficits
0.124 2 1 Holy,
1998
Notes
1 Eggs were exposed to 0.124, 1.24 and 12.4 mg a.s./L in artificial seawater. No EC50 could be derived because only qualitative data were available. Due to the life stage of the organism the results can be considered as a chronic test result.
Species Species
properties Test compound Purity Application route Exp. Time Criterion Test endpoint Value Ri Notes Ref.
[%] [mg a.s./kg diet] Aves Colinus
virginianus a.s. 98.1 diet 5 d LC50 mortality >5170 2 1 EC, (Campbell and Lynn, 2003b
1992) Coturnix coturnix
japonica a.s. 98.6 diet 5 d LC50 mortality >5000 2 1 EC, (Van Dreumel, 1997) 2003b
Colinus
virginianus 7 months old, ♀,♂
a.s. 98.8 diet 22 w NOEC reproduction ≥1000 2 4 EC, 2003b
(Johnson, 2001)
Mammalia
Dog Beagle,♀, ♂ a.s. 98.6 diet 14 d NOEC organ weights, haematology
clinical signs 5000 ≥ 25000 2 1,4 EC, (Schoenmaker and 2003b
Nesselrooy, 1998)
Dog Beagle, ♀, ♂ a.s. 97.1 diet 28 d NOEC spleen weight, thyroid activity
food consumption, weight 200 20000 2 4,5 EC, (Wedig, 1990) 2003b
Dog Beagle, ♀,♂ a.s. 98.6 capsule 90 d NOEC blood and organ changes
body weight gain 1000 ≥ 25000 2 1,4 EC, (Schoenmakers and 2003b
Frieling,1998)
Dog Beagle, ♀,♂ a.s. 96.2 diet 60 w NOEC effects on thyroid
body weight gain 200 2000 2 4,5,8 EC, 2003b (Wedig, 1992)
Mouse ♀,♂ a.s. 96.2/97.1 diet 90 d NOEC blood, reticulocytes
body weight 1743 ≥ 3486 2 5,6 EC, (Krohmer, 1996) 2003b
Mouse ♀,♂ a.s. 98.6 diet 90 d NOEC increased met-Hb and Heinzbodies
body weight gain <1000 ≥ 300 2 1 EC, (Jonker, 1998) 2003b
Mouse CD1 albino, ♀,♂ a.s. 96.2 diet 18 m NOEC changes in spleen and bone-marrow
mortality 830 4150 2 1,6,9 EC, 2003b (Botta, 1992; Krohmer,
1992)
Rabbit New Zealand
White,♀ a.s. 98.6 gavage d 6-18 after mating NOEC maternal decreased food consumption and mortality, increased spleen weight; slightly retarded foetal weight and ossification 8325 2 1,3 EC, (Waalkens-Berendsen, 2003b 1998)
Rabbit New Zealand
White,♀ a.s. gavage d 6-18 after mating NOEC maternal decreased food consumption embryotoxicity 8325 4163
2 1,3 EC, 2003b (James et al., 1983)
Rat Wistar, ♀,♂ a.s. 98.6 diet 28 d NOEC red blood cell parameters, reticulocytes
body weight <600 3000 2 1 EC, (Schoenmakers et al., 2003b