RIVM report 260801001/2005
Modeling chronic diseases: the diabetes module
Justification of (new) input data
CA Baan, G Bos, MAM Jacobs-van der Bruggen (red.)
This investigation has been performed by order and for the account of the Dutch Ministry of Health, Welfare and Sport, within the framework of project V/260901, Diabetes.
RIVM, P.O. Box 1, 3720 BA Bilthoven, telephone: 31 - 30 - 274 91 11; telefax: 31 - 30 - 274 29 71
Contact: CA Baan
Department for Prevention and Health Services Research (PZO)
Rapport in het kort
Modelleren van chronische ziekten: de diabetes module
Verantwoording van (nieuwe) invoer
Om effecten van verschillende preventieve maatregelen voor diabetes te kunnen berekenen, is het RIVM Chronische Ziekten Model geactualiseerd en aangepast. Het Chronische Ziekten Model is een instrument om effecten van veranderingen in het vóórkomen van risicofactoren, bijvoorbeeld overgewicht en roken, voor chronische ziekten (o.a. hart- en vaatziekten) te schatten op ziektelast en sterfte. Dit rapport geeft de verantwoording van de nieuwe diabetesmodule in dit model. Met deze diabetesmodule kunnen zowel primaire preventiestrategieën als maatregelen in de zorg (=betere behandeling van diabetes en cardiovasculaire risicofactoren) worden doorgerekend en het effect op de volksgezondheid worden geschat. Dit geeft beleidsmakers en zorgverleners inzicht in hoeveel
gezondheidswinst er te behalen zou zijn door preventie en het kan ondersteunen bij het prioriteren van verschillende preventiestrategieën.
Alle diabetes-gerelateerde informatie in het Chronische Ziekten Model is geactualiseerd. Roken is toegevoegd als risicofactor voor diabetes. HbA1c (een maat voor het bloedglucose niveau) is toegevoegd als risicofactor voor cardiovasculaire complicaties. Nieuwe
modelgegevens bij patiënten met diabetes zijn het voorkomen van cardiovasculaire
complicaties, het voorkomen van cardiovasculaire risicofactoren (HbA1c, hoge bloeddruk, roken, cholesterol en overgewicht) en de relaties tussen deze risicofactoren en het ontstaan van cardiovasculaire complicaties.
Abstract
Modeling chronic diseases: the diabetes module
A justification of (new) input
The RIVM chronic disease model (CDM) is an instrument designed to estimate the effects of changes in the prevalence of risk factors for chronic diseases on disease burden and mortality. To enable the computation of the effects of various diabetes prevention scenarios, the CDM has been updated and adapted. The present report presents a justification of the new diabetes module and the data used.
The diabetes module allows the computation of both primary prevention scenarios and care scenarios (i.e. treatment of diabetes and cardiovascular risk factors) and the assessment of the effect on public health. The outcome provides policy makers and health professionals with insight into the potential prevention-associated health gain and may aid them in prioritising prevention scenarios.
All diabetes-related information in the CDM has been updated. Smoking has been added as a risk factor for diabetes. HbA1c (a measure of blood glucose level) has been added as a risk factor for cardiovascular complications. New model data regarding patients with diabetes include the prevalence of cardiovascular complications, the prevalence of cardiovascular risk factors (HbA1c, high blood pressure, smoking, cholesterol and overweight) and the
relationships between these risk factors and the development of cardiovascular complications. The literature shows that in trials focusing on the prevention of diabetes, the diabetes
incidence drops by 60%. Trials focusing on improved treatment of diabetes patients show that the incidence of cardiovascular diseases falls by 25-50%, depending on the type of treatment and research setting.
Voorwoord
Dit rapport is een mijlpaal binnen de kennisvraag diabetes uit 2004 (kennisvraag 2.3.3). De kennisvraag Diabetes is een lopend project dat uitgevoerd wordt door het centrum Preventie en ZorgOnderzoek (PZO) van het Rijksinstituut voor Volksgezondheid en Milieu (RIVM) in opdracht van het Ministerie van Volksgezondheid, Welzijn en Sport (VWS). Deze
kennisvraag is onderdeel van programma 2 ‘Beleidsondersteuning Volksgezondheid en Zorg’.
Het doel van het project is het wetenschappelijk onderbouwen van diverse preventieve maatregelen om diabetes en complicaties ten gevolge van diabetes te voorkómen. Om deze vraag te beantwoorden wordt gebruik gemaakt van het RIVM Chronische Ziekten Model. Het Chronische Ziekten Model was tot nog toe vooral geschikt om primaire preventiestrategieën door te rekenen, maar door diverse aanpassingen is het nu ook mogelijk om effecten van preventiestrategieën in de zorg voor diabetes te schatten met het Chronische Ziekten Model. Het huidige rapport geeft een inhoudelijke verantwoording van de aanpassingen die in de diabetesmodule van het Chronische Ziekten Model zijn uitgevoerd.
Het onderzoek is uitgevoerd in nauwe samenwerking met het project ‘Budgetallocatie: methode-ontwikkeling voor prioritering van interventies bij chronische ziekten’ dat binnen het MAP SOR-onderzoeksprogramma ‘Methodologie optimale gezondheidswinst en kwaliteit van zorg’ wordt uitgevoerd. De conceptuele en formele opzet van het model is beschreven in het rapport ‘A conceptual framework for budget allocation in the RIVM Chronic Disease Model. A case study of Diabetes Mellitus’(rapportnummer
260706001/2005).
Met het hier beschreven diabetesmodel kunnen berekeningen van effecten van diverse
preventiestrategieën worden gemaakt in termen van ziektelast, sterfte, zorggebruik en kosten. De eerste resultaten zullen naar verwachting eind 2005 gepubliceerd worden.
Hierbij wil ik iedereen bedanken die heeft bijgedragen aan het tot stand komen van het diabetesmodel en aan deze rapportage.
Caroline Baan Projectleider
Contents
Summary 7
1. Introduction 9
Part I The Chronic Disease Model and diabetes 11
2. The Chronic Disease Model (CDM) and diabetes 11
3. Adaptations to the CDM with respect to diabetes 15
Part II Diabetes input data in the CDM 17
4. Incidence, prevalence and mortality of diabetes 17
4.1 Introduction 17
4.2 The Dismod method 17
4.3 Incidence and prevalence data 18
4.4 Mortality data 21
5. Diabetes health care utilization, costs and quality of life 29
5.1 Diabetes health care utilization 29
5.2 Diabetes costs 30
5.3 Diabetes Quality of life 33
Part III Prevention of diabetes 35 6. Risk factors for diabetes incidence and primary prevention 35
6.1 Introduction 35
6.2 Methods 35
7. Risk factors for diabetes incidence 39
7.1 Body Mass Index 39
7.2 Physical inactivity 42
7.3 Smoking 45
7.4 Alcohol 48
7.5 Combination of risk factors 49
7.6 Conclusion risk factors for diabetes incidence 50
8. Primary prevention 51
8.1 Lifestyle interventions 51
8.2 Pharmacological interventions 52
8.3 Primary prevention conclusions 53
Part IV Prevention of diabetes complications 55 9. Macrovascular complications of diabetes and tertiary prevention 55
9.1 Introduction 55
9.2 Methods 55
9.3 Prevalence of macrovascular complications in individuals with diabetes 59 10. Risk factors for macrovascular complications in individuals with diabetes 61
10.1 Overweight 61 10.2 Physical inactivity 65 10.3 Smoking 67 10.4 Total cholesterol 70 10.5 Hypertension 72 10.6 HbA1c 74 11. Tertiary prevention 79
11.1 Interventions to reduce bodyweight 79
11.2 Strict control of blood glucose 80
11.4 Lipid control 81
11.5 Conclusions tertiary prevention 81
12. Discussion and conclusions 83
References 85
Appendix I Studies reporting relative risk on mortality for diabetic vs non-diabetic subjects 102 Appendix II Care consumption of diabetes mellitus patients in one year 105 Appendix III Relative risks for body mass index (BMI) on diabetes incidence 106 Appendix IVa Relative risks for physical inactivity on diabetes incidence 114 Appendix IVb Calculated relative risks for physical inactivity on diabetes incidence 117 Appendix V Relative risks for current and former smoking on diabetes incidence 119 Appendix VI Relative risks for alcohol consumption on diabetes incidence 122 Appendix VIIa Lifestyle interventions and prevention of diabetes incidence 125 Appendix VIIb Pharmacological interventions and prevention of diabetes incidence 126 Appendix VIII Prevalence of macrovascular disease in diabetic men and women 128
Appendix IX Validation of prevalences of risk factors in diabetes patients based on estimations from CDM 129
Appendix X Relative risks for HbA1c on incidence of macrovascular disease
in diabetes patients 132
Appendix XIa Tertiary prevention trials in diabetic patients, lifestyle interventions 134 Appendix XIb Tertiary prevention trials in diabetic patients, pharmacological interventions 138
Summary
BackgroundThe RIVM Chronic Disease Model (CDM) is a computer program designed to compute the effects of changes in risk factor prevalence on disease specific morbidity and mortality over a prespecified number of years. The RIVM was asked to compare the potential benefits of prevention interventions targeted at diabetes and cardiovascular diabetes complications, using the CDM. This report describes the diabetes module in the CDM and gives a justification of (new) diabetes-related input data in the CDM.
Methods
Data regarding the incidence and prevalence of diabetes and diabetes mortality were based on Dutch general practitioner registrations. Prevalence of risk factors for diabetes incidence was retrieved from national surveys. Prevalence of risk factors for cardiovascular complications, in diabetes patients, was estimated from the CDM or based on data from Dutch diabetes care projects. Relative risk estimates for risk factors for diabetes incidence and diabetes
complications were estimated from the international literature. A literature review was performed to identify effective prevention interventions targeted at diabetes and cardiovascular complications.
Results
All diabetes-related input data in the CDM were updated. Smoking was added as a risk factor for diabetes incidence. HbA1c (a measure of blood glucose control) was added as a risk factor for diabetes complications. Among diabetes patients, new input data in the CDM comprised the prevalence of cardiovascular complications (acute myocardial infarction, coronary heart disease, congestive heart failure and stroke), the distribution of cardiovascular risk factors (body mass index, physical inactivity, smoking, total cholesterol, blood pressure and HbA1c), and the relative risks between these risk factors and cardiovascular
complications. International studies showed that lifestyle programs may reduce diabetes incidence with up to 60% in three to five years, while strict pharmacological treatment of blood pressure or serum cholesterol in diabetes patients may prevent approximately 25% of the cardiovascular complications.
Conclusion
The CDM has been adapted to allow for the comparison of the benefits of prevention interventions aimed at diabetes or diabetes complications. Ongoing activity is needed to update, expand and validate the diabetes module in the CDM.
1. Introduction
CA Baan, G Bos, MAM Jacobs-van der Bruggen
Diabetes is a substantial and growing public health problem and has been appointed one of the spearheads of Dutch policy for the coming years. The National Institute for Public Health and the Environment (RIVM) was asked to explore which intervention strategies and
measures are most effective in preventing diabetes and diabetes related (macrovascular) complications.
The Chronic Disease Model (CDM) has been developed by RIVM as a tool to generate structured data on the effects of autonomous changes (demography) as well as interventions on chronic disease risk factors in terms of expected morbidity and mortality in the future. The merits of using a model like the CDM to evaluate interventions are that the consequences can be extrapolated to the Dutch diabetes population, that long term effects can be computed, and that costs and effects of different interventions can be consistently compared.The CDM will be used to compare the potential benefits of several intervention scenarios aimed at primary prevention (preventing new cases of diabetes) or tertiary prevention (reducing complications in diabetic patients). Secondary prevention (screening for new diabetes patients) is beyond the scope of this report. The effects of prevention will be described in terms of reduced morbidity and mortality and also in expected health care demands, costs and quality of life (disability adjusted life-years).
The CDM is in constant development with regular structural changes and updates implemented for different applications. For this extensive diabetes project all input data regarding diabetes in the “old CDM” (CDM-2003) is updated. Also, more specific information is needed. For example, the prevalence of risk factors within the diabetes population (how many diabetes patients have overweight or obesity) was not included in the CDM-2003. Furthermore several structural changes and extensions to the model are needed to model diabetes prevention. For example, HbA1c has to be added as a risk factor for diabetes complications in patients with diabetes. The adaptations with regard to diabetes will be partly implemented in the “new CDM model” (CDM-2005-01), a model version which is available in march 2005. All other diabetes adaptations described in this report are
implemented in a CDM version which is available later in 2005 (2005-02). The CDM-2005-02 will be used for modeling diabetes prevention.
In this report we focus on type 2 diabetes as most of the Dutch diabetes patients (>85%) have type 2 diabetes, and risk factors for this type of diabetes are better understood and more suitable for prevention as compared to type 1 diabetes.
The objective of this report is twofold. First we outline the structure of the CDM-2003 in relation to diabetes and the extensions and developments to the model that were needed to model diabetes interventions. We describe the diabetes specific input data in the CDM-2005-02 and how these data were collected. Secondly this report reviews the results of primary and tertiary diabetes intervention trials from the international literature. This review gives an indication as to which interventions are potentially beneficial and worth modeling.
This report is divided into four parts. In part 1, we briefly describe the CDM-2003 in general and in relation to diabetes. The interrelationships between diabetes, its risk factors, its cardiovascular complications and other risk factors for cardiovascular complications are outlined. We explain how the model was extended to enable the evaluation of interventions to prevent diabetes and its complications. The diabetes specific input data requirements for the
2005-02 are summarized. For a more elaborated description of diabetes in the CDM-2005-02 we refer to another RIVM report published in 2005 1.
In Part II we describe the input data regarding diabetes prevalence, incidence and mortality as well as health care utilization, health care costs and quality of life. We summarize the
parameters which were already included in CDM-2003 and their justification. Some of these parameters have been updated. Methods of data collection, the resources that were used (or excluded) and the data that were finally selected for the CDM-2005-02 are discussed. For some new data that should be added to the model (health care and costs) insufficient data are available. We discuss which information is still needed and how we plan to collect this information in 2005.
In Part III and IV we focus on risk factors for diabetes incidence (Part III) and risk factors for the development of macrovascular complications of diabetes (Part IV). In Part III we justify the input data regarding prevalence of risk factors in the Dutch population and the strengths of the relations between those risk factors and diabetes incidence in terms of relative risks. In Part IV, a description of all new parameters is given. We describe how the prevalence of cardiovascular complications, the prevalence of risk factors for complications in the Dutch diabetes population and the relative risks between these risk factors and complications in patients with diabetes were retrieved. In addition we review the results of primary (Part III) and tertiary (Part IV) diabetes intervention trials found in the international literature. This gives us some insight in the potential effects of different intervention strategies. Intensive trials however do not mirror real life (health care) practice. The results of these trials still have to be translated into realistic scenarios for the Dutch health care setting. Moreover, many of these trials include pharmacological treatment while medication is not incorporated in the CDM (yet). The results of defining and modeling intervention scenarios will be reported in 2005 and 2006.
Part I The Chronic Disease Model and diabetes
2.
The Chronic Disease Model (CDM) and diabetes
RT Hoogenveen, TL Feenstra
The RIVM Chronic Disease Model (CDM) has been developed as a tool to describe the effects of changes in chronic disease risk factors on morbidity and mortality while taking into account integrative aspects. The CDM-2003 contains the following risk factors: body mass index (BMI), physical activity, smoking, alcohol, total cholesterol and systolic blood pressure. It models 28 chronic diseases: cardiovascular diseases (subdivided in acute myocardial infarction, other coronary heart disease, stroke, and congestive heart failure), COPD, asthma, diabetes mellitus, dementia, arthrosis (knee, hip and other), osteoporosis, low back pain and 15 different forms of cancer.
The model is structured in such a way that new diseases and risk factors can be added relatively easily. The mathematical model structure, which is called a multi-state transition model, is based on the life table method. The model states defined are the risk factor classes and disease states. State transitions are possible between classes for any risk factor, incidence, remission and progress for any disease, and mortality. The model describes the life course of cohorts in terms of changes between risk factor classes and changes between disease states over the simulation time period. Risk factors and diseases are linked through relative risks on disease incidence. The main model parameters are:
• the population numbers (in the year at which we start modeling), • initial class prevalence rates and transition rates for all risk factors,
• initial prevalence, incidence and excess mortality for all diseases, and remission rates (if applicable) and
• relative risk values specified by risk factor and chronic disease.
All model parameters and variables are specified by gender and 5-year age-classes. The time step used for modeling is 1 year. The main model outcome variables are incidence,
prevalence and mortality numbers specified by disease, and integrative measures such as total and disability-adjusted life years. Examples of the integrative aspects of the model are the joint effects of combined risk levels, different causes of morbidity and mortality being distinguished, the effects of mortality selection and the statistical modeling of dependent competing risks.
For further details on the Chronic Disease Model in general, we refer to a recently published technical report 1.
Diabetes is modeled in the CDM both as a disease and a risk factor for a number of cardiovascular diseases, which are the most important macrovascular complications of diabetes. The same holds for some cardiovascular diseases. Figure 2.1 shows the dependency structure between diabetes and cardiovascular diseases.
CHF AMI CVA other CHD (AP) DM
Figure 2.1 Dependency relations between diabetes mellitus and several cardiovascular diseases CHF=Congestive Heart Failure, AMI= Acute Myocardial Infarction, other CHD=other Coronary Heart Diseases, AP=Angina Pectoris, CVA=Stroke, DM=Diabetes Mellitus
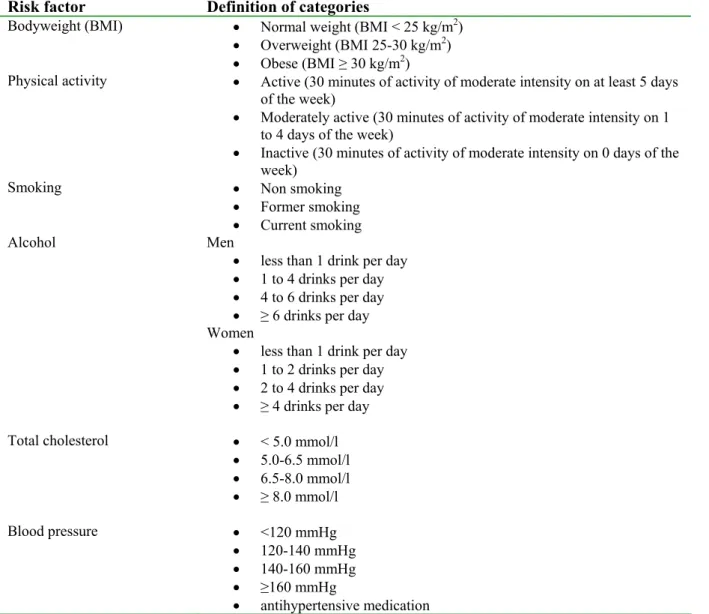
The following risk factors included in the CDM-2003 are important for the modeling of diabetes and macrovascular complications of diabetes: body mass index (BMI), physical inactivity, smoking, alcohol, total cholesterol, and systolic blood pressure (SBP). For all risk factors, the model distinguishes several classes (table 2.1).
Table 2.1 Definition of risk factor classes in CDM-2003
Risk factor Definition of categories
Bodyweight (BMI) • Normal weight (BMI < 25 kg/m2)
• Overweight (BMI 25-30 kg/m2)
• Obese (BMI ≥ 30 kg/m2)
Physical activity • Active (30 minutes of activity of moderate intensity on at least 5 days of the week)
• Moderately active (30 minutes of activity of moderate intensity on 1 to 4 days of the week)
• Inactive (30 minutes of activity of moderate intensity on 0 days of the week)
Smoking • Non smoking
• Former smoking • Current smoking Alcohol Men
• less than 1 drink per day • 1 to 4 drinks per day • 4 to 6 drinks per day • ≥ 6 drinks per day Women
• less than 1 drink per day • 1 to 2 drinks per day • 2 to 4 drinks per day • ≥ 4 drinks per day Total cholesterol • < 5.0 mmol/l
• 5.0-6.5 mmol/l • 6.5-8.0 mmol/l • ≥ 8.0 mmol/l Blood pressure • <120 mmHg • 120-140 mmHg • 140-160 mmHg • ≥160 mmHg • antihypertensive medication
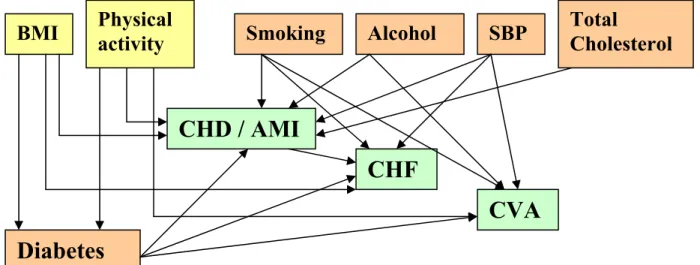
In the CDM-2003, BMI and physical activity are risk factors for diabetes incidence as well as for some cardiovascular diseases. Smoking, alcohol, cholesterol and SBP are modeled as risk factors for cardiovascular diseases only. Adding these risk factors for diabetes and
macrovascular complications of diabetes to figure 2.1, a rather complex structure results:
Risk factors for diabetes incidence and cardiovascular diseases Risk factors for cardiovascular diseases
Cardiovascular diseases (macrovascular complications of diabetes)
Figure 2.2 Dependency relations between risk factors, diabetes mellitus and several cardiovascular diseases
Given this structure, the following input data directly related to diabetes are included in the CDM-2003:
• diabetes prevalence, incidence and mortality rates,
• for each risk factor for diabetes incidence (BMI and physical activity), the distribution in the Dutch population over each risk factor class (prevalence), and the transition rates between these classes (e.g. probability to loose or gain weight),
• for BMI and physical activity, per risk factor class the relative risks for diabetes incidence, and
• for each combination of diabetes with a cardiovascular disease, relative risks for people with diabetes on incidence of the cardiovascular disease.
All these data are age- (5-year age-classes) and sex-specific. Prevalence data apply to the Dutch population, and are therefore based on the most appropriate, recent Dutch registry data (for diabetes) or survey data (for the risk factors). Relations between risk factors and diseases (relative risks) are estimated on the basis of data from the international literature.
The relative risks should be independent of risks associated with other risk factors that are modeled. This means that the relative risk has to be adjusted for other confounding factors included in the model to prevent double counting. For example, people who are physically inactive have a higher risk to develop diabetes as compared to active people. However a part of this relation is explained by a higher body mass index in inactive people. BMI in itself is a strong risk factor for diabetes, which is already accounted for in the model. Therefore, the relative risk estimates for physical activity on diabetes incidence need to be adjusted for BMI.
BMI
Physical
activity
Smoking
Alcohol
SBP
Total
Cholesterol
Diabetes
CHD / AMI
CHF
In the CDM-2003 version, diabetes is included as a single stage disease, that is, the only distinction made is between diabetes and no diabetes. The model takes into account the links between risk factors, diabetes and macrovascular complications of diabetes, but does not distinguish between the risk factor distribution among people with or without diabetes (figure 2.3).
Figure 2.3 Dependency relations between risk factors, diabetes and macrovascular complications of diabetes in CDM-2003
3.
Adaptations to the CDM with respect to diabetes
RT Hoogenveen, TL Feenstra
The CDM-2003 is suited to evaluate the effects of primary prevention, since the effect of changes in risk factor prevalence on diabetes and on cardiovascular complications can be estimated. However, it is not suited to evaluate the effect of tertiary prevention, that is, the prevention of cardiovascular complications in patients with diabetes. The link between diabetes treatment (resulting in improved risk profiles among patients with diabetes) and cardiovascular complications is not modeled. All people with diabetes are modeled as average diabetes patients, with average life expectancy and average risks for cardiovascular complications. Again, the distribution of risk factors (for example blood pressure) for cardiovascular complications among diabetes patients is not included in the CDM-2003. Hence, an extension of the model is needed to allow for the evaluation of tertiary prevention. Besides these changes, some further extensions to the model are considered with respect to the model outcomes (quality of life, health care and costs) as well as the implementation of new risk factors for diabetes incidence (smoking and alcohol). An overview of all diabetes input data (old and new) described in this report is given in table 3.1.
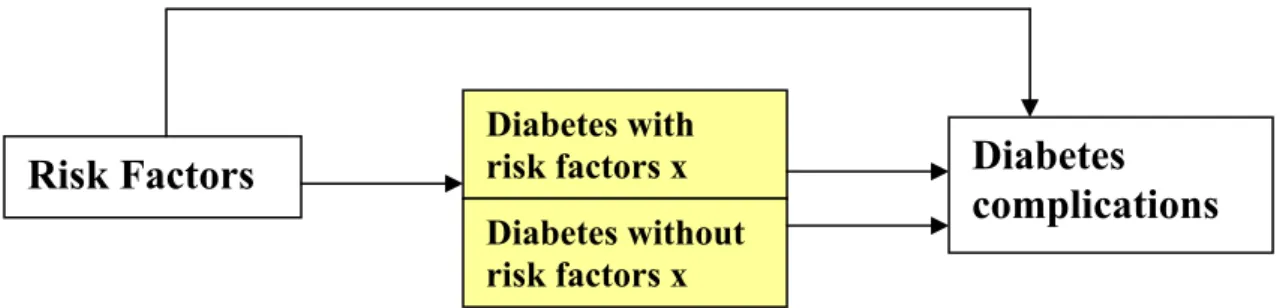
To be able to evaluate prevention of macrovascular complications of diabetes, the model must be extended to include the prevalence of risk factors for cardiovascular complications in patients with diabetes, as follows:
Figure 3.1 Dependency relations between risk factors, diabetes and macrovascular complications of diabetes in CDM-2005-02
That is, in the CDM-2005-02, the diabetes population is divided into risk factor classes. This enables us to evaluate the effect of treatment aiming at risk reduction in patients with diabetes to reduce the incidence of cardiovascular complications. For the formal model, this new structure implies that the model needs to be reformulated, keeping track of risk factor prevalence, once people get diabetes. The CDM-2005-02 requires the following extra input data as compared to the CDM-2003:
• information regarding quality of life and (costs of) health care utilization in patients with diabetes
• if applicable, prevalence of smoking and alcohol consumption in the Dutch population, transition rates between risk factor classes, and relative risks between these risk factors and diabetes incidence
• the prevalence of macrovascular diseases (AMI, CHD, CHF CVA) in patients with diabetes
Risk Factors
Diabetes with
risk factors x
Diabetes
complications
Diabetes without risk factors x
• for each risk factor for cardiovascular complications, the distribution of the diabetes population over risk factor classes (prevalence) and transition rates between those classes
• relative risks for these risk factors in a diabetes population for incidence of cardiovascular diseases
All these parameters are age- and sex-specific. The risk factors for cardiovascular
complications in patients with diabetes to be included in the CDM-2005-02 are BMI, physical activity, total cholesterol, systolic blood pressure and smoking. HBA1c, which is a measure of blood glucose control during the past three months, is a new parameter in the CDM and will only be included for the diabetes population.
In the current report we document updates of the input data already included in the CDM-2003, as well as new estimates for the model parameters in the CDM-2005-02 (table 3.1).
Table 3.1 Overview of the contents of this report
Parameter Update or new Section
Diabetes input data incidence, prevalence update 4.3
mortality update 4.4
health care new 5.1
costs new 5.2
quality of life new 5.3
Risk factors for diabetes incidence methods 6.1
(prevalence, relative risk and PAR) BMI update 7.1
physical activity update 7.2
smoking new 7.3
alcohol new 7.4
combination new 7.5
Macrovascular complications methods 9.2
prevalence of complications AMI, CHD, CHF, CVA new 9.3
Risk factors for complications BMI new 10.1
(prevalence, relative risks) physical activity new 10.2
smoking new 10.3
total cholesterol new 10.4
SBP new 10.5
HbA1c new 10.6
Interventions methods 6.2 / 9.2
primary interventions 8
Part II Diabetes input data in the CDM
4. Incidence,
prevalence
and mortality of diabetes
RT Hoogenveen, CA Baan
4.1 Introduction
In 2000, incidence, prevalence and mortality rates were estimated for all chronic diseases included in the RIVM Chronic Disease Model 2. For reasons of comparability, the same approach was used for all chronic diseases included in the CDM. At this moment, more recent incidence and prevalence data have become available that enable us to update the Chronic Disease Model parameters. In the current report the analysis made for diabetes mellitus is described. First, the disease modeling analyses (Dismod method) will briefly be introduced and then the recent data on prevalence and incidence of diabetes used will be presented. In the two last sections we will focus in more detail on the methods used for estimating the mortality estimates and discuss the results of mortality estimates.
4.2 The
Dismod
method
The dismod method is defined as the assessment of disease incidence, prevalence and mortality rates in an incidence-prevalence-mortality (IPM) model. The main advantage of IPM models is that incidence, prevalence and mortality figures are linked through the causal chain of a disease process, and this chain limits the possible combinations of incidence, prevalence and mortality rates 3. Limits are imposed because any prevalent case must have become incident at some younger age and any person dead with a disease must have become incident previously and have been prevalent, al least shortly. Jointly estimated incidence, prevalence and mortality rates using a causal model are therefore internally consistent 4. Since the three disease parameters are related through the IPM model, one of them can be calculated given the other ones.
disease incidence
mortality mortality
Figure 4.1 Incidence Prevalence Mortality model
The dismod analysis for all diseases included in the CDM consists of calculating disease related mortality from given incidence and prevalence rates from selected registers in general practice 2.
disease-free with disease
(prevalence)
4.3 Incidence and prevalence data
At the internet site the Public Health Compass 2004, Dutch data (age-standardized) on incidence and prevalence of diabetes are presented, both from general practitioner (GP) registrations as well as from epidemiological studies 5. The validity of all data from the GP has been assessed by evaluating the degree of representativeness, continuity, completeness and freedom from ambiguity of each source.
The data sources used in the IPM-model have been selected from all studies presented at the internet site, using the following criteria:
1. The observation period is around year 2000
2. The study must be a GP study since we want to assess the effect of diseases in terms of health care use (i.e. known by the general practitioner)
3. The number of participants in the study must be over 10,000
4. The registration period has to be sufficiently long in order to include patients who rarely visit the general practitioner (registration period ≥ 1 year)
For diabetes, five data sources have been selected (table 4.1). More detail about the registration projects are given at the internet site The Public Health Compass 2004 6.
Table 4.1 Registration projects in general practice used for Dismod analysis diabetes mellitus
Registration projects in
general practice Region Type of registration Period Period used Size
2nd National Study (NS2) National Contact registration 2000-2002 2000-2002 395,000
Continuos Morbidity Registration (CMR)
Region Nijmegen
Contact registration Since 1971
continuous
1996-2000 12,000
Transition Project - 1 Multi-regional Episode-registration Since 1985 1985-2000 170,000 py
Registration Network
General practices (RNH) Region Limburg Problem list Since 1988 continuous 1997-2000 79,000 Registration Network
University general practices Leiden and environs (RNUH LEO) -2
Region Leiden Problem list Since 1989 1998-2000 30,000
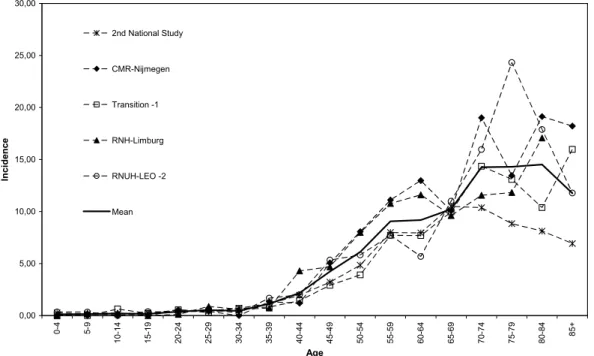
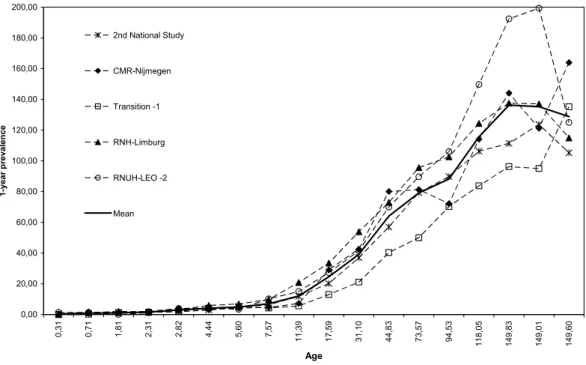
Diabetes incidence and prevalence estimates for men and women are presented in figures 4.2-4.5.
Incidence 0,00 5,00 10,00 15,00 20,00 25,00 30,00 0-4 5-9 10-14 15-19 20-24 25-29 30-34 35-39 40-44 45-49 50-54 55-59 60-64 65-69 70-74 75-79 80-84 85+ Age Incide n ce 2nd National Study CMR-Nijmegen Transition -1 RNH-Limburg RNUH-LEO -2 Mean
Figure 4.2 Incidence estimates of diabetes mellitus in the 5 data sources selected and the mean of these estimates (men)
0,00 5,00 10,00 15,00 20,00 25,00 30,00 0-4 5-9 10-14 15-19 20-24 25-29 30-34 35-39 40-44 45-49 50-54 55-59 60-64 65-69 70-74 75-79 80-84 85+ Age Incide n ce 2nd National Study CMR-Nijmegen Transition -1 RNH-Limburg RNUH-LEO -2 Mean
Figure 4.3 Incidence estimates of diabetes mellitus in the 5 data sources selected and the mean of these estimates (women)
Prevalence 0,00 20,00 40,00 60,00 80,00 100,00 120,00 140,00 160,00 180,00 200,00 0,31 0,71 1,81 2,31 2,82 4,44 5,60 7,57 11,39 17,59 31,10 44,83 73,57 94,53 118,05 149,83 149,01 149,60 Age 1 -yea r p revalen ce 2nd National Study CMR-Nijmegen Transition -1 RNH-Limburg RNUH-LEO -2 Mean
Figure 4.4 Prevalence estimates of diabetes mellitus in the 5 data sources selected and the mean of these estimates (men)
0,00 20,00 40,00 60,00 80,00 100,00 120,00 140,00 160,00 180,00 200,00 0,31 0,71 1,81 2,31 2,82 4,44 5,60 7,57 11,39 17,59 31,10 44,83 73,57 94,53 118,05 149,83 149,01 149,60 Age 1 -yea r p revalen ce 2nd National Study CMR-Nijmegen Transition -1 RNH-Limburg RNUH-LEO -2 Mean
Figure 4.5 Prevalence estimates of diabetes mellitus in the 5 data sources selected and the mean of these estimates (women)
4.4 Mortality
data
Mortality is divided in mortality with diabetes and mortality without diabetes. The mortality rates with diabetes are specified by age and sex, but unadjusted for other confounders such as epidemiological risk factors and co-morbid diseases.
The mortality rates with and without diabetes are fully defined within the IPM model context. This definition has several consequences:
1) the definition does not imply that the mortality rates with diabetes equal the empirical diabetes mortality rates based on death registrations with diabetes as primary or secondary cause of death,
2) the mortality rates with diabetes may result from co-morbid diseases. For diabetes mortality, rates result largely from macro-vascular complications. Thus, aggregating the mortality rates with diabetes and mortality rates with cardiovascular disease results in double counting,
The dismod analyses for diabetes consisted of the following steps:
1) calculate a mean incidence and prevalence rate based on the sources selected (presented above in section 4.3)
2) calculate point prevalence rates by subtracting the incidence rates from the 1-year period prevalence rates obtained in step 1
3) estimate mortality rates with diabetes from these mean incidence and point prevalence rates using the IPM model
4) estimate excess mortality rates using relative risk values presented in epidemiological studies
5) compare the results from step 3 with estimates of mortality with diabetes obtained in step 4 and selection of the mortality rates with diabetes used in the CDM
6) Validation of mortality rates
Ad 3: Estimating excess mortality rates from these mean incidence and point prevalence rates using the IPM model
In an IPM model, mortality can be estimated by the incidence and prevalence with the following equation 7: )) ( 1 )( ( ) ( ) ( ) ( ) ( t prev t prev t prev t t inc t mortDM − ∂ ∂ − = (4.1)
With t: time (age) parameter; d/dt: instantaneous change over time; prev: prevalence rate; inc: incidence rate; mortDM: mortality rate with diabetes.
The time parameter t in the IPM model describes changes over both age and time
simultaneously. This means it describes the course of a cohort. This can be illustrated with the Lexis diagram (figure 4.6).
Age change over time
a+∆t
change over age
change within cohort
a
0 t t+∆t time
Figure 4.6 Lexis diagram: the relation between time, age and cohort
The Lexis diagram describes a population in terms of changes over age for fixed time (vertical line, age-effects), changes over time for fixed age (horizontal line, period effects), and changes within cohorts (diagonal line).
The incidence and prevalence rates available from registries in general practice describe the changes over age and thus follow the vertical line. One study, the CMR-Nijmegen, estimates the incidence and prevalence continuously over a longer period. With these estimates it is possible to estimate age-standardized changes over time of disease prevalence rates and thus follow the horizontal line. Combining these two estimates (horizontal and vertical) gives the change of diabetes prevalence rate during a 1-year time interval. The mortality rate with diabetes is then calculated using:
)) ( 1 )( ( ) ( ) ( ) ( t prev t prev t prev t a t inc t mortDM − ∂ ∂ + ∂ ∂ − (4.2)
With δ/δa: age-change for fixed year; δ/δt: time change for standardized age.
The time changes for standardized age were derived from CMR Nijmegen. We calculated the 1-year relative changes specified by gender and by age. The relative changes were calculated by weighted linear regression on the calculated empirical 1-year relative changes.
∆ prev (a)/prev (a) is the relative change of the disease prevalence rates over time for given age. α is the autonomous change (intercept) β describes the relation with age. If β > 0 the yearly increase is larger (or the decrease is smaller) for higher ages, if β < 0 the yearly increase is smaller (or the decrease is larger).The regression model applied was:
(
)
a a prev a prev α β 01 . 0 ) ( ) ( + = ∆ (4.3)With a: age (years); prev: disease prevalence rate; ∆ change over time; α intercept; β age regression coefficient.
The results are presented in table 4.2. For men aged 40 years, the prevalence rate has increased with 15.5% per year over the period 1990-2000, for women aged 40 years the prevalence rate has increased with 7.1% per year over the period 1990-2003.
Table 4.2: The relative changes of the diabetes prevalence over the period 1990-2003 and calculated values for age 40 and 60 years
Men Women
Parameter values α β α β
0.251 -0.241 0.0978 -0.0677
Calculated values for age (%) 40 60 40 60
15.5 10.6 7.1 5.7
Ad 4: Estimating mortality rates with diabetes by using relative risk values presented in epidemiological studies.
Mortality for diabetes is also calculated with use of mortality risks obtained from the literature. This method has been described in more detail by Baan and collegues 8. The excess mortality can be estimated by using:
)) 1 ( 1 ( ) 1 ( − + − = RR prev RR mort mortDM tot (4.4)
With Morttot: population all cause mortality rates; prev: diabetes prevalence rate; RR: relative risk for total mortality for diabetic versus non-diabetic subjects; mortDM: mortality rate with diabetes.
The relative risks for total mortality for diabetic versus non-diabetic subjects are based on prospective population studies and specified by gender and age. A literature search was performed in Medline. For inclusion in our analysis, studies have to fulfill the following criteria:
• Studies have to be performed after 1980 (either started after 1980 or started before 1980 but with a follow-up period after 1980)
• The study population is Caucasian
• The reference population is the non-diabetic population
• The diabetic population is not a selected subgroup (for instance only hospitalized diabetic patients, or only insulin treated patients)
• The relative risk is reported for men and women separately
• The relative risks are reported for age groups not wider than 30 years • The relative risks are not corrected for BMI
Fourty two studies are identified in the medline search, 18 studies are included in the analysis. Details of these studies are summarized in Appendix I. Of the 24 studies not
included in the analysis six are excluded because of the study period 9-14. Six of the 24 studies excluded were based on a selective diabetes population 15-20. Four studies used the general population as the reference 21-24, four studies reported relative risks for men and women together 25-2728, and three studies corrected for BMI 29-31. In addition to the published relative risks, results from one Dutch study are used (CB-project) which are unpublished.
All cause mortality rates are obtained from Statistics Netherlands.
The relative risks for all cause mortality for diabetics versus non-diabetics are given in figures 4.7 (males) and 4.8 (females).
20 40 50 60 70 80 90 age 2 3 4 5 RR 1 2 3 4 5 5 6 7 7 7 8 9 10 11 11 11 12 12 13 14 15 15 15 16 17
1. Balkau, Br Med J, Paris Prospective, 1993 2. Davey Smith, Am J Epid, Whitehall, 1992 3. Ebi, J Clin Epid, Whitehall, 1992
4. Fraser, Arch Intern Med, Adventist Health, 1997 5. Gu, Diab Care, NHANESI, 1998
6. Houterman, Unpublished results, CB Project, 2000 7. Koskinen, AJPH, Social Insurance Finland, 1998 8. Laukkanen, Arch Intern Med, Kuopio, 2001
9. Menotti, J Clin Epid, Seven Countries Netherlands, 2001
10. Menotti, J Clin Epid, Seven Countries Finland, 2001 11. Roper, Diab Care, South Tees UK, 2002
12. Roper, Diab Care, South Tees UK, 2002 13. Simons, Med J Aust, Dubbo, 2000 14. Tan, Diab Care, Tayside Scotland, 2004 15. Tierney, AJPH, North Dakota, 2001
16. Tunstall-Pedoe, Br Med J, Scottish Heart, 1997 17. Vaccaro, Arch Intern Med, MRFIT, 2004
Figure 4.7: All cause mortality risks for males (unadjusted for BMI)
20 40 50 60 70 80 90 age 2 3 4 5 RR 1 2 3 3 3 4 5 6 6 7 7 7 9 10 11 12 12 13
1. Engstrom, JECH, Malmo Cohort Women, 2000 2. Fraser, Arch Intern Med, Adventist Health, 1997 3. Gu, Diab Care, NHANESI, 1998
4. Houterman, Unpublished results, CB Project, 2000 5. Johansson, Eur Heart J, Goteborg BEDA, 2003 6. Koskinen, AJPH, Social Insurance Finland, 1998 7. Roper, Diab Care, South Tees UK, 2002
8. Roper, Diab Care, South Tees UK, 2002 9. Schopman, Thesis, DOM, 1991 10. Simons, Med J Aust, Dubbo, 2000 11. Tan, Diab Care, Tayside Scotland, 2004 12. T ierney, AJPH, North Dakota, 2001
13. Tunstall-Pedoe, Br Med J, Scottish Heart, 1997
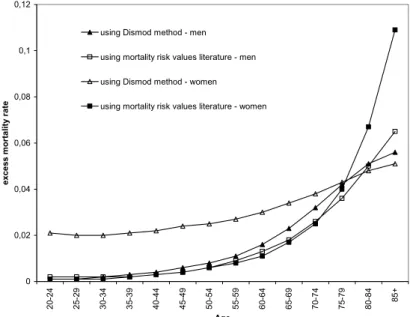
Ad 5: Comparing the mortality rates with diabetes obtained by the IPM model (step 3) with estimates of mortality rates with diabetes using relative risk for mortality (step 4) and selection of the mortality rates with diabetes used in the CDM (figure 4.9).
0 0,02 0,04 0,06 0,08 0,1 0,12 20-24 25-29 30-34 35-39 40-44 45-49 50-54 55-59 60-64 65-69 70-74 75-79 80-84 85+ Age exce ss m o rt a lity r at e
using Dismod method - men using mortality risk values literature - men using Dismod method - women using mortality risk values literature - women
Figure 4.9 Excess mortality of diabetes using different methods
The estimations using Dismod method versus the method using mortality risk values from the literature are more or less equal for men but not for women. At higher ages, the difference between the two methods is larger for both men and women.
Ad 6: Validation of mortality rates with diabetes
To get an idea of the confidence of the estimates of the mortality rates with diabetes, two validation methods are performed.
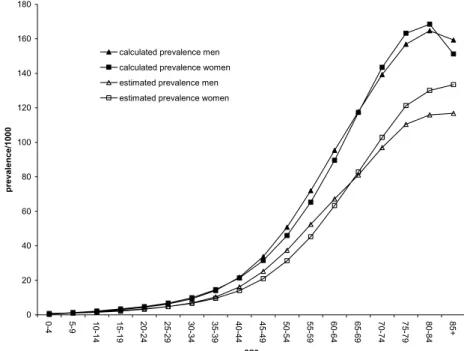
First, disease prevalence rates are calculated from given incidence rates and mortality risks, adjusted for past incidence trends. These past incidence trends were assessed in the same way as the prevalence time trends (see step 3). The relative incidence trend values used were 0.04 (men) and 0.03 (women). This means that the incidence is increasing with 4% for men and 3% for women per year for all ages. The prevalence rates are calculated using the life table method.
As seen in figure 4.10 the calculated prevalence rates (= “evenwichtsprevalentie”) is higher as compared to the empirical prevalence. This is probably due to the CMR-Nijmegen trend used.
The excess mortality based on the method using relative risk values from the literature will be used as input in the diabetes module
0 20 40 60 80 100 120 140 160 180 0-4 5-9 10-14 15-19 2420- 25-29 30-34 35-39 40-44 45-49 50-54 55-59 60-64 65-69 70-74 75-79 80-84 85+ age p revalen ce/1 000
calculated prevalence men calculated prevalence women estimated prevalence men estimated prevalence women
Figure 4.10: Prevalence of diabetes in the Netherlands using the mortality risk from literature method (calculated) versus registrated in general practices (estimated).
Second, we estimated the disease duration of diabetes in the different studies used, with the IPM-method and when using the relative risk method (table 4.3).
Table 4.3 Diabetes incidence and prevalence rates and disease duration values for age range 20-85 years for men and women.
Studies Men Women
Incidence Prevalence Disease duration Incidence Prevalence Disease duration
IPM RR IPM RR CMR Nijmegen 1996-2000 5.7 32.5 9.9 5.9 36.2 8.6 Transition Project – 1 1985-2000 4.1 21.4 9.3 4.5 25.5 7.9 RNH Limburg 1997-2000 5.2 38.4 13.0 4.7 44.3 15.2 RNUH LEO-2 1998-2001 5.1 40.0 11.1 4.9 38.6 12.1 2nd National Study 2000-2002 3.9 30.3 13.3 3.9 33.8 12.8 Total 4.9 * 32.4 * 11.7 11.4 4.7 35.6 12.8 12.2
* mean value of the 5 studies
The incidence of CMR-Nijmegen is higher as compared to the other studies. In the period 1999-2001 the general practitioners have screened their population for undiagnosed diabetes resulting in an high incidence in that period. Disease duration is more or less comparable between the different studies
Disease duration obtained by using the relative risk method is very comparable with the mean disease duration of the 5 studies. Disease duration can be interpreted with life expectancy. In a recent publication, the life expectancy of persons with diabetes is estimated to be 64.7 for
men and 70.7 for women, respectively 12.8 and 12.2 years less than for men and women without diabetes 32 33.
Discussion
To calculate excess mortality from diabetes using an incidence-prevalence-mortality model results in rather robust estimates. There are differences in estimates depending on what data/method is used for input in the IPM-model. Based on face –validity and comparing with observed prevalence rates and disease duration, the excess mortality calculated using relative risks for mortality from literature are chosen for implementation in the CDM.
There is one major weakness in our dismod analysis. As mentioned before, the trend in incidence of diabetes used in the analyses was based upon the CMR-study. However it is likely that this trend can not be extrapolated to the whole Dutch population due to the screening study they have performed in 1999-2001. We have used the period 1996-2003 which might have dilute the trend effect of the screening study. However, at this moment we do not have other data which we could use for estimating a trend in incidence of diabetes. In 2005 we will perform sensitivity analysis on this specific part of the model.
5.
Diabetes health care utilization, costs and quality of life
JNS Struijs, SMC Vijgen, PHM van Baal
5.1 Diabetes health care utilization
As yet the health care utilization of patients with diabetes mellitus has been insufficiently quantified. Detailed information of multidisciplinary health care utilization of diabetes mellitus patients is not collected systematically in the Netherlands.
In order to explore the potential benefits of policy interventions, it is necessary to have
insight into the use of multidisciplinary health care services of patients with diabetes mellitus. An overview of current knowledge of health care utilization of diabetes mellitus patients is given in Appendix II. Data for Appendix II were obtained from the Dutch Second National Survey of General Practice (DSNGP-2) 34, the National Medical Register 35 and the National Register of ambulatory care 36. Furthermore, available Dutch studies in the literature with quantitative information were used 37-39.
General Practitioner care
GP care is quantified in “number of complaints expressed to the GP per year” i.e. partial contacts. A partial contact can be a telephone consult or a physical visit. A visit comprises on average 1.4 partial contacts. Male diabetes patients have on average 10.5 partial contacts a year and female patients 13.3, compared to non-diabetics who have on average 2.9 and 4.8 contacts. Of these contacts, only 3.3 (for men) and 3.2 (for women) are related to diabetes mellitus.
A clear age gradient is observed in the use of GP care. The younger diabetes patients visit their GP less frequently than diabetes patients in the older age classes, which is in line with other diseases 38.
Pharmaceuticals
Over 80% of the diabetes patients use prescribed medication versus only one third in non-diabetics. Diabetics are issued 25.8 prescriptions per year by their GPs versus 7.6
prescriptions a year for non-diabetic patients. The vast majority of the prescriptions (18.6) are not related to diabetes mellitus but to other complaints.
Medical specialist
Yearly, about three-quarters of type 2 diabetes mellitus patients consult a medical specialist 37. For type 1 diabetes mellitus patients the percentage is 96%. The mean number of visits to the medical specialist is slightly higher for women than for men, i.e. 2.7 for women versus 2.6 for men.
Hospital care
Yearly, about 10.3% of all diabetes patients are admitted to the hospital. This percentage varies from 10.1 for men to 10.5 for women. Male patients who are admitted to the hospital are admitted 2.4 times a year, while female patients who are admitted to the hospital are admitted 2.3 times a year. The average length of stay is 7.0 days for male diabetic patients and 8.0 days for female patients. For the average length of stay a clear age gradient is observed for women, while for men the average length of stay drops in the oldest age class. Most of the discharge diagnoses correspond to complications of diabetes.
Other health care services
Yearly, between 13% and 28% of the patients consult a dietician 37 39. The utilization of a dietician can not be specified for age and gender, although a distinction was made for diabetes patients under the age of 44 years (8.2%) and above the age of 44 (13.2%)39. About one fifth of the diabetes patients uses home care. The same percentage of diabetes mellitus patients visits a physiotherapist 37. Both numbers can not be specified by age and gender.
Data about nursing home care for diabetes patients are lacking. A tentative estimation is that about 20-30% of the nursing home residents have diabetes mellitus 40.
Summary and future research
The health care utilization of patients with diabetes mellitus has been quantified for GPs, pharmaceuticals, the medical specialists and hospital care.
Current knowledge of health care utilization with regard to other health care services such as home care, dietician, physiotherapist, podiatrist and nursing home care is insufficient. Also, the actual use of the diabetic nurse is still unclear. Therefore, additional data sources and registers need to be investigated to fill up current question marks in Appendix II.
Furthermore, a distinction between the health care utilization of diabetes patients with and without complications needs to be made, since the patterns of health care utilization of these different patient groups (with and without complications) differ considerably 41-43. Additional research is necessary.
5.2 Diabetes
costs
To be able to quantify the potential effect of prevention strategies in terms of preventable (health care) costs, accurate and recent data on the costs of diabetes are required. Although several studies have been performed in the past 10 years, new calculations are necessary. In this section we describe the studies that have been performed so far and the methods we use for our cost analysis.
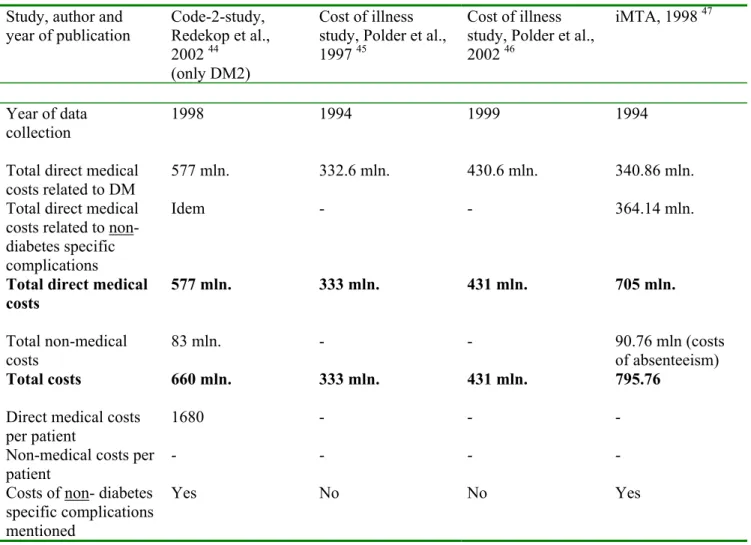
In the Netherlands, four diabetes cost studies have been performed in the past 10 years (table 5.1). Two different estimation procedures have been used in these studies; the top-down method and the bottom-up method. A bottom-up study lists the disease-related care activities (of care for diabetes) and relates these activities to costs. This is a labour intensive way of calculating costs, and can lead to a large variety in cost estimates14. The Code-2 study 44 is such a bottom-up study. In this study the data were collected by primary health care providers, who registered the resource utilization of their patients with type 2 diabetes. With this method it is difficult to determine the complete resource utilization of all diabetic patients in the Netherlands, and to determine which care activities are related to diabetes. The “cost of illness studies” by Polder et al. 45 46 are top-down studies. Top-down studies determine the total costs of a disease by allocating costs to specific combinations of health care services with diagnostic groups, based on the most suitable registrations. For diabetes this method results in an underestimation of the total costs, because costs of (some) complications are not allocated to diabetes but to cardiovascular diseases for example.
Table 5.1 Cost-studies of diabetes mellitus in the Netherlands (costs in euros)
Study, author and year of publication Code-2-study, Redekop et al., 2002 44 (only DM2) Cost of illness study, Polder et al., 1997 45
Cost of illness study, Polder et al., 2002 46
iMTA, 1998 47
Year of data collection
1998 1994 1999 1994 Total direct medical
costs related to DM
577 mln. 332.6 mln. 430.6 mln. 340.86 mln.
Total direct medical costs related to non-diabetes specific complications
Idem - - 364.14 mln.
Total direct medical costs 577 mln. 333 mln. 431 mln. 705 mln. Total non-medical costs 83 mln. - - 90.76 mln (costs of absenteeism) Total costs 660 mln. 333 mln. 431 mln. 795.76
Direct medical costs per patient
1680 - - -
Non-medical costs per patient
- - - - Costs of non- diabetes
specific complications mentioned
Yes No No Yes
The cost of illness studies by Polder et al.45 46 estimated diabetes costs at 333 and 431 million euro, respectively. For both studies this amounted to 1.2% of the total Dutch health care costs in the respective years. The costs relate to diabetes and specific diabetes complications. When comparing the cost of illness studies concerning the years of 1994 and 1999, it appears that within five years time the costs of care for diabetes increased with 100 million euros. However, in the 1999 study the costs of more diabetes specific complications were included than in the 1994 study (polyneuropathy, diabetic retinopathy, nephrotic syndrome, chronic glomerulonephritis, nephritis and nephropathy).
The two cost of illness studies did not take into account the costs of macrovascular complications (like coronary heart disease and stroke) and a number of (non-diabetes specific) microvascular complications caused by diabetes.
In the iMTA study 47 the outcomes were corrected for the underestimation due to not taking
into account the costs of all of the complications consequent to using the top-down method. They used the cost of illness study of 1997 to calculate the costs of diabetes and added
fractions of the costs of diabetes-related diseases (co-morbidity and complications). Fractions were based on a GP registration.
A complete list of micro- and macrovascular complications of diabetes with their
International Classification of Diseases 9 (ICD-9) codes is shown in table 5.2 47 48. Table 5.2 also shows the proportion from the total diabetes costs that can be attributed to the individual
complication, as calculated by iMTA in 1998. Diabetes itself (specific complications included) and the macrovascular complications caused the largest amount of costs (91%).
Table 5.2 List of all diabetes complications with ICD- 9 codes
Complication ICD-9-codes Proportion of the costs
iMTA 1998 Diabetes and specific complications included 250 48%
Microvascular 9%, of which
Ophthalmologic complications 4% (362 included)
Cataract 366 Partially sighted and blindness 369
Neurological complications 1% (357 included)
Peripheral autonomic neuropathy 337
Myasthenia syndrome 358
Peripheral vascular disorders 443 1%
Gangrene 785 Amputation 895-897
Skin and strengthening complications 2%
Chronic Neurophatical ulcer 707
Cellulites 682
Diseases of the genitourinary 1% (581 en 583 included)
Nephropathy, nephrotic syndrome 581
Nephritis 583
Chronical kidney failure 585
Proteinuria 791
Urinary infections 599
Macrovascular 43%
Hypertension 401-404
Coronary heart disease 410-414
Stroke 430-438
Congestive Heart Failure 428-429
The cost-of illness studies and the iMTA study have their limitations. The iMTA study that allows for correction of the underestimation of costs due to complications seems to be preferred to the cost of illness studies. The iMTA 47 study was based on the cost of illness study of 1997. To have more recent estimates of diabetes costs in this years cost calculations, we will use the iMTA method and apply this method to the costs of the cost of illness study 2002. This can not be done directly, because in 2002 more diabetes complications were included in the cost of illness study. Besides, the representativeness of the fractions used is doubtful. Therefore in our study we will use relative risks from the literature instead of a GP registration to determine these fractions.
To find out what part of every complication is caused by diabetes, population attributable risks (PAR) will be used. The next formula enables the calculation of the PAR of a complication caused by diabetes:
with P: prevalence of diabetes in the Netherlands in 1999; RR: relative risk for diabetic patients to develop a complication as compared to non-diabetics.
These population attributable risks have been multiplied by the costs for that complication, resulting in costs that could be attributed to diabetes.
The prevalence data of diabetes will be standardized to the age- and sex distribution of the Netherlands in 2004. The relative risks for complications implemented in the Chronic Disease Model will be used. These relative risks will be updated first. The etiological fractions will then be calculated for men and women separately in 5-year age classes. The PARs will be multiplied by the total costs of the complications as calculated in the cost of illness study 2002. The costs in 1999 will be corrected for inflation by using the consumer price indexes of Statistics Netherlands in 2004. The results of this study will be presented in 2005.
5.3 Diabetes Quality of life
The CDM is used to compare scenarios not only in terms of mortality but also in terms of morbidity. Two metrics that are often used to combine morbidity and mortality are quality adjusted life years (QALYs) and Disability Adjusted Life Years (DALYs). QALYs and DALYs have in common that they use a “weight” to correct for a health state that is less perfect. This weight is either called a disability weight (using DALYs) or a quality weight (using QALYs). A chronic disease with a severe impact on quality of life could have a disability weight of 0.9 on a scale of 0 (perfect health state) to 1 (death). Correspondingly, this disease would be valued with a quality weight of 0.1 on a scale of 0 (death) to 1 (perfect health state). QALYs aggregate the actual health quality over time, DALYs aggregate the loss of health compared to perfect health. In the CDM we use DALY weights instead of QALY weight to calculate the health quality of time for several reasons:
- daly weights are more easily available for more diseases;
- the same methodology is used to derive Daly weights for all diseases so the ranking is more consistent;
- the use of DALY weights is common within the RIVM to calculate burden of disease. How the quality adjusted life years are estimated in the CDM, is described in more detail in the RIVM report 260706002 49. In 2005 a review of the literature on quality of life for diabetes patients will be finished. The results of the review will be used to put the estimated quality adjusted life years into perspective.
Part III Prevention of diabetes
6.
Risk factors for diabetes incidence and primary
prevention
MAM Jacobs-van der Bruggen
6.1 Introduction
This part of the Technical Report focuses on factors concerning the primary prevention of diabetes mellitus. Primary prevention strategies intend to prevent or delay the development of new cases of diabetes by modifying risk factor exposure in a diabetes-free population. We focus on the risk factors body mass index (BMI), physical inactivity, smoking, and alcohol. These risk factors were already included as risk factors for diabetes (BMI and physical inactivity) or other diseases (smoking and alcohol) in the CDM-2003. The distribution of risk factors in the Dutch population (prevalence), and their relation with diabetes incidence (relative risks) are input variables in the model. The purpose of this part of the report is to justify the updated or new diabetes related input in the CDM, and to review international results of - primary prevention of diabetes - trials.
6.2 Methods
Prevalence of risk factors for diabetes incidence in the Dutch population
Prevalence data of risk factors in the Dutch population were retrieved from Dutch registries. For overweight, physical inactivity and alcohol consumption, data were used from the lifestyle monitoring surveys (Permanent Onderzoek Leefstijl, POLS) from Statistics Netherlands (CBS). Smoking data were obtained from the Dutch organization for public health and smoking (Stichting Volksgezondheid en Roken, STIVORO).
Relative risks of risk factors for incident diabetes
Relative risks for diabetes incidence for BMI, physical inactivity, smoking and alcohol consumption were determined from the international literature. Relevant studies were obtained through Pubmed searches, RIVM diabetes-experts, and references tracking of the articles and reviews retrieved. Studies were used to estimate the relative risk of the risk factor involved if the following criteria were met:
• publication year 1990-2004
• prospective longitudinal cohort study on diabetes incidence • at least 50 incident cases of diabetes
• Caucasian population
• measurement of risk factor in units or categories equal or convertible to categories in the CDM
• diabetes incidence rate < 10% if risk estimates are reported as odds ratios because odds ratios cannot be interpreted as relative risks if the incidence is > 10%, and
Dutch monitoring studies
Relative risks for body mass index, physical inactivity, smoking and alcohol consumption on diabetes incidence were also determined for a Dutch population for which data were available at the RIVM. These calculated relative risks were compared to the updated or new input in the CDM (as estimated from the international literature) for validation. If the results differ substantially, sensitivity analysis will be performed when modeling diabetes scenarios to quantify the variation in outcomes when using different relative risks.
The study population comprises Dutch people aged 20-59 years at baseline from Doetinchem and Maastricht, who participated in monitoring studies between 1987 and 2002. The
monitoring studies were conducted in three rounds (Peilstationsproject Hart- en vaatziekten, 1987-1991 50, MORGEN-project, 1993-1997 51 52 and the Doetinchem Cohort Study, 1998-2002 53) and took place at the Municipal Health Service in each town. Respondents filled in two self-administered questionnaires and underwent a medical examination.
Inhabitants from Doetinchem who participated in the “Peilstationsproject Hart- en
vaatziekten”, between 1987 and 1991 were invited for reevaluations 6 and 11 years later in the monitoring studies of 1993-1997 and 1998-2002. Baseline data for Doetinchem
participants (collected during 1987-1991) consisted of demographic characteristics, presence of chronic diseases, risk factors for chronic diseases and anthropometric measurements. Self-reported diabetes status, year of diagnosis and familial diabetes were retrieved from the latest follow-up survey available (i.e. 1993-1997 or 1998-2002).
In Maastricht, cross-sectional samples were drawn in 1987-1992 and 1993-1997 in which baseline data were collected. Self reported diabetes status and year of diagnosis were assessed with a short questionnaire that was sent to the participants in 1998.
Baseline and follow-up data were linked for 21,939 people. From this dataset we excluded individuals with baseline diabetes, pregnancy or cardiovascular disease. Furthermore we excluded individuals with probable type 1 diabetes at follow-up, individuals who were not Dutch and individuals with missing values for risk factors on diabetes incidence. The dataset for the analysis comprised 20,103 Dutch subjects of whom 292 developed diabetes. Duration of follow-up ranged from 0.5 to 14 years with an average of 7.7 year.
Analysis,
Body mass index was modeled continuously (per unit BMI) as well as in the CDM
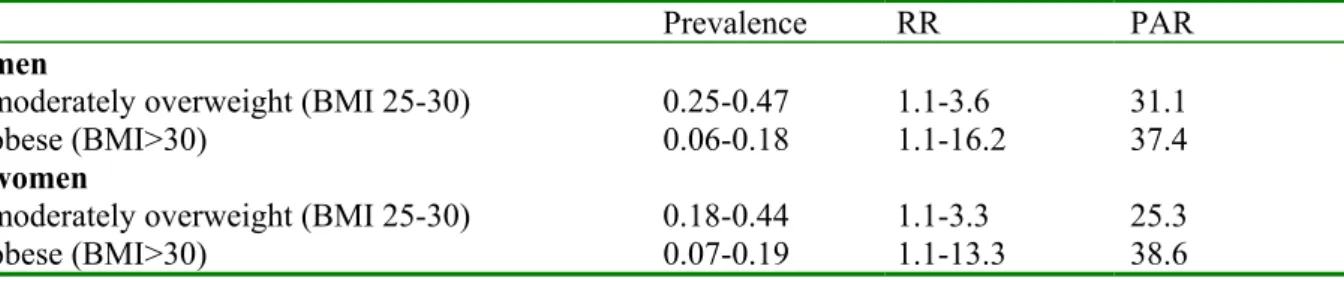
categories; moderately overweight (BMI 25-30) versus normal weight (BMI<25), and obese (BMI ≥30) versus normal weight (BMI<25). The analysis were adjusted for age, physical inactivity and smoking.
Physical inactivity was modeled as active (at least 4 hours of physical activity each week) versus inactive. From the available data it was not possible to make (three) categories
according to the CDM. The analysis were adjusted for age, BMI (continuously) and smoking. Smoking was categorized according to the CDM classes as never, former or current smoking. Analysis were adjusted for age BMI and physical inactivity.
Alcohol consumption was modeled in the sex-specific CDM-categories. However, because of the low prevalences in the highest category (excessive drinking), heavy and excessive
drinking were combined. The analysis were adjusted for age, BMI and smoking.
Population Attributable Risk (PAR)
The PAR is a measure that expresses (in percentages) how many of the cases of diabetes can be attributed to unhealthy behavior (having the risk factor), or stated otherwise; how many of the new cases of diabetes could be prevented if the risk factor concerned would be totally