Emissions and targets of
greenhouse gases not
included in the Emission
Trading System 2013-2020
Analysis of the impact of
the European Effort
Sharing Decision for the
Netherlands
Emissions and targets of greenhouse
gases not included in the Emission
Trading System 2013-2020
Analysis of the impact of the European
Effort Sharing Decision for the
Netherlands
Martijn VerdonkEmissions and targets of greenhouse gases not included in the Emission Trading System 2013-2020 © PBL Netherlands Environmental Assessment Agency The Hague, 2011
PBL publication number: 500253003 ISBN: 978-90-78645-63-4
Corresponding author
Martijn Verdonk, martijn.verdonk@pbl.nl
With thanks to
C. Volkers (Energy research Centre of the Netherlands ECN))
B. Daniëls (Energy research Centre of the Netherlands (ECN))
K. Peek (PBL Netherlands Environmental Assessment Agency) T. de Ligt (NL Agency) English-language editing Annemieke Righart Layout Studio RIVM
This publication can be downloaded from: www.pbl.nl/en.
Parts of this publication may be reproduced, providing the source is stated, in the form: PBL Netherlands Environmental Assessment Agency, title and year of publication.
PBL Netherlands Environmental Assessment Agency is the national institute for strategic policy analysis in the field of environment, nature and spatial planning. We contribute to improving the quality of political and administrative decision-making by conducting outlook studies, analyses and evaluations in which an integrated approach is considered paramount. Policy relevance is the prime concern in all our studies. We conduct solicited and unsolicited research that is both independent and always scientifically sound.
3
Contents
Samenvatting 6 Findings 7 Summary 8 Introduction 9 Key messages 9 Full Results 13 1 Introduction 142 ESD emission caps for the Netherlands 2013-2020 16
2.1 Introduction 16
2.2 ESD targets according to EC proposal 17
2.3 Alternative to European Commission proposal 18 2.4 Uncertainties 20
2.5 Comparison of EC proposal and alternative 22
3 Adjustment of non-ETS emission forecast for 2020 24
3.1 Method 24 3.2 Results 25
3.3 Historical non-ETS emissions 27 3.4 Uncertainties 27
4 Adjustment of uncertainty range in 2020 forecast 28
4.1 Method 28 4.2 Results 28
References 30 Appendices 31
6 | Emissions and targets of greenhouse gases not included in the Emission Trading System 2013-2020
Samenvatting
In dit rapport berekent het Planbureau voor de Leefomgeving (PBL) voor de periode 2013-2020 de jaarlijkse emissieplafonds voor de sectoren in Nederland die niet onder het Europese emissiehandelssysteem (ETS) vallen; de belangrijkste niet-ETS-sectoren zijn verkeer, de gebouwde omgeving en een deel van de landbouwsector. De berekening is gebaseerd op de rekenprocedures en gegevensbronnen zoals voorgesteld door de Europese Commissie in het kader van het Effort Sharing-besluit. Om de resultaten te kunnen duiden, introduceren en evalueren we ter vergelijking ook een alternatieve berekening. Bovendien bevat dit rapport een beperkte actualisatie van de verwachte feitelijke uitstoot in 2020 door Nederlandse niet-ETS-sectoren. Daarnaast zijn de effecten onderzocht van onzekerheden die zijn gerelateerd aan het monitoren van de uitstoot van broeikasgassen bij het bepalen van de emissieplafonds en de verwachte feitelijke uitstoot.
Volgens het voorstel van de Europese Commissie zou in 2020 het emissieplafond voor de niet-ETS-sectoren in Nederland 105 megaton CO2-equivalenten bedragen. Dit
is hoger dan de alternatieve berekening, die resulteert in een plafond van 103 megaton CO2-equivalenten. Het
verschil kan worden verklaard uit het gebruik van uiteenlopende gegevensbronnen. Een nadeel van de in het voorstel van de Europese Commissie gebruikte bronnen is het gebrek aan transparantie van een deel van de gegevens. Hierdoor kunnen de berekende plafonds slechts gedeeltelijk worden geverifieerd. Voor het alternatief geldt dat de gebruikte gegevensbronnen
mogelijk niet beschikbaar zijn in andere Europese lidstaten. Hierdoor kan het lastig zijn om een Europese aanpak te baseren op het gepresenteerde alternatief. De berekende emissieplafonds moeten worden beschouwd als indicaties, omdat er verschillende onzekerheden zijn over de gebruikte emissiegegevens. De verwachting is dat de meeste onzekerheden kleiner worden wanneer de definitieve statistieken beschikbaar zijn. Echter, zolang de uitstoot in het basisjaar (2005) kan worden aangepast zodra er een betere meetmethode beschikbaar komt, zullen de emissieplafonds tot en met 2020 onzeker blijven. De uitstoot in het basisjaar wordt namelijk gebruikt om de plafonds te berekenen. Als ervoor wordt gekozen om het basisjaar niet aan te passen bij het beschikbaar komen van een betere meetmethode, dan kan dat bij overheden en bedrijven leiden tot andere inspanningen om de uitstoot van broeikasgassen te verminderen. De verwachte feitelijke uitstoot verandert namelijk bij het toepassen van een betere meetmethode, terwijl het plafond dan niet zou veranderen.
Op basis van de beperkte actualisatie van de prognose uit 2010, verwachten we dat de feitelijke uitstoot door niet-ETS-sectoren in 2020 104 megaton CO2-equivalenten
bedraagt, met een onzekerheidsmarge van 96 tot 112 megaton CO2-equivalenten. De conclusie luidt dat de
feitelijke uitstoot in 2020 naar verwachting rond de berekende plafonds van het Effort Sharing-besluit liggen. In deze herberekening is het beleid van de huidige regering niet meegenomen.
7 Bevindingen |
Fi
ND
iN
g
S
Fi
ND
iN
g
S
8 | Emissions and targets of greenhouse gases not included in the Emission Trading System 2013-2020
Emissions and targets of
greenhouse gases not
included in the Emission
Trading System 2013-2020
Analysis of the impact of the European Effort
Sharing Decision for the Netherlands
Summary
This report evaluates the proposal from the European Commission (EC) to calculate Member States’ targets for emissions not included in the Emission Trading System (ETS) (as announced in the so-called Effort Sharing Decision). The calculation procedures and data sources proposed by the EC have been used for calculating non-ETS emission targets for the Netherlands, for the years from 2013 to 2020. In order to compare results, an alternative approach also was introduced and evaluated. In this approach more transparent data sources were used. Furthermore, the report updates the emission forecast of non-ETS emission levels in the Netherlands, for 2020, and evaluates the consequences of excluding monitoring uncertainties from the updated forecast. It is concluded that, for the Netherlands, the non-ETS emission caps as proposed by the EC would result in an emission cap of 105 Mt CO2 equivalent by 2020. This is
higher than in the alternative approach, which would result in a cap of 103 Mt CO2 equivalents. The difference
is explained by the different data sources that were used. A drawback of the data sources used in the EC proposal is the lack of transparency of part of the data, which resulted in an additional uncertainty as not all issues could be verified. However, other Member States may not have suitable data sources available in case the EC decides to adopt the alternative approach.
Both emission caps are estimates, as there are several uncertainties related to the emission data used. Most of the uncertainties are expected to diminish once the definite emission statistics become available. However, as long as the emission data for the base year (2005) continue to be adjusted according to improved monitoring practices, the non-ETS emission caps for the period up to 2020 will remain uncertain. Fixing the emission caps by not allowing recalculation for the base year, would result in a factual adjustment of the ‘effort’ to reduce emissions once improvements in monitoring are implemented.
Based on a 2010 forecast, and including both an updated division of emissions into ETS and non-ETS emissions and a revised methodology for calculating nitrous oxide emissions, we estimated that non-ETS emissions in the Netherlands would be 104 Mt CO2 equivalents by 2020,
with an uncertainty range of between 96 and 112 Mt CO2
equivalents. We conclude that non-ETS emission levels by 2020 would be around the calculated ESD caps. Policies of the current Dutch Government have not been included in this update.
9
Findings |
Introduction
In 2009, the Effort Sharing Decision (ESD)1 was adopted
by the European Parliament and Council. The ESD is part of the European Climate and Energy Package that should result (together with other legislation, such as the revised Emission Trading Directive – or ETS Directive) in a European-wide emission reduction of 20% between 1990 and 2020. The Effort Sharing Decision ‘shares’ the required European effort in sectors (such as transport) that are not covered by the ETS Directive, among Member States. Although the relative emission reductions required by Member States for the non-ETS sectors were already agreed on in 2009 (for the Netherlands 16% reduction between 2005 and 2020), emission caps for the period 2013 to 2020 (expressed in megatons (Mt) CO2
equivalent) are yet to be determined. Member States and the European Commission are currently discussing the methodology for determining these exact caps. Based on the choice of methodology, the European Commission will determine the definite caps at the end of 2012. This report is meant to contribute to the current European decision-making process of determining the method for ESD target calculation. The results will provide the Dutch Ministry of Infrastructure and the Environment (I&M) with indicative ESD targets and non-ETS emission levels for the Netherlands. The most recent proposal from the European Commission was evaluated to estimate the impact for the Netherlands. Also, an alternative approach was introduced and evaluated. Another issue in the discussions between Member States and the European Commission is that of whether or not ESD caps should be adjusted if monitoring methods and/or emission factors would be improved. For that purpose, this report evaluates how excluding monitoring improvements would affect the uncertainty range for forecasted non-ETS emissions for 2020 in the Netherlands.
Furthermore, this report also presents revised data on non-ETS emissions by 2020, as was forecasted in the ‘Referentieraming 2010-2020’, published by the ECN and PBL in 2010. Based on that forecast, new insights into ETS and non-ETS emissions, in general, and an improved methodology for dividing national emissions into ETS and non-ETS emissions were incorporated into this report,
as was the revised methodology for calculating nitrous oxide emissions from agriculture. The non-ETS emission data presented in this report, therefore, are not new but a revision of a previous forecast. These results are relevant to the Dutch Government for assessing whether or not climate policies need to be adjusted.
Key messages
Effort Sharing Decision targets according to the European Commission’s proposal are less stringent than the alternative
For this report, two approaches for calculating the ESD emission caps were applied. The approach used in the proposal from the European Commission (EC) was found to result in ESD caps that would be slightly lower than those used in an alternative approach (see Table S1). According to the EC proposal, the ESD cap for 2020 would amount to 105 Mt CO2 equivalents, while for the
alternative cap this would be 103 Mt CO2 equivalents. The
main difference between the two approaches is in the data sources that were used for calculating the non-ETS emissions in the year 2005. This year serves as the base year for calculating the ESD cap for 2020. The alternative approach uses installation-specific data only, whereas the EC proposal partially uses aggregated data (not installation-specific).
ESD caps are uncertain in both approaches
The presented emission caps are estimates that were calculated according to the most recent statistics available. The definite caps, to be determined by the European Commission in 2012, may deviate from these estimates (by up to several megatons). Such may be the case once more recent statistics have been incorporated. In the current estimates, there is a significant uncertainty about the applied monitoring methods related to the calculation of nitrous oxide emissions from agriculture. In addition, the cap for 2013 in both approaches is equally uncertain, as the 2010 emission level was based on a forecast. The emission level in 2010 is needed in order to calculate the cap in 2013. Another significant uncertainty is in the extent to which both approaches take into account a change in the definition of emissions from fuel combustion. After the first ETS trading period (that ran from 2005 to 2007), some emissions from
Table S1
ESD emission caps according to EC proposal and the alternative (Mt CO2 equivalents)
Method 2013 2014 2015 2016 2017 2018 2019 2020
European Commission proposal 119 117 115 113 111 109 107 105
10 | Emissions and targets of greenhouse gases not included in the Emission Trading System 2013-2020
fossil-fuel combustion where excluded in the following trading period (running from 2008 to 2012). Therefore, as the base year 2005 belongs to the first trading period and ESD caps are to be calculated based on the emission levels in the second trading period, the emission data on 2005 need to be corrected for this change. If the EC decides to correct the ESD target calculation accordingly, the ESD caps presented here are likely to have been underestimated.
Data sources used in the EC proposal are less transparent
Some of the data used for calculating the ESD caps according to the EC proposal had been aggregated and not installation-specific. As these data could not be verified, some uncertainty has to be added to the calculation result based on the EC proposal. It was not possible to verify whether or not the aggregated data had been adjusted for the change in the definition of emissions from fuel combustion. Also, it is uncertain which companies were assumed to be included in or excluded from ETS after 2006. The aggregated data were published in January 2007 by the European Commission. The alternative approach takes into account companies that have been added or excluded after 2006.
Calculation of non-ETS emissions results in inconsistent figures
Calculation procedures in both the EC proposal and the alternative used for determining the levels of non-ETS emissions introduce a significant inconsistency. According to these procedures, ETS emissions need to be subtracted from national emissions. ETS and national emission statistics, however, use different emission factors for calculating CO2 emissions from the burning of coal and
natural gas. This results in inconsistent non-ETS figures. It is estimated that this inconsistency has led to a significant overestimation of non-ETS emissions for the year 2005, affecting both the ESD targets for the 2013–2020 period and the division of forecasted emissions for 2020 in an ETS and non-ETS part. Although the effort to reduce emissions will not be affected by this inconsistency, it does result in non-ETS emissions that cannot be related to emission sources.
Non-ETS emission levels estimated to be around ESD cap by 2020
Based on the revised forecast from 2010, we estimated that non-ETS emissions by 2020 will be 104 Mt CO2
equivalents, with an uncertainty range of 96 to 112 Mt CO2
equivalents. If the emission cap is calculated according to the EC proposal, the non-ETS emissions are expected to be around the ESD cap of 105 Mt CO2 equivalents by 2020.
This means that the chance of meeting this cap will be around 50%. If the ESD cap is calculated according to the alternative method, the chance of meeting the alternative ESD cap of 103 Mt CO2 equivalents is slightly lower. In
this revised forecast, only new insights relating to the
division of national emissions into ETS and non-ETS are incorporated. This means that policies by the current Dutch Government have not been included.
Non-ETS emission levels revised upwards
Compared to the forecast in the study ‘Referentieraming 2010-2020’ by ECN and PBL (2010), the revised non-ETS emissions in this report are 1 to 2 Mt CO2 equivalents
higher. This can be explained by the fact that an improved method was used for dividing national emissions into ETS and non-ETS emissions. Higher non-ETS emission levels were found in large-scale power production, the energy extraction industry and horticultural sectors. However, non-ETS emission levels from industry were found to be slightly lower. Non-CO2 emissions were lowered as
a result of an adjustment in the calculation of nitrous oxide emissions from agriculture. Although the non-ETS emissions in this report are higher than previously forecasted, the ESD caps in this report are also estimated to be higher, resulting in similar conclusions with regard to meeting those caps. As company participation in the Emission Trading System could alter during the period up to 2020, it is suggested that ETS shares are revised periodically.
Uncertainties significantly lower when monitoring is excluded
Excluding uncertainties related to monitoring has a significant impact on the uncertainty range related to non-ETS emissions for 2020. In such a case, the uncertainty range would be lowered from between 96 and 112 Mt CO2 equivalents to between to 100 and 107.
Excluding uncertainties related to the monitoring of non-CO2 greenhouse gas sectors is most significant,
which can be explained by the difficulty of monitoring such emissions. Similar to the revision of the emission forecast, only new insights relating to the division of the national emissions into ETS and non-ETS are incorporated. This means that new policies by the current Dutch Government have not been included.
Excluding monitoring uncertainties could alter the ‘effort’
Excluding monitoring uncertainties not only has an impact on the range of the forecasted emissions, but also on target setting. If these uncertainties were to be excluded, ESD caps would not have to be adjusted and would become ‘fixed’. The consequence of fixed caps, however, would be that the effort required to meet the cap would change along with the monitoring adjustment. If, for example, a monitoring adjustment leads to lower emissions, while the ESD cap was fixed, the effort to meet the cap is lowered as well. The opposite is also true: higher calculated emissions result in an increased effort. An option to prevent the effort from changing is to fix the monitoring methods as well, but this is not good practice according to international monitoring guidelines.
11
Findings |
Those guidelines require methodological improvements to be incorporated in national emission inventories. It is therefore suggested to maintain the current practice (i.e. allow recalculation of the base year when monitoring methods are improved).
Note
13 Bevindingen |
FULL RESUL
TS
FULL RESUL
TS
14 | Emissions and targets of greenhouse gases not included in the Emission Trading System 2013-2020
O
NE
introduction
In 2010, the ECN and the PBL published the emission forecast ‘Referentieraming 2010-2020’, hereinafter referred to as ECN/PBL (2010). In that forecast, assumptions were made on how to divide forecasted emissions into two groups: those belonging to the Emission Trading System (ETS) and those belonging to the Effort Sharing Decision (ESD) (i.e. non-ETS emissions). In addition, an indicative ESD (non-ETS) target for the year 2020 was calculated.
During 2010 and 2011, new insights into both emissions and procedures for target calculation were gained. This included new insights into which installations would need to be included in the third phase of ETS, and the level of adjustment of the ETS cap as a result of the scope expansion. It is expected that these new insights will have an impact on emission levels and targets as calculated in ECN/PBL (2010). The new insights into emissions and rules for target calculation concern the following:
1. The Dutch Government notified the EC of additional ETS emissions as a result of the expansion of the ETS scope from 2013 onwards.1 This notification provides
an installation-specific insight into historical emission levels of companies following this expansion, whereas in ECN/PBL (2010), these emission levels were estimated using calculations on a (sub)sectoral level. This notification has been approved by the EC. 2. The process of comitology, which determines the rules
for ESD target calculation, has provided more clarity for the calculation of ESD targets (especially related to the initial cap and the starting point in 2013).
3. The method for separating ETS from non-ETS emissions, as applied in ECN/PBL (2010), has been updated.
The purpose of this report is to provide the Dutch Ministry of Infrastructure and the Environment (I&M) with background information related to the Effort Sharing Decision (ESD). Firstly, the procedure to determine the ESD (non-ETS) targets for Member States (MS) is currently in a ‘comitology procedure with scrutiny’ and will be decided on in 2011.2 This report provides indicative
calculations on the impact of the rules currently discussed on the ESD target for the Netherlands, and should contribute to the European decision-making process (to be finalised in 2011). In 2012, the European Commission ultimately will determine the ESD targets for all Member States, based on the method that will be decided on in 2011. Secondly, the Dutch Government requires not only the latest insights into the targets (calculated in absolute emissions), but also into their impact on the expected emission levels by 2020 as estimated in ECN/PBL (2010). If the emission levels as expected in that forecast are significantly revised, national climate policies may also have to be adjusted.
This report addresses the following questions: 1. What are the annual ESD emission caps over the
2013-2020 period, according to the most recent insights into emission levels and setting targets? 2. Will the forecasted non-ETS emission levels for 2020
15
1 Introduction |
ONE
if so, to what extent?
3. What would have been the historical non-ETS emission levels (from 1990 onwards) in the sectors included in the Dutch policies, when calculated according to the broader ETS scope for 2013 and beyond?
4. To what extent will the uncertainty range of the 2020 emissions change, according to the forecast, if uncertainties related to monitoring are excluded? The third question focuses on the historical emissions per sector. Anwser to this question (and to question number two) may help the Dutch Government to determine sectoral climate policies. The fourth question is relevant, as some Member States (including the Netherlands) currently are discussing whether or not uncertainties about monitoring should be included in ESD target setting procedures. The uncertainty range in ECN/PBL (2010) of the 2020 emissions did include these uncertainties.
This part of the report is structured according to these four questions.
Notes
1 The notification according to Article 9a (2) of the revised ETS Directive.
2 The ESD targets will be determined by the Commission in 2012, using the method that will be decided on by mid-2011.
16 | Emissions and targets of greenhouse gases not included in the Emission Trading System 2013-2020
TWO
ESD emission caps for the
Netherlands 2013-2020
2.1 Introduction
In 2009, the Effort Sharing Decision (ESD)1 was adopted
by the European Parliament and Council. The ESD is part of the European Climate and Energy Package and should result (together with other legislation, such as the revised Emission Trading Directive) in an emission reduction of 20% between 1990 and 2020. The decision ‘shared’ the required European efforts in the non-ETS sectors among Member States. Collectively, these efforts will lead to a reduction of 10%, between 2005 and 2020. The ‘shared effort’ for the Netherlands, will result in a reduction of 16% over that period. Also, intermediate emission caps until 2020 are set in a linear manner starting in 2013.2
Although the relative emission reductions required by Member States in the non-ETS sectors were already agreed on in 2009, emission caps expressed in megatons (Mt) CO2 equivalent are yet to be determined. In order
to determine the ESD emission caps for the 2013–2020 period, the Member States are currently discussing the methodology (in a ‘comitology regulatory procedure with scrutiny’).
In order to feed this discussion between Member States and the European Commission, this report calculates the ESD caps for the Netherlands, according to the most recent proposal by the European Commission. It also presents an alternative to that proposal, to compare the results and to identify weaknesses and/or strengths of the EC proposal. Also, this alternative serves as a base to divide the emissions, as forcasted in ECN/PBL (2010),
into an ETS and non-ETS part (see Chapter 3). The data that were used in the EC proposal could not be used for making such a division, as they were partially aggregated. This report discusses the following methods:
A. Proposal by the European Commisson, according to the most recent EC memorandum (or ‘non-paper’) (dated 18 January 2011). In this proposal, 2005 baseline emissions have been based on data from the Community Independent Transaction Log (CITL) for 2005, corrected for the scope adjustment between the trading periods from 2005 to 2007 and 2008 to 2012, and for emissions from installations at compa-nies that were included (‘opt-in’) or excluded (‘opt-out’) from ETS.
B. The alternative is based on an earlier non-paper by the European Commission (dated 9 November 2010). This non-paper was less specific on data sources, which resulted in an alternative interpretation for determining the 2005 baseline emissions. The basis for this method is a 2006 inventory of emissions from installations that were to be included in the second National Allocation Plan for the Netherlands. This inventory has also been corrected for scope changes between the subsequent trading periods, and used different sources than in the EC proposal.
Both methods and their implications for the ESD emission caps are discussed in the following sections.
17
2. ESD emission caps for the Netherlands 2013-2020 |
TWO
2.2 ESD targets according to EC
proposal
2.2.1 Methodology and data sources
In the proposal from the European Commission, 2005 baseline ETS emissions have been based on emission data from the CITL. These emissions originate from installations in sectors covered by the scope of ETS in the 2005–2007 period. However, the baseline emission data used for setting the Effort Sharing Decision (ESD) target for 2020 should be based on 2005 ETS emissions from installations in sectors covered by the ETS scope over the 2008–2012 period. Therefore, the 2005 CITL data had to be corrected for changes between the ETS periods from 2005 to 2007 and 2008 to 2012. After this correction, the initial ESD emission cap for 2020 was calculated (step 1), followed by the initial cap for 2013 (starting point) (step 2). In step 3, the initial caps were adjusted for scope changes between the trading periods from 2008 to 2012 and 2013 to 2020, and for opt-ins of installations at companies in ETS in the 2008 to 2012 trading period (which were excluded in step 1). Following these steps, the following formulae were applied:
Step 1
The initial cap for 2020 is calculated using the following formula:
Initial cap for 2020 = (A-B-C-D-E)*(1+F)
Table 1 contains the definitions and values for the Netherlands of the variables of this formula.
Step 2
The starting year for the ESD emission caps is 2013. According to the ESD, these caps should decline (for Member States that must reduce their emissions) linearly, between 2013 and 2020. The ESD emission cap for 2013 has been calculated as follows:
ESD emission cap2013 = average ESD emissions for the
2008–2010 period = A’- B’- C’, in which:
A’= average total emissions excluding LULUCF, between 2008 and 2010 (source: NIR2011, dated 11 April 2011) B’= average CO2 emissions from civil aviation, between
2008 and 2010 (source: NIR2011, dated 11 April 2011) C’= average verified emissions from installations covered by the ETS, between 2008 and 2010 (source: CITL, dated April 2011).
The emissions from nitric acid production were subtracted from the CITL ETS emissions between 2008 and 2010, because the initial ESD emission cap was assumed to be excluding any opt-ins after NAP2 was determined. CITL data, however, include the emission of such opt-ins. The initial cap was adjusted for such opt-ins after calculation of the initial cap. As 2010 emission data is lacking, the emissions from nitric acid production in 2010 were assumed to be equal to those of 2008. For the remaining 2010 emissions, data from a forecast was used. These data will be published in the short-term forecast by the PBL (forthcoming). 3
Under the Effort Sharing Decision, emission caps will decline linearly, between 2013 and 2020.
Table 1
Definition of variables, figures and data sources as applied in the EC proposal for the Netherlands
Variable Definition Value for the
Netherlands (Mt
CO2 equivalents)
Data source used
A Verified national 2005 emissions (excluding LULUCF) 211.11 NIR2011 (dated 11 April 2011) B Verified 2005 CO2 emissions from domestic civil aviation 0.04 NIR2011 (dated 11 April 2011) C Verified 2005 emissions from installations included in the
ETS 2005–2007 period
80.35 CITL (dated April 2011)
D Verified 2005 emissions from installations included (counted as positive) or excluded (counted as negative) in the ETS 2008–2012 period, according to the adjusted scope
-2.14 Commission Decision on NAP2 for the Netherlands (16 January 2007)
E Verified 2005 emissions from installations opted out in 2005 but included in the ETS 2008–2012 period
6.06 Commission Decision on NAP2 for the Netherlands (16 January 2007) F Emission reduction (%) -16% ESD Annex II
18 | Emissions and targets of greenhouse gases not included in the Emission Trading System 2013-2020
TWO
Step 3
The initial caps for the 2013–2020 period have been adjusted for the scope expansion of ETS from 2013 onwards, and the opt-in of N2O emissions from nitric acid
production.4 The following formulae have been used for
these adjustments:
Adjusted ESD cap in the year y = initial ESD capy – Gy – Iy
Scope expansion from 2013 (Gy) = H – H*0.0174*(y-2010),
in which:
Gy = the adjustment due to the scope expansion in the
year y
H = the notified emissions according to Article 9a(2) of the revised ETS Directive in the year 2010 (data source: Dutch Ministry of Infrastructure and the Environment (I&M) and the European Commission)
Opt-in of N2O emissions from nitric acid production (Iy) =
J – J*0.0174*(y-2010), in which:
Iy = the adjustment due to the nitric acid opt-in in the year
y
J = the average annual emission allowances for the 2008– 2012 period, allocated to the nitric acid opt-in
The 0.0174 factor is the reduction factor according to Article 9 of the revised ETS Directive.
2.2.2 Results from the European Commission
proposal
Table 2 presents the ESD emission caps for the
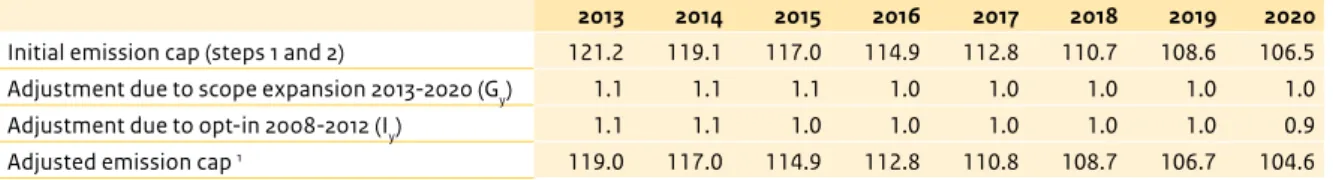
Netherlands for the 2013-2020 period. The initial cap has been adjusted for opt-ins and scope expansion by roughly 2 Mt CO2 equivalents, annually. From year to year, the
adjusted ESD emission cap will decrease by roughly 2.1 Mt CO2 equivalents.
For comparison, in ECN/PBL (2010), the emission cap after scope expansion was estimated to be 99 Mt CO2
equivalents for 2020. This means that, compared with Table 2, the emission cap for 2020 would be almost 6 Mt CO2 equivalents higher than previously estimated in ECN/
PBL (2010). This difference can be explained as follows: • Firstly, the main the difference can be explained by the
adjustment for the scope expansion. In ECN/PBL (2010), this adjustment was based on the expected actual emission levels (roughly 6.6 Mt by 2020). It was assumed that the ETS cap also would be adjusted with the actual amount of CO2 emissions moving from
non-ETS to ETS. This assumption is no longer valid, as the EC approved a smaller amount of emissions (than actual) to be notified. The difference in this adjustment between this report and ECN/PBL (2010) is roughly 5.5 Mt CO2 equivalents.
• Secondly, the non-ETS emissions in 2005 are lowered by 0.5 Mt CO2-equivalents in comparison with ECN/PBL
(2010), as a result of an adjustment in monitoring N2O
emissions from agriculture. This lowers the ESD cap for 2020 compared to ECN/PBL (2010).
• Thirdly, the ETS baseline emissions according to the EC proposal are 1.2 Mt CO2 equivalents higher than in ECN/
PBL (2010). In ECN/PBL (2010), calculations on a (sub) sectoral level were applied to estimate the 2005 non-ETS emission levels, whereas the EC proposal uses aggregated data to correct the 2005 CITL data for the change in scope.
2.3 Alternative to European
Commission proposal
2.3.1 Methodology and data sources
As an alternative to the EC proposal, a different interpretation for determining the 2005 baseline emissions was applied. However, the calculation procedure applied for this alternative is similar to that of the EC proposal, in order to be able to compare the results. According to the non-paper from the EC (dated
Table 2
ESD emission caps for the Netherlands according to the proposal by the European Commisson (Mt CO2
equivalents)
2013 2014 2015 2016 2017 2018 2019 2020
Initial emission cap (steps 1 and 2) 121.2 119.1 117.0 114.9 112.8 110.7 108.6 106.5 Adjustment due to scope expansion 2013-2020 (Gy) 1.1 1.1 1.1 1.0 1.0 1.0 1.0 1.0 Adjustment due to opt-in 2008-2012 (Iy) 1.1 1.1 1.0 1.0 1.0 1.0 1.0 0.9
Adjusted emission cap 1 119.0 117.0 114.9 112.8 110.8 108.7 106.7 104.6 1 Excluding shifts between ETS and non-ETS AFTER the scope expansion from 2013.
19
ESD emission caps for the Netherlands 2013-2020 |
TW
O
9 November 2010), the ESD emission cap for 2020, for Member States with a reduction target (such as the Netherlands), should be calculated as follows:
The annual emission allocation of a Member State in the year 2020 shall be calculated by subtracting the quantity of verified greenhouse gas emissions from installations covered by Directive 2003/87/EC in the period from 2008 to 2012 in the respective Member State, expressed in tonnes of carbon dioxide equivalent as provided in Annex I of this Decision, from its total greenhouse gas emissions for the year 2005 excluding the quantity of carbon dioxide emissions under the source category ‘1.A.3.a Civil Aviation’ and reducing the outcome by the percentage set under Annex II of the Decision No. 406/2009/EC.
In this report, the following interpretation has been applied in the alternative, in order to determine the 2020 cap:
1. The 2005 emissions from installations included in the second phase of ETS (excluding any opt-ins) were subtracted from the total national 2005 emissions, excluding those from civil aviation and LULUCF. 2. The remaining (non-ETS) emissions were reduced by
16% (which corresponds with the reduction target for the Netherlands according to Annex II of the ESD). The national emissions (excluding those from civil aviation and LULUCF) in 2005 were based on the Dutch National Inventory Report (NIR) 2011 (dated 11 April 2011). The 2005 ETS emission inventory was based on CITL data for installations that participated in the first phase (2005–2007). Those companies that opted-out in the second phase where excluded from the baseline emission level. However, companies that were added to ETS due to the scope adjustment, where added to this baseline. In order to identify the installations that where either excluded or added to ETS, CITL databases for the first and second phases where compared. The 2005 emissions from installations that where added to ETS after the first phase (where no 2005 CITL data was available) were sourced from an inventory by NL Agency (AgentschapNL)5
of companies that were included in the second phase. This inventory (dated June 2006) was based on survey responses from companies that were to be included in the National Allocation Plan 2008–2012.
The starting point of the ESD emission cap for 2013, according to the non-paper, should be calculated as follows:
The annual emission allocation of a Member State in the year 2013 shall be calculated by subtracting average quantity of verified greenhouse gas emissions from installations covered by Directive 2003/87/EC in the period from 2008 to 2012 in the respective Member State, expressed in tonnes of carbon dioxide
equivalent, from its average total greenhouse gas emissions for the years 2008, 2009 and 2010 excluding the corresponding quantities of carbon dioxide emissions under the source category ‘1.A.3.a Civil Aviation’.
This has been interpreted as the average of non-ETS emissions of 2008, 2009 and 2010 (excluding those from LULUCF and civil aviation), according to the ETS scope in the second phase and excluding any opt-ins. The 2008 and 2009 ETS emissions according to CITL were subtracted from national emissions reported in the NIR2011, excluding emissions from LULUCF and civil aviation. The emissions from nitric acid production were added to this result (in order to correct the nitric acid opt-in – see Section 2.2.1 for an explanation). As 2010 emission data were lacking, the emissions from nitric acid production of 2010 were assumed to be equal to those of 2008. Also, 2010 emissions are not reported in the NIR2011. Therefore, an emission forecast has been used. This forecast will be published in the short-term forecast by the PBL (forthcoming).6 The ESD emission caps are
assumed to decrease linearly, between 2013 and 2020. The initial caps for the 2013–2020 period were adjusted for the scope expansion of ETS from 2013 onwards, and the opt-in of N2O emissions from nitric acid production.7
The following formulae have been used for these adjustments:
Adjusted ESD cap in the year y = initial ESD capy – Gy – Iy
Scope expansion from 2013 (Gy) = H – H*0.0174*(y-2010),
in which:
Gy = the adjustment due to the scope expansion in the
year y
H = the notified emissions according to Article 9a(2) of the revised ETS Directive in the year 2010
Opt-in N2O emissions from nitric acid production (Iy) =
J – J*0.0174*(y-2010), in which:
Iy = the adjustment due to the nitric acid opt-in in the
year y
J = the average annual emission allowances for the 2008–2012 period allocated to the nitric acid opt-in The 0.0174 factor is the reduction factor according to Article 9 of the revised ETS Directive.
20 | Emissions and targets of greenhouse gases not included in the Emission Trading System 2013-2020
TW
O
2.3.2 Results from the alternative method
Table 3 shows the annual ESD emission caps for the Netherlands. The initial cap has been adjusted for opt-ins and scope expansion by roughly 2 Mt CO2 equivalents for
2020, similar to the EC proposal. From year to year, the adjusted ESD emission cap will decrease by roughly 2.3 Mt CO2 equivalents.
For comparison, in ECN/PBL (2010), the emission cap after scope expansion was estimated at 99 Mt CO2 equivalents
for 2020. This means that, compared with Table 3, the emission cap for 2020 would be more than 4 Mt CO2
equivalents higher than previously estimated in ECN/PBL (2010). The rules applied in this report are identical to the calculation rules applied in ECN/PBL (2010). The difference can be explained by the emission levels that were used for calculating the 2020 emission cap:
• Firstly and similar to the EC proposal, the ETS
expansion was estimated according to the emissions in the notification by the Dutch Government to the EC8,
whereas ECN/PBL (2010) based the expansion on the expected emission levels (roughly 6.6 Mt by 2020). This difference raises the cap for 2020, compared to that in ECN/PBL (2010), by roughly 5.5 Mt CO2 equivalents. In
ECN/PBL (2010), it was assumed that the ETS cap would be adjusted according to the actual amount of CO2
emissions from installations that are to be included in the ETS. This assumption is no longer valid, as the EC approved a smaller amount of emissions (than actual) to be reported in the notification. In ECN/PBL (2010), no estimation had been made of the emission cap for 2013, nor for the intermediate period.
• Secondly and also similar to the EC proposal, the non-ETS emissions in 2005 were lowered by 1.6 Mt CO2
equivalents from the levels used in ECN/PBL (2010), as a result of the adjustment to the method of monitoring N2O emissions from agriculture. This lowers the ESD
cap for 2020, compared to that in ECN/PBL (2010). • Thirdly, the 2005 emission levels according to the
alternative method were based on installation-specific inventories (from CITL and NL Agency) of ETS emissions covered in the second phase of ETS in the Netherlands.
ECN/PBL (2010), however, applied (sub)sectoral calculations to estimate the 2005 non-ETS emission levels. The 2005 ETS emission levels applied for the alternative method in this report are almost 0.6 Mt CO2
equivalents higher than those used in ECN/PBL (2010). This difference resulted in a slightly lower ESD cap for 2020 in the alternative method, compared to that in ECN/PBL (2010).
2.4 Uncertainties
The method results from both the EC proposal and the alternative, to some extent remain uncertain. These uncertainties largely are similar in both nature and magnitude. There is, however, a specific uncertainty related to the method used in the European Commission proposal.
2.4.1 Common uncertainties
ESD caps in both approaches are uncertainThe presented emission caps in both approaches are to be considered estimates according to the most recent statistics available. The final caps, to be determined by the European Commission in 2012, may deviate from these estimates (by up to several megatons). This may be the case when more recent statistics are incorporated. Uncertainties related to non-ETS emissions for 2010 (used for starting point calculation) may result in around 2 to 3 Mt CO2 equivalents higher or lower emissions. For the
2020 cap, this uncertainty is around plus or minus 1 Mt CO2 equivalents. In addition, there are also uncertainties
related to inconsistent use of definitions and emission factors, resulting in an over- or underestimation of up to several megatons CO2 equivalents.
Emission level of 2010 based on short-term forecast
The 2010 emission level has been based on a short-term forecast (2010) and, therefore, is uncertain by definition. In order to take uncertainties into account, a low and a high 2010 forecast were included. If these ranges
Table 3
ESD emission caps for the Netherlands according to the alternative (Mt CO2 equivalents)
2013 2014 2015 2016 2017 2018 2019 2020
Initial emission cap 121.2 118.9 116.6 114.3 111.9 109.6 107.3 105.0 Adjustment due to scope expansion
2013-2020 1.1 1.1 1.1 1.0 1.0 1.0 1.0 1.0
Adjustment due to opt-in 2008-2012 1.1 1.1 1.0 1.0 1.0 1.0 1.0 0.9 Adjusted emission cap 1 119.0 116.7 114.5 112.2 109.9 107.6 105.3 103.1 1 Excluding shifts between ETS and non-ETS AFTER the scope expansion from 2013.
21
ESD emission caps for the Netherlands 2013-2020 |
TW
O
TW
O
would be taken into account, the 2013 target and the path towards 2020 would alter. In the low 2010 forecast, the 2013 emission cap is 0.7 Mt lower. In the high 2010 forecast, the 2013 emission cap is 0.7 Mt higher. Both scenarios have no impact on the 2020 cap.
Adjustment to monitoring N2O emissions still needs to be reviewed
Emission levels of 2008 and 2009, needed for the calculation of the 2013 cap (starting point), have been based on results from the most recent National Inventory Report (NIR 2011, dated 11 April 2011), as submitted to the UNFCCC. In this NIR, a significant adjustment has been made of the emission factor for nitric acid (N2O)
emissions from agriculture (country-specific calculation instead of default parameters), resulting in an annual downward adjustment in emissions by roughly 1 to 2 Mt CO2 equivalents. This adjustment affects all the years
that have been reported on (1990–2009), including the base year 2005. Since this submission has not yet been verified by UNFCCC auditors, this major adjustment could potentially be rejected or altered by the auditors. This will remain uncertain until at least the last quarter of 2011, and the outcome may impact caps for both 2020 and 2013.
Adjustment in N2O emissions for 2010 is uncertain
The cap for 2013 (starting point) has been calculated using emission levels of 2008, 2009 and 2010. The emission level of 2010 was based on the Kyoto forecast, but has been corrected for the adjustment in N2O emissions from
the agricultural sector, as reported in the NIR2011. As a result of an improved methodology, historical emissions were adjusted downwards in the NIR2011, by roughly 1 to 2 Mt CO2 equivalents (see previous paragraph). The
2010 emissions were corrected according to the same adjustment as was made for 2008. This correction for 2010 may have been an over- or underestimation, which will become clear once monitoring data for 2010 becomes available. In addition, the emissions from nitric acid production in 2010 have been assumed to be at the same level as those of 2008. Deviation from this estimate would result in a minor adjustment of the cap for 2013. Both uncertainties have no impact on the 2020 cap.
Possible overestimation of emissions from combustion processes
The 2005 emission inventories by both CITL and NL Agency of ETS installations have used the definition of combustion emissions from the first National Allocation Plan (NAP1). The NAP2 definition related to combustion emissions from installations is more restrictive than that of the NAP1. Therefore, the existing 2005 inventory contains an overestimation for installations. According to NL Agency, this overestimation could be significant. An initial indication points to an overestimation of up to several Mt CO2 equivalents. If both methods would
be corrected for this inconsistency, the 2020 ESD cap could be raised. There would be, however, no impact on the 2013 cap. This potential overestimation may also apply to the data according to the EC proposal. Unfortunately, since the data used in the EC proposal are not transparent, this could not be verified.
Differences in emission factors lead to inconsistencies
The ETS emission inventory uses different emission factors than those in the national statistics (such as in the NIR). This leads to inconsistenties when ETS emissions are substracted from national emissions. Differences in emission factors have been identified for burning natural gas and coal. At least several of the emission factors used in the ETS inventory are lower than those used in national statistics. Thus, non-ETS emissions in the sector of large-scale power production (where this issue is most relevant) could be up to 1 Mt CO2 equivalents higher
according to national statistics than in ETS statistics. However, the effort to reduce emissions is not affected by this inconsistency, as both the target and monitored emissions are impacted equally. It does result in non-ETS emissions that cannot be related to emission sources, which has to be taken into account for climate policies.
Emissions from civil aviation could be updated
The ESD caps have been calculated using data from national emission inventories, but excluding those from civil aviation and LULUCF. In the NIR2011 v1.1, the emissions from civil aviation remained constant over the last years (at 0.04 Mt CO2 eq). If these emissions were to
be recalculated at some time in the future for an update of the emission inventory, ESD emissions of the base years 2005, 2008, 2009 and 2010 are likely to change. Such a change would have a minor impact on the caps for both 2013 and 2020.
2.4.2 Uncertainties related to the European
Commission proposal
Values D and E not transparent and possibly underestimated
The values D and E in the formulae used by the European Commission lack transparency as installation-specific data was unavailable. The data source for values D and E were obtained from the EC decision dated 16 January 2007.9 This means that it is uncertain if installations
that were added since that time were included in the EC figures. According to CITL data, installations added to ETS from 2007 onwards lead to emissions of 3.26 Mt CO2 equivalents (expressed in 2008 emission levels)
additional to those from installations in ETS up to that time. It is unknown to what extent these additional emissions had been incorporated in values D and E, as these data sources are not transparent. Therefore, the underestimation is uncertain.
22 | Emissions and targets of greenhouse gases not included in the Emission Trading System 2013-2020
TW
O
2.5 Comparison of EC proposal and
alternative
When the results from the methods of the EC proposal and the alternative are compared, a significant difference in the ESD emission cap for 2020 can be observed. Consequently, the path towards 2020 also differs significantly (see Table 4). The starting point in 2013, however, is similar in both.
The EC proposal and the alternative differ in the calculation and data sources of the base year. The method according to the EC proposal utilises CITL data that are corrected by aggregated emission levels to cope with scope changes. The alternative method utilises installation-specific data only and is therefore more transparent. A possible drawback of the data used in the alternative is that other Member States may not have similar inventories as used in this report.
According to the method used in the EC proposal, the ESD emission cap for 2020 is 104.6 Mt CO2, while in the
alternative method, this is 103.1. Since the formulae to calculate the ESD targets are the same in both methods, the difference between the two resulting caps can be fully explained by the different data sources used for determining the base-year emissions. The ESD emission caps for 2013, however, are the same in both methods, which is not unexpected as data sources and formulae are the same in both methods.
When comparing the 2005 ETS figures that serve as a baseline for ESD target calculation for 2020, the ETS baseline according to the EC proposal is 84.3 Mt CO2,
whereas according to the alternative it is 86.1 Mt CO2. This
difference could be explained by the following:
• The data from the 2005 emission inventory that were used in the alternative method did not take into account the change in the definition of combustion emissions, while data sources used in the EC proposal may have accounted for this change in definition (although this could not be verified due to a lack of data
transparency). The definition in the second phase is more stringent than in the first, resulting in emissions that where no longer included in ETS (such as from furnaces).
• The ETS emission level of 2005 according to the EC proposal may be underestimated, as the values for D and E (that correct the 2005 CITL data for scope changes and opt-outs) lack changes after January 2007. Additional installations have been added to ETS since that time. The alternative method takes changes that were made after 2007 into account.
• Also, there may be differences between the emission factors used for the combustion of coal and natural gas. The impact of such differences is unknown, as this has not been analysed in further detail.
• And lastly, data submitted by companies may have been corrected in CITL after June 2006 (date of compilation of the 2005 emission inventory used in the alternative method).
Table 4
Comparison between the ESD emission caps in the EC proposal and the alternative (Mt CO2 equivalents)
Method 2013 2014 2015 2016 2017 2018 2019 2020
EC proposal Initial emission cap 121.2 119.1 117.0 114.9 112.8 110.7 108.6 106.5 Adjusted emission cap 1 119.0 117.0 114.9 112.8 110.8 108.7 106.7 104.6
Alternative Initial emission cap 121.2 118.9 116.6 114.3 111.9 109.6 107.3 105.0 Adjusted emission cap 1 119.0 116.7 114.5 112.2 109.9 107.6 105.3 103.1 1 Excluding shifts between ETS and non-ETS AFTER the scope expansion from 2013.
23
ESD emission caps for the Netherlands 2013-2020 |
TW
O
TW
O
Note
1 Decision no. 406/2009/EC.
2 Actual emissions may deviate from this linear pathway, as several flexibility mechanisms, such as trading between Member States, are allowed.
3 PBL report ‘Raming van broeikasgassen en
luchtverontreinigende stoffen 2011-2015’, report number 500253002, expected in May 2011 (Dutch only).
4 The formula to adjust for the nitric acid opt-in is according to the method discussed in email correspondence between the Ministry of I&M and the European Commission (dated 12 February 2010).
5 This agency is a department of the Ministry of Economic Affairs, Agriculture and Innovation, which implements government policies (such as those on climate). 6 PBL report ‘Raming van broeikasgassen en
luchtverontreinigende stoffen 2011-2015’, report number 500253002, expected in May 2011 (Dutch only).
7 The formula to adjust for the nitric acid opt-in is according to the method discussed in email correspondence between the Ministry of I&M and the European Commission (dated 12 February 2010).
8 According to Article 9a(2) of the revised ETS Directive. 9 EC decision concerning the second allocation plan
24 | Emissions and targets of greenhouse gases not included in the Emission Trading System 2013-2020
THREE
Adjustment of non-ETS
emission forecast for 2020
The previous chapter discussed the ESD targets for the 2013–2020 period. This chapter addresses the non-ETS emissions forecasted for 2020. In this chapter, the emissions forecasted in ECN/PBL (2010) are divided into ETS and non-ETS emissions using a revised method. The emissions forecasted by ECN/PBL (2010) were not updated, meaning that policies from the current government have not been incorporated. The non-ETS emissions presented in this chapter, therefore, should be considered as a revision and not as an entirely new forecast.
3.1 Method
Method applied in ECN/PBL (2010) based on sectoral analysis
In the 2020 forecast presented in ECN/PBL (2010), national emissions were divided into ETS and non-ETS, by using estimates of ‘ETS shares’ on a sectoral and subsectoral level. These ETS shares were determined according to preliminary national 2008 emission data and the 2008 ETS emission report by the competent authority (the Dutch Emissions Authority (NEa)). This resulted in ‘phase 2’ ETS shares on sectoral and subsectoral levels. In order to determine ‘phase 3’ ETS shares, an expert judgement was made to estimate the additional (2008) emissions that would result from the expansion of the ETS scope from 2013 onwards. These ETS shares were applied to the forecasted 2020 emissions, to divide the national emissions into ETS and non-ETS-emissions.
Using ETS shares has fundamental disadvantage
The applied method of ETS shares has a fundamental disadvantage. The shares are based on a single year (2005 in this report). The ETS share in this particular year may not be representative for the period it is applied to (2013-2020 in this case). Also, the ETS share is fixed and unable to accommodate sectoral developments that would lead to transferring ETS emissions to non-ETS (such as a scale enlargement in the horticultural sector resulting in more CHP installations with a capacity of more than 20 MWth, or companies opting in or out of ETS).
ETS shares improved
As long as forecasting methods are applied at sectoral and subsectoral levels, ETS and non-ETS emissions need to be divided on these levels, using ETS shares. Therefore, this report sticks to this method, despite its fundamental disadvantage (which, therefore, must be considered as an uncertainty). However, compared to ECN/PBL (2010), the ETS shares in this report have been improved in several ways:
• The base year for determining ETS shares was changed to 2005 (from 2008 in ECN/PBL (2010)). This was done for several reasons. Firstly, 2005 was used as a base year for both ETS and ESD (non-ETS) targets. Basing ETS shares also on 2005 data improved comparability between emissions and targets (for example, definition of combustion emissions is equal). Secondly, using 2005 as a base year, also diminished the required effort to calculate ETS shares, as for both purposes the same baseline could be used. The impact of changing the
25
3. Adjustment of non-ETS emission forecast for 2020 |
THREE
base year is considered limited, as the shares ofsectoral and subsectoral CO2 emissions relative to the
total emissions of 2008 are very similar to those of 2005 (<1 percentage point difference).
• The ETS shares have been based on final emission inventories, whereas the ETS shares in ECN/PBL (2010) were based on preliminary 2008 data.
• The ETS shares in this report were determined for each MONIT1 sector. In ECN/PBL (2010), the statistically
uncorrected (‘table A’) emissions from the MONIT database were used for determining the 2008 ETS shares. In this report, the statistically corrected (‘table B’) emissions from the MONIT database were used (for the year 2005). These emissions were statistically corrected in order to match the emissions reported in the National Emission Inventory.
• For this report, the ETS shares were based on
installation-specific inventories, whereas the previous ETS shares relied on (presumably less accurate) sectoral analysis. See the section below for a discussion on data sources and methods used for determining the 2005 emission inventory.
Construction of phase 2 emission inventory
The 2005 ETS emission inventory used for determining the ETS shares, was based on several data sources. Firstly, an inventory was constructed according to the scope in the second phase. For that purpose, the CITL data on installations that participated in the first phase (2005–2007) was used as a basis. Those companies that opted-out in the second phase were excluded from the baseline emission level. However, companies that were added to ETS due to the scope adjustment, were added to this inventory. In order to identify the installations that were either excluded or added to ETS, CITL databases for the first and second phase were compared. The 2005 emissions from installations that were added to ETS after the first phase (for which no 2005 CITL data were available) were sourced from an inventory by NL Agency of companies included in the second phase. This inventory (dated June 2006) was based on results from surveys among companies to be included in the National Allocation Plan 2008–2012. The resulting inventory is the same one that was used in the alternative method for calculating the ESD targets (see Chapter 2).
Expanding the scope from the second to the third phase
According to the revised ETS directive2, the scope of ETS
for the 2013–2020 period is expanded compared to the current scope (the second phase in the trading period of 2008–2012). In contrast to the second phase, emissions from most industrial processes are included in the third phase. Also, the greenhouse gases N2O from nitric acid
production and PFCs from aluminium production are included in the extended scope.
In order to determine ETS shares suitable for the third phase of ETS (2013–2020), the inventory was complemented with data from two data sources. Firstly, the emission inventory from the notified emissions by the Dutch Government3 was used in order to add
emissions from installations that were entirely new to ETS (no participation in either phase 1 or 2). Secondly, data from the NIR2011 were used for estimating the 2005 emissions from installations that only participated in the first phase4. This estimation was necessary as the
Dutch Government notified the EC only of entirely new installations.
In the sectors ‘base metal’ and ‘chemistry’, this complementation led to a sectoral ETS emission slightly above the total sectoral emissions according to MONIT. This ‘surplus’ was transferred to the sector ‘decentralised power production’, as the ‘base metal’ and ‘chemistry’ sectors have significant combined-heat-and-power production, often belonging (partially) to power companies. In this way, no ETS emissions are ‘lost’.
Calculation of ETS shares
In order to determine ETS shares for the third phase, the installations in the inventory were firstly allocated to the sectors according to MONIT. The ETS emissions for each MONIT sector were then divided by the total emissions in the same MONIT sector.
3.2 Results
Estimated non-ETS emissions higher due to lower ETS shares
Table 5 presents the sectoral non-ETS emissions for 2020, according to ECN/PBL (2010) and including the revised ETS shares. The total non-ETS emissions were estimated to be almost 1 Mt CO2 equivalents higher
than was previously estimated in ECN/PBL (2010). This is mostly due to a downward revision of the ETS share in the large-scale power plants and energy extraction industry sectors (see Table 6 below). On a subsectoral level, 1 Mt CO2 from large-scale power plants was added
to non-ETS emissions. This can be explained by the usage of inconsistent emission factors (for natural gas and coal) (see Section 2.4.1 for more details), resulting in non-ETS emissions that cannot be attributed to installations. Another explanation are the higher emissions (compared to 2008) from power plants not covered by ETS in 2005. These higher emissions can be explained by the fact that national statistics do not always match with ETS statistics. Some power plants mentioned in national statistics are not covered by ETS. For the energy extraction industry, roughly 1 Mt CO2 has
been added to the non-ETS emissions. This is due to an inaccurate expert judgement in ECN/PBL (2010) on the
26 | Emissions and targets of greenhouse gases not included in the Emission Trading System 2013-2020
THREE
number of installations that would be covered by ETS in the third phase. Non-ETS emissions from agriculture are almost 1 Mt CO2 higher, because of a smaller ETS share.
The non-CO2 emissions remain unaltered, because the
revision of ETS shares only affects CO2. However, the
non-ETS emissions in the industrial sector are 0.3 Mt lower than according to ECN/PBL (2010). This is the result of higher estimates of ETS shares in the subsectors of chemistry, building materials and other industry. The non-ETS emissions in these sectors involve numerous small companies, such as electro-metal companies, textile manufacturers/processors and companies in the graphics subsector. Another significant issue is the downward revision of the nitrous oxide emissions from
agriculture with 1.5 Mt CO2 equivalents due to an adjusted
monitoring methodology. Annex 1 shows the absolute figures used for calculating the ETS shares.
The underlying reasons for these revisions can be found in the adjustments discussed in the previous section. Also, the magnitude of uncertainties described in the next paragraph may differ between 2005 and 2008 (the two different base years for determining the ETS shares, used in this report and ECN/PBL (2010), respectively). The impact of adjustments and uncertainties on sectoral and subsectoral levels has not been evaluated for this report.
Table 5
Non-ETS emissions for 2020 (Mt CO2 equivalents)
Sector ECN/PBL (2010)1 This report
Energy 5.1 7.2
Industry 3.8 3.5
Built environment 23.2 23.2
Agriculture and horticulture 6.8 7.8
Transport 36.9 36.9
Other greenhouse gases (agriculture) 17.5 16.0
Other greenhouse gases (industry and other sectors) 9.2 9.2
Total 102.5 103.8
1 Reference emissions including policies and regulations up to 2009 (variant RR2010-V).
Table 6
ETS shares in the 2013–2020 period
MONIT Sector ETS share
ECN/PBL (2010) This report
Households 0% 0%
Food and stimulants 65% 67%
Base metal 100% 100% Chemistry 99% 100% Paper 100% 94% Other metal 10% 7% Building materials 95% 99% Other industry 7% 26%
Agriculture and horticulture 16% 6%
Construction 0% 0%
Services and government 3% 3%
Transport 0% 0%
Refineries 100% 99%
Large-scale power plants 99% 97%
Waste incineration 0% 0%
Decentralised power production 90% 94%
Cokes industry 100% 100%
Energy extraction industry 73% 14%
27
3. Adjustment of non-ETS emission forecast for 2020 |
THREE THREE
As indicated earlier, a fundamental disadvantage of using ETS shares (based on historical emissions) for dividing emissions estimated for the future, is that this does not take into account any developments in sectors that would alter the ETS/non-ETS balance. For some sectors (e.g. chemistry, refineries and large-scale power plants), ETS shares are expected to remain relatively stable. However, in others (agriculture, horticulture and decentralised power production) this is less certain. This also explains the lower ETS share in the agricultural and horticultural sectors, where combined heat-and-power production increased significantly between 2005 and 2008. The resulting ETS emissions from this sector, therefore, may be underestimated (possibly by around 1 Mt CO2 equivalents), although the uncertainty about this
development up to 2020 is relatively high.
3.3 Historical non-ETS emissions
Appendix 2 presents the historical non-ETS emissions for each sector included in Dutch climate policy. These emissions were calculated for the 1990–2008 period, for the scope of ETS in the third phase. These figures are relevant to the Dutch Government, to make sectoral divisions in climate policy. For this purpose, the national emissions according to the MONIT database were divided into ETS and non-ETS, using the revised ETS shares discussed above. The N2O emissions in the MONIT
database were corrected for the NIR2011 N2O emission
adjustment in the agricultural sector (see also previous chapters), not including other (minor) adjustments in the NIR2011 (and the NIR2010).
3.4 Uncertainties
Emission inventory only adjusted for N2O monitoring
Emission data from the MONIT database used for determining ETS shares on sectoral and subsectoral levels have been corrected for the N2O emission adjustment from agriculture only. Other (insignificant) adjustments applied in the NIR2011 (compared to the NIR2010 and NIR2009) have not been taken into account. The MONIT database is the same as the one used in ECN/PBL (2010) and corresponds with the emission data in the NIR2009. Because the N2O emission adjustment is significant, the MONIT database has been corrected for this adjustment (with 1.6 Mt CO2 equivalents for 2005).
Differences in emission factors lead to inconsistencies
Different emission factors have been applied in the ETS emission inventory than in national statistics (e.g. in MONIT). This leads to inconsistencies when ETS emissions are divided by total emissions. Differences in emission factors have been identified for burning natural gas and coal. Emission factors used in the ETS inventory seem lower than those in national statistics. The impact of this in the MONIT sector of central power production could be up to 1 Mt CO2 equivalents higher than in ETS statistics. A similar inconsistency resulting from the use of different emission factors, is also relevant in calculating ESD targets (see Chapter 2).
Using 2005 as a proxy for the ETS shares in the 2013–2020 period
A fundamental uncertainty related to the applied method of using a single base year (i.e. 2005) for calculating ETS shares, is that this may result in an insufficient forecast of ETS shares for the 2013–2020 period. For example, agricultural companies may decide to increase investments in CHP generation, which would lead to an increase in emissions from this sector. Whether these additional emissions would fall under ETS or non-ETS, would depend on the installation’s capacity5. In either
case, the ETS shares should be adjusted.
Projection of ETS shares using historical emission data is hypothetical
The presented historical emission data must be used with caution, as they were based on the year 2005 and corrected for the scope of ETS in the third phase. This means that historical non-ETS emission data do not always compare to other inventories. For example, the non-ETS emissions presented in this report for the 2005–2007 period are not comparable with non-ETS emissions that were calculated from official ETS statistics. Moreover, prior to 2005, no ETS existed, which makes the historical emission data rather hypothetical.
Notes
1 MONIT is a database used in forecast analyses by the ECN; sector definitions and historical statistics are matched against official statistics.
2 Directive 2009/29/EC.
3 Article 9a(2) emissions revised ETS Directive; see introduction for an explanation.
4 In some cases, emission reports from individual companies were examined.
5 Threshold capacity for non-assigned activities (such as power generation) is 20 megawatts.