of reinforced concrete ties during tensile testing
Discrete element analysis of the cracking behaviour
Academic year 2019-2020
Master of Science in Civil Engineering
Master's dissertation submitted in order to obtain the academic degree of
Sciences Vienna)
Counsellor: Ir. Lisa Czernuschka (University of Natural Resources and Life
Supervisor: Prof. dr. ir. Roman Wan-Wendner
Student number: 01406028
Bram Demeyer
TITEL
Discrete element analysis of the cracking behaviour of reinforced concrete ties during tensile testing
DATUM
31/05/2020
PAGINA
1/216
PREFACE
This document contains the master dissertation “Discrete element analysis of the cracking behaviour of reinforced concrete ties during tensile testing.”. It is written to achieve the academic degree of Master of Science in Civil Engineering – Construction Design at the university of Ghent. I was involved in the research and the writing of the master dissertation from September 2019 until June 2020. The master dissertation is written for people with experience and knowledge about the cracking behaviour of concrete.
The interest in the subject of the master dissertation has grown during my studies of civil engineering. The theoretical background and the numerical investigation of research problems have always fascinated me and therefore, I wanted to execute this master dissertation. The research question and the content of the master dissertation is determined in consultation with my supervisor prof. dr. ir. Wan-Wendner. The investigation of the master dissertation subject was intensive and demanding, but extensive research resulted in a solution for the master dissertation research questions. Fortunately, prof. dr. ir. Wan-Wendner was always available for support, good advice and insights into the theory. I would like to thank my supervisor prof. dr. ir. Wan-Wendner for his guidance, for his valuable input both practical and theoretical and for his availability during the timespan of the master dissertation. Besides my supervisor, I would also like to thank the respondents. In particular ir. Lisa-Marie
Czernuscha for the cooperation during the timespan of the master dissertation, for the explanation of several subjects, for teaching me various computer programs and for her exceptional support and availability. Also, ir. Andrea Carolina Ona Vera, I like to thank for her knowledge in programming and for setting up the software and I want to thank my fellow students for giving me inspiration and ideas on how to solve different problems about my research.
At last, I want to thank me friends and family for the emotional support during the investigation of the master dissertation subject, especially my brother Mauro Demeyer. They kept me motivated and dedicated, which was needed to solve the research problems. Undoubtedly, my parents need to get a particular note for giving me the opportunity of expanding my knowledge.
I wish you an interesting reading experience. Bram Demeyer
Ghent, May 31, 2020
TITEL
Discrete element analysis of the cracking behaviour of reinforced concrete ties during tensile testing
DATUM
31/05/2020
PAGINA
2/216
ABSTRACT
During this master dissertation, the cracking behaviour of reinforced concrete ties during tensile testing is investigated. A discrete element analysis is executed on a concrete lattice discrete particle model. The master dissertation focusses on concrete ties reinforced with multiple reinforcement bars, because these reinforced concrete elements represent the real-life behaviour of concrete structures in a better way than the standard concrete tie reinforced with a single reinforcement bar in the centre. During the research, three concretes will be calibrated according to a cylindrical compression test. The concretes will differ in mean tensile strength, but the macroscale mean cylindrical compression strength is the same. Once the concretes are calibrated, the calibration of the tensile test is executed. The calibration of the tensile test is performed by approximating the experimental results achieved by prof. Gribniak [80]. During the calibration of the model, the influence of the Model Code bond models is tested [1][11]. Besides the bond models represented in the Model codes, also a continuous averaged bond model and a discrete bond model are tested that take into account the anchorage of the reinforcement bar ribs.
A sensitivity study on the bond model parameters is executed to see the influence of the parameters individually. The different parameters tested are the maximum bond strength, the residual bond strength, the three slip coefficients and the bond shape parameter. Besides the bond model, also the influence of the concrete strength, the concrete stiffness and the particle placement are tested. At last, a comparison is made between the crack widths and the reinforcement strains calculated according to the standard NBN EN 1992 and the ones received from the numerical simulations [2]. During the complete master dissertation, one makes use of the “Mars” calculation software to execute the numerical simulations. The post-processing is performed by making use of the “Paraview”
software and a calculation software, for example Microsoft excel.
The numerical simulations resulted in a dependency of the macroscale concrete mean compressive strength on the meso-scale shear strength ratio for the compression test. For the tensile test, one can state that the bond models, present in the Model Codes, are not eligible to represent the real cracking behaviour. The modelling of the anchorage of the steel reinforcement ribs into the surrounding concrete plays a major role in the representation of the real cracking behaviour. The sensitivity study shows that only the maximum bond strength, the first slip coefficient and the bond shape parameter affect the results of the numerical simulations. The other three parameters have no influence on the results, because they are not reached when looking at the bond strength – slip curve.
At last, the influence of the concrete tensile strength, the concrete stiffness and the particle placement are investigated. Decreasing the mean concrete tensile strength results in crack initiation at a lower total load and a lower average concrete strain. The influence of the particle placement is primarily seen locally, but the overall behaviour remains the same.
As a conclusion, one can state that further research is needed. A promising research field is opened in which the influence of the reinforcement and all its parameters (diameter, placement, number of rebars) can be investigated.
TITEL
Discrete element analysis of the cracking behaviour of reinforced concrete ties during tensile testing
DATUM
31/05/2020
PAGINA
3/216
EXTENDED ABSTRACT
Discrete element analysis of the cracking behaviour
of reinforced concrete ties during tensile testing
Bram Demeyer
Supervisor(s): prof. dr. ir. Roman Wan-Wendner
Abstract: This article reports the investigation of the cracking
behaviour of reinforced concrete ties during tensile testing. Discrete element analysis of concrete ties reinforced with multiple reinforcing bars is executed in the “Mars” software. The numerical analysis is related to the experimental research done by prof. Gribniak [4]. The main purpose of the research was to find a working model that approximates closely the experimental results. The complete calibration process is explained in the report. During the calibration process, different boundary conditions, concretes, and bond models are tested. A sensitivity study is performed to investigate the influence of the different bond model parameters. Besides the bond model parameters, also the influence of the concrete tensile strength, the concrete stiffness and the particle placement are investigated. A model is found that fits the experimental results.
Keywords: Mars, LDPM, crack width, cracking, strain,
concrete
I. INTRODUCTION
This master dissertation will deal with the discrete element analysis of the cracking behaviour of reinforced concrete ties during tensile testing. The discrete element analysis will cover the experimental research executed by prof. Gribniak et al [4]. The reinforced concrete specimens are loaded by applying tension to the steel reinforcement bars. In this way, uniform loading is secured. The cracking behaviour during tensile testing is investigated and discussed. First of all, the calibration of the model is performed by matching the experimental results. Once the model is found, the different parameters can be modified. For example, the concrete tensile strength, the particle placement, the concrete quality and many more.
Experimental studies, executed in the past, showed differences in deformation behaviour between concrete ties reinforced with multiple reinforcement bars and the standard laboratory concrete specimen reinforced with a single reinforcement bar in the centre. Therefore, one can state that the standard laboratory concrete specimen does not form a correct representation of the real-life structures. Consequently, the centre reinforcing bar concrete specimen cannot be used in the norm to represent the real-life structures, which casts doubt on the currently available analytical prediction models.
The flawed approximation of reality is currently being addressed by several researchers, among other prof. Gribniak. They are executing experimental tests for different reinforcing bar configurations and different reinforcement ratios. These experimental tests are also covered by finite element analyses,
B. Demeyer is with the Civil Engineering Department, Ghent University (UGent), Gent, Belgium. E-mail: Bram.Demeyer@UGent.be .
which resulted in well-grounded understandings. The insights found by executing the finite element analyses are summarized in the literature study of the full document.
The next step in the analysis process is the discrete element analysis of the cracking behaviour of the concrete ties reinforced with multiple reinforcement bars. The discrete element analysis should lead to advanced insights into crack spacing and crack opening. The discrete element analysis makes use of the Lattice Discrete Particle Model (LDPM).
II. CALIBRATION PROCESS
During this master dissertation, the cracking behaviour of reinforced concrete ties during tensile testing is investigated. For the tensile test, the specially designed test setup, introduced by Gribniak et al., will be simulated [4]. The test setup is given in Figure 1.
Figure 1: Experimental test setup [4]
The test setup applies the tension to the reinforcing bars and trusts on the bond between the reinforcing bars and the concrete to transfer the loads to the concrete. The aim of the setup is securing uniform tensile loading.
A discrete element analysis is executed by making use of a concrete lattice discrete particle model. Consequently, meso-scale parameters are used. The meso-meso-scale makes a difference between the granulates and the paste between the granulates, while the macroscale considers the concrete as a homogeneous material.
The master dissertation focusses on concrete ties reinforced with multiple reinforcement bars, because these reinforced concrete elements represent the real-life behaviour of concrete structures in a better way than the standard concrete tie reinforced with a single reinforcement bar in the centre. The
standard concrete tie is only used for experimental purposes and never in real-life occasions.
During the research, three concretes will be calibrated according to a cylindrical compression test. The concretes will differ in mean tensile strength, but the macroscale mean cylindrical compression strength remains the same. The three concretes have a concrete class C30/37 and a mean tensile strength equal to 3.24 MPa, 2.896 MPa and 2.6064 MPa. The mean tensile strengths are in the range between the minimum tensile strength of 2 MPa and the maximum tensile strength of 3.8 MPa, specified in the Model Code 2010 [1]. The first value is calculated based on the experimentally measured value for the compression strength of the concrete, mentioned in the research done by prof. Gribniak [4]. The second value, respectively 2.896 MPa, is equal to the theoretical value specified in the standard NBN EN 1992 and in the Model Codes 1990 and 2010 [1][2][3]. The last value, respectively 2.064 MPa, is equal to 90% of the theoretical tensile strength. To calibrate the concrete, the meso-scale shear strength ratio is iterated until the macroscale cylindrical compression strength of the concrete is equal to the one measured experimentally. Once the concretes are calibrated, the calibration of the tensile test is executed. The calibration of the tensile test is performed by approximating the experimental results achieved by prof. Gribniak [4]. The first step in the calibration process is the determination of the boundary conditions. For the boundary conditions, one assumes that the bottom loading plate remains fixed, both the translations and the rotations, while the top loading plate has a free translation in the vertical z-direction. Otherwise loading would be impossible. The rotations in all directions and the translation in the x- and y-direction are fixed for the top loading plate. The model is shown in Figure 2.
Figure 2: Model for the simulations of the tensile test
The second step is defining the bond model. During the calibration of the model, the influence of the Model Code bond models is tested [1][3]. For the Model Code 1990, the unconfined splitting failure bond models (good and other bond) are tested, but longitudinal cracking of the concrete specimen did not occur. Therefore, the unconfined pull-out bond models (good and other bond) of the Model Code 2010 are also implemented into the simulation. These bond models did not result in the wanted cracking behaviour, because they only account on the cohesion between the steel reinforcement bar and the surrounding concrete. Besides the bond models
represented in the Model codes, also a continuous averaged bond model and a discrete bond model are tested that take into account the anchorage of the reinforcement bar ribs into the surrounding concrete. At the location of the ribs, both the cohesion and the anchorage are taken into account, while at the location of the smooth bar between the ribs only the cohesion is accounted for. The continuous averaged bond model and the discrete bond model are variations on the bond model proposed by Michou et al. [5].
The discrete bond model makes a difference between the zones in which a rib is located and the zones of smooth reinforcing bar between the ribs. The different zones are attributed different bond models. The zones in which a rib is located are attributed a strong bond with a maximum bond strength of 225 MPa, the other zones are attributed a normal bond with a bond strength equal to 3 MPa. The strong bond zones have a length of 5 mm and the normal bond zones have a length of 10 mm. The bond models are placed in an alternating order. For both bond models the first slip coefficient is taken equal to 0.1 mm, the second slip coefficient equal to 10 mm and the third slip coefficient equal to 24 mm. The continuous averaged bond model averages the discrete bond model over the complete length of the reinforcing bar. A maximum bond strength of 82.29 MPa is achieved. The slip coefficients remain the same as for the discrete bond model.
A sensitivity study on the bond model parameters is executed to see the influence of the parameters individually. The different parameters tested are the maximum bond strength, the residual bond strength, the three slip coefficients and the bond shape parameter. The bond shape parameter is investigated due to the definition of the parameter in the “Mars” software. In the “Mars” software, the bond shape parameter is used in the equation for the bond stiffness. More in detail, the bond stiffness present in the “Mars” software is equal to the bond stiffness determined according to the Model Codes multiplied by the bond shape parameter. Besides the bond model, also the influence of the concrete tensile strength, the concrete stiffness (Young’s modulus) and the particle placement are tested. At last, a comparison is made between the crack widths and the reinforcement strains calculated according to the standard NBN EN 1992 and the ones received from the numerical simulations [2].
III. NUMERICAL SOFTWARE USED
During the complete master dissertation, one makes use of the “Mars” calculation software to execute the numerical simulations. The post-processing is performed by making use of the “Paraview” software and a calculation software, for example Microsoft excel.
IV. RESULTS
A. Cylindrical compression test
The numerical simulations resulted in a dependency of the concrete macroscale mean compressive strength on the scale shear strength ratio for the compression test. If the
meso-scale shear strength ratio is increased, then also the macroscale mean compressive strength will increase. On the other hand, if the tensile strength of the concrete is decreased and the meso-scale shear strength ratio is kept constant, than the macroscale, mean cylindrical compressive strength of the concrete decreases. Therefore, one can state that if the tensile strength of the concrete decreases, the meso-scale shear strength ratio should increase to keep the macroscale, mean cylindrical compression strength constant.
B. Tensile test
For the tensile test, one can state that the bond models, present in the Model Codes, are not eligible to represent the real cracking behaviour. The modelling of the anchorage of the steel reinforcement ribs into the surrounding concrete plays a major role in the representation of the real cracking behaviour. Therefore, the continuous averaged bond model and the discrete bond model are calibrated to achieve the required results.
The sensitivity study shows that only the maximum bond strength and the first slip coefficient affect the results of the numerical simulations. Increasing the bond strength results in concrete crack initiation for a lower total load. The opposite can be seen for the first slip coefficient. The first slip coefficient needs to be decreased to get crack initiation at a lower total load. The other three parameters have no influence on the results, because they are not reached when looking at the bond strength – slip curve. The bond strength – slip curve is given in Figure 3.
Figure 3: Bond strength - slip curve [1]
The influence of the bond shape parameter can be mainly seen after the formation of the first transversal crack. The second and the third crack are formed for a lower average concrete strain and a lower total load. The total load at which the first crack initiates decreases if the bond shape parameter increases and the average concrete strains at which the first crack initiates increases if the bond shape parameter increases.
Besides the bond model parameters, one can also look at the concrete parameters. The concrete stiffness, the Young’s modulus, has a big impact on the results. An increase of the concrete stiffness results in a steeper, but shorter linear elastic part in the average concrete strain – total load curve. The first crack formation phase will occur for a lower total load, a lower average concrete strain and a lower average reinforcement strain.
At last, the influence of the concrete tensile strength, the concrete stiffness and the particle placement on the cracking behaviour are investigated. Decreasing the mean concrete tensile strength results in crack initiation at a lower total load and a lower average concrete strain. A shorter linear-elastic phase can be stated. Nevertheless, the stiffness will remain the same. This is a logical observation, because if the concrete strength is reduced cracking will occur faster. The influence of the particle placement is primarily seen locally, but the overall behaviour remains the same.
To investigate the crack width and crack spacings, a comparison is made with the calculation method proposed in the standard NBN EN 1992 [3]. The crack widths cannot be compared to the experimental results due to the limited measurements executed. The standard NBN EN 1992 calculates the crack widths by making use of the stresses occurring in the steel reinforcement bars. The reinforcement and concrete strains are calculated based on these stresses. They are subtracted from each other and multiplied by the maximum crack spacing to achieve the crack width. An interesting observation that can be seen is that the reinforcement strains calculated with the standard NBN EN 1992 are a factor 2.3-2.5 times larger than the actual strains occurring in the simulation. Besides the reinforcement strains, also the average crack widths are overestimated.
V. FINAL MODEL
The final model is defined by the concrete specimen with a mean tensile strength equal to 3.24 MPa. A meso-scale concrete stiffness (Young’s modulus) of 77993.02 MPa is needed to achieve the same stiffness as the experimental results. To closely approximate the experimental results, the final model makes use of an averaged continuous bond model with a maximum bond strength equal to 82.29 MPa, a residual bond strength equal to 32.916 MPa, a first slip coefficient equal to 0.2246, a second slip coefficient equal to 10 mm, a third slip coefficient equal to 24 mm and a bond shape parameter equal to one.
Implementing all these parameters result in a very close approximation of the experimental results for the average concrete strain – total load curve, for the average reinforcement strain – total load curve and for the cracking pattern. The results are given in the following figures, starting off with the average concrete strains versus the total load graph.
Figure 4: Average concrete strain versus total load
Figure 4 shows the average concrete strains for the final model. A close approximation of the experimental results can be seen.
Figure 5: Average reinforcement strain versus total load
Figure 5 shows the average reinforcement strains for the final model. One can see clearly that the experimental results and the final numerical model have the same initial stiffness. Also, the cracking process is closely approximated. The stabilised cracking phase is not shown due to the limited simulation time.
At last, one can have a look at the cracking pattern. A comparison between the experimentally achieved and the numerically achieved cracking pattern is executed.
Figure 6: Comparison between the experimentally and the numerically achieved cracking patterns
Figure 6 shows the experimental cracking pattern at the left, the complete cracking of the concrete in the middle and the transversal cracks of the concrete at the right. Comparing the numerical simulation with the P2 reinforced concrete tie, one can state that a similar cracking pattern is achieved. At last, there can be mentioned that the crack spacing for the
numerical simulation is approximately equal to 180 mm. This value is closely predicted by the standard NBN EN 1992. The standard predicted a crack spacing equal to 186.46 mm.
VI. CONCLUSION
As a conclusion, one can state that a good and close fit of the experimental results is found, but further research is needed. Several parameter studies are executed with interesting insights as results. The bond model is completely defined by the bond stiffness. Therefore, only the maximum bond strength, the first slip coefficient and the bond shape parameter will play a role. For the concrete, the main focus went to the influence of the mean tensile strength and the meso-scale concrete stiffness (Young’s modulus). The investigation of the cracking behaviour of reinforced concrete ties is an extensive research field with a lot of possibilities. A promising research field is opened in which the influence of the reinforcement and all its parameters (diameter, placement, number of rebars) can be investigated. Also, the influence of the concrete cover, the concrete tensile strength, the cracking parameters and the fracture energy need further research. Nevertheless, the discrete element analysis of the cracking behaviour of reinforced concrete can results in ground-breaking understandings.
ACKNOWLEDGEMENTS
The author would like to acknowledge the insights and input of ir. Lisa-Marie Czernuschka.
REFERENCES
[1] Fib (2013), Model Code for Concrete Structures 2010, Ernst und Sohn, fib 2013.
[2] CEN (1991), ENV 1992-1-1, Eurocode 2. Design of concrete structures. Part 1: General rules and rules for buildings.
[3] Fib (1993), Model Code for Concrete Structures 1990, Thomas Telford Services, fib 1993.
[4] Rimkus, Arvydas & Gribniak, Viktor. (2017). Experimental investigation of cracking and deformations of concrete ties reinforced with multiple bars. Construction and Building Materials. 148. 49-61. 10.1016/j.conbuildmat.2017.05.029.
[5] Michou A, Hilaire A, Benboudjema F, Nahas G, Wyniecki P, Berthaud Y. Reinforcementconcrete bond behavior: experimentation in drying conditions and meso-scale modeling. Engineering Structures 2015;101:570–582.
TITEL
Discrete element analysis of the cracking behaviour of reinforced concrete ties during tensile testing
DATUM 31/05/2020 PAGINA 4/216
TABLE OF CONTENT
Preface 1 Abstract 2 Extended Abstract 3 Table of content 4 List of Figures 6 List of tables 15List of abbreviations and symbols 17
1 Introduction 20
2 Literature study 21
2.1 Cracking behaviour of reinforced concrete 21
2.1.1 Tensile strength, Modulus of elasticity, Poisson’s coefficient and fracture properties 23
2.1.1.1 Tensile strength [1] 23
2.1.1.2 Design compressive and tensile strengths of the concrete [2] 24
2.1.1.3 Modulus of elasticity of concrete [1][2] 24
2.1.1.4 Poisson’s coefficient 𝝊 [2] 25
2.1.1.5 Fracture energy 𝑮𝑭 [N/m] 25
2.1.2 Stress-strain relations for concrete [2] 26
2.1.2.1 Parabola-rectangle diagram for concrete under compression 26
2.1.2.2 Bi-linear stress-strain diagram 27
2.1.2.3 Rectangular stress distribution 28
2.1.3 Stress-strain relationship for reinforcing steel [2] 29
2.1.3.1 Real stress-strain diagram 29
2.1.3.2 Idealized and design stress-strain diagram 29
2.1.4 Bending cracks 30
2.1.4.1 Model Code 1990 [10][11] 30
2.1.4.2 Model Code 2010 [1][10] 36
2.1.4.3 Eurocode 2 crack width calculation [2] 37
2.1.5 Shear cracks 39
2.1.5.1 Eurocode 2 formulation [2][10][22] 41
2.1.5.2 Model Code 2010 [1][10] 41
2.1.6 Cracks induced by deformation restraint [1][10] 42
2.1.7 The crack width along the concrete cover of reinforced concrete [10] 48
2.1.7.1 Crack width and bond in concrete 48
2.1.7.2 Crack width along the concrete cover 55
2.1.8 Crack model based on fracture mechanics 56
2.1.9 Crack model based on tension stiffening [10] 57
TITEL
Discrete element analysis of the cracking behaviour of reinforced concrete ties during tensile testing
DATUM
31/05/2020
PAGINA
5/216
2.2.1 Lattice discrete particle model formulation 58
2.2.1.1 Geometrical characterization of the concrete meso-structure 61
2.2.1.2 Discrete compatibility and equilibrium equations 65
2.2.1.3 LDPM constitutive law 65
2.2.2 Lattice discrete particle model calibration and validation 75
2.2.3 Concluding remarks about the lattice discrete particle model 80
3 Discrete element analysis 81
3.1 Experimental research done by Gribniak and Rimkus [80] 81
3.1.1 Theory based on literature 81
3.1.2 Test program 82
3.1.2.1 Characteristics of the reinforced concrete ties 83
3.1.2.2 Test results 88
3.2 Calibration of the model 97
3.2.1 Calibration of the concrete 97
3.2.1.1 Cylindrical compression test setup 97
3.2.1.2 Calibrated concrete 1: Concrete specimen with the tensile strength equal to 3.24 MPa 98 3.2.1.3 Calibrated concrete 2: Concrete specimen with the tensile strength equal to 2.896 MPa 103 3.2.1.4 Calibrated concrete 3: Concrete specimen with the tensile strength equal to 2.6064 MPa 105
3.2.1.5 Comparison between the three calibrated concretes 107
3.2.2 Calibration of the tensile test 110
3.2.2.1 Setup and materials 110
3.2.2.2 Numerical model for the tensile test 110
3.2.2.3 Digitalized results of the average strains 111
3.2.2.4 Influence of the boundary conditions of the loading plates 112
3.2.2.5 Rebar-concrete interaction according to the Model Codes 1990 and 2010 [1][11] 118 3.2.2.6 Bond conditions based on the paper written by prof. Gribniak et al. [98][99] 126
3.2.2.7 Sensitivity study bond model parameters 130
3.2.2.8 Influence of the bond shape parameter 𝜶 153
3.2.2.9 Calibration of the averaged continuous bond model 157
3.2.2.10 Discrete bond model versus averaged bond model 165
3.2.2.11 Elastic versus elasto-plastic material behaviour of the steel reinforcement 168
3.2.2.12 Solving the instability issues 170
3.2.2.13 Influence of the concrete Young’s modulus 171
3.2.2.14 Changing the tensile strength of the concrete specimen 178
3.3 Final model using the averaged continuous bond model 180
3.4 Comparison between the crack widths and crack spacings calculated according to the
Model Code 2010 and the ones received from the numerical simulations 184
3.4.1 Calculation of the crack width and crack spacing according to the Model Code 2010 [1]. 184
3.4.1.1 Crack spacing 184
3.4.1.2 Crack width 185
3.4.2 Comparison between the calculated values according to the Model Code 2010 and the
numerical results for the final model 187
TITEL
Discrete element analysis of the cracking behaviour of reinforced concrete ties during tensile testing
DATUM
31/05/2020
PAGINA
6/216
3.4.2.2 Comparison with the final model 189
3.5 Influence of the particle placement on the average concrete strains, on the average
reinforcement strains and on the cracking pattern 192
3.6 Influence of the tensile strength of the concrete specimen on the average concrete strains,
on the average reinforcement strains and on the cracking pattern 198
4 Randomness of the experimental results 207
5 Conclusion 208
References 212
LIST OF FIGURES
Figure 1: Limit values of the crack width 𝑤𝑙𝑖𝑚 [mm] [2] ... 22
Figure 2: Effect of types of aggregate on the modulus of elasticity [1] ... 24
Figure 3: Coefficient 𝐺𝑓, 𝑐ℎ𝑎𝑟𝑡 in function of the maximum aggregate size [13]... 26
Figure 4: Parabola-rectangle diagram for concrete under compression [2] ... 27
Figure 5: Bi-linear stress-strain diagram for concrete in compression [2] ... 28
Figure 6: Rectangular stress distribution [2] ... 28
Figure 7: Real stress-strain diagram for reinforcing steel in tension [2] ... 29
Figure 8: Idealized and design stress-strain diagram for reinforcing steel in tension [2] ... 29
Figure 9: Equilibrium of the reinforcing bar between the section of the crack and the section of zero slip [10][11] ... 30
Figure 10: Equilibrium between the section of the crack and the section of zero slip, crack located at end of transfer length [10][11] ... 31
Figure 11: Test results of the ad hoc experiments by Vitek [11] ... 32
Figure 12: Effect of the cover on crack width [11] ... 33
Figure 13: Influence of the concrete cover on the crack spacing for two different beams 25-20-00 and 25-70-00 [11] ... 33
Figure 14: Physical process I that describes the effects of the concrete cover [10] ... 34
Figure 15: Influence of the effective reinforcement ratio on the mean crack spacing [10] ... 35
Figure 16: Force distribution in bending and in tension [2][10] ... 36
Figure 17: Model Code 1990, difference between bending/flexure and tension [10][11] ... 36
Figure 18: Comparison between the calculated and the measured crack spacings [10] ... 37
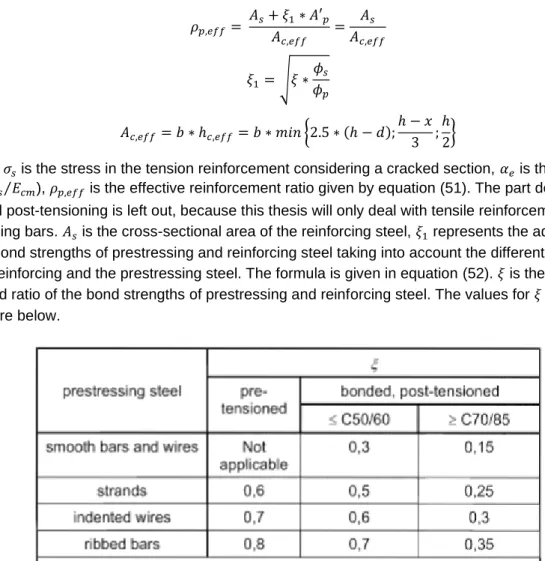
Figure 19: Ratio of bond strength 𝜉 between tendons and reinforcing steel [2] ... 38
Figure 20: Determination of the effective height of the concrete part in tension ℎ𝑐, 𝑒𝑓𝑓 [2] ... 39
Figure 21: Cracks occurring in a concrete element [10] ... 40
Figure 22: Principle stresses and the circle of Mohr [10] ... 40
Figure 23: Failure surface formulation [10][23] ... 42
Figure 24: Strength of the concrete under dual axis stress state [10] ... 42
Figure 25: Behaviour of a reinforced prismatic bar subjected to imposed deformation [1] ... 43
Figure 26: Simplified load-strain relation for a centrically reinforced member subjected to tension [1] 43 Figure 27: Values for 𝜏𝑏𝑚𝑠, 𝛽 and 𝜂𝑟 [1] ... 45 Figure 28: Steel, concrete and bond stresses in the disturbed area for the crack formation phase (simplified approach); (a) Centrically reinforced tensile member with a crack; (b) Discontinuity area;
TITEL
Discrete element analysis of the cracking behaviour of reinforced concrete ties during tensile testing
DATUM
31/05/2020
PAGINA
7/216
(c) Steel stress development in the disturbed area; (d) Concrete stress development in the disturbed
area; (e) Development of bon stress in the disturbed area [1] ... 46
Figure 29: Force-elongation relation for prismatic reinforced concrete bars considering the influence of cracking [10] ... 47
Figure 30: Moment-curvature relation for a prismatic reinforced concrete beam taking into account the effect of shrinkage [10] ... 47
Figure 31: Bond stress versus slip response for deformed reinforcement [10] ... 49
Figure 32: Crack width calculated from the differential equation of bond-slip, with the assumption of the initial crack pattern [27] ... 52
Figure 33: Parameters needed for the bond stress distribution [1] ... 53
Figure 34: Notations for the bar spacing [1] ... 54
Figure 35: Confinement coefficients for transverse confinement [1] ... 54
Figure 36: Analytical bond stress-slip relation for monotonic loading [1] ... 55
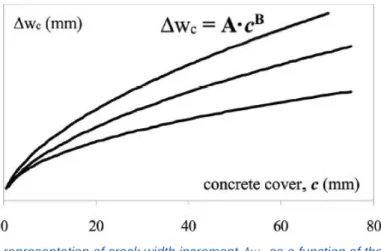
Figure 37: Schematic representation of crack width increment 𝛥𝑤𝑐 as a function of the concrete cover c [10] ... 56
Figure 38: Exponential law for the crack band model [10][30] ... 56
Figure 39: Concrete element with embedded bar under uniaxial tension [10][33] ... 58
Figure 40: Tension stiffening concrete stress component [10][35] ... 58
Figure 41: Voronoi diagram [49] ... 60
Figure 42: Particle system for a dog-bone shaped specimen. [35] ... 62
Figure 43: Dog-bone shaped specimen after TetGen simulation [35] ... 62
Figure 44: Tessellation of a tetrahedron [35] ... 63
Figure 45: Selection of the edge-points E [35] ... 64
Figure 46: Determination of the face-points, step 1 [35] ... 64
Figure 47: Determination of the tet-points, step 1 [35] ... 64
Figure 48: Polyhedral cell [35] ... 65
Figure 49: Comparison between the estimates according to formulas (104) and (105) and the values obtained through LDPM simulations [35] ... 66
Figure 50: Stress path in a heterogeneous material under compressive loading [35] ... 67
Figure 51: Strength limit for the effective stress (solid line) [35] ... 69
Figure 52: Unloading-reloading rule for the fracture formulation [35] ... 70
Figure 53: Normal stress as a function of the normal strain for compression conditions [35] ... 73
Figure 54: Shear strength as a function of the negative normal stresses (frictional behaviour) [35] ... 74
Figure 55: Shear stress versus shear strain curve [35] ... 74
Figure 56: Fracture tests setup, (a) cylindrical specimen; (b) Dog-bone shaped specimen [64] ... 78
Figure 57: Failure modes fracture tests (left) cylindrical specimen; (right) Dog-bone shaped specimen [64] ... 78
Figure 58: Load-displacement curves for the splitting and fracture tests (Left) Cylindrical specimens; (Right) Dog-bone shaped specimens [64] ... 79
Figure 59: Test setup for concrete prisms reinforced with multiple bars [80]... 82
Figure 60: Cross-sections of the different types of reinforced concrete ties, dimensions in mm [80] .. 83
Figure 61: Different reinforcing bar diameters [80] ... 83
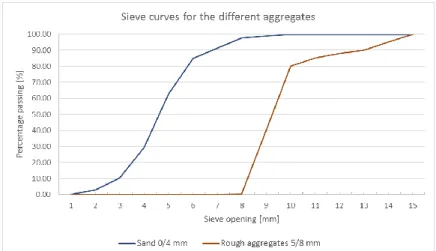
Figure 62: Sieve curves for the different aggregates ... 85
Figure 63: Comparison between the experimental sieve curve and the theoretical Fuller curves ... 85
Figure 64: Curve fitting, linearized connections between the points ... 87
TITEL
Discrete element analysis of the cracking behaviour of reinforced concrete ties during tensile testing
DATUM
31/05/2020
PAGINA
8/216
Figure 66: Characteristics of the test specimens [80] ... 88 Figure 67: Cracking pattern for the reinforced concrete ties with a reinforcement ratio of 1.4% and a cover of 30 mm [80] ... 89 Figure 68: Cracking pattern for the reinforced concrete ties with a reinforcement ratio of 2.0% and a cover of 30 mm [80] ... 89 Figure 69: Cracking pattern for the reinforced concrete ties with a reinforcement ratio of 2.7% and a cover of 30 mm [80] ... 90 Figure 70: Crack development identified by the DIC system (DNE = Does not exist) [80] ... 91 Figure 71: Crack development identified by the DIC system for the reinforced concrete ties with different concrete covers [80] ... 91 Figure 72: Crack pattern for the reinforced concrete ties with a reinforcement ratio of 1.4%,
comparison between two different concrete covers [80] ... 92 Figure 73: Cracking pattern for the short reinforced concrete ties and for the long tie P7L-4x10 [80] 93 Figure 74: Distribution of the relative displacements of the surfaces of the reinforced concrete ties P3-4x10, P4-16x5, P2-4x12 and P1-16x6 [80] ... 94 Figure 75: Cumulative surface deformations of ties reinforced with different number of bars
[dimensions in mm] [80] ... 95 Figure 76: Location of the stabilized cracking phase [80] ... 95 Figure 77: Crack distances sorted by the ratio of the reinforcing bar diameter to the reinforcement ratio [80] ... 96 Figure 78: Influence of the ratio 𝜙𝜌 on the maximum crack spacing [80] ... 97 Figure 79: Concrete Cylindrical Compression Test – Paraview visualization ... 98 Figure 80: Physical and geometrical characteristics of the three reinforced concrete ties used for validation and calibration [80] ... 100 Figure 81: Concrete cylindrical compressive strength test, 𝑓𝑐𝑡𝑚 = 3.24 MPa – shear strength ratio = 2.8 ... 101 Figure 82: Mean cylindrical concrete compressive strength vs. Shear strength ratio – 𝑓𝑐𝑡𝑚 = 3.24 MPa ... 102 Figure 83: Concrete cylindrical compressive strength test, 𝑓𝑐𝑡𝑚 = 3.24 𝑀𝑃𝑎 – shear strength ratio = 3.836 ... 103 Figure 84: Concrete cylindrical compressive strength test, 𝑓𝑐𝑡𝑚 = 2.896 MPa – shear strength ratio = 3.836 ... 103 Figure 85: Mean cylindrical concrete compressive strength vs. Shear strength ratio – 𝑓𝑐𝑡𝑚 = 2.896 MPa ... 104 Figure 86: Concrete cylindrical compressive strength test, 𝑓𝑐𝑡𝑚 = 2.896 MPa – shear strength ratio = 4.523942 ... 105 Figure 87: Concrete cylindrical compressive strength test, 𝑓𝑐𝑡𝑚 = 2.6064 MPa – shear strength ratio = 4.523942... 106 Figure 88: Concrete cylindrical compressive strength test, 𝑓𝑐𝑡𝑚 = 2.6064 MPa – shear strength ratio = 5.25682... 106 Figure 89: Mean cylindrical concrete compressive strength vs. Shear strength ratio – 𝑓𝑐𝑡𝑚 = 2.6064 MPa ... 107 Figure 90: Mean cylindrical concrete compressive strength vs. Shear strength ratio – comparison between the three concretes ... 108 Figure 91: Comparison between the calibrated concretes; average concrete strain – concrete mean cylindrical compression strength graph, complete view ... 109
TITEL
Discrete element analysis of the cracking behaviour of reinforced concrete ties during tensile testing
DATUM
31/05/2020
PAGINA
9/216
Figure 92: Comparison between the calibrated concretes; average concrete strain – concrete mean
cylindrical compression strength graph, zoomed view ... 109
Figure 93: Cross-sectional area of the reinforced concrete specimens [80] ... 110
Figure 94: Numerical model for the tensile test, Paraview visualization ... 111
Figure 95: Digitalized graph of the experimentally measured average concrete strains versus the total load ... 112
Figure 96: Digitalized graph of the experimentally measured average reinforcement strains versus the total load ... 112
Figure 97: Influence of the rotations of the bottom loading plate on the average concrete strains; (L) Strains measured with strain gauge, (R) Strains measured with LVDT ... 113
Figure 98: Influence of the rotations of the bottom loading plate on the average reinforcement strains; (L) Strains measured with strain gauge, (R) Strains measured with LVDT ... 113
Figure 99: Influence of the rotations of the bottom loading plate on the average bare bar strains .... 114
Figure 100: Influence of the rotations of the bottom loading plate on the global cracking behaviour, Paraview visualization; (a) Rotations fixed, (b) Rotations free ... 114
Figure 101: Comparison between case 1 and case 2 for the strain versus total load graphs: a. Average concrete strain (measured with strain gauge) vs. total load; b. Average concrete strain (measured with LVDT) vs. total load; c. Average reinforcement strain (measured with strain gauge) vs. total load; d. Average reinforcement strain (measured with LVDT) vs. total load; e. Average bare bar strain vs. total load ... 116
Figure 102: Concluding figure about the influence of the boundary conditions on the average concrete and reinforcement strains ... 118
Figure 103: Comparison between the kinetic energy and the internal work; bond model MC90 no good bond ... 120
Figure 104: Average strains versus total load, bond model MC90 no good bond ... 120
Figure 105: Paraview simulation, bond model MC90 no good bond ... 121
Figure 106: Comparison kinetic energy versus internal work; Bond mode MC90, good bond conditions ... 122
Figure 107: Average strains of the concrete outer surface and the reinforcement versus the total load, bond model MC90, good bond conditions ... 122
Figure 108: Paraview visualization; bond model MC90, good bond conditions ... 123
Figure 109: Reinforcing bars, clear rib spacing ... 124
Figure 110: Influence of the MC2010 pull-out bond model on the average concrete strains ... 124
Figure 111: Influence of the MC2010 pull-out bond model on the average reinforcement strains .... 125
Figure 112: Bond model proposed by Gribniak et al. [98] ... 126
Figure 113: Comparison between the MC2010 bond model for pull-out failure and the Gribniak bond model, average concrete strains; (L) Full graph, (R) Detail of elastic part ... 127
Figure 114:Comparison between the MC2010 bond model for pull-out failure and the Gribniak bond model, average reinforcement strains ... 128
Figure 115: Influence of the two averaged bond models on the average concrete strains; (L) Complete view, (R) Zoomed view ... 129
Figure 116: Influence of the two averaged bond models on the average reinforcement strains; (L) Complete view, (R) Zoomed view ... 130
Figure 117: Bond strength-slip curve defined by the Model Code 2010 [1] ... 130
Figure 118: Influence of changing the maximum bond strength on the bond strength-slip curve; Part show until a slip equal to the second slip coefficient ... 132
TITEL
Discrete element analysis of the cracking behaviour of reinforced concrete ties during tensile testing
DATUM
31/05/2020
PAGINA
10/216
Figure 119: Sensitivity study: Influence of the bond strength, increase/decrease by 10%; (L) complete view, (R) Zoomed view ... 132 Figure 120: Sensitivity study: Influence of the bond strength, decrease by 20% and 30%; (L) complete view, (R) Zoomed view ... 133 Figure 121: Sensitivity study: Influence of the bond strength, increase by 20% and 30%; (L) complete view, (R) Zoomed view ... 133 Figure 122: Sensitivity study: Influence of the bond strength on the cracking load and on the cracking average concrete strain ... 134 Figure 123: Sensitivity study: Influence of the bond strength on the average reinforcement strains; (L) Increase/decrease by 10%, (R) decrease by 20% and 30% ... 135 Figure 124: Sensitivity study: Influence of the bond strength on the average reinforcement strains; Increase by 20% and 30% ... 136 Figure 125: Sensitivity study: Influence of the bond strength on the cracking behaviour of the
reinforced concrete ties; (a) Experimental results, (b) Starting point, (c) bond strength -10%, (d) bond strength +10%, (e) bond strength -20%, (f) bond strength -30%, (g) bond strength +20% and (h) bond strength +30% ... 137 Figure 126: Sensitivity study: Influence of the residual bond strength on the average concrete strains; (L) complete view, (R) Zoomed view ... 138 Figure 127: Sensitivity study: Influence of the residual bond strength on the average reinforcement strains ... 138 Figure 128: Influence of the residual bond strength on the cracking behaviour of the reinforced ties; (a) experimental results, (b) starting point, (c) residual bond strength -10%, (d) residual bond strength +10%, (e) residual bond strength -50% and (f) residual bond strength +50% ... 139 Figure 129: Influence of changing the first slip coefficient 𝑠1, while keeping the maximum bond
strength 𝜏𝑏, 𝑚𝑎𝑥 constant, on the bond strength-slip curve; Only the part until the first slip coefficient is shown ... 140 Figure 130: Sensitivity study: Influence of the first slip coefficient 𝑠1 on the average concrete strains, increase/decrease by 10%; (L) complete view, (R) Zoomed view ... 140 Figure 131: Sensitivity study: Influence of the first slip coefficient 𝑠1 on the average concrete strains, decrease by 20% and 30%; (L) complete view, (R) Zoomed view ... 141 Figure 132: Sensitivity study: Influence of the first slip coefficient 𝑠1 on the average concrete strains, decrease by 40% and 50%; (L) complete view, (R) Zoomed view ... 141 Figure 133: Sensitivity study: Influence of the first slip coefficient 𝑠1 on the average concrete strains, decrease by 90%; (L) complete view, (R) Zoomed view ... 142 Figure 134: Sensitivity study: Influence of the first slip coefficient 𝑠1 on the cracking load and on the cracking average concrete strain ... 143 Figure 135: Sensitivity study: Influence of the first slip coefficient 𝑠1 on the average reinforcement strains; (a) Increase by 10% and decrease by 10%, 20% and 30%, (b) decrease by 40% and 50% 144 Figure 136: Sensitivity study: Influence of the first slip coefficient 𝑠1 on the average reinforcement strains; decrease by 90% ... 145 Figure 137: Influence of the first slip coefficient 𝑠1 on the cracking behaviour of the reinforced ties; (a) experimental results, (b) starting point, (c) slip coefficient 𝑠1 +10%, (d) slip coefficient 𝑠1 -10%, (e) slip coefficient 𝑠1 20%, (f) slip coefficient 𝑠1 30%, (g) slip coefficient 𝑠1 40% and (h) slip coefficient 𝑠1 -50% ... 146 Figure 138: Influence of the first slip coefficient 𝑠1 on the cracking behaviour of the reinforced ties; (a) experimental results, (b) starting point and (c) slip coefficient 𝑠1 -90% ... 147
TITEL
Discrete element analysis of the cracking behaviour of reinforced concrete ties during tensile testing
DATUM
31/05/2020
PAGINA
11/216
Figure 139: Sensitivity study: Influence of the second slip coefficient 𝑠2 on the average concrete strains, decrease of 10% and increase of 10%, 50% and 100%; (L) Complete view, (R) Zoomed view ... 147 Figure 140: Sensitivity study: Influence of the second slip coefficient 𝑠2 on the average reinforcement strains ... 148 Figure 141: Sensitivity study: Influence of the second slip coefficient 𝑠2 on the cracking pattern of the reinforced concrete ties; (a) experimental results, (b) starting case, (c) second slip coefficient 𝑠2 -10%, (d) second slip coefficient 𝑠2 +-10%, (e) second slip coefficient 𝑠2 +50% and (f) second slip coefficient 𝑠2 +100% ... 149 Figure 142: Sensitivity study: Influence of the third slip coefficient 𝑠3 on the average concrete strains; (a) complete view, (b) Zoomed view ... 150 Figure 143: Sensitivity study: Influence of the third slip coefficient 𝑠3 on the average reinforcement strains; complete view ... 150 Figure 144: Sensitivity study: Influence of the third slip coefficient on the cracking behaviour of the reinforced concrete ties; (a) experimental results, (b) starting case 𝑠3 = 14 mm, (c) slip coefficient 𝑠3 +10% and (d) slip coefficient 𝑠3 -10% ... 151 Figure 145: Bond strength 𝜏𝑏 as a function of the first slip coefficient 𝑠1 for a certain slip value; (Blue) slip s = 0.025 mm, (Orange) slip s = 0.05 mm, (Grey) slip s = 0.075 mm and (Yellow) slip s = 0.1 mm ... 152 Figure 146: Influence of the bond shape parameter on the average concrete strains; 𝛼 = 0.4 (Orange curve), 𝛼 = 0.5 (Yellow curve), 𝛼 = 0.6 (Light blue curve); (L) Complete view, (R) Zoomed view ... 154 Figure 147: Influence of the bond shape parameter on the average concrete strains; 𝛼 = 0.4 (Orange curve), 𝛼 = 0.7 (Green curve), 𝛼 = 0.8 (Dark blue curve); (L) Complete view, (R) Zoomed view ... 154 Figure 148: Influence of the bond shape parameter on the average concrete strains; α = 0.4 (Orange curve), α = 0.9 (Brown curve), α = 1.0 (Dark grey curve); (L) Complete view, (R) Zoomed view ... 155 Figure 149: Influence of the bond shape parameter on the average reinforcement strains; (L) Orange curve: 𝛼 = 0.4, Yellow curve: 𝛼 = 0.5 and Light blue curve: 𝛼 = 0.6; (R) Orange curve: 𝛼 = 0.4, Green curve: 𝛼 = 0.7 and Dark blue curve: 𝛼 = 0.8 ... 156 Figure 150:Influence of the bond shape parameter on the average reinforcement strains; Orange curve: α = 0.4, Brown curve: α = 0.9 and Dark grey curve: α = 1.0 ... 156 Figure 151: Bond strength-slip curve for the standard bond model (Light blue curve), the first
proposed bond model (Orange curve) and the second proposed bond model (Dark blue curve) ... 158 Figure 152: Influence of the first slip coefficient 𝑠1 on the average concrete strains, constant
maximum bond strength applied; first proposed bond model ... 159 Figure 153: Influence of the first slip coefficient 𝑠1 on the average reinforcement strains, constant maximum bond strength applied; first proposed bond model ... 159 Figure 154: Influence of the maximum bond strength on the average concrete strains, while keeping the first slip coefficient 𝑠1 constant; second proposed bond model ... 160 Figure 155: Influence of the maximum bond strength on the average reinforcement strains, while keeping the first slip coefficient 𝑠1 constant; second proposed bond model ... 160 Figure 156: Comparison between the two proposed bond models; (L) Average concrete strains, (R) Average reinforcement strains ... 161 Figure 157: Difference between the first and the third proposed bond model; (L) Average concrete strains, (R) Average reinforcement strains ... 162 Figure 158: Comparison between the first and the fourth proposed bond model; Average concrete strain vs. Total load, (L) Complete view, (R) Zoomed view... 163
TITEL
Discrete element analysis of the cracking behaviour of reinforced concrete ties during tensile testing
DATUM
31/05/2020
PAGINA
12/216
Figure 159: Comparison between the first and the fourth proposed bond model; Average
reinforcement strain vs. Total load ... 163 Figure 160: Comparison between the first and the fifth proposed bond model; Average concrete strain vs. Total load, (L) Complete view, (R) Zoomed view ... 164 Figure 161: Comparison between the first and the fifth proposed bond model; Average reinforcement strain vs. Total load ... 165 Figure 162: Comparison between the discrete bond model and the averaged continuous bond model; average concrete strains vs. total load ... 166 Figure 163: Comparison between the discrete bond model and the averaged continuous bond model; average reinforcement strains vs. total load ... 167 Figure 164: Difference in average concrete strain between the elastic and the plastic material model for the steel reinforcement; averaged continuous bond model ... 168 Figure 165: Difference in average reinforcement strain between the elastic and the plastic material model for the steel reinforcement; averaged continuous bond model ... 169 Figure 166: Difference between the elastic and the plastic material model for the steel reinforcement, (L) average concrete strain vs. total load, (R) average reinforcement strain vs. total load; discrete bond model ... 169 Figure 167: Influence of the dynamic relaxation, relaxation by 10%; (L) Influence on the average concrete strains, (R) Influence on the average reinforcement strains ... 170 Figure 168: Influence of the dynamic relaxation; (Orange curve) 10%, (Yellow curve) 8%; (L) Influence on the average concrete strains, (R) Influence on the average reinforcement strains ... 171 Figure 169: Influence of the concrete stiffness (Young's modulus) on the average concrete strains, bond shape parameter 𝛼 = 0.8; (L) Complete view, (R) Zoomed view ... 173 Figure 170: Influence of the concrete stiffness (Young's modulus) on the average reinforcement strains, bond shape parameter 𝛼 = 0.8 ... 174 Figure 171: Influence of the concrete stiffness (Young's modulus) on the average concrete strains, bond shape parameter 𝛼 = 1.0; Concrete stiffnesses: E = 55709.3 MPa, E+10%, E+15% and E+20%; (L) Complete view, (R) Zoomed view ... 175 Figure 172: Influence of the concrete stiffness (Young's modulus) on the average concrete strains, bond shape parameter α = 1.0; Concrete stiffnesses: E = 55709.3 MPa, E+25% and E+30%; (L) Complete view, (R) Zoomed view ... 175 Figure 173: Influence of the concrete stiffness (Young's modulus) on the average concrete strains, bond shape parameter α = 1.0; Concrete stiffnesses: E = 55709.3 MPa, E+35% and E+40%; (L) Complete view, (R) Zoomed view ... 176 Figure 174: Influence of the concrete stiffness (Young's modulus) on the average reinforcement strains, bond shape parameter 𝛼 = 1.0 ... 177 Figure 175: Influence of the concrete mean tensile strength on the average concrete strains,
𝐸𝑐, 𝑚𝑒𝑠𝑜 = 77993.02 𝑀𝑃𝑎; (L) Complete view, (R) Zoomed view ... 178 Figure 176: Influence of the concrete mean tensile strength on the average reinforcement strains, 𝐸𝑐, 𝑚𝑒𝑠𝑜 = 77993.02 𝑀𝑃𝑎 ... 179 Figure 177: Final calibrated model; (L) Average concrete strains, (R) Average reinforcement strains ... 181 Figure 178: Analysis of the different phases of the cracking process for the final model ... 181 Figure 179: First three visualizations in the cracking process; (L) End of linear-elastic phase (A), (M) Beginning of the first crack formation phase (B), (R) End of first crack formation phase (C) ... 182
TITEL
Discrete element analysis of the cracking behaviour of reinforced concrete ties during tensile testing
DATUM
31/05/2020
PAGINA
13/216
Figure 180: Last two visualizations of the cracking process; (L) Beginning of the second crack
formation phase (D), (R) End of the second crack formation phase (E) ... 183 Figure 181: Comparison between the cracking pattern for the experimental test and the numerical simulation of the final model (P2), 𝜀𝑠 = 0.0005 ... 183 Figure 182: Comparison between the bond strength - slip curves achieved from the numerical
simulations and the theoretical one ... 184 Figure 183: Influence of the concrete tensile strength on the crack width - NBN EN 1992 ... 187 Figure 184: Comparison between the crack widths calculated according to the standard NBN EN 1992 and the numerical crack widths ... 189 Figure 185: Crack spacing for the numerical simulation of the final model... 190 Figure 186: Reinforcement strain as a function of time for the final model ... 190 Figure 187: Comparison between the numerical and the calculated crack widths for the final model ... 192 Figure 188: Influence of the particle placement on the average concrete strains; (L) Complete view, (R) Zoomed view ... 193 Figure 189: Influence of the particle placement on the average reinforcement strains ... 194 Figure 190: Influence of the particle placement on the cracking pattern of the reinforced concrete ties; (a) experimental results, (b) standard case: seed = 34567, (c) seed = 34500 and (d) seed = 34600 194 Figure 191: Influence of the granulate placement on the local cracking behaviour, looking at a
reinforcement strain equal to 0.001; (a) Steel stresses occurring in the reinforcement bars at the location of the crack, seed = 34567, (b) Steel stresses occurring in the reinforcement bars at the location of the crack, seed = 34500, (c) Steel stresses occurring in the reinforcement bars at the location of the crack, seed = 34600 ... 195 Figure 192: Influence of the granulate placement on the local cracking behaviour, looking at a
reinforcement strain equal to 0.001 and a seed number of 34567, crack widths given in meter; (a) crack widths for the plane with constant x = -0.075 m, (b) crack widths for the plane with constant x = 0.075 m, (c) crack widths for the plane with constant y = -0.075 m and (d) crack widths for the plane with constant y = 0.075 m ... 196 Figure 193: Influence of the granulate placement on the local cracking behaviour, looking at a
reinforcement strain equal to 0.001 and a seed number of 34500, crack widths given in meter; (a) crack widths for the plane with constant x = -0.075 m, (b) crack widths for the plane with constant x = 0.075 m, (c) crack widths for the plane with constant y = -0.075 m and (d) crack widths for the plane with constant y = 0.075 m ... 196 Figure 194: Influence of the granulate placement on the local cracking behaviour, looking at a
reinforcement strain equal to 0.001 and a seed number of 34600, crack widths given in meter; (a) crack widths for the plane with constant x = -0.075 m, (b) crack widths for the plane with constant x = 0.075 m, (c) crack widths for the plane with constant y = -0.075 m and (d) crack widths for the plane with constant y = 0.075 m ... 197 Figure 195: Influence of the tensile strength of the concrete specimen on the average concrete strains; (L) complete view, (R) zoomed view ... 198 Figure 196: Influence of the tensile strength of the concrete specimen on the average reinforcement strains; (L) complete view, (R) zoomed view ... 200 Figure 197: Influence of the tensile strength on the cracking pattern of the reinforced concrete ties, reinforcement strain = 0.0005; (a) Experimental results, (b) 𝑓𝑐𝑡𝑚 = 3.24 MPa, (c) 𝑓𝑐𝑡𝑚 = 2.896 MPa and (d) 𝑓𝑐𝑡𝑚 = 2.6064 MPa ... 201
TITEL
Discrete element analysis of the cracking behaviour of reinforced concrete ties during tensile testing
DATUM
31/05/2020
PAGINA
14/216
Figure 198: Influence of the tensile strength on the cracking pattern of the reinforced concrete ties, reinforcement strain = 0.001; (a) Experimental results, (b) 𝑓𝑐𝑡𝑚= 3.24 MPa, (c) 𝑓𝑐𝑡𝑚 = 2.896 MPa and (d) 𝑓𝑐𝑡𝑚 = 2.6064 MPa ... 201 Figure 199: Influence of the tensile strength on the cracking pattern of the reinforced concrete ties, moment of ultimate load; (a) Experimental results, (b) 𝑓𝑐𝑡𝑚 = 3.24 MPa, (c) 𝑓𝑐𝑡𝑚 = 2.896 MPa and (d) 𝑓𝑐𝑡𝑚 = 2.6064 MPa ... 202 Figure 200: Influence of the concrete tensile strength on the local cracking behaviour, looking at a reinforcement strain equal to 0.0008823, steel stresses given in Pascals; (a) Steel stresses occurring in the reinforcement bars at the location of the crack, 𝑓𝑐𝑡𝑚 = 3.24 MPa, (b) Steel stresses occurring in the reinforcement bars at the location of the crack, 𝑓𝑐𝑡𝑚 = 2.896 MPa, (c) Steel stresses occurring in the reinforcement bars at the location of the crack, 𝑓𝑐𝑡𝑚 = 2.6064 MPa ... 203 Figure 201: Influence of the concrete tensile strength on the local cracking behaviour, looking at a reinforcement strain equal to 0.0008823 and a concrete tensile strength of 3.24 MPa, crack widths given in meter; (a) crack widths for the plane with constant x = -0.075 m, (b) crack widths for the plane with constant x = 0.075 m, (c) crack widths for the plane with constant y = -0.075 m and (d) crack widths for the plane with constant y = 0.075 m ... 204 Figure 202: Influence of the concrete tensile strength on the local cracking behaviour, looking at a reinforcement strain equal to 0.0008823 and a concrete tensile strength of 2.896 MPa, crack widths given in meter; (a) crack widths for the plane with constant x = -0.075 m, (b) crack widths for the plane with constant x = 0.075 m, (c) crack widths for the plane with constant y = -0.075 m and (d) crack widths for the plane with constant y = 0.075 m ... 204 Figure 203: Influence of the concrete tensile strength on the local cracking behaviour, looking at a reinforcement strain equal to 0.0008823 and a concrete tensile strength of 2.6064 MPa, crack widths given in meter; (a) crack widths for the plane with constant x = -0.075 m, (b) crack widths for the plane with constant x = 0.075 m, (c) crack widths for the plane with constant y = -0.075 m and (d) crack widths for the plane with constant y = 0.075 m ... 205 Figure 204: Final calibrated model; (L) Average concrete strain vs. total load, (R) Average
reinforcement strain vs. total load ... 210 Figure 205: Comparison between the experimentally and the numerically achieved cracking pattern ... 210
TITEL
Discrete element analysis of the cracking behaviour of reinforced concrete ties during tensile testing
DATUM
31/05/2020
PAGINA
15/216
LIST OF TABLES
Table 1: Geometrical characteristics of the concrete meso-structure ... 75
Table 2: Concrete mixture of the specimens ... 83
Table 3: Sieve test for the sand 0/4 mm... 84
Table 4: Sieve test for the coarse aggregate 5/8 mm ... 84
Table 5: Experimentally achieve datapoints for the sieve curve fitting ... 85
Table 6: Mean concrete cylindrical compressive strength as a function of the shear strength ratio – 𝑓𝑐𝑡𝑚 = 3.24 MPa ... 101
Table 7: Influence of the change in shear strength ratio on the mean cylindrical compressive strength in percentage, 𝑓𝑐𝑡𝑚 = 3.24 MPa ... 102
Table 8: Mean concrete cylindrical compressive strength as a function of the shear strength ratio – 𝑓𝑐𝑡𝑚 = 2.896 MPa ... 104
Table 9: Mean concrete cylindrical compressive strength as a function of the shear strength ratio – 𝑓𝑐𝑡𝑚 = 2.6064 MPa ... 106
Table 10: Rotational boundary conditions of the loading plates ... 117
Table 11: Overview of the different bond strengths depending on the reinforcing bar diameter ... 128
Table 12: Sensitivity study: Influence of the bond strength on the cracking load and on the cracking average concrete strain ... 133
Table 13: Influence of the bond strength on the cracking load, difference between the cracking load achieved from the simulations and the ones from the formula ... 135
Table 14: Sensitivity study: Influence of the first slip coefficient 𝑠1 on the cracking load and on the cracking average concrete strain ... 142
Table 15: Influence of the first slip coefficient on the cracking load, difference between the cracking load achieved from the simulations and the ones from the formula ... 143
Table 16: Influence of the bond shape parameter on the bond stiffness, according to the "Mars" definition ... 153
Table 17: Influence of the bond shape parameter on the total load and on the average concrete strain at which crack initiation occurs ... 155
Table 18: Bond model parameters for the bond models proposed in the conclusion of paragraph 3.2.2.7 ... 157
Table 19: Calculated bond stiffnesses for the three bond models ... 158
Table 20: Discrete versus continuous bond model; Different bond models: Strong bond model, normal bond model and averaged bond model ... 166
Table 21: Influence of the concrete Young's modulus, calculation of the different cases; Meso-scale concrete stiffnesses ... 172
Table 22: Influence of the concrete stiffness on the cracking load and the cracking average concrete strain, bond shape parameter 𝛼 = 0.8 ... 173
Table 23: Influence of the concrete stiffness on the cracking load and the cracking average concrete strain, bond shape parameter α = 1.0 ... 176
Table 24: Influence of the concrete mean tensile strength on the linear-elastic phase, on the cracking total load and on the average concrete strain at which crack initiation occurs ... 179
Table 25: Influence of the concrete mean tensile strength on the cracking load and on the average reinforcement strain at which the crack formation stage starts ... 180
TITEL
Discrete element analysis of the cracking behaviour of reinforced concrete ties during tensile testing
DATUM
31/05/2020
PAGINA
16/216
Table 27: Coordinates of the different defining points on the average concrete strain - total load curve; Total load, average concrete strain, average reinforcement strain and simulation time ... 182 Table 28: Influence of the concrete tensile strength on the crack width - Calculated according to the standard NBN EN 1992 [3] ... 186 Table 29: Minimum, average and maximum crack width calculated according to the standard NBN EN 1992 ... 188 Table 30: Minimum, average and maximum crack widths occurring in the numerical simulation ... 188 Table 31: Comparison between the calculated values according to the standard NBN EN 1992 and the numerical values for the reinforcement strain for the final model ... 190 Table 32: Values for the crack widths calculated according to the standard NBN EN 1992 for the final model ... 191 Table 33: Crack widths occurring in the numerical simulation for the final model ... 191 Table 34: Influence of the particle placement on the cracking load and the cracking average concrete strain ... 193 Table 35: Influence of the granulate placement on the local crack widths, numerical simulations versus calculation according to EN 1992, average reinforcement strain = 0.001 ... 197 Table 36: Influence of the tensile strength of the concrete specimen on the cracking load and the cracking average concrete strains ... 199 Table 37: Influence of the concrete tensile strength on the local crack widths, numerical simulations versus calculation according to EN 1992, average reinforcement strain = 0.0008823 ... 205 Table 38: Reinforcement strains received from the numerical simulations versus the reinforcement strains calculated according to the Model Code 2010, 𝑓𝑐𝑡𝑚 = 3.24 MPa... 206
TITEL
Discrete element analysis of the cracking behaviour of reinforced concrete ties during tensile testing
DATUM
31/05/2020
PAGINA
17/216
LIST OF ABBREVIATIONS AND SYMBOLS
English alphabet
𝐴𝑐,𝑒𝑓: Effective area of the concrete in tension
𝐴𝑠,𝑟: Steel reinforcing bar area
𝐴𝑠: Total cross-sectional steel area
c: Concrete cover
CSL: Confinement Shear Lattice model DEM: Discrete Element Model
𝑑0: Minimum particle size used in the simulation
𝑑𝑎: Maximum aggregate size used in the simulation
DIC: Digital Image Correlation 𝑑𝑚𝑎𝑥: Maximum aggregate size
DPM: Discrete Particle Model
𝐸𝑐𝑖: Mean modulus of elasticity of the concrete, according to Model Code 2010
𝐸𝑠: Modulus of elasticity of steel
𝐸𝑐𝑚: Mean modulus of elasticity of the concrete, according to the standard NBN EN 1992
𝐸𝑁𝐶: Loading-unloading stiffness
𝑓𝑐𝑑: Design compressive strength of the concrete
𝑓𝑐𝑘: Characterisitic compressive strength of the concrete
𝑓𝑐𝑚: Mean compressive strength of the concrete
𝑓𝑐𝑚,𝑏: Mean compressive strength of the concrete for a biaxial stress distribution
𝑓𝑐𝑡: Characterisitic tensile strength of the concrete
𝑓𝑐𝑡𝑏: Direction-dependent tensile strength of the concrete
𝑓𝑐𝑡𝑑: Design tensile strength of the concrete
𝑓𝑐𝑡,𝑓𝑙: Characterisitic flexural tensile strength of the concrete
𝑓𝑐𝑡𝑘;0.05: 5% fractile of the characteristic tensile strength of the concrete
𝑓𝑐𝑡𝑘,𝑚𝑖𝑛: Lower bound value tensile strength of the concrete
𝑓𝑐𝑡𝑘,𝑚𝑎𝑥: Upper bound value tensile strength of the concrete
𝑓𝑐𝑡𝑚: Mean tensile strength of the concrete
𝑓𝑐𝑡𝑚,𝑏: Mean tensile strength of the concrete for a dual axis stress distribution
𝑓𝑐𝑡𝑚,𝑓𝑙: Mean fllexural tensile strength of the concrete
𝑓𝑐𝑡𝑚,𝑠𝑝: Mean splitting tensile strength of the concrete
𝑓′𝑡: Tensile strength of the concrete, in psi
𝑓𝑦𝑘: Yield strength of the reinforcement.
𝐺𝐹: Fracture energy of the concrete
𝐺𝑓: Initial Fracture energy of the concrete
𝐻0
(
𝜔)
: Softening modulusℎ𝑏: Beam depth in mm
𝑘𝑡: Parameter representing the load duration, short-term or long-term
LDPM: Lattice Discrete Particle Model 𝑙𝑏: Anchorage length = slip length
𝑙𝑠: Transfer length between the steel reinforcement and the concrete
![Figure 2: Effect of types of aggregate on the modulus of elasticity [1]](https://thumb-eu.123doks.com/thumbv2/5doknet/3289694.21953/29.892.97.635.82.1010/figure-effect-types-aggregate-modulus-elasticity.webp)
![Figure 18: Comparison between the calculated and the measured crack spacings [10]](https://thumb-eu.123doks.com/thumbv2/5doknet/3289694.21953/42.892.157.678.113.1078/figure-comparison-calculated-measured-crack-spacings.webp)
![Figure 24: Strength of the concrete under dual axis stress state [10]](https://thumb-eu.123doks.com/thumbv2/5doknet/3289694.21953/47.892.149.681.98.808/figure-strength-concrete-dual-axis-stress-state.webp)
![Figure 59: Test setup for concrete prisms reinforced with multiple bars [80]](https://thumb-eu.123doks.com/thumbv2/5doknet/3289694.21953/87.892.123.737.146.406/figure-test-setup-concrete-prisms-reinforced-multiple-bars.webp)
![Figure 68: Cracking pattern for the reinforced concrete ties with a reinforcement ratio of 2.0% and a cover of 30 mm [80]](https://thumb-eu.123doks.com/thumbv2/5doknet/3289694.21953/94.892.95.758.88.551/figure-cracking-pattern-reinforced-concrete-reinforcement-ratio-cover.webp)
![Figure 71: Crack development identified by the DIC system for the reinforced concrete ties with different concrete covers [80]](https://thumb-eu.123doks.com/thumbv2/5doknet/3289694.21953/96.892.127.726.90.595/figure-crack-development-identified-reinforced-concrete-different-concrete.webp)
![Figure 72: Crack pattern for the reinforced concrete ties with a reinforcement ratio of 1.4%, comparison between two different concrete covers [80]](https://thumb-eu.123doks.com/thumbv2/5doknet/3289694.21953/97.892.136.723.153.549/figure-pattern-reinforced-concrete-reinforcement-comparison-different-concrete.webp)
