Comparison of measured NH4 level and NO emission to declared tar and nicotine values of hundred cigarette brands
T. M. Brunt, A.P.J. Verlaan, R.F.M.J. Cleven, B. Rambali and W. Vleeming
This investigation is performed for the account of the Directorate for Public Health of the Ministry of Health, Welfare and Sports and of the Inspectorate for Health Protection and Veterinary Public Health, within the framework of project 650270 ‘Reduction of Health and Addiction risks of smokers’
Contents
ABSTRACT ... 3 SAMENVATTING ... 4 1. INTRODUCTION ... 5 2. METHODS... 6 2.1 CIGARETTES... 62.2 SMOKING MACHINE AND NO ANALYZER... 6
2.3 NH4 DETERMINATION... 6
2.4 STATISTICS... 6
3. RESULTS ... 8
3.1 DECLARED TAR AND NICOTINE VALUES... 8
3.2 NO MEASUREMENTS... 8
3.3 NH4 MEASUREMENTS... 9
3.4 CORRELATIVE ANALYSIS OF 4 MAJOR DETERMINANTS OF CIGARETTES: NO, NH4, TAR AND NICOTINE... 9
3.4.1 Correlation between the parameters... 13
3.4.2 Comparison between the subsets with t-test... 14
4. DISCUSSION... 16
5. CONCLUSIONS ... 18
ACKNOWLEDGEMENT... 19
Abstract
The general hypothesis exists that NH4 level in cigarettes and NO level in cigarette smoke do
affect the nicotine availability in the lungs and subsequently play a role in the tobacco addiction. The objective of this report was to investigate whether correlations exist between the cigarette parameters: NH4 level, NO emission and the declared tar and nicotine values. These correlations
can be used to support the postulated hypotheses.
In this report the NH4 amount in cigarettes was determined by a wet-extraction method. The NO
emission was determined by means of a smoking machine and an NO-analyser. The declared tar and nicotine values were read from the packages.
The correlation was investigated by plotting the values of the cigarette parameters against each other and determining the respective correlation coefficient (r2). There was a positive correlation between the declared tar and the nicotine value (r2 = 0.95). Also, the NO emission and the tar value seems to be correlated with each other (r2 = 0.47). The NH4 amount did not correlated with
any parameters.
Furthermore, the 100 different cigarette brands were divided in several subsets. These subsets were:
- filter/non-filter cigarettes
- menthol/non-menthol filter cigarettes - light/regular filter cigarettes
Next, differences were examined within NH4 level, NO emission and ratio tar/nicotine between
the subsets of the cigarette brands. The NO emission was significantly lower by menthol and by light filter cigarettes compared with NO emission by non-menthol and by regular cigarettes. The ratio tar/nicotine of regular cigarettes was significantly lower compared with that of light
cigarettes.
This study showed that the NH4 level in cigarettes is related to the cigarette brand. NO emission
is weakly related to the declared tar value, probably due to the used tobacco raw material. The results of the present study do not support the hypotheses that added NH4 increases NO in smoke
and subsequently contributes to an increased uptake of nicotine by NO-induced dilatation of airways and blood vessels.
Samenvatting
De algemene hypothese bestaat dat NH4 gehalte in sigaretten en NO concentratie in
sigarettenrook de nicotine beschikbaarheid in de longen beïnvloedt en daardoor ook een factor speelt bij de tabaksverslaving. Een correlatie tussen het NH4 gehalte, de NO emissie en de
gedeclareerde nicotine waarde kan gebruikt worden om de hypothese te ondersteunen. Het doel van dit rapport is om na te gaan of er een onderlinge correlatie bestaat tussen het NH4 gehalte, de
stikstofoxide concentratie en de gedeclareerde teer en nicotine waarden.
In dit rapport werden ammonium gehaltes in sigaretten en stikstof oxide (NO) in sigarettenrook van 100 verschillende sigaretten soorten bepaald. Het NH4 gehalte van de sigaretten werd via een
extractiemethode bepaald. NO concentratie in sigarettenrook werd met behulp van rookmachine en een NO-analyser bepaald. De gedeclareerde teer en nicotine waarden werden afgelezen op de sigaretten verpakking.
Om de correlaties tussen de sigaretten parameters te onderzoeken, werden de NH4, NO, teer en
nicotine resultaten in grafieken in functie van elkaar uitgezet en de correlatie coëfficiënten berekend. Er werd een positieve correlatie gevonden tussen de teer en nicotine waarden (r2 = 0.95). Verder werd een zwakke correlatie tussen de gemeten NO concentratie en de
gedeclareerde teer waarde gevonden (r2 = 0.47). Het NH4 gehalte was niet gecorreleerd met een
van de parameters.
De 100 verschillende soorten sigaretten werden onderverdeeld in verschillende groepen en deze groepen werden met elkaar vergeleken aan de hand van de NH4 gehalte, NO concentratie en de
ratio tussen teer/nicotine.
De merken werden onderverdeeld in de volgende groepen: - filter/geen-filter sigaretten
- menthol/geen menthol filter sigaretten - light of regular filter sigaretten
De NO concentratie in sigarettenrook van menthol en light filter sigaretten waren significant lager dan van niet-menthol en van regular filter sigaretten. De ratio teer/nicotine was significant hoger in light sigaretten dan in regular sigaretten.
In deze studie hebben we een zwakke correlatie gevonden tussen de NO emissie en de gedeclareerde teer waarde, terwijl het NH4 gehalte niet was gecorreleerd met een van de
parameters. Het NH4 gehalte was wel kenmerkend voor het sigaretten merk. De correlaties
gevonden in deze studie zijn onvoldoende om gebruikt te worden voor onderbouwing van de hypothese dat toegevoegd NH4 of NO emissie de nicotine beschikbaarheid in de longen
1. INTRODUCTION
This study was performed on behalf of the Ministry of Health, Welfare and Sports (section Directie Gezondheidsbeleid, GZB) and the Inspectorate for Health Protection and Veterinary Public Health (Keuringsdienst van Waren Zuid). In June 2001 the EU Parliament and the
Council of Ministers have adopted an EU directive on tobacco regulation (Directive 2001/37/EC, 2001). This directive points that member states will oblige manufacturers and importers of tobacco products to give information about ingredients used in their products. This should include information on additives e.g. quantity, toxicity in burnt and unburned form as well as their effects on health and addiction. The member states will communicate all data and information to the European Commission. Scientific knowledge is needed to assess this information. The task of the RIVM is to evaluate the risk of tobacco additives/ ingredients. Cigarettes are not just made of tobacco, about 600 additives have been reported. These include e.g. coffee extract, fruit extracts, sugars, cocoa, menthol, oils, various humectants, caramel and cellulose (in the rolling paper). Many appear to be present simply to enhance flavour. But they may also have more pronounced effects. For example, cocoa when burned in a cigarette
produces theobromine, which may dilate the airways of the lung, which could increase the body's ability to absorb nicotine.
Menthol is also suspected of enabling the smoker to inhale more easily by numbing the throat. Researchers claim that some additives have been developed by tobacco companies to manipulate the delivery of nicotine with extreme precision. One of such “manufactured” additive might be ammonium. Addition of ammonia compounds may speed up the delivery of nicotine to smokers by raising the alkalinity of tobacco smoke (Pankow et al., 1997). Other compounds may also distort the measurement of tar in cigarettes, giving lower readings than would actually be inhaled by the smoker. Acetaldehyde and pyridine may act to strengthen nicotine's impact on the brain and central nervous system.
Since ammonium salts are suspected to play an important part in determining the characteristics of cigarettes, these were measured in various brands of cigarettes. Because, nitric oxide (NO) is also a (possibly important) marker in cigarette smoke which could influence nicotine uptake (Vleeming et al., 2002), so this was determined in smoke emission from various brands. Tar- and nicotine values must be specified on cigarette packages and a comparison was made between these declared values and the values of ammonium salts and NO measured in this study.
2. METHODS
2.1 Cigarettes
One hundred different brands of cigarettes were purchased at random from grocer’s store. Commercially available brands with filter and non-filter types were purchased. Unique SH-numbers were assigned to the purchased cigarette brands. These SH-SH-numbers are given in table 1. Of these brands 20 cigarettes per pack were put into a routine analytical smoking machine and were puffed according to the FTC ISO 3308 method used for tar- and nicotine determination (ISO 3308, 2000). The reference cigarette CM3 was purchased from Borgwaldt (Borgwaldt Technik GmbH, Hamburg, Germany).
2.2 Smoking machine and NO analyzer
The smoking machine used in this study was a 20-port rotary Borgwaldt smoking machine (Borgwaldt Technik GmbH, Hamburg, Germany). The smoking machine takes a puff of 35 ml during 2 seconds from one cigarette, the syringe returns to the point of departure in 1 second and the rotor simultaneously revolves one place. A Sievers Nitric Oxide Analyser, model 280
(Sievers Instruments, Boulder CO, USA)) was connected to the smoke-collecting duct (the
ventilation system) of the smoking machine (figure 1). Smoke assembled in this duct after passing the tar-filter and was subsequently cleared by the ventilation system. A guidance tube was connected through which the smoke was simultaneously purged to the NO analyzer. The NO analyzer measured in real-time the amount of NO in smoke purged through the duct and the tube connecting the analyzer. This method enabled that each cigarette puff was a direct sampling of the amount of NO flowing through the tar-collecting filter and the ventilation system. Before the experiments were started, the amount of NO passing through the tubes to the analyzer was measured. Since the amount went off the scale of the NO analyzer capacity, a nitrogen tank was placed between the smoke collecting duct and the analyzer. Nitrogen (150 ml/min) was mixed with the inflow of smoke (50 ml/min) in a mixture of 3:1 (N2:smoke). An extra filter (45 µm)
was also placed between the inflow and the analyzer. After this construction, NO was measured reliably on the NO analyzer. A schematic representation of this installation is given in figure 2.
2.3 NH4 Determination
For the determination of the ammonium salts content in the various brands of cigarettes, a wet weight extraction procedure was used to measure NH4 per individual cigarette. The tobacco from
one cigarette (the filter and the cigarette paper was removed) was mixed and extracted with 100 ml demi-water (Milli-Q) during 5 min at room temperature. The exact procedure of this wet weight extraction is described in RIVM SOP LAC M396 (2001).
2.4 Statistics
In order to compare the different results on NO, NH4, nicotine and tar, Microsoft Excel software
was used. Correlation coefficient was used to determine correlation between the above
mentioned parameters. Parametrical testing (t-test) was used to determine significant differences between the various types of cigarettes for the above mentioned parameters.
150 ml/min 50 ml/min 200 ml/min
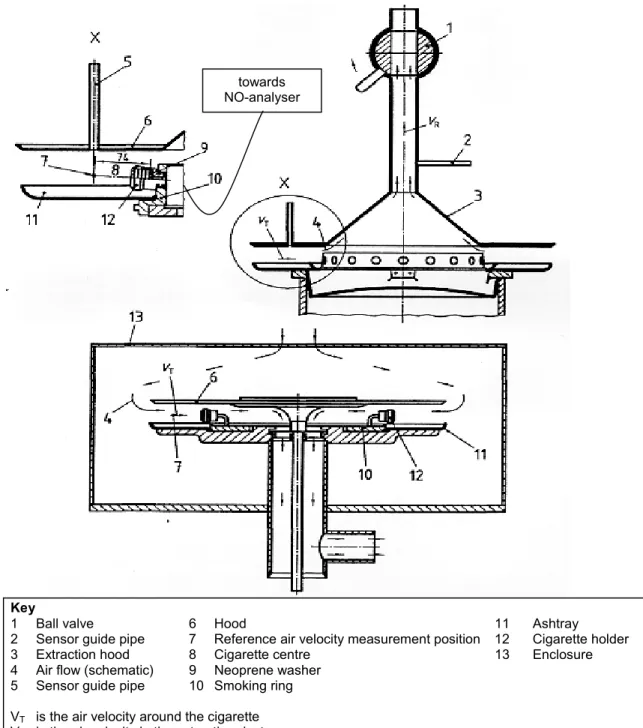
Figure 1. Schematic view of the smoking machine (adapted from ISO 3308, 2000)
Figure 2. Scheme of the installation of the NO analyzer. The smoke or NO from the smoking carrousel (1) or balloon with test gas (NO) is collected in the ventilation duct (2) after smoke passed the tar-filter. The smoke or NO (50 ml/min) is mixed with nitrogen (150 ml/min) coming from nitrogen tank (3) with a ratio of 1:3 respectively. The gas mixture (200 ml/min) is leaded to the NO analyzer (4) for NO measurement.
towards NO-analyser
Key
1 Ball valve 6 Hood 11 Ashtray
2 Sensor guide pipe 7 Reference air velocity measurement position 12 Cigarette holder
3 Extraction hood 8 Cigarette centre 13 Enclosure
4 Air flow (schematic) 9 Neoprene washer 5 Sensor guide pipe 10 Smoking ring VT is the air velocity around the cigarette
3. RESULTS
3.1 Declared tar and nicotine values
The tar and nicotine values given in table 1 are the declared values, which were read from the packages. Measurements in the past showed that the declared tar and nicotine values on the packages were confirmed by analyses. Therefore, the declared values for tar and nicotine are assumed to be valid. The declared tar and nicotine values for almost all of the 100 brands are given in table 1. These brands are divided in several subsets. These subsets are given in column “remarks” in table 1. Most of the marketed cigarettes do have a filter. Some brands lack a filter and are classified as “non- filter”. Cigarettes with menthol in their brand name are classified as “menthol” cigarettes. Cigarettes with tar level of lower than 9 mg are classified as “light” cigarettes. Cigarettes with tar level equal to or higher than 9 mg are classified as “regular” cigarettes.
3.2 NO measurements
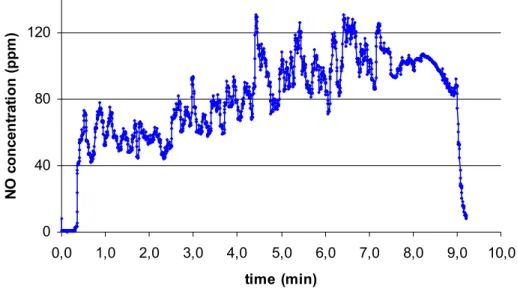
The NO emission from 20 cigarettes of each brand was measured real-time during smoking. Smoke was sampled continuously and every quarter of a second the mean value was calculated and registered by the computer. Since not every cigarette burned equally well, the pattern of NO release during smoking was sometimes irregular (see figure 3). There was also an increase of NO release towards the final puffs of the cigarettes, which is probably caused by the tubes
connecting the NO analyzer to the smoking machine or difference in tobacco blend within the cigarette (figure 3). To overcome these difficulties in measuring, an average was taken over 4 rounds (round 2-5; 1 round is one puff of all 20 cigarettes, ~ 1 minute) of smoking. The first round was not taken into account, because during the first round not all cigarettes are lit (there is no constant smoke collection yet of all 20 cigarettes puffing simultaneously).
Figure 3. Pattern of NO released during smoking of a random brand of 20 cigarettes. Clearly, the increase at the end of the smoking rounds can be seen and the irregular pattern of the individual cigarettes. 0 40 80 120 0,0 1,0 2,0 3,0 4,0 5,0 6,0 7,0 8,0 9,0 10,0 time (min) N O c onc en tr at ion ( ppm )
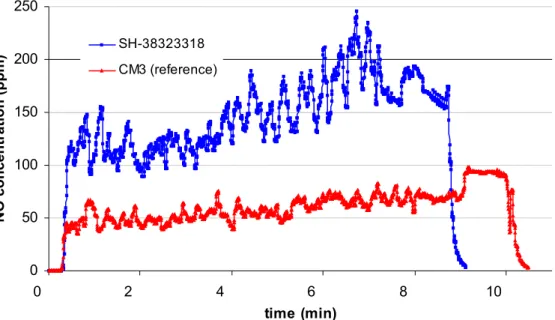
When individual brands were smoked and compared to the reference cigarettes CM3 it was apparent that every brand has its own NO value and smoking characteristics, an example is shown in figure 4.
Figure 4. Comparison of the smoking patterns of reference cigarettes CM with SH-38323318. It is apparent that the reference cigarettes have a more constant smoking pattern right till the end of the smoking rounds. The SH-38323318 (and most other brands) show a more inconsistent smoking pattern, with a large increase in NO release in the last couple of smoking rounds.
The mean NO value measured between 1 – 5 minutes of each of the 100 cigarette brands are given in table 1.
3.3 NH4 measurements
NH4 was measured by wet weight extraction per cigarette in duplicate. The results were
expressed in milligrams of NH4 per gram of tobacco present in an individual cigarette. The
results of the measurements are given in table 1.
3.4 Correlative analysis of 4 major determinants of cigarettes: NO,
NH4, Tar and nicotine
In order to give some insight in the different cigarettes brands in terms of the upcoming regulations on tobacco additives (Bates et al., 1999) results for NO, NH4, Tar and nicotine are
put into one table (table 1).
1. Firstly, these results were statistically compared with each other for a possible correlation in contents of one additive or pyrolysis product with another. For example, it could be
postulated that the amount of NO formed during smoking is a direct consequence of the amount nicotine or NH4 added to the individual tobacco. The correlation coefficient (r2) for
each comparison between the parameters was calculated with Microsoft Excel software. 2. Secondly, parametrical t-test (Microsoft Excel software) were used to establish whether
different types of cigarettes have different characteristics in terms of NO, NH4 and
tar/nicotine ratio. The parametrical test was valid because the NO, the NH4 and the ration 0 50 100 150 200 250 0 2 4 6 8 10 time (min) N O co n cen tr ati o n (p p m ) SH-38323318 CM3 (reference)
tar/nicotine seems to be distributed normally. Because all the non-filter cigarettes are classified as regular, comparison of the non-filter regular cigarettes with light plus regular filter cigarettes would be biased. Therefore the regular non-filter cigarettes are compared with only regular filter cigarettes. Furthermore, light (low-tar) filter cigarettes were compared with regular (normal/high tar) filter cigarettes and menthol filter cigarettes with non-menthol filter cigarettes. The comparison between these subsets was evaluated by t-test. This test was performed with Microsoft Excel software.
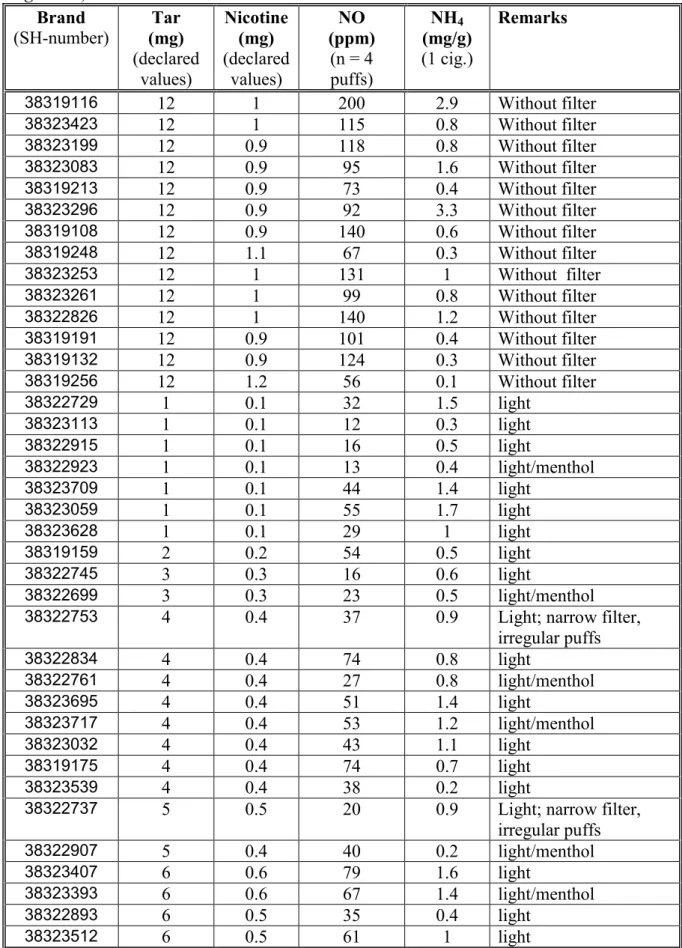
Table 1: The declared tar and nicotine values, the measured mean NO values of 4 puffs and NH4-values of 100 different cigarettes brands on the market and reference cigarettes (control
cigarettes). Brand (SH-number) (mg)Tar (declared values) Nicotine (mg) (declared values) NO (ppm) (n = 4 puffs) NH4 (mg/g) (1 cig.) Remarks 38319116 12 1 200 2.9 Without filter 38323423 12 1 115 0.8 Without filter 38323199 12 0.9 118 0.8 Without filter 38323083 12 0.9 95 1.6 Without filter 38319213 12 0.9 73 0.4 Without filter 38323296 12 0.9 92 3.3 Without filter 38319108 12 0.9 140 0.6 Without filter 38319248 12 1.1 67 0.3 Without filter 38323253 12 1 131 1 Without filter 38323261 12 1 99 0.8 Without filter 38322826 12 1 140 1.2 Without filter 38319191 12 0.9 101 0.4 Without filter 38319132 12 0.9 124 0.3 Without filter 38319256 12 1.2 56 0.1 Without filter 38322729 1 0.1 32 1.5 light 38323113 1 0.1 12 0.3 light 38322915 1 0.1 16 0.5 light 38322923 1 0.1 13 0.4 light/menthol 38323709 1 0.1 44 1.4 light 38323059 1 0.1 55 1.7 light 38323628 1 0.1 29 1 light 38319159 2 0.2 54 0.5 light 38322745 3 0.3 16 0.6 light 38322699 3 0.3 23 0.5 light/menthol
38322753 4 0.4 37 0.9 Light; narrow filter,
irregular puffs 38322834 4 0.4 74 0.8 light 38322761 4 0.4 27 0.8 light/menthol 38323695 4 0.4 51 1.4 light 38323717 4 0.4 53 1.2 light/menthol 38323032 4 0.4 43 1.1 light 38319175 4 0.4 74 0.7 light 38323539 4 0.4 38 0.2 light
38322737 5 0.5 20 0.9 Light; narrow filter,
irregular puffs 38322907 5 0.4 40 0.2 light/menthol 38323407 6 0.6 79 1.6 light 38323393 6 0.6 67 1.4 light/menthol 38322893 6 0.5 35 0.4 light 38323512 6 0.5 61 1 light
Brand (SH-number) (mg)Tar (declared values) Nicotine (mg) (declared values) NO (ppm) (n = 4 puffs) NH4 (mg/g) (1 cig.) Remarks 38322796 7 0.6 45 0.5 light 38322672 7 0.6 46 0.6 light/menthol 38323148 7 0.6 71 0.5 light 38323172 7 0.6 84 1 light 38323156 7 0.6 89 1 light/menthol 38323091 7 0.6 107 0.8 light 38323458 8 0.8 81 0.9 light 38323202 8 0.7 105 0.7 light 38323075 8 0.6 105 1.3 light 38323288 8 0.7 143 0.8 light 38322818 8 0.6 112 1.1 light 38323008 8 0.6 86 1 light 38323024 8 0.6 82 0.8 light/menthol 38323725 8 0.6 136 1.7 light 38323563 8 0.6 64 1.1 light
38323504 8 0.8 92 0.6 Light, extra thin
cigarettes
38323482 8 0.8 82 1 light/menthol, extra thin
cigarettes 38323334 9 0.8 49 0.3 regular 38322958 9 0.8 98 0.7 regular 38323679 9 0.8 56 1.4 regular 38323571 9 0.8 91 0.4 regular 38323466 9 0.8 106 0.8 regular 38323245 10 0.8 127 0.6 regular 38323318 10 0.7 155 3.2 regular 38322885 10 0.9 101 0.4 regular 38322877 10 0.9 84 0.3 regular 38322869 10 0.9 77 0.5 regular/menthol 38322982 10 0.7 111 1.4 regular 38323121 11 0.9 96 0.5 regular 38323342 11 0.9 62 0.3 regular/menthol 38322966 11 1 166 1.1 regular 38323598 11 0.9 86 1.3 regular 38323415 12 1 80 0.7 regular 38322788 12 1 89 0.5 regular 38322702 12 1 75 0.4 regular/menthol 38323431 12 0.9 100 regular 38323229 12 0.9 122 0.8 regular 38323237 12 0.9 120 0.7 regular 38323067 12 0.9 115 0.8 regular 38323164 12 0.9 128 0.9 regular 38323369 12 1.1 58 0.4 regular
Brand (SH-number) (mg)Tar (declared values) Nicotine (mg) (declared values) NO (ppm) (n = 4 puffs) NH4 (mg/g) (1 cig.) Remarks 38323385 12 0.9 94 0.7 regular 38323377 12 0.9 99 1.4 regular 38323326 12 0.9 214 1 regular 38319124 12 1 190 0.6 regular 38322931 12 0.9 122 1.3 regular 38319205 12 1 210 0.7 regular 38322842 12 0.9 126 1.6 regular 38322974 12 0.9 118 1 regular 38323016 12 0.9 117 1.9 regular/menthol 38323652 12 0.9 111 0.6 regular 38323601 12 0.9 90 0.4 regular/menthol 38323687 12 0.9 140 1.7 regular 38323644 12 1.1 63 0.2 regular 38323636 12 0.9 136 1.3 regular 38319264 12 0.8 110 0.4 regular 38323733 12 1 95 1 regular 38323741 12 1 59 0.4 regular/menthol 38323555 12 1 62 0.4 regular/menthol 38323547 12 1 62 0.5 regular 38323105 12 0.9 152 0.8 regular 38323474 12 0.9 131 1.6 regular CM3-1 55 0.4 reference cigarette CM3-2 57 reference cigarette CM3-3 56 reference cigarette CM3-4 59 reference cigarette CM3-5 55 reference cigarette CM3-6 54 reference cigarette CM3-7 56 reference cigarette CM3-8 55 reference cigarette CM3-9 71 reference cigarette
3.4.1 Correlation between the parameters
All the non-filter cigarettes (table 1) are of the regular type (high tar level). Beside high tar level, the NO-level and the nicotine level are also high in non-filter cigarettes. Probably the level of these substances is characteristic for non-filter cigarettes.
From table 1 we can conclude that the higher the tar level, the higher the nicotine level becomes. Also the NO-level seems to increase together with the tar level.
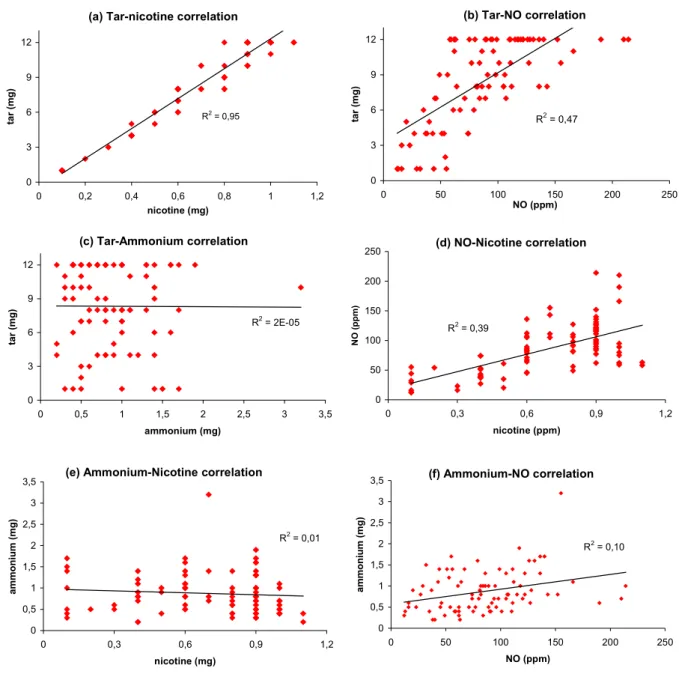
The tar, nicotine, NO and NH4 values were plotted against each other in order to visualize the
correlation between those parameters.
There is a linear correlation between tar and nicotine in cigarettes (figure 5a) (r2 = 0.95). The high correlation between these two parameters indicates that high level tar is necessary to increase the nicotine level in the smoke. From the correlation graph in figure 5b, is concluded that NO-level seems to be correlated with the tar-level (r2 = 0.47). There is also a weak correlation between nicotine and NO (r2 = 0.39) (figure 5d). NO does not correlate with NH4.
Figure 5. Correlations between the several cigarette parameters with each other.
3.4.2 Comparison between the subsets with t-test
As mentioned earlier, the brands were divided in subsets: filter and non-filter, with and without menthol, light and regular cigarettes. Because the tar and the nicotine levels were highly correlated, it was decided to calculate tar/nicotine ratio for each brand and to use this ratio for comparison between the subsets.
Next, differences were examined within NO, NH4 and ratio tar/nicotine values between the
subsets of cigarettes (non-filter/filter, menthol/normal or light/regular). Notice in table 1 that only regular non-filter cigarettes were available. It is reasonable to compare the regular non-filter cigarettes with only regular filter cigarettes and thus omitting the light filter cigarettes from the filter subset. Including the light cigarettes in the filter subset would otherwise create a bias. At the other hand, including the non-filter subset in the other subsets (menthol/non-menthol and light/regular) would also create a bias in the comparison t-test. Therefore, the non-filter results were also omitted from these subsets. The P-values for each comparison were calculated with
(f) Ammonium-NO correlation R2 = 0,10 0 0,5 1 1,5 2 2,5 3 3,5 0 50 100 150 200 250 NO (ppm) ammonium (mg)
(a) Tar-nicotine correlation
R2 = 0,95 0 3 6 9 12 0 0,2 0,4 0,6 0,8 1 1,2 nicotine (mg) tar (mg)
(e) Ammonium-Nicotine correlation
R2 = 0,01 0 0,5 1 1,5 2 2,5 3 3,5 0 0,3 0,6 0,9 1,2 nicotine (mg) ammonium (mg) (c) Tar-Ammonium correlation R2 = 2E-05 0 3 6 9 12 0 0,5 1 1,5 2 2,5 3 3,5 ammonium (mg) tar (mg) (b) Tar-NO correlation R2 = 0,47 0 3 6 9 12 0 50 100 150 200 250 NO (ppm) tar (mg) (d) NO-Nicotine correlation R2 = 0,39 0 50 100 150 200 250 0 0,3 0,6 0,9 1,2 nicotine (ppm) NO ( p p m )
Microsoft Excel software. Comparisons with P-values smaller than 0.05 are considered to be significant. These results are summarized in table 2.
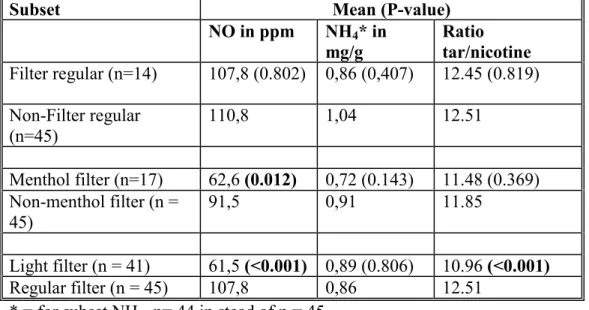
Table 2. The differences between subsets in cigarettes (filter/non-filter, menthol/non-menthol or light/regular) on the four constituents in tobacco.
A two-sided equal variance parametrical t-test with α = 0.05 was used in order to compare these subsets.
Subset Mean (P-value)
NO in ppm NH4* in mg/g Ratio tar/nicotine Filter regular (n=14) 107,8 (0.802) 0,86 (0,407) 12.45 (0.819) Non-Filter regular (n=45) 110,8 1,04 12.51 Menthol filter (n=17) 62,6 (0.012) 0,72 (0.143) 11.48 (0.369) Non-menthol filter (n = 45) 91,5 0,91 11.85 Light filter (n = 41) 61,5 (<0.001) 0,89 (0.806) 10.96 (<0.001) Regular filter (n = 45) 107,8 0,86 12.51
* = for subset NH4, n= 44 in stead of n = 45
As shown in table 2, there is a no distinctive difference between regular filter and regular non-filter cigarettes in terms of NO emission, NH4 content or ratio between tar and nicotine.
NO emission is significantly lower in menthol and light filter cigarettes than in non-menthol and regular filter cigarettes (respectively P = 0.012 and P< 0.001). The average NH4 level does not
seem to differ between the subsets. The ratio between tar and nicotine is significantly higher in light filter cigarettes than in regular filter cigarettes (P < 0.001). These results and their possible causes are discussed in the next section.
4. Discussion
The measurements of NO and NH4 in this report give some further insight in the composition of
the different brands of cigarettes and the possible smoking characteristics of these different brands. As mentioned before, high NO emission could cause increased vasodilatation of the pulmonary blood vessels, thereby increasing uptake of nicotine and making the cigarette more addictive (“attractive”) to the smoker. High NH4 content is thought to influence the pH of the
lung epithelium and can thus facilitate passage of nicotine through the lungs. The results in this report show some differences in the characteristics of the different commercially available cigarette brands. However, it would be premature to base any conclusions on these results in terms of “more addictive” or “less addictive” cigarettes. They merely serve as an indication when combined with more concrete evidence on the effects of NO and NH4 (in experimental
animals for example). Up to date, there is still only circumstantial evidence for the involvement of NO and NH4 in the addictive potential of cigarette smoking.
The correlation studies showed that the declared nicotine and tar values were highly correlated. Tar in cigarette smoke acts as a carrier for nicotine and is therefore correlated with nicotine level in smoke. Future regulatory guideline requires that the tar level should be reduced. Reducing the tar value in smoke seems to implicate that the nicotine level will also be reduced. Others have also described a direct correlation between carbon monoxide (CO) and tar/nicotine (McIntyre, 1994).
There is an indication that NO level in smoke and declared tar level are positively correlated. The higher the tar level is in cigarette smoke, the higher is the NO level in the smoke. The nitrogen oxides (NOx) level in smoke depends primarily on the nitrate concentrations in tobacco.
The nitrogen fertilizers contribute primarily to the nitrates, which are concentrated in the stems. Consequently, stems, as components of expanded and reconstituted tobaccos, contribute in a major way to NOx in the smoke. Reconstituted and expanded tobaccos are used to reduce the
tobacco weight in cigarettes and also to reduce the tar level in the smoke (Norman, 1999; Hoffman and Hoffmann, 2001). Thus increasing reconstituted and expanded tobacco level in cigarettes would increase the NO emission, but decrease the tar level in smoke, which is in conflict what we have found in this study. The tar level in smoke is also affected by other parameters, such as: filters, high porosity papers, filter ventilation (Norman, 1999). Norman (1999) described that these parameters are controlled in cigarette designing, to set the tar level in the smoke. Probably, these additional parameters are manipulated in order to increase the tar level in the smoke, resulting in a correlation between the two parameters. Borland and
Higenbottam (1987) reported lower correlation values for NO emission and tar level of French, UK and US cigarette brands (r2 was 0.43, 0.34 and 0.31 respectively).
We found a slight positive correlation between NO and nicotine level. This correlation is
probably attributed by the high correlation between tar and nicotine level. We hypothesized that NO in smoke is used to facilitate the absorption of nicotine through the lungs. This hypothesis indicates that lower nicotine level requires high NO level. However, we did not observe this relation.
Furthermore, the NH4 level did not correlate with the other parameters. This seems to indicate
that NH4 is characteristic for each brand. It was hypothesized earlier that NO may correlate with
NH4 level, but this was not observed. May be it will be better to determine the total nitrogen
level (Wutzke and Heine, 1985) of the cigarette and to correlate the total nitrogen level with NO level.
We did not found any significant differences between regular filter/non-filter cigarettes when NO, NH4 and the tar/nicotine ratio was considered. This result is obvious for NO, because NO is
a gas and its emission will not be reduced by the filter. The average NH4 level in cigarettes
seems to be related to the cigarette brand, irrespective of filter or non-filter cigarettes. For the tar/nicotine ratio is this result not so obvious, because the filter mainly retains tar (which contains nicotine). From table 1, it is observed that the tar levels in the non-filter cigarettes are 12 mg and the tar level ranges between 9 and 12 mg in the regular filter cigarettes. When the mean tar and nicotine levels were compared between the filter/non-filter subsets, then the mean tar and the nicotine levels were significantly (P = 0.021 and P = 0.019, respectively) higher in the non-filter regular cigarettes. However, this significant difference for tar and nicotine disappeared when the tar/nicotine ratio was considered. This indicates that the cigarette manufacturer
designed the cigarettes in such a way, that the non-filter and filter regular cigarettes are comparable for the investigated parameters.
Some significant differences between the other subsets were found for some parameters. The mean NO emission from commercial cigarettes (89.3 ± 42.7 ppm (mean ± standard deviation, n = 100)) was significantly higher (P < 0.001, t-test) than from reference cigarettes (57.6 ± 5.2 (mean ± standard deviation, n = 9)). The NO emission was significant lower in menthol and in light regular cigarettes than in non-menthol and in regular filter cigarettes, respectively (P = 0.012 and P<0.001, respectively). The tar level (see the correlation discussion section) explains the difference between the light and the regular filter cigarette for the NO level. We could not explain why the menthol filter cigarettes do have lower NO level than the non-menthol cigarettes. May be, the production process is different between these two cigarette types (e.g. less reconstituted and expanded tobacco in menthol cigarettes) or some additives are replaced by menthol resulting in reduction of the NO emission.
The tar/nicotine ratio (range 10 – 15) were comparable with the ratio found in American blends (mean tar/nicotine ratio is 13.18) (Kozlowski et al., 2001). We did not found significant
differences in the ratio between the filter/non-filter and menthol/non-menthol subsets. The ratio was significantly lower in the light filter cigarettes than in the regular filter cigarettes. This indicates that relatively more tar is needed to carry nicotine in the regular cigarettes than in the light cigarettes. These differences could be attributed to different tobacco constitution of light cigarettes compared with regular cigarettes.
The NH4 level was not significantly different between the regular filter and regular non-filter
cigarettes. Additionally the NH4 was not significantly different between the other subsets. As
5. Conclusions
The declared tar and nicotine levels are highly correlated in cigarettes. Tar is acts as a carrier for nicotine in cigarette smoke. There seems to be a correlation between NO level and the declared tar level, but a clear explanation was not found. Probably, this correlation was attributed by cigarette design characteristics or tobacco blends within the cigarette. NH4 level was not
correlated with any of the investigated parameters. The NH4 level seems to be characteristic for
the cigarette brand.
There were no differences found between filter/non-filter cigarettes when NO, NH4 and the
tar/nicotine ratio was considered.
The differences found between the other subsets could be explained by the tobacco raw material (reconstituted and expanded tobacco) and cigarettes design properties (ventilation, paper quality and filter).
The results of the present study do not support the hypotheses that added NH4 increases NO in
smoke and subsequently contributes to an increased uptake of nicotine by NO-induced dilatation of airways and blood vessels.
Acknowledgement
The authors wish to thank F. Mabesoone and W. Klerx of the Inspectorate for Health Protection and Veterinary Public Health (Keuringsdienst van Waren Zuid) for their experimental support and the fruitful suggestions to improve this report.
References
Bates C, McNeill A, Jarvis M. and Gray N., 1999. The future of tobacco product regulation and labelling in Europe: implications for the forthcoming European Union directive. Tob Control, 8(2), 225-35.
Directive 2001/37/EC: on the approximation of the laws, regulations and administrative provisions of the Member States concerning the manufacture, presentation and sale of tobacco products, adopted by the European Parliament and the Council on 5 June 2001.
Hoffmann, D., Hoffmann, I., 2001. The changing cigarette:chemical studies and bioassays. In Smoking and Tobacco Control Monograph No. 13: Risks associated with smoking with low
machine-measured yields of tar and nicotine by National Cancer Institute, Bethesda, MD, USA.
pp. 159-192.
International Organization for Standardization (ISO), 2000. ISO 3308:2000(E), Routine analytical cigarette-smoking machine – Definitions and standard conditions. Fourth edition, 2000-04-15.
Kozlowski, L.T., O’Connor, R.J., Sweeney, C.T., 2001Cigarette design. In Smoking and
Tobacco Control Monograph No. 13: Risks associated with smoking with low machine-measured
yields of tar and nicotine by National Cancer Institute, Bethesda, MD, USA. pp. 13-38.
Norman, A., 1999. Cigarette design and materials. In Tobacco: production, chemistry and technology. Ed. Davies, D.L. and Nielsen, M.T. Coresta, Blackwell Sciences Ltd, Oxford, UK. pp 353-387.
Pankow, J.F., Mader, B.T., Lorne, M. I., Luo, W., Pavlick, A., Liang, C., 1997. Conversion of nicotine in tobacco smoke to its volatile and available free-base form through the action of gaseous ammonia. Environ. Sci. Technol., 31, 2428-2433.
RIVM SOP LAC M396, 2001: "Fotometrische bepaling van ammonium in geconserveerde waterige oplossingen".
Vleeming, W., Rambali, B., Opperhuizen, A., 2002. The role of nitric oxide in cigarette smoking and nicotine addiction, Nicotine & Tobacco Research, in press.
Wutzke K.D. and Heine W. A century of Kjeldahl's nitrogen determination. Z Med Lab Diagn 1985;26(7): 383-8.