This study has been performed within the framework of the Netherlands Research Programme on Climate Change (NRP-CC), subprogramme Scientific Assessment and Policy Analysis, project
‘Options for (post-2012) Climate Policies and International Agreement’
Report 500102 014 Authors Veronika Dornburg André Faaij Pita Verweij Martin Banse Kees van Diepen Herman van Keulen
Hans Langeveld Marieke Meeusen Gerrie van de Ven
Flip Wester Rob Alkemade
Ben ten Brink Gert Jan van den Born
Mark van Oorschot Jan Ros Fleur Smout Detlef van Vuuren Ruud van den Wijngaart
Harry Aiking Marc Londo Hamid Mozaffarian Koen Smekens Editors Erik Lysen Sander van Egmond
January 2008
This study has been performed within the framework of the Netherlands Research Programme on Scientific Assessment and Policy Analysis for Climate Change (WAB)
SCIENTIFIC ASSESSMENT AND POLICY ANALYSIS
Biomass Assessment
Assessment of global biomass potentials and
their links to food, water, biodiversity, energy
demand and economy:
Inventory and analysis of existing studies
Supporting document
Wetenschappelijke Assessment en Beleidsanalyse (WAB)
Het programma Wetenschappelijke Assessment en Beleidsanalyse klimaatverandering in opdracht van het ministerie van VROM heeft tot doel:
• Het bijeenbrengen en evalueren van relevante wetenschappelijke informatie ten behoeve van beleidsontwikkeling en besluitvorming op het terrein van klimaatverandering;
• Het analyseren van voornemens en besluiten in het kader van de internationale klimaatonderhandelingen op hun consequenties.
Het betreft analyse- en assessment werk dat beoogt een gebalanceerde beoordeling te geven van de stand van de kennis ten behoeve van de onderbouwing van beleidsmatige keuzes. Deze analyse- en assessment activiteiten hebben een looptijd van enkele maanden tot ca. een jaar, afhankelijk van de complexiteit en de urgentie van de beleidsvraag. Per onderwerp wordt een assessment team samengesteld bestaande uit de beste Nederlandse experts. Het gaat om incidenteel en additioneel gefinancierde werkzaamheden, te onderscheiden van de reguliere, structureel gefinancierde activiteiten van het consortium op het gebied van klimaatonderzoek. Er dient steeds te worden uitgegaan van de actuele stand der wetenschap. Klanten zijn met name de NMP-departementen, met VROM in een coördinerende rol, maar tevens maatschappelijke groeperingen die een belangrijke rol spelen bij de besluitvorming over en uitvoering van het klimaatbeleid.
De verantwoordelijkheid voor de uitvoering berust bij een consortium bestaande uit MNP, RIVM, KNMI, CCB Wageningen-UR, ECN, Vrije Universiteit/CCVUA, UM/ICIS en UU/Copernicus Instituut. Het MNP is hoofdaannemer en draagt daarom de eindverantwoordelijkheid.
Scientific Assessment and Policy Analysis
The programme Scientific Assessment and Policy Analysis is commissioned by the ministry of the environment (VROM) and has the following objectives:
• Collection and evaluation of relevant scientific information for policy development and decision–making in the field of climate change;
• Analysis of resolutions and decisions in the framework of international climate negotiations and their implications.
We are concerned here with analyses and assessments intended for a balanced evaluation of the state of the art for underpinning policy choices. These analyses and assessment activities are carried out in periods of several months to about a year, depending on the complexity and the urgency of the policy issue. Assessment teams organised to handle the various topics consist of the best Dutch experts in their fields. Teams work on incidental and additionally financed activities, as opposed to the regular, structurally financed activities of the climate research consortium. The work should reflect the current state of science on the relevant topic. The main commissioning bodies are the National Environmental Policy Plan departments, with the Ministry of Housing, Spatial Planning and the Environment assuming a coordinating role. Work is also commissioned by organisations in society playing an important role in the decision-making process concerned with and the implementation of the climate policy. A consortium consisting of the Netherlands Environmental Assessment Agency (MNP), RIVM, the Royal Dutch Meteorological Institute, the Climate Change and Biosphere Research Centre (CCB) of the Wageningen University and Research Centre (WUR), the Netherlands Energy Research Foundation (ECN), the Netherlands Research Programme on Climate Change Centre of the Vrije Universiteit in Amsterdam (CCVUA), the International Centre for Integrative Studies of the University of Maastricht (UM/ICIS) and the Copernicus Institute of the Utrecht University (UU) is responsible for the implementation. The Netherlands Environmental Assessment Agency – MNP as main contracting body assumes the final responsibility.
For further information:
Netherlands Environmental Assessment Agency MNP, WAB Secretariat (ipc 90), P.O. Box 303, 3720 AH Bilthoven, the Netherlands, tel. +31 30 274 3728 or email: wab-info@mnp.nl.
This report has been produced by:
Erik Lysen, Sander van Egmond,
Utrecht University (UU), Utrecht Centre for Energy research (UCE). Veronika Dornburg, André Faaij, Pita Verweij
Utrecht University (UU)
Martin Banse, Kees van Diepen, Herman van Keulen, Hans Langeveld, Marieke Meeusen, Gerrie van de Ven, Flip Wester
Wageningen University & Research Centre (WUR).
Rob Alkemade, Ben ten Brink, Gert Jan van den Born, Mark van Oorschot, Jan Ros, Fleur Smout, Detlef van Vuuren, Ruud van den Wijngaart
Netherlands Environmental Assessment Agency (MNP). Harry Aiking
Institute for Environmental Studies IVM, VU University of Amsterdam (VU). Marc Londo, Hamid Mozaffarian, Koen Smekens
Energy research Centre of the Netherlands (ECN).
Name, address of corresponding author:
Erik H. Lysen
Utrecht University, Utrecht Centre for Energy research (UCE) Heidelberglaan 2, 3584 CS Utrecht, The Netherlands
Tel: +31-30-2537614 Fax: +31-30-2537601 Internet: www.uce-uu.nl
E-mail: e.lysen@uu.nl
Disclaimer
Statements of views, facts and opinions as described in this report are the responsibility of the author(s).
Copyright © 2008, MNP, Bilthoven
All rights reserved. No part of this publication may be reproduced, stored in a retrieval system or transmitted in any form or by any means, electronic, mechanical, photocopying, recording or otherwise without the prior written permission of the copyright holder.
Contents
1 Introduction 11
2 Biomass potentials 13
2.1 Summary of biomass potential studies review 13
2.1.1 Introduction 13
2.1.2 The ideal study 13
2.1.3 Review of recent studies estimating biomass potentials 14
2.1.4 Resulting data for key parameters 15
2.1.5 Conclusions 15
2.2 Introduction 16
2.3 The ideal study 17
2.4 Review of recent studies estimating biomass potentials 19
2.4.1 Overview studies 19
2.4.2 Approaches used in the studies 20
2.5 Resulting data for key parameters 23
2.5.1 Resulting potentials 23
2.5.2 Evaluation of knowledge gaps in studies 25
2.6 Conclusions 26
2.7 References Biomass Potential Studies 28
3 Food demand 31
3.1 Summary Food demand 31
3.1.1 Introduction 31
3.1.2 The ideal study 31
3.1.3 Review of recent studies estimating food demand 31
3.1.4 Resulting data for key parameters 32
3.1.5 Conclusions 33
3.2 Introduction 33 3.2.1 Food consumption, food production and sustainability 33
3.2.2 Dietary aspects 34
3.2.3 Socio-economic aspects 35
3.3 Parameters crucial to food demand 36
3.3.1 Complexity 36
3.3.2 World population 36
3.3.3 Diet characterisation 36
3.3.4 Production systems 37
3.3.5 Economic aspects 41
3.3.6 Geographic resolution and variation 42
3.4 Analysis of food demand estimates 42
3.4.1 Introduction 42
3.4.2 FAO 42
3.4.3 OECD 45
3.4.4 IFPRI 47
3.4.5 Other issues concerning food demand projections 48 3.5 Evaluation of biomass potential studies from a food demand perspective 49
3.5.1 Introduction 49
3.5.2 The study by Hoogwijk et al. (2005) 49
3.5.3 The report by Perlack et al. (2005) 49
3.5.4 The study by Smeets et al. (2007) 50
3.5.5 The paper by Wolf et al. (2003) 50
3.5.6 A future shift in the present diet trend? 50
3.6 Conclusions 51
4 Water 57
4.1 Summary Water 57
4.1.1 Introduction 57
4.1.2 The ideal study 58
4.1.3 Results 58
4.1.4 Discussion and conclusions 61
4.2 Introduction 61
4.3 Global water resources 62
4.4 Global blue water use 65
4.5 Irrigation efficiency and water productivity 66
4.6 Regional water balances 67
4.7 Trends in water use 69
4.7.1 Trends in water use in the domestic and industrial sectors 69
4.7.2 Trends in agricultural water use 70
4.8 Field and Farm scale 71
4.8.1 Irrigation systems 71
4.8.2 Water Use Efficiency of crops 71
4.9 Alleviating water stress 74
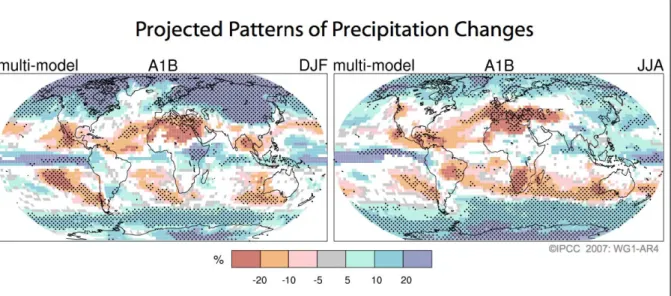
4.10 Climate change 74
4.11 Conclusions 76
4.12 References Water 77
5 Biodiversity 79
5.1 Introduction 79
5.2 Biodiversity definition, policies and indicators 80
5.2.1 Relevancy to policy makers 80
5.2.2 Biodiversity definitions and indicators 82
5.2.3 Biodiversity loss and the homogenisation process 84 5.2.4 Suitability of species richness as an indicator for impact assessment 85 5.2.5 Comparing different composite and aggregate indicators 86
5.2.6 Valuable biodiversity and protected areas 89
5.2.7 Indicators for Agro-biodiversity 91
5.3 Biodiversity effects of growing energy crops 93
5.3.1 Introduction 93
5.3.2 Biodiversity effects of land-use changes for growing bio-energy crops 93 5.3.3 Conclusions from studies on local biodiversity impacts 99
5.3.4 Effects of climate change on biodiversity 100
5.4 Survey of impact assessment studies 102
5.4.1 Examples of life cycle analysis 102
5.4.2 Overview of scenario studies 103
5.4.3 References 109
6 Demand-side models 113
6.1 Summary Demand-side models 113
6.1.1 Introduction 113
6.1.2 The ideal study 113
6.1.3 Review of studies 113
6.1.4 Resulting data for key parameters 114
6.1.5 Conclusions 115
6.2 Introduction 116
6.3 Overview of the assessed models 117
6.4 Basic parameters: population, GDP, and global energy demand 118
6.5 Biomass demand 119
6.5.1 Primary biomass demand 119
6.5.2 Biomass share in total demand 120
6.5.3 Assumptions on biomass availability and cost 121
6.6 Biomass applications 121
6.7 Conclusions 123
7 Agricultural economics 125
7.1 Summary of Agricultural economics 125
7.1.1 Introduction 125
7.1.2 The Ideal Study 125
7.1.3 Review of studies 125
7.1.4 Resulting data for key parameters 126
7.1.5 Conclusions 126
7.2 Introduction 127
7.3 The ideal study 127
7.4 Review of studies 128
7.4.1 The POLYSYS-studies 128
7.4.2 OECD-studies 130
7.4.3 FAPRI 131
7.4.4 International Ethanol Model 133
7.4.5 SCENAR2020 134
7.4.6 EU-RURALIS 137
7.5 Resulting data for key parameters 144
7.6 Conclusions 144
7.7 References agricultural economics 145
Appendices
1 Fact sheets of biomass potential studies 147
2 Other recent biomass potential studies 161
3 Studies of water resources 163
4 Modelling mechanisms, spatial and temporal scales of the different studies 169
5 Assumptions on population, GDP, energy demand 171
6 Biomass shares and allocation 173
7 Assumptions on policies 175
8 Assumptions on technologies and costs: power generation 177 9 Assumptions on technologies and costs: transportation 179 10 Assumptions on technologies and costs: other sectors 181
11 SCENAR 2020 183
12 LEITAP Scenario Results 185
List of Tables
2.S1 Overview and evaluation of selected biomass potential studies 14
2.1 Overview of selected biomass potential studies 19
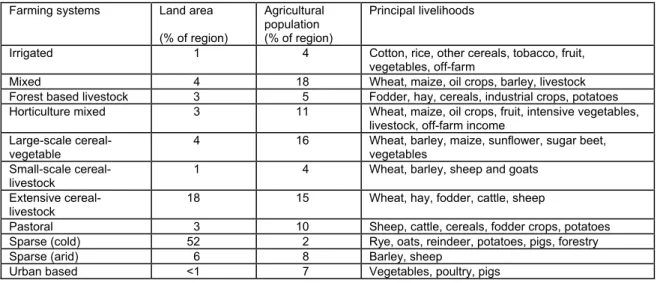
3.1 Major farming systems of sub-Saharan Africa (Dixon et al., 2001). 38 3.2 Major farming systems of Middle East and North Africa (Dixon et al., 2001). 38 3.3 Major farming systems of Eastern Europe and Central Asia (Dixon et al., 2001). 39 3.4 Major farming systems of South Asia (Dixon et al., 2001). 39 3.5 Major farming systems of East Asia and Pacific (Dixon et al., 2001). 40 3.6 Major farming systems of Latin America and the Caribbean (Dixon et al., 2001). 40 3.7 Comparison of farming systems by category (Dixon et al., 2001). 41 3.9 Consumption and production growth rates 2003-2013 (OECD, 2004a). 47 4.1 Renewable water resources, potential availability and water use per capita and per
area for the continents in the world and distributed over 26 natural economic
regions. 63
4.2 Categorization of environmental water scarcity 69
4.3 Classical irrigation efficiency of irrigation systems 71 4.4 WUE for some energy crops according to different sources 73 5.1 Main knowledge issues in the impact assessment of biofuels on biodiversity 80
5.2 CBD Headline indicators 83
5.4 The short-term biodiversity impact of land converted from actual land uses to annual and perennial bio-energy crops in both temperate and tropical regions. Values refer to mean species abundance (MSA) and “from 1.0 to 0.1” means a drop from the highest level of biodiversity (1.0) to the lowest level (0.1) and the loss
is 0.9. 98
5.5 Comparing scenario studies that include biodiversity effects. The bottom list
includes projections on using bioenergy crops. 108
6.S1 Comparison of surveyed studies 114
6.1 Comparison of surveyed studies 118
7.1 Effects on cropland use for scenarios assuming “1% of middle distillate fuels
replaced by biodiesel (2007)”, in million acres 129
7.2 Effects on crop prices for scenarios assuming “1% of middle distillate fuels
replaced by bodiesel (2007)”, in USD per unit 129
7.3 Impact of changes in gasoline price, US corn price and world sugar price on the ethanol and commodity markets, in USD per unit and in percentage (%) 134 7.4 Impact of changes in gasoline price, US corn price and world sugar price on the
production of ethanol in the US and Brazil, in million gallons 134 7.4 Area and production of biofuel (crops) under Biofuel directive, in million ton 136
7.5 EU decisions and world market prices. 140
7.6 Plausible combined options for agricultural policy scenarios 141
A1.1 Biomass potential studies included in the review 147
A1.2 Scope and results of the biomass potential studies 148 A1.3 Yields of energy crops and forestry in the biomass potential studies 149 A1.4 Food demand and supply in the biomass potential studies 151
A1.5 Biodiversity in the biomass potential studies 153
A1.6 Water in the biomass potential studies 154
A1.7 Main assumptions on population, GDP and trade in the biomass potential studies 155 A1.8 Economic mechanisms in the biomass potential studies 156
A1.9 Energy use in the biomass potential studies 157
A1.10 Sensitivity analysis done in the biomass potential studies 158
List of Figures
2.S1 Ranges of estimated global biomass potentials 15
2.1 Overview of various present types of biomass flows and the global land surface
(Hoogwijk et al., 2005) 17
2.2 Overview of key elements and correlations included in the assessment of (Smeets
et al., 2007). 18
2.3 GHG effectiveness of different bioenergy systems. (B. Schlamadinger, Johanneum
research, personal communication) 23
2.4 Ranges of estimated global biomass potentials (Upper and lower ranges of
scenario results are presented for each study.) 24
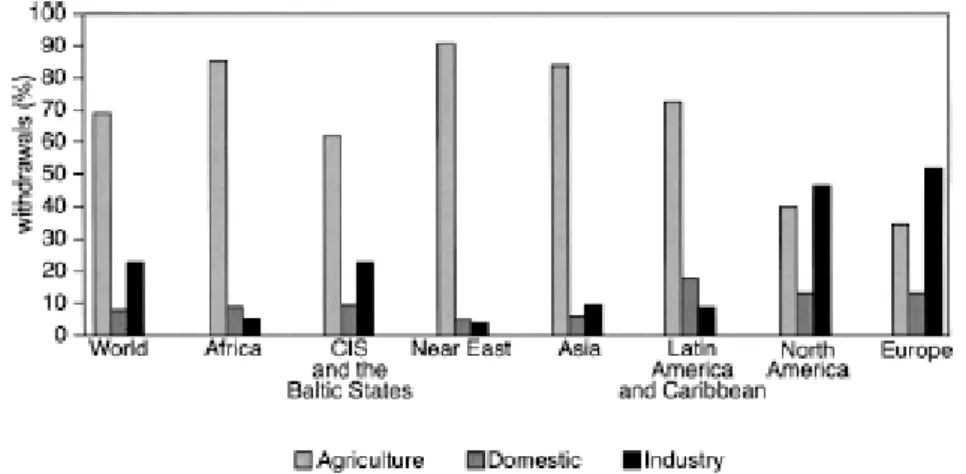
2.5 Global biomass production across scenarios (USCCSP, 2006 25 4.S1 Water withdrawals by region and by sector (adapted from FAO) 59 4.1 Water withdrawal by sector (in %; Alcamo et al., 2000) 65 4.2 Water withdrawals by region and by sector (adapted from FAO) 66 4.3 Renewable water resources and water depletion by different sectors around 2000
(after Seckler et al., 2000, Fraiture et al., 2007, Rosegrant et al, 2002; Alcamo,
2003; Shiklomanov, 2000; Oki & Kanae, 2006) 66
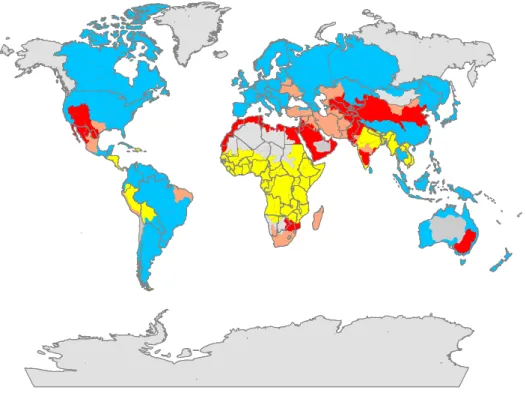
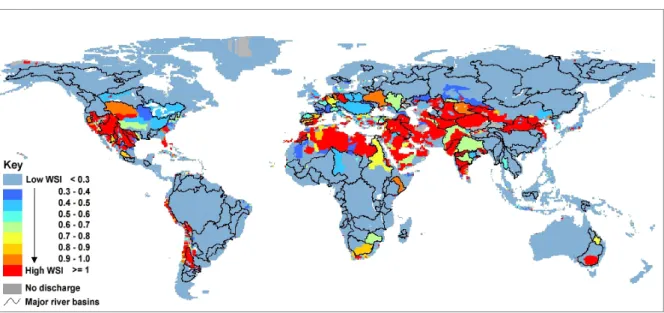
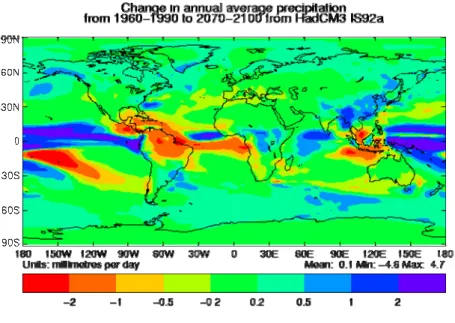
4.4 Area of physical and economic water scarcity. Source: Molden, 2007b. 68 4.5 A map of the water stress indicator taking into account EWR 69 4.6 Relative changes in precipitation (in percent) for the period 2090–2099, relative to
1980–1999. 75
4.7 Changes in annual average precipitation form the period 2070–2100, relative to
5.1 The basic elements of a policy relevant indicator: setting verifiable targets, up-to-date monitoring system, and availability of options or measures to achieve
corrections on the trend. 82
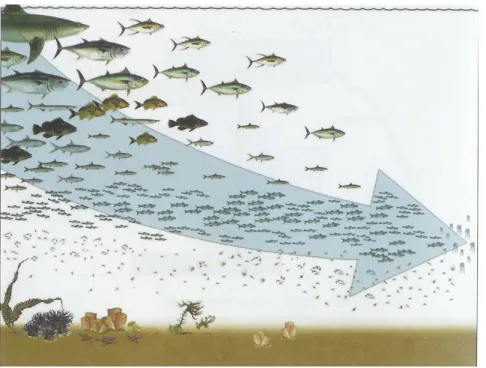
5.2 “Fishing down the food web (Pauly et al., 1998) A graphical representation of the
homogenisation process in the marine environment. 84
5.3 Trends in terrestrial surface under protection (CBD, 2006). 90 5.4 Mean species abundance of original species for different land-use types that form a
range in land-use intensity (from unimpacted forest to completely converted forest).
Data from GLOBIO literature database (july 2007). 96
6.S1 Biomass use in the different global energy scenarios. 114 6.S2 Shares of power, biofuel and other applications in the different global and regional
scenarios, sorted in increasing order of power share. EPPA is omitted, since the allocation between transport and other applications is not clear. 115 6.1 World primary energy demand as indicated in the different scenario studies. 119 6.2 Biomass use in the different global energy scenarios 120 6.3 Biomass shares in total energy supply, for the global and regional scenarios. 120 6.4 Shares of power, biofuel and other applications in the different global and regional
scenarios, sorted in increasing order of power share. EPPA is omitted, since the allocation between transport and other applications is not clear. 122 7.1a The Emergence of Biofuel Markets, Source: FAPRI (2006) 132 7.1b The Emergence of Biofuel Markets, Source: FAPRI (2006) 133 7.2 Production of crops for energy under different scenarios in the EU, 2005 and 2020,
in million tons. Source: Nowicki et al., 2006. 136
7.3 General framework for EU-RURALIS project 137
7.4 Scenarios in EU-RURALIS 139
7.5 Initial Share of Biofuels in Transportation in the EU25, 2005 141 7.6 Share of Biofuels in Transportation in the EU25, 2010 – No mandatory blending 142 7.7 Change in Arable Land us in the EU25, 2001-2010 – Mandatory blending: 5.75% 142 7.8 Change in Arable Land us in the EU25, 2001-2010 – Mandatory blending: 11.5% 143 7.9 The impact of biofuel directive on production and price (Source: Banse and Grethe,
2006) 143
A12.4 Sectoral structure of the economy in the EU-10 in 2005 and 2020. 189
A12.5 Share of agri-food complex in economy. 189
A12.12 Decomposition of production growth of protected products for the EU-10,
2005-2020. 195
A12.13 Decomposition of production growth of less protected products for the EU-10,
2005-2020. 195 A12.14 Real farm income growth for crop sectors in EU-15, 2005-2020. 196
A12.15 Real farm income growth for livestock sectors in EU-15, 2005-2020. 197 A12.16 Real farm income growth for crop sectors in EU-10, 2005-2020. 197 A12.17 Real farm income growth for livestock sectors in EU-10, 2005-2020. 198 A12.18 Sectoral employment growth in the EU-15, 2005-2020. 198 A12.19 Sectoral employment growth in the EU-10, 2005-2020. 199 A12.20 Development of real factor prices in the EU-15, 2005-2020. 199 A12.21 Development of real factor prices in the EU-10, 2005-2020. 200 A12.22 Development agricultural and non-agricultural wages in baseline scenario in 201
1 Introduction
This Supporting Document contains the result of the inventory phase of the study: “Biomass
Assessment: Assessment of global biomass potentials and their links to food, water, biodiversity, energy demand and materials”. The study was commissioned and supported by
the Netherlands Research Program on Climate Change (NRP-CC), subprogram Scientific Assessment and Policy Analysis (WAB).
Main objectives of the assessment study:
1. To provide clear insight in the linkages between the impacts of (large-scale) use of biomass for energy and material on food supplies, water use, nature and biodiversity, and in macro-economic terms.
2. Provide insight in regional and site-specific elements in the above mentioned issues.
3. To translate the results of the assessment into an overview of the more and less certain issues with respect to biomass resource potentials and to policy relevant recommendations on how to develop and use biomass resources in a sustainable way, including research and development needs.
Set up of the work:
• Part 1 comprises an extensive assessment of recent literature on the key areas distinguished: biomass potentials and land use, food production, water, biodiversity and macro-economic analyses. Furthermore, GHG balances of biomass use for energy are distinguished as a separate topic. Distinction is made between various biomass resource-technology combinations and different settings for biomass production.
• Part 2 is an integration component, which describes the linkages between the different key areas and quantifies the consequences of the results of the assessment to the extent that available models and tools allow doing so. A limitation of this study is that no new models will be developed.
• Part 3 translates the results of the assessment and the integration activities into an extensive assessment of the uncertainties of future biomass resource potentials and which factors are of major and which of lesser importance. Based on this, policy recommendations further steps to reduce uncertainties and fill gaps in knowledge are identified.
Part 1 is reported in this Supporting Document, while Part 2 and 3 are covered in the Main Report of the study.
Consortium
The study is carried out by a consortium consisting of: • Utrecht University (UU)
• Vrije Universiteit Amsterdam (VU),
• Wageningen University and Research centre (WUR), • Netherlands Environmental Assessment Agency (MNP), • Energy research Centre of the Netherlands (ECN), • Utrecht Centre for Energy research (UCE, manager).
Structure of the report
The main structure of the report is based upon the key areas selected: Chapter 2: Biomass potentials
Chapter 3: Food demand Chapter 4: Water
Chapter 5: Biodiversity
Chapter 6: Demand-side models Chapter 7: Agricultural economics
This draft is being circulated for comments to the members of the Dutch Sounding Board of the project and also to the members of the international Review Group.
2 Biomass
potentials
Contributing authors:Veronika Dornburg Andre Faaij
2.1 Summary of biomass potential studies review
2.1.1 Introduction
Targets and projections for the contribution of biomass to the energy supply go up to over 30% of the global energy demand in the first half this century and even more after that. Thus, the expectations on the contribution of biomass to energy production are high. Moreover, biomass is expected to play a larger role in the provision of materials, such as chemicals and construction materials. To evaluate these expectation and to develop adequate biomass utilization strategies, various assessments of the amount of biomass that can be used for energy and material purpose in the short to long term have been carried out. However, earlier analyses of biomass potential studies had shown large ranges of outcomes that were based on differences in methodologies and assumption on crop yields and available land. In the case of economical potentials ranges were also based on differences in the estimated production costs. Biomass can be divided into biomass from primary production, primary residues (i.e. harvest and logging residues), secondary residues (i.e. residues from the processing of agricultural crops and wood products) and tertiary residues (i.e. residues after end-use of biomass products. The studies assessed deal with either technical or economic biomass potentials:
• Technical potential, i.e. the theoretical upper potential limited by the demand of land for other purposes and based on an assumed level of agricultural technology.
- Economic potential, i.e. the technical potential limited by economic profitability. The economic potential is determined by biomass production costs that are a result of land prices and production systems (i.e. supply costs) as well as by the demand for crops and wood products.
2.1.2 The ideal study
An ‘ideal’ study to evaluate technical biomass potentials should take into account global and regional trends such as land use, food demands, GDP growth and population development. In addition to that many factors that determine land availability or crop yields depend on very
specific local conditions that play a large role in determining regional biomass potentials and
might be even more important in the overall results. Such local conditions are soil types, water availability, possibility of irrigation and land use planning taking biodiversity and soil quality into account. Biomass potentials have been analyzed at different geographical scopes. Most assessment studies use either regional data or grid-cell data (1ºx1º), but local conditions have not been analyzed in a sufficient detail, which might lead to over- or underestimation of local biomass potentials that could add up on the global scale.
In view of economic potentials, biomass production costs in relation to energy and/or carbon prices are decisive, which in turn depend directly on the supply and demand of food, materials, wood products and energy carriers. Increasing the use of biomass for energy and materials, however, would change land-use patterns and energy systems significantly. Such changes influence supply and demand of (agricultural) land as well as supply and demand of food, materials, wood products and energy carriers in a dynamic way. The economic relationships
between the demand and the supply of biomass, especially taking into account changes of land
and food prices on a regional to local level, have been underexposed in biomass potential studies. As a consequence, economic biomass potentials may be overestimated as price
increases are not taken into account or underestimated as adaptation in the supply of biomass and food (e.g. intensification) are not considered.
2.1.3 Review of recent studies estimating biomass potentials
Earlier, the ‘GRAIN project’ assessed 17 studies that estimated biomass potentials. This assessment concluded that “the studies arrived at widely different conclusions about the possible contribution of biomass in the future global energy supply (e.g., from below 100 EJ yr−1 to above 400 EJ yr−1 in 2050) and that the major reason for the differences is that the two most crucial parameters—land availability and yield levels in energy crop production—are very uncertain, and subject to widely different opinions” (Berndes et al., 2003)
In this assessment, we focus on the relation between estimated biomass potentials and the availability and demand of water, the production and demand of food, economic mechanism that influence potentials if the use of biomass is applied on a large scale and on the relationship with biodiversity. For this purpose, we analyzed 8 recent studies. Of the recent studies available, we selected those that either estimate global biomass potentials and/or that developed methodology further. Special attention in review of biomass potential studies is paid to the methodology and data used to include the above mentioned issues. None of the studies regarded does cover the whole range of issues, but have strong points at certain aspects of the relation between biomass potentials and issues like, food, water and economy. Table 2.S1 summarizes the strong and weak points of the studies reviewed.
Table 2.S1 Overview and evaluation of selected biomass potential studies
Study Subject Biomass potential Evaluation
Fischer et
al., 2005 Assessment of eco-physiological biomass yields
CEE, North and Central Asia; EC (poplar, willow, miscan-thus); TP
Strong: detailed differentiation of land suitability for
biomass production of specific crops on a grid cell level (0.5 degree)
Weak: not considering interlinkages with food, energy,
economy biodiversity and water demands Hoogwijk et al., 2005 Integrated assessment based on SRES scenarios Global, EC (short rotation crops); TP
Strong: integrated assessment considering food,
energy material demands including a scenario analyses based; analyses of different categories of land (e.g. marginal, abandoned)
Weak: crop yields not modelled detailed for different
species and management systems Hoogwijk et al., 2004 Cost-supply curves of biomass based on integrated assessment Global; EC (short rotation crops; TP, EP (as cost-supply curve)
Strong: establishes a global cost-supply curve for
biomass based on integrated assessment
Weak: linkage land/ energy prices not regarded
Obersteiner et al., 2006
Biomass supply from afforestation/ reforestation activities
Global; F (incl. short rotation); EP
Strong: modelling of economic potential by comparing
net present value of agriculture and forestry on grid-cell level
Weak: yields of forestry production not dependent on
different technology levels Perlack et
al., 2005 Biomass supply study based on outlook studies from agriculture and forestry
USA; EC, F, FR,
AR, SR, TR; TP Strong: detailed inclusion of possible advances in agricultural production systems (incl. genetic manipulation)
Weak: no integrated assessment, e.g. demands for
food and materials not modelled Rokityanski
et al., 2007
Analysis of land use change mitigation options; methods similar to Obersteiner et al., 2006. Global; F (incl. short rotation); EP
Strong: policy analysis of stimulating land use options
including carbon prices
Weak: agricultural land not included
Smeets et al., 2007
Bottom-up assessment of bio-energy potentials
Global; EC, F, AR, FR, SR, TR; TP
Strong: detailed bottom-up information on agricultural
production systems incl. animal production
Weak: yield data for crops only regionally modelled
Wolf et al., 2003
Bottom-up assessment of bio-energy potentials mainly analyzing food supplies
Global; EC; TP Strong: various scenarios on production systems and
demand showing a large range of potentials
Weak: yields of energy crops not specified for different
species and land types
Biomass: EC – energy crops, F: forestry production, FR: primary forest residues, AR: primary agricultural residues, SR: secondary residues, TR: tertiary residues : Potentials: TP – technical potential, EP – economic potential
2.1.4 Resulting data for key parameters
The scope in terms of biomass resources included as well as the scenario assumptions vary between the different studies. As a consequence, global biomass potentials vary widely, see Figure 2.S1. The high biomass potential for 2050 determined by (Smeets et al., 2007) shows possible potentials that arise with an intensification of agriculture assuming a very high technological level of agricultural production. On the contrary, the low biomass potential for 2050 calculated by (Wolf et al., 2003) represent a pessimistic scenario with regard to population growth, to food demands and assuming a low intensive (‘ecological’) production system. The study of (Hoogwijk et al. 2005) regards the production of energy crops on abandoned, marginal and restland assuming global and regional trends as described in the IPCC SRES scenarios, while an increase in agricultural efficiency over time is assumed. This leads to estimated biomass potentials that are higher in 2100 than in 2050, especially in the scenario that assumes a large development of agricultural management systems. The highest potentials in this study result for the A1 scenario, while the lowest potentials occur in the A2 scenario. This is also true for the economic potentials estimated in (Hoogwijk et al., 2004.) Finally, the study of (Rokityanski et al., 2007) determines economic potentials of biomass production from afforestation and reforestation, thus, excluding other energy crops and secondary and tertiary residues and assuming extensive forestry management. As a result, the economic potentials for 2100 are rather low.
Figure 2.S1 Ranges of estimated global biomass potentials
2.1.5 Conclusions
The recent biomass potential studies give more detailed and well-founded insights into future biomass potentials, but none of the studies does include all critical aspects. Furthermore, a large part of important methodological and data issues remain unresolved in the recent studies even though often more knowledge is available in other scientific disciplines as has been shown in other part of the assessment, i.e. assessment on the knowledge base in the fields of water, food, biodiversity, energy demand and economic mechanisms. Important issues are:
The competition for water with other economic sectors as well as the possibilities of irrigation have not been included in the biomass potential studies.
- Human diets and possible protein chains have been poorly included in the potential estimates, while the impacts of different animal production systems could be studied in more detail and applied to more biomass potential studies
- Crop yields due to different agricultural production system have a large impact on biomass potentials (Perlack et al., 2005; Smeets et al., 2007), but more knowledge on the expected
Global biomass potentials
0 200 400 600 800 1000 1200 1400 1600 1800 2040 2050 2060 2070 2080 2090 2100 2110 year EJ/yr
Smeets (all resources) Wolf (energy crops)
Hoogwijk (energy crops) Hoogwijk (energy crops < 2 Euro/GJ) Rokitiyanski (forestry - demand-driven)
rates of learning and implementation of advanced technologies in agriculture would be desirable.
- The demand for wood products and other bio-materials has been simplified in most studies and has not been modelled based on economic scenario analysis.
- The impact of large-scale biomass production on the prices (and subsequently) demands of land and food has not been sufficiently studied.
- The impact of specific biodiversity objectives on biomass potentials has not been investigated in detail.
Further research on specifying yields of food crops, energy crops and forestry depending on detailed local conditions, water availability and developments of agricultural technology seems not sufficient. Also research on the competition between biomass for energy and materials with food, wood products and other energy carries as well as competition for water and land resources is necessary.
2.2 Introduction
Biomass is considered to be the most important renewable energy source for the coming decades, worldwide, in Europe, as well as in the Netherlands. Targets and projections for the contribution of biomass to the energy supply go up to over 30% of the global energy demand in the first half this century and even more after that. The Netherlands also formulated a vision that 30% of the national energy supply should be covered by biomass in 2030 which is equivalent to about 1000 PJ.
Thus, the expectations on the contribution of biomass to energy production are high. Moreover, biomass is expected to play a larger role in the provision of materials, such as chemicals and construction materials. To evaluate these expectations and to develop adequate biomass utilization strategies, various assessments of the amount of biomass that can be used for energy and material purpose in the short to long term have been carried out.
Biomass potentials in various studies are often expressed in EJ per year. However, the types of biomass regarded as well as the type of potential investigated vary. It is, therefore, important to define the terms ‘biomass’ and ‘potential’ carefully.
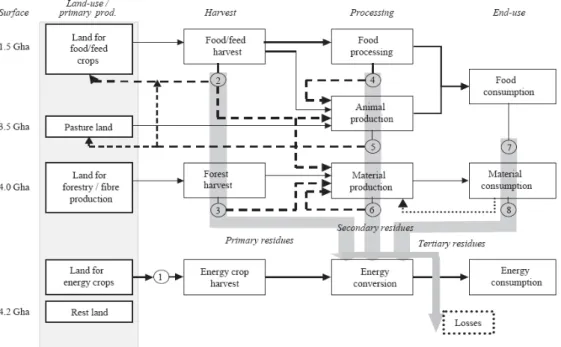
Biomass can be divided into biomass from primary production, primary residues, secondary
residues and tertiary residues, see Figure 2.1.
- Biomass from primary production are energy crops that are grown on agricultural land and wood produced in forests. It should be noted, that short rotation crops are sometimes referred to as forestry and sometimes referred to as energy crops
- Primary residues are residues from harvesting, i.e. agricultural residues (e.g. wheat straw, bagasse) and forestry residues (e.g. small branches and tops).
- Secondary residues arise during the processing of agricultural crops and wood products to produce food/fodder and other materials, e.g. oilseed cake or sawmill dust
- Tertiary residues are residues after end-use of biomass products, e.g. wood from demolition waste or sewage sludge.
Figure 2.1 Overview of various present types of biomass flows and the global land surface (Hoogwijk et al., 2005)
Biomass potentials can be divided into technical, economic and implementation potentials. - Technical potential, i.e. the theoretical upper potential limited by the demand of land for other
purposes and based on an assumed level of agricultural technology. The technical potential depends mainly on crop yields, land and forest areas available for biomass production and the demand for food and wood products. Crop yields depend on agro-ecological data (e.g. climate, soils) and the level of agricultural technologies
- Economic potential, i.e. the technical potential limited by economically profitability. The economic potential is determined by biomass production costs that are a result of land prices and production systems (i.e. supply costs) as well as by the demand for crops and wood products. Economic potentials can change with the amount of biomass produced, e.g. land prices may rise due to an increased use of biomass for energy.
- Implementation potential, i.e. the economic potential that can be implemented within a certain time frame. Implementation potentials depend on technological learning and the drivers and barriers that influence innovation. In many assessment studies a considerable progress in agronomy (and forestry) is assumed leading to higher yields in the future. Whether or not, this improvement of yields and costs will take place, is a key question in assessing future biomass potentials.
2.3 The ideal study
Earlier, the ‘GRAIN project’ assessed 17 studies that estimated biomass potentials. This assessment concluded that “the studies arrived at widely different conclusions about the possible contribution of biomass in the future global energy supply (e.g., from below 100 EJ yr−1 to above 400 EJ yr−1 in 2050) and that the major reason for the differences is that the two most crucial parameters—land availability and yield levels in energy crop production—are very uncertain, and subject to widely different opinions” (Berndes et al., 2003) Moreover, this assessment concluded that the links of biomass potentials with food production, biodiversity, soil and nature conservation, and carbon sequestration have not been analyzed sufficiently. Smeets et al. (2007) divided biomass potential studies into demand-driven, supply-driven and
demand-supply driven studies. Most of the reviewed biomass potential studies are either
the total bio-energy resource base. An ‘ideal’ study, however, should take into account the
economic relationships between the demand and the supply of biomass.
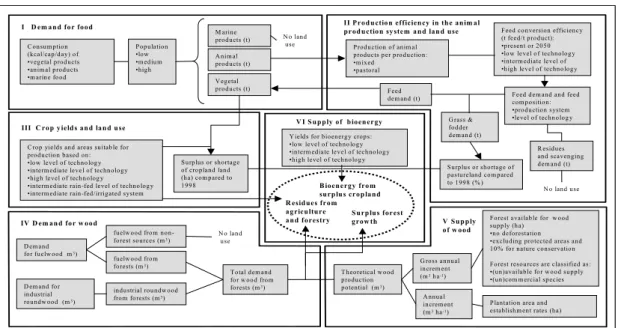
For supply driven studies estimating technical potentials main parameters are crop and forests yields, agro-ecological data, water availability, population growth in terms of the demand for food and wood products, the establishment of forest plantation and the rate of improvement in agricultural management and the use of pastures and marginal land for biomass production., see Figure 2.2 for a possible approach that takes into account the different demands for biomass resources.
Biomass potentials have been analyzed at different geographical scopes. Most assessment studies use either regional data or grid-cell data (1ºx1º). However, many factors that determine land availability or crop yields depend on very specific local conditions, such as soil types, water availability, possibility of irrigation and land use planning taking biodiversity and soil quality, These local conditions have to be taken into account. Conditions for improving crop yields as well as allocation of land to biomass and food production remain critical issues that have to be resolved. Environmental concerns such as water pollution and availability, soil erosion and quality and bio-diversity may limit technical potentials.
For demand-driven studies estimating economic potentials, economic growth, carbon prices and energy demands are crucial parameters determining potential, see the Section 6 for a further discussion of critical issues.
Finally, demand-supply driven studies are often so-called ‘integrated assessment’ studies. Apart from the parameters that are important for supply and demand driven studies, this type of study should incorporate links between the supply and demand. Here, biomass production costs in relation to energy and/or carbon prices are decisive, which in turn depend directly on the supply and demand of food, materials, wood products and energy carriers. Increasing the use of biomass for energy and materials, however, would change land-use patterns and energy systems significantly. Such changes influence supply and demand of (agricultural) land as well as supply and demand of food, materials, wood products and energy carriers in a dynamic way. The economic relationships between the demand and the supply of biomass, especially taking into account changes of land and food prices on a regional to local level using price elasticities, have so far been underexposed in biomass potential studies.
C onsum ption (kcal/cap/day) of •vegetal products •anim al products •m arine food Population •low •m ediu m •high M arine products (t)
Feed conversion efficiency (t feed/t product): •present or 2050 •low level of technolog y •interm ediate level of •high level of technology A nim al
products (t) V egetal products (t)
C rop yields and areas suitab le for production based on: •low level of techno log y •interm ediate level of technology •high level of technolog y •interm ediate rain-fed level of techno logy •interm ediate rain-fed/irrigated system
Production of anim al products per production: •m ixed •pastoral N o land use G rass & fodder dem and (t) Feed dem and (t) R esidues and scavenging dem and (t) N o land use Surplus or shortage of cropland land (ha) com pared to 1998
Surplus or shortage of pastureland com pared to 1998 (% ) II Production efficiency in the anim al production sy stem and land use I D em and for food
Y ields for bioenergy crops: •low level of techno logy •interm ediate level of technolog y •high level of techno log y
B ioenergy from surplus cropland III C rop y ields and land use
Feed dem and and feed com position: •production system •level of technolog y V I Supply of bioenergy
D em and for fuelw ood m3)
N o land use IV D em and for w ood
Surplus forest
grow th V Supply of w ood fuelw ood from
non-forest sources (m3)
industrial roundw ood from forests (m3)
fuelw ood from forests (m3)
T otal dem and for w ood from forests (m3) D em and for
industrial roundw ood (m3)
Forest availab le for w ood supply (ha) •no deforestation •excluding protected areas and 10% for nature conservation Forest resources are classified as: •(un)available for w ood supply •(un)com m ercial species G ross annual increm ent (m3ha-1) A nnual increm ent (m3ha-1) T heoretical w ood production potential (m3)
P lantation area and establish m ent rates (ha) R esidues from agriculture and forestry C onsum ption (kcal/cap/day) of •vegetal products •anim al products •m arine food Population •low •m ediu m •high M arine products (t)
Feed conversion efficiency (t feed/t product): •present or 2050 •low level of technolog y •interm ediate level of •high level of technology A nim al
products (t) V egetal products (t)
C rop yields and areas suitab le for production based on: •low level of techno log y •interm ediate level of technology •high level of technolog y •interm ediate rain-fed level of techno logy •interm ediate rain-fed/irrigated system
Production of anim al products per production: •m ixed •pastoral N o land use G rass & fodder dem and (t) Feed dem and (t) R esidues and scavenging dem and (t) N o land use Surplus or shortage of cropland land (ha) com pared to 1998
Surplus or shortage of pastureland com pared to 1998 (% ) II Production efficiency in the anim al production sy stem and land use I D em and for food
Y ields for bioenergy crops: •low level of techno logy •interm ediate level of technolog y •high level of techno log y
B ioenergy from surplus cropland III C rop y ields and land use
Feed dem and and feed com position: •production system •level of technolog y V I Supply of bioenergy
D em and for fuelw ood m3)
N o land use IV D em and for w ood
Surplus forest
grow th V Supply of w ood fuelw ood from
non-forest sources (m3)
industrial roundw ood from forests (m3)
fuelw ood from forests (m3)
T otal dem and for w ood from forests (m3) D em and for
industrial roundw ood (m3)
Forest availab le for w ood supply (ha) •no deforestation •excluding protected areas and 10% for nature conservation Forest resources are classified as: •(un)available for w ood supply •(un)com m ercial species G ross annual increm ent (m3ha-1) A nnual increm ent (m3ha-1) T heoretical w ood production potential (m3)
P lantation area and establish m ent rates (ha) R esidues from
agriculture and forestry
2.4 Review of recent studies estimating biomass potentials
In this review, we will focus on the relation between estimated biomass potentials and the availability and demand of water, the production and demand of food, economic mechanisms that influence potentials if the use of biomass is applied on a large scale and on the relationship with biodiversity. These aspects will be discussed in detail in the next two sections analyzing recent studies that estimate biomass potential.
2.4.1 Overview studies
Since the GRAIN assessment of biomass potential studies (Berndes et al., 2003), a couple of new biomass potential studies have been published. For our overview, we selected studies that either focus on an assessment of global biomass potentials in the next 0 to 50 years (or even 100 years) and/or developed methodology to estimate potentials taking into account local conditions. Other non-selected recent biomass potential studies are presented in appendix 2. Table 2.1 summarizes the main characteristic of the 8 studies selected for our review, a more detailed overview of the studies is given in appendix 1. As our research focus of this part of the review are the amounts of biomass that are potentially available in the future, most selected studies are supply-driven. Demand-driven studies that specify the use of biomass for energy have been discussed in the section ‘energy and biomass demand projections.) However, Obersteiner et al. (2006) and Rokityanski et. al. (2007) use a partly supply-demand driven approach starting from a competition between agriculture and forestry depending on carbon prices.
Table 2.1 Overview of selected biomass potential studies
Study Subject Regional
scope
Type biomass
Type potential
Strong points Weak points
Fischer et al., 2005 Assessment of eco-physiological biomass yields CEE, North and Central Asia EC (poplar, willow, miscan-thus) TP - good differentiation of land suitability for biomass production of specific crops on a grid cell level (0.5 degree) - modeling more detailed than in previous assessments using land suitability
- pure supply study based on eco-physiological characteristics - not considering interlinkages with food, energy, economy biodiversity and water demands Hoogwijk et al., 2005 Integrated assessment based on SRES scenarios global EC (short rotation crops) TP - integrated assessment considering food, energy material demands - scenario analyses based on economic developments - analyses of different categories of land (e.g. marginal, abandoned)
- crop yields not modeled detailed for different species and management systems - economic
potentials are not regarded as well as linkage land/energy prices Hoogwijk et al., 2004 Cost-supply curves of biomass based on integrated assessment global EC (short rotation crops) TP, EP (as cost-supply curve) - establishes a global cost-supply curve for biomass based on integrated assessment - economic potential is not quantified depending on energy prices - linkage land/
energy prices not regarded Obersteiner
et al., 2006 Biomass supply from afforestation/ reforestation activities global F (incl. short rotation), EP - modeling of economic potential by comparing net present value of agriculture and forestry on grid-cell - agricultural land not included - yields of forestry production not dependent on different
Study Subject Regional
scope Type biomass Type potential Strong points Weak points
level technology levels
Perlack et al., 2005 Biomass supply study based on outlook studies from agriculture and forestry USA EC, F, FR, AR, SR, TR
TP - includes all biomass resources
- detailed inclusion of possible advances in agricultural production systems (incl. genetic manipulation)
- no integrated assessment, e.g. demands for food and materials not modeled Rokityanski et al., in press Analysis of land use change miti-gation options; methods similar to Obersteiner et al., 2006. global F (incl. short rotation), EP - policy analysis of stimulating land use options - carbon prices explicitly included - agricultural land not included - no technical potentials analyzed additionally to economic potentials Smeets et
al., 2007 Bottom-up assessment of bio-energy potentials global EC, F, AR, FR, SR, TR TP - detailed bottom-up information on agricultural production systems incl. animal production - complete overview of resources - no economic potential or costs calculated - yield data for crops
only regionally modeled Wolf et al., 2003 Bottom-up assessment of bio-energy potentials mainly analyzing food supplies
global EC TP - bottom-up analysis of food production - various scenarios on
production systems and demand showing a large range of potentials no economic potential or costs calculated - yields of energy
crops not specified for different species and land types
Biomass: EC – energy crops, F: forestry production, FR: primary forest residues, AR: primary agricultural residues, SR: secondary residues, TR: tertiary residues :
Potentials: TP – technical potential, EP – economic potential
2.4.2 Approaches used in the studies 2.4.2.1 Water
Water supply and demands of crop production and other water uses have been taken into account in a very simplified way in the regarded models. Most studies estimated yields by agro-ecological zones (AEZ) or crop growth models, which in turn are based on net primary production. In addition, Fischer et al. (2005) modelled water limitations of crop growth explicitly by comparing climate data with evapotranspiration data of specific crops, i.e. miscanthus, poplar and willow. All these approaches take into account rain-fed yields but do not include irrigation. Some studies also include assumption on irrigation, but most studies specify irrigation only indirect, i.e. by using management factors (Hoogwijk et al., 2005; Hoogwijk et al., 2004) or by assuming the current agricultural system that includes irrigation (Perlack et al., 2005). Management factors do specify the relation of actual yield to theoretical rain-fed yield, however, it has not been specified whether this relation is based on the application of irrigation or other management measures, e.g. fertilization. Two studies analyze irrigation more directly, but do not distinguish between different technologies and water availabilities due to other (industrial) water uses. Smeets et al. (2007) analyze whether soil, climate and terrain are suitable for irrigation based on AEZ and assumes irrigation on suitable areas only, while Wolf et al. (2003) estimate the possibility of irrigation on a grid-cell level.
2.4.2.2 Food demands and agricultural production
The land needed for food production is essential to calculate biomass potentials for energy and materials and as such food demand is included in all potential studies that regard agricultural land. Approaches to estimate the amount of land that is required to provide food demands
range from the use of simple key figures to integrated assessment models. For example, Fischer et al. (2005) exclude land highly suitable for cereals for biomass production without linking to actual food demands, while Hoogwijk et al. (2005) model food demands in an integrated assessment model taking into account supply and demands. Also food demands are based on diets related to GDP (Perlack et al., 2005; Smeets et al, 2007). Exceptions are the studies investigating forestry options (Obersteiner et al., 2006; Rokityanski et al., 2007). Here, food demands are not taken into account, but afforestation and reforestation are applied where the NPV of forestry is higher than the NPV of agricultural production.
Diets are based mainly on FAO projections and population estimates and many studies differentiate food demands between animal products and vegetal products (Hoogwijk et al., 2005; Hoogwijk et al., 2004; Smeets et al., 2007; Wolf et al., 2003). Modelling of agricultural crops ranges from modelling only grains and pastures (Wolf et al., 2003) to a differentiation of many different types of crops and fodder (Hoogwijk et al., 2005; Smeets et al., 2007). Sources of proteins for human consumption are not further researched.
Concerning food and energy crop production, most studies define different input and technology levels –e.g. ‘high input’ and ‘low input’ without specifying management methods such as the amount of fertilizers, type of machinery, etc. Approaches are the use of management factors which have been defined within the IPCC SRES scenarios (Hoogwijk et al., 2005; Hoogwijk et al., 2004) the modelling of production costs from a top-down approach (Obersteiner et al., 2006; Rokityanski et al., 2007) and the more detailed definition of a variety of relative high input systems (Smeets et al., 2007).
The efficiency of agricultural production increases over time in most studies, however, the resulting yields differs considerably. Hoogwijk et al. (2005) assume for the year 2100 management factors of up to 1.3, while Perlack et al. (2005) assume yield increases of 25 to 50% for the U.S and Smeets et al. (2007) even assume yield increases by a factor 2.9 - 4.6 in the world.
2.4.2.3 Material and energy demands
Material demands in general are not included in detail in the biomass potential studies. Only Smeets et al. (2007) and Perlack et al. (2005) include the processing residues from the production of food, bioenergy and wood products as well as waste using demand projections for the future from literature.
The demand for wood products is included in some studies as it determines the availability of forest resources for bio-energy. Hoogwijk et al. (2005) model the demand for wood using the integrated assessment model IMAGE, Smeets et al. (2007) use different levels of wood demands derived from literature in a scenario analysis and Perlack et al. (2005) estimate wood demand from macro-economic parameters.
Apart from the use of processing residues for bio-energy production, the selected studies do not consider the energy use of biomass as they are supply-driven. Obersteiner et al. (2006) use energy and carbon prices from the MESSAGE model to generate NPVs of afforestation
2.4.2.4 Economic mechanisms
Economic interactions that determine biomass potentials can be described at three different levels:
1. A comparison of production costs of different alternatives (e.g. different crops or forestry) at the farm level (micro-economic)
2. A comparison of biomass supply costs with demand curves and the resulting potentials 3. Changes of demand and supply curves due to income and substitution elasticity, e.g.
changing land and food prices caused by increased bio-energy production.
Only two studies regard the production costs at the micro-level, i.e. these studies compare the net present value of agriculture to the net present value of forestry for carbon sequestration and
biomass production (Obersteiner et al., 2006; Rokityanski et al., in press). In this way, competition for land is modeled. In the other studies, biomass production does not depend on the benefits for the producer as biomass production is supply driven.
Hoogwijk et al. (2005) use the Integrated Assessment Model IMAGE that has an agricultural economy model, which models food demand depending on GDP, population, etc. and at the same time models according supplies. Biomass for material and energy production is not modelled on the basis of demand and supply curves, but Hoogwijk et al. (2004) establish a global supply curve for biomass.
With regard to land prices, Hoogwijk et al. (2004) use scenario dependent land rental costs and Obersteiner et al. (2006) and Rokityanski et al. (2007) apply geographically specific land prices. However, these land prices do not depend on the level of biomass production. Food prices are not specified at all in the studies regarded.
None of the studies models the demand and supply for biomass for energy and material on the third level, i.e. using elasticity to describe a relation to food and wood product demand dynamically. In some studies explicitly modelled energy and carbon prices that are derived from the energy model MESSAGE are used to describe afforestation/reforestation supply approach (Obersteiner et al., 2006; Rokityanski et al., 2007).
2.4.2.5 Biodiversity
Several studies exclude the use of certain land areas for the production of biomass for biodiversity reasons, i.e. by using land claim exclusion factors for all types of land (Hoogwijk et al., 2005; Hoogwijk et al., 2004) and by excluding protected areas (Perlack et al., 2005, Smeets et al., 2007). Moreover, Fischer et al. (2005) exclude the use of forest land from biomass production, but does not mention biodiversity as a specific reason for this exclusion. Rokityanski et al. (2007) do not exclude forest land from biomass production, but discourages deforestation using a carbon policy.
Another way of including biodiversity, is the assumption of low-intensive production systems, i.e. assuming forestry with a low intensity (Rokityanski et al., 2007), keeping the use of pastures constant to avoid increasing grazing intensities (Smeets et al., 2007) and assuming a very low-intensive agricultural production system in a scenario analysis (Wolf et al., 2003). However, none of the regarded studies evaluates the effect of biomass production and the proposed measures on biodiversity.
2.4.2.6 GHG balances
Reducing greenhouse gas (GHG) emissions is a major driver for using biomass for energy and materials and many studies deal with GHG balances of biomass production and uses. Most biomass chains turn out to reduce net GHG emission, but the results can vary depending on the type of agricultural crop, the type of energy or material use, the land use changes possible involved and the fossil reference system; see also Figure 2.3. In general, second generation biofuels are more favourable than first generation biofuels as they tend to reduce energy inputs into biomass production and to increase the efficiency of biomass conversion.
Figure 2.3 GHG effectiveness of different bioenergy systems. (B. Schlamadinger, Johanneum research, personal communication)
Note: GHG is the emission per unit of final energy for the biomass system (including all upstream energy inputs), and GHGref is the emissions from the fossil reference system (including all upstream energy inputs) that would have resulted in absence of bioenergy use. The vertical axis in the diagram indicates the productivity of land for production of final energy per hectare. The GHG balance is optimal for high productivity systems with low GHG/GHGref (grey arrow indicate this optimization).
The reviewed biomass potential studies, however, do in general not analyze the GHG reduction potential as they focus on the supply and demand of biomass. The demand-driven studies of (Obersteiner et al., 2006, Rokityanski et al., 2007) determine the economic potential of biomass using among other carbon prices. As such, they use assumptions on carbon sequestration in reforestation/afforestation activity, but do not calculate GHG balance of the whole biomass production and use chain.
2.5 Resulting data for key parameters
2.5.1 Resulting potentials
The scope in terms of biomass resources included as well as the scenario assumptions vary between the different studies. As a consequence, biomass potentials vary widely, see Figure 2.4. All of the studies presented used several scenarios. Here, the respective highest and lowest potentials of each study are shown.
The high biomass potential for 2050 determined by Smeets et al. (2007) is by far the largest potential, while the low biomass potential of Smeets et al. (2007) is within the range of several other estimates. This can be explained by the fact that Smeets et al. (2007) assumed a scenario with a very high technological level of agricultural production in order to show possible potentials that arise with an intensification of agriculture. In this scenario, converting large parts of animal production to land-less systems and using abandoned pastures for biomass production has been included; an aspect that has not been investigated in other biomass potential studies. Finally, Smeets et al. (2007) included all types of biomass resources.
GHG / GHGref
1
Low productivity and biomass use
efficiency
Medium productivity and
biomass use
High productivity and biomass use
efficiency 0 E thanol / cor n Biodiesel / r apeseed E thanol / sugar cane Dedicated crops
Low biomass use efficiency
High biomass use efficiency By-products or co-products
Figure 2.4 Ranges of estimated global biomass potentials (Upper and lower ranges of scenario results are presented for each study.)
On the contrary, the low biomass potential for 2050 calculated by (Wolf et al., 2003) is by far the lowest potential with about 0 EJ/yr. This is due to the fact, that the scenario assumptions are pessimistic with regard to population growth and food demand and that a low intensive (‘ecological’) production system has been assumed. Yields assumed for bio-energy crops are in general low, i.e. yields of grassland are assumed.
Hoogwijk et al. (2005) used an integrated assessment model and analyzed biomass potentials for the IPCC SRES scenarios. Therefore, the scenarios represent a more or less economically and ecologically developing world, but are not created to present specifically optimistic or pessimistic assumptions with regard to biomass potentials. Estimated biomass potentials for 2050 are well within the range of other estimates. For the year 2100, these biomass potentials increase especially compared to 2050 in the scenarios with high biomass potentials. The economic potential, i.e. biomass that is available for below 2 €/GJ (about the current price of coal), is lower than the technical potential in 2050. However, the economic potentials in these scenarios are still higher than the pessimistic potentials estimated by (Wolf et al., 2003).
Rokitiyanski et al. (2007) estimated the economic potential for afforestation/reforestation measures in 2100. These potentials include the establishment of short rotation forestry on agricultural land. This option is comprised under energy crops in the other studies regarded. Yields of forestry are assumed to be rather low in a low intensive management system. At the assumed carbon and energy prices that are derived from the integrated assessment model MESSAGE using the SRES scenarios, biomass potentials from afforestation/reforestation are comparably low, i.e. about 200 EJ/yr.
Summarizing, agricultural production systems and resulting crop yields as well as the availability of land for biomass production, energy prices and biomass production costs remain the main parameters determining biomass potentials. These in turn depend on local circumstances and economic mechanisms as discussed in the Section ‘the ideal study’.
Global biomass potentials
0 200 400 600 800 1000 1200 1400 1600 1800 2040 2050 2060 2070 2080 2090 2100 2110 year EJ/yr
Smeets (all resources) Wolf (energy crops)
Hoogwijk (energy crops) Hoogwijk (energy crops < 2 Euro/GJ) Rokitiyanski (forestry - demand-driven)
For comparison, the integrated assessment models MERGE, ISGM and MiniCAM estimate biomass potentials that are driven by the stabilization of greenhouse gases in the atmosphere to be rather low. Biomass potentials range between 20-150 EJ/yr in 2050 and 100-250 EJ/yr in 2100.
Figure 2.5 Global biomass production across scenarios (USCCSP, 2006
2.5.2 Evaluation of knowledge gaps in studies 2.5.2.1 Water
The use and availability of water has been included in the biomass potential studies in a very simplified manner, e.g. by using rain-fed yields and management factors. Technologies and amount of irrigation as well as infiltration into soils and plant-availability of water are not specified in biomass potential studies. Also, the possibility of irrigation has not been analyzed sufficiently, i.e. in which geographic areas, on which soils, technology to be used, increase of yields, amount of water used and consequences for soil and water quality have not been investigated. Also, the impact of different agricultural production systems on future water quality and availability (e.g. effects from the root system on ground water levels) has not been addressed. Finally, water demands from other uses and limitation due to water quality aspects are not taken into account and a potential competition for water resources has not been investigated.
2.5.2.2 Food demands and agricultural production
Food demands are well taken into account in most biomass potential studies. Often results on food demands are based or compared to agricultural models such as the Agricultural Economy model of IMAGE, the model used for the Agricultural Outlook of USDA, the IFPRA model or the Basic-Linked System model. These models determine food demands depending on scenario assumptions about economic growth, income and diets.
A key aspect of food demands and the resulting available biomass potentials are the use of proteins in human diets as animal products require much larger amounts of agricultural land per grain equivalent than vegetable products. Whereas, the amount of animal products varies in the different food demand projections, alternative ways to provide proteins for human consumption (new food product developments and seafood) are not considered.
Another important aspect is the intensity of agricultural production, especially in the animal production system. Smeets et al. (2007) show that much land can be released when production of meat and diary products is done in more intensive (partly land-less in closed stables) schemes. Such changes in land-use functions are so far poorly studied. Assumptions on future crop yields and learning in agricultural production systems vary widely between the biomass potential studies. A more detailed analysis based on experiences in the agricultural sector could give insight into the factors that determine future crop yields.
2.5.2.3 Material and energy demands
Most studies do not model the demand for wood products endogenously, but use demand projection from forestry sector models (e.g. UNECE, FAO). These projection, however, do not