snijlijn
snijlijn
rug
PBL-omslag zonder flappen
340 x 240 mm
Hier komt bij voorkeur een flaptekst te staan, in plaats van deze algemene tekst
Het Planbureau voor de Leefomgeving is hét nationale instituut voor strategische beleidsanalyses op het gebied van milieu, natuur en ruimte.
Het PBL draagt bij aan de kwaliteit van het strategi-sche overheidsbeleid door een brug te vormen tussen wetenschap en beleid en door gevraagd en ongevraagd, onafhankelijk en wetenschappelijk gefundeerd, verken-ningen, analyses en evaluaties te verrichten waarbij een integrale benadering voorop staat.
Planbureau voor de Leefomgeving Locatie Bilthoven Postbus 303 3720 AH Bilthoven T: 030 274 274 5 F: 030 274 4479 E: info@pbl.nl www.pbl.nl
Planbureau voor de Leefomgeving, <maand> 200X Netherlands Environmental Assessment Agency, October 2010
Rethinking Global Biodiversity
Strategies
Rethinking Global
Biodiversity Strategies
Exploring structural changes in
production and consumption
to reduce biodiversity loss
A contribution to the project on
The Economics of Ecosystems and Biodiversity (TEEB)
In cooperation with
Agricultural Economics Research Institute of Wageningen University and Research Centre Sea Around Us Project of the Fisheries Centre of the University of British Columbia, Canada
Rethinking Global Biodiversity Strategies: Exploring structural changes in production and consumption to reduce biodiversity loss.
© Netherlands Environmental Assessment Agency (PBL), The Hague/Bilthoven, 2010 ISBN: 978-90-78645-50-4
PBL publication number 500197001 Corresponding author:
Ben ten Brink (ben.tenbrink@pbl.nl)
Parts of this publication may be reproduced, providing the source is stated, in the form: Netherlands Environmental Assessment Agency (2010) Rethinking Global Biodiversity Strategies: Exploring structural changes in production and consumption to reduce biodiversity loss.
This publication can be downloaded from our website: www.pbl.nl/en. A hard copy may be ordered from: reports@pbl.nl, citing the PBL publication number.
The Netherlands Environmental Assessment Agency (PBL) is the national institute for strategic policy analysis in the field of environment, nature and spatial planning. We contribute to improving the quality of political and administrative decision-making by conducting outlook studies, analyses and evaluations in which an integrated approach is considered paramount. Policy relevance is the prime concern in all our studies. We conduct solicited and unsolicited research that is both independent and always scientifically sound.
Office Bilthoven Office The Hague
PO Box 303 PO Box 30314
3720 AH Bilthoven 2500 GH The Hague
The Netherlands The Netherlands
Telephone: +31 (0) 30 274 274 5 Telephone: +31 (0) 70 328 8700 Fax: +31 (0) 30 274 44 79 Fax: +31 (0) 70 328 8799 E-mail: info@pbl.nl
Foreword
The world has not succeeded in reducing the rate of biodiversity loss by 2010 – neither globally, nor regionally, nor nationally. Why is this so? Because it has not been regarded as genuinely important, or because economic interests are too great and economic powers too strong? Or is it because we do not know how to reduce biodiversity loss – maybe because it is too complicated? We are changing the global landscape at an unprecedented rate and scale, changing vital cycles of water, nutrients, soil and energy to our own short-term benefit.
How can we balance short-term personal profits against long-term public and seemingly intangible gains? The ‘tyranny of small decisions’ and the ‘social dilemma’ are key issues to overcome. Moreover, it is becoming increasingly clear that solutions for one problem come at the expense of others. Business and political decisions are made in a myriad of parliaments, councils and boardrooms, in a highly competitive world. Discussions on climate change, biodiversity, development and food availability are held in different global arenas. We have improved our management in specialised fields, but have lost the overview of consequences that transcend them. Moreover, it is complicated enough to make progress within one single field.
The PBL has conducted this study on behalf of Minister Gerda Verburg from the Dutch Minstry of Agriculture, Nature and Food Quality, following the request by Mr Achim Steiner, UNEP's Executive Director.
With this study, the PBL hopes to contribute to the quality of strategic policy debate by providing an integral assessment of the consequences of various policy actions.
Director of the PBL - Netherlands Environmental Assessment Agency Professor Maarten Hajer
Acknowledgement
This study was conducted at the request of the Executive Director of the United Nations Environment Programme (UNEP) by the Netherlands Environmental Assessment Agency (PBL), in close cooperation with the Dutch Agricultural Economics Research Institute (LEI-WUR), and the ‘Sea Around Us Project’ of the Fisheries Centre of the University of British Columbia, Canada.
We thank the Advisory Group of the UNEP project on The Economics of Ecosystems and Biodiversity (TEEB) for the Terms of Reference for this analysis and their permanent feedback; the Secretariat of the Convention on Biological Diversity (CBD) for conducting a survey (Notification No. 2010-055) of the focal points of the Parties on the feasibility and desirability of policy options for reducing biodiversity loss. We thank the Parties who participated in the survey. We thank Aude Neuville and Francois Wakenhut of the European Commission for their encouragement to undertake this study at short notice. We thank Thomas Brooks, Tim Christophersen, Henk de Jong, Peter de Koning, Fred Langeweg, Rik Leemans, Markus Lehmann, Anil Markandya, Gert-Jan Nabuurs, Aude Neuville, Robert Nasi, Alfred Oteng, Henrique Pereira, Walter Reid, Carmen Revenga, Bob Watson and many others for their valuable comments and suggestions on the drafts of this report. This study received additional financing from the Netherlands Government as a further contribution to The Economics of Ecosystems and Biodiversity project.
Contents
Summary 11 1 Introduction 27 2 Assessing trends in future biodiversity 31 2.1 Introduction 31
2.2 Key indicators used in this report 34
2.3 Application of biodiversity indicators to assess the effectiveness of different options 39
3 Business-as-usual scenario: projections up to 2050 41 3.1 Key drivers of biodiversity loss 41
3.2 Projections on biodiversity loss and natural areas to 2050 43 3.3 Variations to the baseline 47
4 Eight options for reducing global biodiversity loss 53 4.1 Introduction 53
4.2 Expanding protected areas 55 4.3 Reducing deforestation 62 4.4 Closing the yield gap 68
4.5 Reducing post-harvest losses in the food chain 74 4.6 Changing diets 78
4.7 Improving forest management 84 4.8 Reducing marine fishing efforts 91 4.9 Mitigating climate change 97 4.10 Overview of option effects 103
4.11 Overview of the feasibility of options 105
5 Combining options for reducing biodiversity loss 109 5.1 Design of the combination of options 109
5.2 Global biodiversity under the combination of options 111
6 Effects on poverty, water, climate change and competing claims 121 6.1 Impacts on food availability and long-term human development 121 6.2 Impacts on carbon fluxes and climate change 125
6.3 Impact on water quality and aquatic biodiversity 129 6.4 Competing claims on land 133
7 Robustness of results 141 7.1 Conclusions 141
7.2 Robustness and uncertainties 142 7.3 Problem framing and study set-up 143 7.4 Indicator choice 145
7.5 Implications for the robustness of the main findings 146
Annex A Results of the CBD Policy Option Survey 149
Annex B Methodology 151 Glossary 153 References 159
Summary ‘Rethinking Global
Biodiversity Strategies’
Exploring structural changes in production
and consumption to reduce biodiversity loss
Improving prospects for future global biodiversity requires rethinking the strategic orientation from common policies and measures towards structural changes in production and consumption of goods and services. Significant and lasting improvements in the downward biodiversity trend will have to come from changes in human activities including agriculture, forestry, fishing, and energy use. Enhanced ‘eco-efficiency’ (that is: producing with lower ecological impact per unit output) could slow down biodiversity loss by reducing the expansion of agricultural land; stemming overexploitation of terrestrial and ocean ecosystems; and limiting climate change.
An ambitious, comprehensive and cross-sector strategy would cut the rate of biodiversity decline up to 2050 by half, compared to what was projected without any new policies. Measures in the combination explored include an expanded protected area network, more efficient agriculture and forestry, improved forest management, less meat intensive diets and limiting climate change. By design the combination of options contributes to other goals such as mitigating climate change and improving food security.
Human development increases demand for food, timber and other goods and services with direct consequences for the extent of natural areas. In addition, economic activities put a range of pressures on both natural and cultivated land, including climate change, air pollution, encroachment and disturbance. Most of these pressures are not directly relieved by conservation and protection, but by structural changes in production and consumption.
More traditional biodiversity policies focus on conservation and protection measures. Expanded and intensified measures continue to be important, for example in protecting ecosystems and selected species, and also in continuing provision and support of valuable ecosystem services. However, these commonly pursued policies have limited effect on ongoing pressures. And, if implemented alone would have negative impacts on other global issues, notably reducing malnutrition and hunger.
Biodiversity policies and measures should be selected and implemented in accord with human development interests, and prevent negative impacts. Coordination of targets, strategies and instruments across different policy fields is essential to reap co-benefits and to prevent unintended negative side-effects. Bilateral and multi-stakeholder policy processes will be an important
prerequisite for successful development and deployment of cross-sector and cross-issue policies and measures.
What is the problem?
The key challenge in preventing biodiversity loss is to strike a balance with human activity, not least in currently underdeveloped and emerging economies
Human development and, indeed, mere existence rely critically on provision of goods and services, often at the expense of ecosystem extent and quality. However, production and use of agricultural and wood products, fish and water tend to induce degradation of the natural environment. Despite efficiency gains, the increasing global population and increasing income per head will drive up demand for such commodities. Large land areas are needed to provide essential resources, such as food and wood, at the expense of natural areas.
Overexploitation and pollution of soils, water and atmosphere affect not only areas converted for human use but also the remaining natural areas. Historically, the compound effect has been to diminish the extent of near natural land cover and to reduce the quality of the remaining natural area leading to biodiversity loss. Degradation of ecosystems with implications for biodiversity affects the provision and support of valuable ecosystem services – another reason for concern. Current studies indicate that global biodiversity loss is not slowing down Several studies including the Global Biodiversity Outlook-3 conclude that at best progress is mixed towards the 2010 targets of the Convention on Biological Diversity (CBD). Biodiversity state indicators show that the ambition to reduce the rate of loss in quantitative terms is not met on different scales, although some progress has been made mostly on local and regional scales.
Current studies indicate that global biodiversity loss will continue without additional policies
The crucial issue is what additional policies are needed to reduce biodiversity loss and what could these achieve. Several studies indicate that in the coming half century, the trend is likely to change little unless structural changes are made to human activities and practices. This conclusion raises crucial questions:
Can future biodiversity loss be significantly reduced or even halted with specific policies and measures?
To what extent can the rate of loss be slowed down by specific measures? What are the trade-offs and synergies between these measures?
These questions are central to this report which examines the effectiveness of options for reducing biodiversity loss as either individual options or as part of an ambitious combination of options. The report aims to provide insights for a strategic debate on orientation of international biodiversity policy making. Key elements of institutional opportunities and, probably numerous, hurdles for effective implementation are not investigated here. Such issues concerning feasibility of policy proposals, more concrete measures and their institutional implications, warrant further attention.
Biodiversity is not easily preserved
The historic trend suggests that is difficult to achieve a balance between nature and biodiversity, and material human needs and activities that demand instant supply of marketable goods and services. Nature and biodiversity, however, constitute
less tangible, public services that are often only missed after they are gone. This is an over-simplification because there are plentiful examples of ‘naturalness’ and biodiversity representing a well recognised and exploited economic asset. In other cases, ethical, cultural and religious arguments in favour of nature and biodiversity conservation tip the balance towards protecting ecosystems and biodiversity. But on the whole, developments to date suggest that human development tends to override biodiversity concerns. Attempts are being made to value currently un-priced benefits of nature and biodiversity in order to assess the cost of policy inaction, and possibly to weigh the net benefits of policy interventions against the cost incurred. The UNEP Economics of Ecosystems and Biodiversity (TEEB) study is a recent example. However, methodologies and data are hampered by large uncertainties, methodological problems, and dispute. This is further complicated by opposing views on the inherent value of nature and on the justification of mankind to exploit it from an essentially anthropocentric perspective.
In the absence of a widely adopted metric for balancing natural and human aspects, alternative practices are sought to fulfil future human demands that have less impact on nature and biodiversity.
Estimating biodiversity
Biodiversity is difficult to define and even more difficult to measure
Biodiversity comprises the diversity of life on Earth across genes, species and ecosystems, and is difficult to define. According to the Convention on Biological Diversity, biodiversity is:
‘the variability among living organisms from all sources including, inter alia, terrestrial, marine and other aquatic ecosystems and the ecological complexes of which they are part; this includes diversity within species, between species and of ecosystems’.
Based on this broad definition, biodiversity cannot be monitored and projected by a single metric or indicator. Various indicators are deemed to be more practical and meaningful than simply striving for the highest number of species in as many ecosystems as possible. The CBD agreed on a set of five indicator categories to represent the state and change in state of biodiversity:
extent of ecosystems;
abundance and distribution of species; status of threatened species;
genetic diversity;
coverage of protected areas.
The CBD definition and indicator groups imply that meaningful assessment of future biodiversity requires a variety of indicators across the different CBD categories. It is worth noting that biodiversity state and trends are interpreted and judged according to the choice of indicators and their weighting.
This study uses a small set of indicators and an integrated model suite
This study aims to be comprehensive on the global scale, and addresses several indicators suitable for model-based analysis of future pathways. Much of the findings and discussion focuses on outcomes for the indicator of terrestrial
Mean Species Abundance (MSA). This is in essence an indicator of ‘naturalness’ of ecosystems as the compound result of human-induced pressure factors. It considers the composition of species in numbers and abundance compared with the original state and provides a common framework to assess the major causes of biodiversity loss. These range from land cover change, management changes, fragmentation, and climate change to nutrient deposition. To illustrate, conversion of forest to agricultural land induces massive change in species and frequency of occurrence, and thus MSA is much lower than in the original state.
The MSA indicator maps the compound effect of drivers of biodiversity loss, and uses a suite of direct and indirect drivers provided by the PBL integrated assessment modelling framework (IMAGE) in conjunction with an economic model at LEI (GTAP). The compound effect on biodiversity is computed with the PBL GLOBIO3 model for terrestrial ecosystems (and recently also for freshwater systems). Marine impacts are estimated with the UBC EcoOcean model system. In addition, the future pathway of direct and indirect drivers depend on a variety of socio-economic assumptions, technological developments and policy assumptions, which are represented in the IMAGE and GTAP model. As the IMAGE model and the GLOBIO3 are spatially explicit, the impacts on MSA can be analysed per region, per main biome and per pressure factor.
As stated above, biodiversity cannot be captured by one single indicator. To get a more complete view, additional measures associated with the CBD category of ecosystem extent were applied. Natural area is derived directly from the land cover projections of the models. In addition, the extent of largely undisturbed ecosystems is assessed as the extent of natural area in which the MSA is greater than 80%, referred to here as ‘wilderness area’.
While MSA loss closely relates to direct biodiversity parameters, it cannot be considered one-on-one as ‘the biodiversity’.
Results on all indicators presented in this report must be interpreted with caution. In particular, the global coverage implies that fine-scale local conditions, even though extremely relevant, cannot be captured. Likewise, the level of the seven regions for which results are reported represents the aggregated outcome over vast areas. Global results for the extent of aggregated biomes provide at best an indirect indication of issues of regional and local concern.
Analysis of options for reducing future biodiversity loss The baseline shows future population, economy, environment and biodiversity in the absence of new policies
The baseline serves as backdrop against which to evaluate the options. It is not the best-guess or most ‘realistic’ future as the assumed absence of new policies is hardly likely up to 2050. Incorporating expected future policies tends to hide potential future challenges and risks, and makes evaluation of alternatives less transparent. The baselines used for the various options fall within a narrow range for the key drivers and settings used in the latest OECD Environmental Outlook 2008.
Eight options for reducing global biodiversity loss
Priority setting in conservation
1 Expanding protected areas Conserving rare and valuable habitats, endemic species, hotspots, and a representative selection of ecoregions. 2 Reducing deforestation Maintaining carbon uptake and storage in forests;
synergy with climate change mitigation. Reduced agricultural expansion & eutrophication
3 Closing the yield gap Increasing agricultural yields to reduce agricultural expansion. 4 Reducing post-harvest losses …in the food chain, thus lowering agricultural production
and reducing expansion of agricultural land. 5 Changing diets …to less meat consumption patterns, reducing the
agricultural area for cattle feed and grazing. Reduce overexploitation of habitats
6 Improving forest management More forestry plantations with high productivity, and more reduced-impact logging outside plantations.
7 Reducing marine fishing efforts Bringing potential future marine catches to a higher, but sustainable level. Limit climate change
8 Mitigating climate change Reducing the impact of climate change with and without bio-energy to investigate trade-off from growing bio-energy crops.
Options for reducing biodiversity loss are evaluated for effects in the target year compared to the baseline
The individual options listed in Table S.1 explore the potential and prospects of potentially promising interventions. They draw on a range of studies, most of which have not been done exclusively with biodiversity concerns in mind. The cases explored are, therefore, not strictly consistent, and assumptions in some cases are for extreme conditions without consideration of feasibility. For instance, the 50% Protected Area case has consequences for the size and location of agriculture areas which seem highly impractical but was added as sensitivity variant to provide perspective for the 20% Protected Area case. Similarly, the No Meat variant under the option of Changing Diets pictures a future consumption preference very differently from current trends, preferences and established interests, but is helpful in identifying the contribution of meat production in a range of global issues. The options are explored on their prospects in ‘technical’ terms.
Most options do not have biodiversity as primary focus
The options illustrate how other issues and concerns interact with biodiversity, and what interventions by which groups of stakeholders could deliver the results shown. Issues of viability and feasibility of implementation are not addressed in depth, nor is the cost of implementation investigated explicitly. Some notions on these aspects are added ex-post for each option.
Eight options for reducing global biodiversity loss
Priority setting in conservation
1 Expanding protected areas Conserving rare and valuable habitats, endemic species, hotspots, and a representative selection of ecoregions. 2 Reducing deforestation Maintaining carbon uptake and storage in forests;
synergy with climate change mitigation. Reduced agricultural expansion & eutrophication
3 Closing the yield gap Increasing agricultural yields to reduce agricultural expansion. 4 Reducing post-harvest losses …in the food chain, thus lowering agricultural production
and reducing expansion of agricultural land. 5 Changing diets …to less meat consumption patterns, reducing the
agricultural area for cattle feed and grazing. Reduce overexploitation of habitats
6 Improving forest management More forestry plantations with high productivity, and more reduced-impact logging outside plantations.
7 Reducing marine fishing efforts Bringing potential future marine catches to a higher, but sustainable level. Limit climate change
8 Mitigating climate change Reducing the impact of climate change with and without bio-energy to investigate trade-off from growing bio-energy crops.
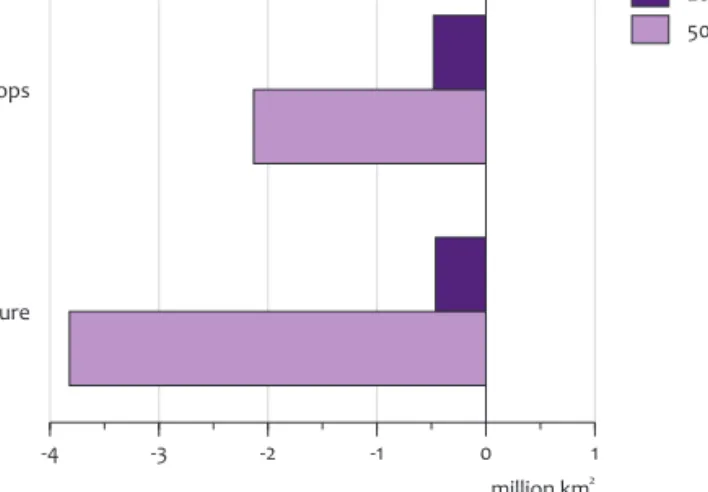
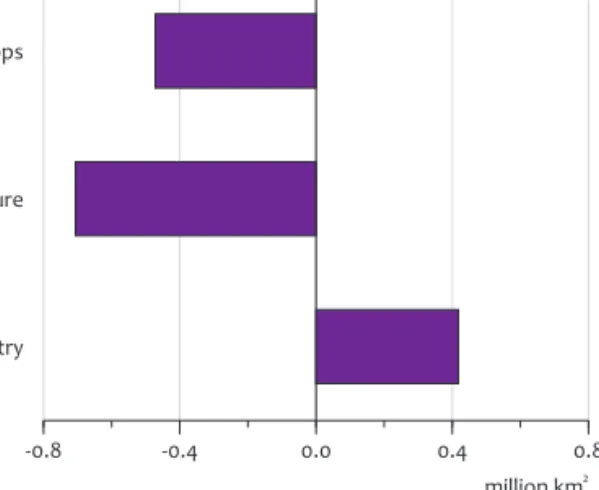
Effect of basic options on global biodiversity indicators illustrate the potential for improve-ment through a combination of protection and measures for food, wood and fibre produc-tion and consumpproduc-tion. Change in global bioversity of opproduc-tions expanding protected areas and reducing deforestation by 2030.
Figure 3.10
Expanding protected areas – 20% Expanding protected areas – 50% Reducing deforestation Closing the yield gap Reducing post-harvest losses Changing diets – Healthy diet Changing diets – No meat Improving forest management – High ambition Mitigating climate change – Without bio-energy Mitigating climate change – With bio-energy 25%
-20 0 20 40 60 % of baseline MSA loss Basic options Sensitivity variants
Change in global biodiversity of options expanding protected areas and reducing deforestation by 2030
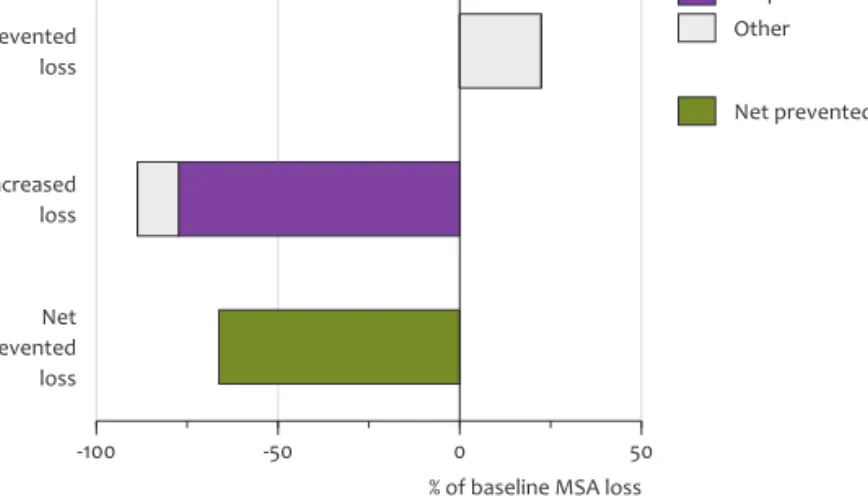
Prevented MSA loss, 2000 – 2050
Change in global biodiversity per option compared to baseline scenario
-5 0 5 10 15 20 million km2 Basic options Sensitivity variants Natural area, 2050 -5 0 5 10 15 20 million km2 Basic options Sensitivity variants Wilderness, 2050
Options are combined to exploit complementary reductions in pressures while minimising side effects
Individual options have a positive effect on one or few pressures on biodiversity, but sometimes negative side-effects on others. A well-considered combination may achieve more for biodiversity by addressing several pressures and contributing to several other goals and partly overcome negative side-effects. One comprehensive example was tested with due consideration to the results of the individual options. Extremes were avoided in favour of ambitious but conceivable targets for each option, assumed to be implemented between 2010 and 2030 (see Table S.2). The assumptions were either based on ambitious policy targets (e.g., for climate change) or on indications in the literature about achievable levels under ambitious policy effort (e.g., yield improvement).
Main findings of the model analysis
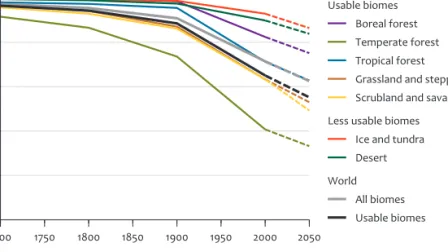
In the baseline scenario, MSA drops from 70 to 60% between 2000 and 2050 A drop from 70 to 60% between 2000 and 2050 is roughly the same rate of loss as observed over the 20th century (see Figure S.1). Although the change may appear small at first sight, it is a global average over the whole terrestrial area. About one fifth of all land is estimated to remain close to its natural state because it is too poorly suited for widespread human activity (hot deserts, polar and high-latitude boreal regions). Global MSA is thus not expected to drop below 30 to 35% which puts the reduction loss from 70 to 60% by 2050 in a different perspective. To illustrate, if the 10 percent point MSA loss were to occur in one contiguous area, that would be equivalent to 1.5 times the area of the USA that changes from a The projected development of global MSA per biome in the baseline scenario shows a loss between 2000 and 2050 at a similar rate as over the 20st century. MSA loss in earlier centu-ries occurred mostly in temperate biomes, while impact on subtropical and tropical biomes takes off from 1900.
Figure S.1 Potential 1700 1800 1900 2000 2050 0 20 40 60 80 100 MSA (%) Biomes Boreal forest Temperate forest Tropical forest Grassland and steppe Scrubland and savannah Ice and tundra Desert
Effect of basic options on global biodiversity indicators illustrate the potential for improve-ment through a combination of protection and measures for food, wood and fibre produc-tion and consumpproduc-tion. Change in global bioversity of opproduc-tions expanding protected areas and reducing deforestation by 2030.
Figure 3.10
Expanding protected areas – 20% Expanding protected areas – 50% Reducing deforestation Closing the yield gap Reducing post-harvest losses Changing diets – Healthy diet Changing diets – No meat Improving forest management – High ambition Mitigating climate change – Without bio-energy Mitigating climate change – With bio-energy 25%
-20 0 20 40 60 % of baseline MSA loss Basic options Sensitivity variants
Change in global biodiversity of options expanding protected areas and reducing deforestation by 2030
Prevented MSA loss, 2000 – 2050
Change in global biodiversity per option compared to baseline scenario
-5 0 5 10 15 20 million km2 Basic options Sensitivity variants Natural area, 2050 -5 0 5 10 15 20 million km2 Basic options Sensitivity variants Wilderness, 2050
pristine, natural state to zero original species within 50 years. Many species-rich ecosystems in the tropical, sub-tropical and temperate zones are, and would continue to be, more seriously affected than the global average (see Figure S.1). Over the same period, the natural area not occupied by intensive human activity decreases from 93 to 86 million km2, a drop of 7.5% and an area three quarters of
the size of the USA.
Over the next 50 years, current wilderness areas as large as 18 million km2, roughly
the size of Russia and about one quarter of the 71 million km2 in 2000, are set to
deteriorate in quality below the 80% mark and no longer count as wilderness in our terminology. The main direct drivers of biodiversity loss include expansion of the agricultural crop area to feed a global population of around 9 billion people by 2050; expanding infrastructure resulting in habitat loss, urban sprawl and disturbance of bordering natural areas; overexploitation of wild fish resources and forests; and nitrogen deposition and climate change.
The projected development of global MSA per biome in the baseline scenario shows a loss between 2000 and 2050 at a similar rate as over the 20st century. MSA loss in earlier centu-ries occurred mostly in temperate biomes, while impact on subtropical and tropical biomes takes off from 1900.
Figure S.1 Potential 1700 1800 1900 2000 2050 0 20 40 60 80 100 MSA (%) Biomes Boreal forest Temperate forest Tropical forest Grassland and steppe Scrubland and savannah Ice and tundra Desert
The results under baseline conditions in this study compare well with a range of similar scenario studies. The statement that without intensified and new policies, worldwide biodiversity loss will continue is robust and is not significantly influenced by the current economic problems, or by future business cycles. A different choice of indicator, for example emphasising species-rich biomes located in the tropics, would show greater impacts in the associated biomes and a more rapid decline in overall global biodiversity..
Grassland and forest biomes suffer the largest biodiversity losses in the baseline scenario
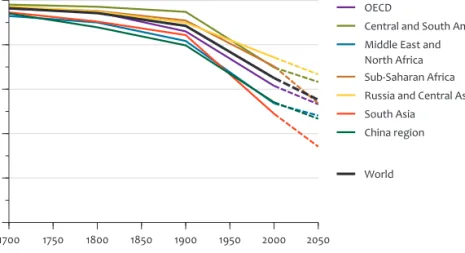
Future biodiversity loss is not evenly distributed worldwide but rather concentrated in regions such as Central and South America, Sub-Saharan Africa and Asia.
Biomes most affected are temperate and tropical grassland and forests that are most suitable for human settlement (see Figure S.1). These regions contain many ecoregions considered to be the richest in number of species. The remaining natural areas will be increasingly situated in mountainous, boreal/sub-polar, arid and semi-arid zones. Options for improving the situation would have their largest effect on the most affected biomes and regions.
Besides expanding protected areas, reducing global biodiversity loss through alternative development pathways offers good prospects
Improvements in the way ecosystem goods such as food and wood are produced can reduce biodiversity loss, and contribute to addressing concerns about poverty, water, energy and climate. Beneficial effects of traditional nature conservation measures have been demonstrated, such as protecting valuable and unique ecosystems. Meeting the demand for food products from a smaller agricultural land area reduces biodiversity loss and, if achieved at lower costs, helps to improve food security. In addition, greenhouse gas emissions would decrease and freshwater quality and availability would improve.
Options for reducing global biodiversity loss are widely accepted and conventional, and include less expansion of agricultural land, improved forestry, limiting climate change, and reshaping capture fisheries. The spatial distribution on the global map where these options would have their effects (world regions, biomes) is plausible following the trends by region and biome of the drivers behind the losses.
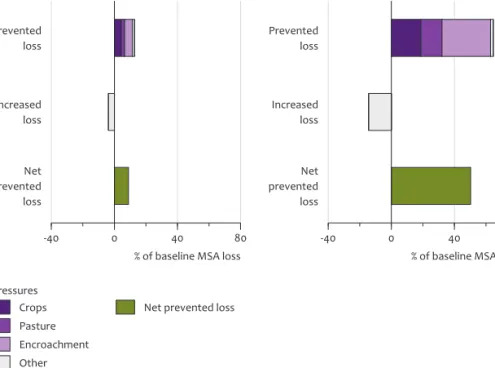
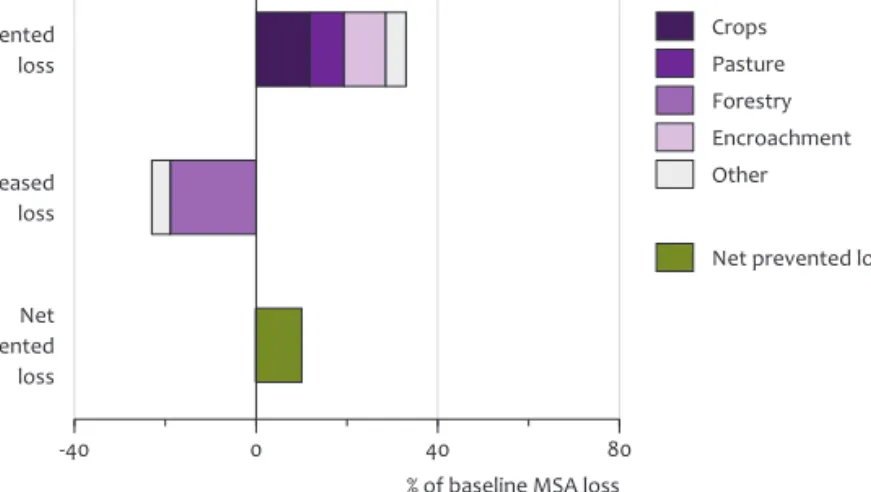
Each option can reduce biodiversity loss but none has sufficient potential to reverse the trend
The comprehensive assessment of earlier studies on the impact of individual measures to reduce future biodiversity loss confirms their potential. A total of eight single options (and some variants) were evaluated. However, none would be sufficient to fully reverse the trend of future biodiversity loss. Excluding sensitivity variants that explore technical limits, the maximum effect is a 40% reduction of the MSA lost in the baseline (see Figure S.2). Biodiversity loss is caused by multiple pressures and distinct drivers so that there are limits to what each option can achieve on its own. This implies that no simple solution for halting biodiversity loss in the near future was found. Natural and wilderness areas often show a similar pattern as MSA, but occasionally react differently to options, at times in opposite direction. Comparison of the magnitude of effects must be made with due consideration to the levels of implementation assumed.
Combination of Options*
Assumption Expanding protected areas for
biodiversity (1) and carbon stocks (2) (1) 20% of protected area (representing ecosystems and areas with threatened endemic species.
(2) 9% area covering carbon-rich vegetation. In total 29% in protected area. Improving agricultural productivity Rate of increase in yields 50% higher than in baseline (in OECD
countries to a maximum increase of 1.5% per year). Reducing agricultural losses Worldwide agricultural losses reduced from 20 to 13%. Changing diets to less meat Worldwide consumption patterns converge to 50% above the
consumption level suggested by the health oriented Willett diet.
Improving forest management Expansion of forest plantations meets 40-50% of timber demand by 2050. Remaining selective logging close to full use of reduced impact logging practices.
Mitigating climate change Long-term temperature change of 2 oC or 450 ppm CO 2 eq concentration (bio-energy grown only on abandoned land).
* Note that the implementation level of options can differ from what they were as individual options. This is reflected here by names not always identical to Table S.1
Options that increase efficiency in the supply chain of ecological goods have prospects for reducing biodiversity loss, especially in the agricultural sector Increasing production efficiency of ecological goods appears to contribute significantly to reducing future biodiversity loss as measured with three indicators. The options closing the yield gap, reducing post-harvest losses and improving forest
management all focus on producing at least the same amount of goods with lower biodiversity impact. Moreover, the option changing diets reduces biodiversity loss by shifting consumption to less land-intensive commodities. Measures in the agricultural sector show the largest impact because in the baseline, expanding agricultural land is one of the largest drivers of biodiversity loss. The impact of forestry on the baseline loss is significantly smaller, and as a result there is less improvement from improved forest management.
Biodiversity loss can be reduced by expanding protected areas, mitigating climate change and reducing deforestation
The effectiveness of increasing protected areas depends on the level of ambition but also on the biodiversity indicators. On the global scale, the net MSA gain is limited unless the option is pushed to its extreme. In terms of the impact on naturalness (MSA), increasing protected areas in a region could lead to expansion of agricultural land in other areas in the same region, or even to a shift to other regions. However, if properly implemented, the measure may well be effective in preserving unique ecosystems. Climate change mitigation might prevent slightly more than 10% of the baseline biodiversity loss. This percentage may seem relatively low, but due to inertia in the climate system the difference in impact from the baseline is still limited in 2050. If climate policy is implemented by using bio-energy up to economic level and without additional policies to control negative side-effects, the net impacts are uncertain. The impact of bio-energy strongly depends on implementation, which could include using residues, more advanced bio-energy chains, and using degraded land areas. Nonetheless, risks for biodiversity are associated with high levels of bio-energy use. Finally, deforestation can be reduced for different reasons, such as emission reduction from deforestation as climate change mitigation measure. This would effectively help to maintain biological
Combination of Options*
Assumption Expanding protected areas for
biodiversity (1) and carbon stocks (2) (1) 20% of protected area (representing ecosystems and areas with threatened endemic species.
(2) 9% area covering carbon-rich vegetation. In total 29% in protected area. Improving agricultural productivity Rate of increase in yields 50% higher than in baseline (in OECD
countries to a maximum increase of 1.5% per year). Reducing agricultural losses Worldwide agricultural losses reduced from 20 to 13%. Changing diets to less meat Worldwide consumption patterns converge to 50% above the
consumption level suggested by the health oriented Willett diet.
Improving forest management Expansion of forest plantations meets 40-50% of timber demand by 2050. Remaining selective logging close to full use of reduced impact logging practices.
Mitigating climate change Long-term temperature change of 2 oC or 450 ppm CO 2 eq concentration (bio-energy grown only on abandoned land).
* Note that the implementation level of options can differ from what they were as individual options. This is reflected here by names not always identical to Table S.1
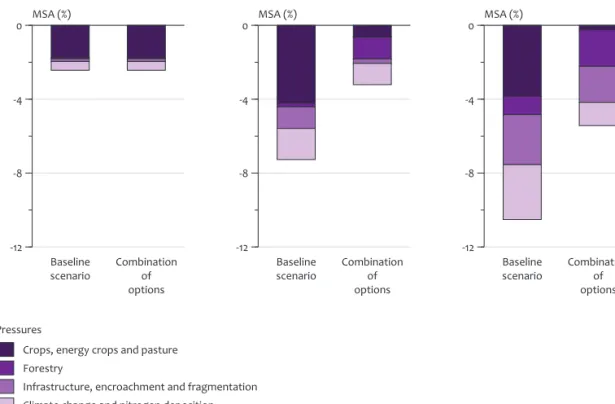
The combination of options would prevent half of the biodiversity loss (in MSA) estimated to occur by 2050 under Baseline conditions. Mitigated agriculture expansion and climate change are the important factors behind the reduced loss.
Figure S.3 Baseline scenario Combinationof options -12 -8 -4 0 MSA (%) Pressures
Crops, energy crops and pasture Forestry
Infrastructure, encroachment and fragmentation Climate change and nitrogen deposition
2000 – 2010
Pressures driving global biodiversity loss
Baseline scenario Combinationof options -12 -8 -4 0 MSA (%) 2000 – 2030 Baseline scenario Combinationof options -12 -8 -4 0 MSA (%) 2000 – 2050 quality of forests. However without accompanying policies, these measures run the
risk of shifting biodiversity impacts from forests to grassland ecosystems. In MSA terms, this ‘leakage’ reduces the overall effectiveness significantly.
Many studies point to strong interactions between reduction options For instance, an increase in agricultural productivity implies that less land is required to grow crops, and thus less global biodiversity loss. But less demand for agricultural land would reduce land prices and hence food prices. This, in turn, would make it easier to achieve development goals on hunger eradication. The net outcome is positive for both issues and for other issues such as climate change and eutrophication. The latter depends on the assumed improvement in nutrient-use efficiency as an integral part of enhanced agricultural technology and management. This would mean less pollution leading to eutrophication. As a rule, options that lead to less agricultural land use than in the baseline scenario have a downward effect on land and food prices. While they are bound to have a positive effect on biodiversity, availability of cheaper land makes alternative uses, such as energy crops, also more economical. Thus, the success of single options depends on additional measures to avoid counter-productive side effects.
The options promise co-benefits for climate change mitigation and food supply Several options were shown to have significant co-benefits. In addition to
preventing biodiversity loss, these options would benefit climate change mitigation and food supply. Reduced conversion of natural habitats keeps carbon stocks and uptake capacity intact, and a more efficient and less wasteful agriculture and food sector would contribute to more stable and affordable food supply, especially in developing countries.
The comprehensive, ‘ambitious yet feasible’ combination of options cuts biodiversity loss significantly and contributes to various other goals
Compared with the baseline scenario, the ‘ambitious yet feasible’ combination of seven options would halve the rate of loss in the MSA indicator between 2010 and 2050 (see Figure S.3).
In the combination of options, the natural area would increase by around 9.5 million km2 in 2050, concentrated in OECD countries, Central and South America and
Sub-Saharan Africa (see Figure S.4). The wilderness area would expand even slightly more, at 10.5 million km2 above the baseline, particularly in tropical, sub-tropical and
temperate biomes.
This ambitious combination of options cannot halt biodiversity loss altogether. One reason is that the negative direct and indirect effects of expanding infrastructure are virtually unchanged from the baseline, as they are assumed to be inextricably linked with a growing and increasingly wealthy population (see Figure S.3). Another reason is that ongoing climate change cannot be undone despite ambitious long-term goals. Even under the ambitious goal assumed, global temperature will continue to rise gradually and eventually reach a 2 °C increase on pre-industrial level.
The combination of options would prevent half of the biodiversity loss (in MSA) estimated to occur by 2050 under Baseline conditions. Mitigated agriculture expansion and climate change are the important factors behind the reduced loss.
Figure S.3 Baseline scenario Combinationof options -12 -8 -4 0 MSA (%) Pressures
Crops, energy crops and pasture Forestry
Infrastructure, encroachment and fragmentation Climate change and nitrogen deposition
2000 – 2010
Pressures driving global biodiversity loss
Baseline scenario Combinationof options -12 -8 -4 0 MSA (%) 2000 – 2030 Baseline scenario Combinationof options -12 -8 -4 0 MSA (%) 2000 – 2050
As a whole, the combination of options would make meaningful contributions to achieving policy goals on biodiversity, alleviating under-nourishment (higher food consumption in developing regions), and mitigating climate change (global temperature by 2050 up by 1.5 oC versus 2.3 oC in the baseline).
The combination of reduction options requires careful consideration
The combination of options includes some measures that increase the pressure of expanding human land use and some that relax the pressure through more efficient land use and consumption changes. The cumulative effect on land prices and on global food consumption from stepwise introduction of the first four options is presented in Figure S.5. Protecting more land for biodiversity and carbon sequestration limits the available land, increasing land prices and decreasing food consumption. The subsequent steps imply that less and less land is required to meet human needs, and hence land and food prices drop. Consumption would increase, and does so if agriculture becomes more efficient. In the last step of changing diets, consumption increases further in lower income regions. In higher income regions with high calorie intake and meat intensive diets, such as OECD
countries and China, net consumption in terms of calories decreases slightly with a less meat diet, which shows in the global total.
Note that direction and relative size of effects for the assumptions made here (see Table S.2) are more robust than absolute percentages and numbers.
The two remaining options, improving forestry management and mitigating climate
change are also bound to have implications for land prices and food consumption but this was not studied.
The overall positive picture does not say there are no trade-offs in the options combination, for example with bio-energy. As a rule, more efficient agricultural production reduces food prices making more food affordable for low income groups. The associated smaller area needed to grow food would reduce biodiversity loss because less natural land is used for production and abandoned agricultural land may gradually be restored to a more natural state. However, these conditions also favour production of bio-energy with otherwise negative implications for biodiversity. Reducing climate change always has a positive effect on natural ecosystems.
Food consumption increases with lower land prices as these lead to lower food prices. The opposite effect of the dietary change is caused by a reduction in calorie intake in regions with a high and meat intensive consumption (OECD, China).
Figure S.5
-20 -10 0 10 20 %
Stepwise introduction of options; Global land prices
-2 -1 0 1 2 %
Stepwise introduction of options; Global food consumption
Change in land prices and food consumption compared to baseline scenario, 2030
Protected areas
Protected areas plus agricultural productivity
Protected areas plus agricultural productivity plus reduced losses Protected areas plus agricultural productivity plus reduced losses plus dietary change
The distribution over regions and biomes shows that improvements over regional improve-ments and biomes are not uniform.
Figure S.4
-1 0 1 2 3 million km2 Combination of options;
Natural area per region
Boreal forest Temperate forest Tropical forest Grassland and steppe Scrubland and savannah Ice and tundra Desert -1 0 1 2 3 million km2 Combination of options;
Wilderness per biome
Change in natural area and wilderness compared to baseline scenario, 2050
OECD Central and South America Middle East and North Africa Sub-Saharan Africa Russia and Central Asia South Asia China region Figure S.4
The finding that options need to be combined is robust, but ranking the options in terms of effectiveness in preventing biodiversity loss should not be based on this study alone because this depends on the specific assumptions made.
Many fish populations are overexploited or depleted and future catches will be below maximum sustainable levels and of less commercial value.
Production from marine capture fisheries has been stagnant since the late 1980s, with an estimated 27% of fish populations overexploited. As a consequence, the effort needed to catch a given amount of fish is steadily increasing. The baseline assumes that the effort stays constant at the 2004 level for all fleets. The net result is a decline in yearly total catches from around 80 to 60 million tonnes by 2050. In high commercial value, large-fish population catches reduce by more than two thirds in most ocean areas. Capture fisheries will fall further below the increasing demand. Demand is estimated to rise from around 140 million tonnes in 2004 to almost 190 million tonnes by 2030, and to 227 million tonnes by 2050. The supply gap is assumed to be filled by a variety of aquaculture operations.
A drastic reduction in current wild catches would allow fish stocks to restore in order to support maximum sustainable yield levels. Stocks could recover over the Food consumption increases with lower land prices as these lead to lower food prices. The opposite effect of the dietary change is caused by a reduction in calorie intake in regions with a high and meat intensive consumption (OECD, China).
Figure S.5
-20 -10 0 10 20 %
Stepwise introduction of options; Global land prices
-2 -1 0 1 2 %
Stepwise introduction of options; Global food consumption
Change in land prices and food consumption compared to baseline scenario, 2030
Protected areas
Protected areas plus agricultural productivity
Protected areas plus agricultural productivity plus reduced losses Protected areas plus agricultural productivity plus reduced losses plus dietary change
The distribution over regions and biomes shows that improvements over regional improve-ments and biomes are not uniform.
Figure S.4
-1 0 1 2 3 million km2 Combination of options;
Natural area per region
Boreal forest Temperate forest Tropical forest Grassland and steppe Scrubland and savannah Ice and tundra Desert -1 0 1 2 3 million km2 Combination of options;
Wilderness per biome
Change in natural area and wilderness compared to baseline scenario, 2050
OECD Central and South America Middle East and North Africa Sub-Saharan Africa Russia and Central Asia South Asia China region Figure S.5
next 20 to 30 years and from then on support more than 30% increase in future catch volume. No further depletion of fish biodiversity is expected with a drastic reduction of fisheries effort, according to the marine depletion index of the EcoOcean model. In contrast, the depletion index declines by 40% from 2004 up to 2050 in the baseline. The temporarily wider gap between catches is assumed to be filled by stepping up aquaculture production. Whether or not such a production volume trend can be put into practice has not been investigated.
The feasibility of the reduction options warrants attention but is not covered in-depth in this study
When considering measures that would mitigate direct drivers of global biodiversity loss, attention to issues of governance and diverging interests could identify bottlenecks and areas where efforts could best be concentrated. Aspects to be considered include the technical feasibility, subject to regional differences. Next, attention needs to focus on whether there are built-in incentives in the form of direct benefits for the sector or stakeholders. Furthermore, consideration needs to be given to the extent to which interests coincide between the actors implementing the reduction option and other stakeholders, or whether these conflict.
Implications for a global biodiversity policy discussion Biodiversity targets and policies need to be framed by and mainstreamed into other policy domains
The well-established role of nature conservation and biodiversity protection policies and measures continues to be important, but should be complemented by other initiatives. Coordination with other policy fields can identify and pursue policies and measures with co-benefits. The risk of unintended side effects needs to be reduced as well as leakage and rebound effects that may undermine the effectiveness of the reduction options.
The future of biodiversity depends on structural and lasting improvements in production and consumption of goods and services
Biodiversity loss is the compound result of a range of external pressures from production and consumption of goods which need to become more ‘eco-efficient’ in terms of their pressures on the natural environment per unit of output. Besides efficiency gains, changes in consumption patterns of food and wood products also have major potential. Biodiversity concerns should be taken into account in policies and practices in the relevant sectors of agriculture, forestry, fishery, food processing and retailing, and energy. The notion that a variety of global concerns can be addressed while slowing down biodiversity loss is illustrated clearly in the combination of options.
Closer co-ordination between biodiversity policymakers and international bodies in other policy areas is essential for meaningful progress
International bodies in other priority areas include IPCC and UNFCCC (climate), FAO and UNFF (food, forestry) and WHO (health). For instance, biodiversity considerations could be included in selecting sites for reduced deforestation under a climate mitigation regime. Similar co-ordination initiatives on smaller scales
such as sub continent or country level would set helpful examples and facilitate international discussion.
A multi-option strategy with cross-sector measures is a promising way forward A well-designed combination of reduction options could not only slow down biodiversity loss but also contribute to a variety of human development issues. Moreover, a combined strategy implies initiatives in many sectors and human activities, which makes the final result less dependent on less-than-expected contribution from one or more of the reduction options.
Implementing options to protect biodiversity in 2050 needs to start now The analysis focuses in most cases on 2050. For the options to take full effect by that time, implementation should start much earlier. For instance, forest plantations take considerable time to grow. Similarly, climate mitigation measures take decades to make a significant impact on atmospheric concentration of greenhouse gases. The actual climate effects such as global mean temperature increase take even longer to unfold. Achieving widespread and large-scale increase in agricultural productivity takes time, but the anticipated positive and quick effect on biodiversity warrants early implementation. Early implementation is also vital because most of the projected agricultural expansion is expected to takes place in the next 30 years and opens a window of opportunity.
Short-term losses may be unavoidable in creating future gains
Short-term biodiversity losses are sometimes unavoidable in order to create future gains, for example establishing wood plantations on natural land with the prospect of reducing the impact of logging in larger near-natural forest areas. As for keeping agriculture expansion in check, action delayed until after 2030 will substantially increase the restoration challenge. Preventing losses is more efficient, and early action would also fit well with the agendas of other relevant policy fields. For instance, addressing food security, human health and development which are part of the Millennium Development Goals set for 2015. Keeping global temperature increase below 2 0C calls for concerted worldwide action to start early in the next decade.
Introduction
Background to the report
This report has been prepared at the request of the United Nations Environment Programme (UNEP) as a contribution to the project on ‘The Economics of Ecosystems and Biodiversity’ (TEEB). Its main objective is to identify options for reducing global biodiversity loss in the face of increasing food, wood and energy demands from a world population of 9 billion people, in 2050, and increasing pressures of infrastructure and climate change on the natural environment. The challenge is to reconcile human development issues with protection of the natural environment including biodiversity. The difficulty of the challenge is underlined by the third Global Biodiversity Outlook, which concluded that, by 2010, the rate of loss had not been significantly reduced at any level – globally, regionally or nationally. The insights of this study may contribute to the pursuance of the post-2010 targets as agreed upon in the tenth meeting of the Conference of the Parties of the Convention on Biological Diversity, in Nagoya, in 2010.
Four types of contributions
This report makes four types of contributions to the development of biodiversity policies. The first contribution consist of determining major and minor options for reducing global biodiversity loss. The loss resulting from various highly autonomous scenarios of socioeconomic development has been signalled in the Millennium Ecosystem Assessment (MA, 2005), the Global Environmental Outlooks (UNEP, 1997, 2002, 2007), the OECD Environmental Outlook to 2030 (OECD, 2008), and in the second and third Global Biodiversity Outlooks (sCBD, 2006; sCBD and PBL, 2007; sCBD, 2010). This report supplements these reports by specifically identifying alternative development pathways for economic sectors and consumption (options), which, potentially, could reduce biodiversity loss. The potential of eight options (Chapter 4) have been identified by testing each option against the strictly no-new-policies baseline scenario described in Chapter 3. The options have been derived from the recommendations made in the third Global Biodiversity Outlook (GBO3) and are linked closely with, and even primarily inspired by, policy fields other than biodiversity. These options include, among other things, increasing agricultural productivity, improving forest management, mitigating climate change, and reducing capture fisheries. Some variants have been elaborated to give an indication of the range of effects, for example, climate change mitigation with and without bio-energy intensive measures.
The second contribution is an analysis of the synergies, trade-offs and total effect of a combination of certain options implemented simultaneously (Chapter 5). To that end, a set of individual options was constructed and analysed, and each option
was set at an implementation level considered to be feasible but ambitious by the research team. The extent to which this combination of options could succeed in reducing biodiversity loss is an interesting and relevant result, but the combination should not be viewed as a final, optimal mix of policies. Further dialogue with policymakers is needed, in which region-specific scenarios and combinations of options are analysed.
The third contribution consists of biophysical input for economic analysis and valuation of ecosystem services. In 2008, the Netherlands Environmental
Assessment Agency (PBL) made a contribution to the project on ‘The Economics of Ecosystems and Biodiversity’ (TEEB) by modelling the change in global biodiversity up to 2050, in case no new policies would be set. The biophysical result served as input for the TEEB project. Using this input, a preliminary assessment was made of the economic consequences, as reported in ‘The Cost of Policy Inaction’ (Braat and ten Brink, 2008) and ‘The Economics of Ecosystems and Biodiversity, An interim report’ (European Communities, 2008). Contrary to that previous study, the change in global biodiversity under a situation of ‘Policy in Action’ has been modeled for this report. The results from this model-based analysis also served as input for UNEP project on The Economics of Ecosystems and Biodiversity. These economic findings have been reported separately and are not included in this report (Hussain et al., 2010; see also www.teebweb.org).
The fourth contribution is the indication of how pro-biodiversity policies relate to policies on climate change mitigation and energy production, agriculture, food production, Millennium Development Goals, food availability, and water quality (see Chapter 6). Competing claims on dwindling resources such as productive land, water and energy, confirm the fact that solutions can no longer be found in isolation. Because solutions in one field may impede the achievement of goals in other fields, coordination is required to reap mutual benefits in cases of conflicting interests.
An integrated modelling approach as requested by UNEP
This report was prepared at the request of the Executive Director of UNEP. The study was carried out by the Netherlands Environmental Assessment Agency (PBL), the Dutch Agricultural Economics Research Institute (WUR-LEI) and the Sea Around
Us Project of the Fisheries Centre, University of British Columbia, Canada, in the period from February to September 2010. Use of a series of interlinked models (LEITAP, IMAGE, TIMER, GLOBIO, EcoOcean and GISMO) has enabled a quantitative and integrated approach (Annex B). Estimates on biodiversity are presented in terms of indicators of ecosystem extent (natural area) and mean species abundance (MSA, see Chapter 2). These two indicators were derived from the CBD 2010 target indicators (CBD, decision VII/30). A third indicator of biodiversity is the remaining areas of wilderness and is defined as highly intact natural area. The impact on living marine resources is presented in terms of the Depletion Index (Chapter 2).
The results are presented for the period up to 2050, on a global scale as well as for seven terrestrial biomes and seven geo-political regions (Annex B). All options were compared with the no-new-policies baseline scenario of the OECD Environmental Outlook to 2030 (OECD, 2008), or with similar baseline scenarios (Chapter 3).
Giving the short time frame, this report was based mainly on existing analyses carried out for the fourth Global Environmental Outlook (UNEP, 2007), the OECD Environmental Outlook to 2030 (OECD, 2008), the International Assessment of Agricultural Knowledge, Science and Technology for Development (IAASTD, 2009), the second and third Global Biodiversity Outlooks (sCBD, 2006; sCBD and PBL, 2007; sCBD, 2010), together with ongoing modelling work at the PBL. The analysis required additional model runs, in order to assess the impacts per option, to capture additional functionality offered by more recent model versions, and to assess options not considered in earlier work. The particular combination of options was composed specifically for this study, and an updated baseline scenario was applied that includes the current economic crisis.
Framework and limitations of this study
For this study, we examined world biodiversity policies essentially as an issue of growing and competing resource use. Within this framework, the study homes in on ‘direct drivers of change’. This choice determined the scope of the study to search for pro-biodiversity options. The starting point of the analysis was the urgent need to significantly reduce the rate of biodiversity loss, and the consequences for specific regions if we fail to do so. This study does not predict the future, and has several limitations (Chapter 7). It does explore the technical potential for change, in certain sectors, aimed at reducing projected biodiversity loss. But it does not discuss the policy instruments, such as taxation, subsidies, regulation, and innovation, which could bring about these changes. The list of options is not exhaustive and use of existing studies and models largely determined the scenarios, options and indicators applied. The focus is on terrestrial ecosystems and, to a lesser extent, on marine and inland waters.
Much could and should still be explored. A follow up of the dialogue with policymakers could identify alternative development pathways, and other measures to bring these about. For more information on future analyses, used scenarios and regional results, please contact either the PBL at info@pbl.nl, or the corresponding author.
Assessing trends in
future biodiversity
2.1 Introduction
Biodiversity is a broad concept with many definitions and indicators to monitor biodiversity trends
The concept of biodiversity has many dimensions and different interpretations, which influence the way in which changes in biodiversity are measured. The definition most used is that of the Convention on Biological Diversity: ‘Biodiversity
is equal to the variability among living organisms from all sources, including, ‘inter alia’, terrestrial, marine, and other aquatic ecosystems, and the ecological complexes of which they are part: this includes diversity within species, between species and of ecosystems’ (CBD, 1992). Other aspects of biodiversity than variability are often also emphasized, such as the importance of naturalness. To some degree, the differences in interpretation relate to underlying reason to conserve biodiversity. This can arise from the intrinsic value of biodiversity based on an ethical conviction that biodiversity should be sustained in its own right. It may also come from the notion that biodiversity underpins many ecosystem services provided by nature such as climate regulation and water purification. Other reasons start from a precautionary principle, such as loss of biodiversity may reduce the resilience of ecosystems to convert suddenly to another configuration, passing a tipping point. The broadness of the biodiversity concept and the different interpretations imply that many different indicators have been used to measure biodiversity. While some indicators focus on species and emphasize the importance of retaining species richness at different geographical levels, other indicators focus on the extent and intactness of the original ecosystems. Yet other indicators focus on the drivers of biodiversity loss largely because these are easier to monitor. However, most indicators have been developed for small, well-known ecosystems and can generally not be applied at global level. At this level, indicators need aggregation over large areas, grouping together entirely different systems, but are hampered by insurmountable data gaps.
Biodiversity indicators can be structured
Biodiversity indicators can be structured using the list of indicator categories agreed upon by the CBD (Decisions VII/30 and VIII/15 made in Kuala Lumpur, 2004). Five of the categories listed are dedicated to the status and trends of the
components of biological diversity. These indicators looking into the state of biodiversity are:
1. Trends in the extent of selected biomes, ecosystems and habitats; 2. Trends in abundance and distribution of selected species; 3. Change in status of threatened species;
4. Trends in genetic diversity of domesticated animals, cultivated plants, and fish species of major socio-economic importance;
5. Coverage of protected areas.
A subset of these indicators can be produced for future scenarios on a global scale (for an overview, see Leadley et al., 2010). Some indicators, such as the main indicator used in the report (Mean Species Abundance), relate to several elements on the list, while there are also linkages between the different types of indicators. Some of the indicators used in global assessments are described below, including their strengths and weaknesses, and the relation to the purpose of this report to assess ex ante global biodiversity impacts of sector-based options in the future. Indicators for the extent of selected biomes, ecosystems and habitats
The most direct loss of biodiversity results from conversion of natural habitats to agricultural, plantation forestry or urban areas. This loss in habitat can be described by indicators showing the extent of selected biomes, ecosystems and
habitats. The extent of the remaining relatively undisturbed or non-converted area is a straightforward indicator (Sanderson et al., 2002). The extent of specific ecosystems, such as forests, mangrove and coral reefs are reported in several assessments (sCBD, 2010; MEA, 2005). These indicators are rather straightforward and easy to measure. However, they have the disadvantage that the extent of a system does not imply its quality. This is partly overcome by estimating wilderness areas (e.g., Mittermeier et al., 2002), which are defined as relatively untouched areas providing a high level of biodiversity. But the very distinction between wilderness and non-wilderness is difficult to determine.
Trends in abundance and distribution of selected species
Indicators to describe changes of species abundance focus mostly on a single or limited number of species groups (Butchart et al., 2010). Human activity generally decreases the abundance of many original species, and increases the abundance of a few opportunistic species. This decrease in species abundance may lead to local extinction and eventually after a long trajectory of deterioration, to extinction. Therefore, changes in species abundance and especially species in the original composition of ecosystems indicate changes in major aspects of biodiversity, such as the integrity or intactness of ecosystems. These changes are linked to local and global extinction of species (Majer and Beeston, 1996; Loh et al., 2005; Scholes and Biggs, 2005). Trends in species abundance are sensitive indicators and may also indicate processes, such as homogenisation (ten Brink et al., 1991, 2000; Lockwood and McKinney, 2001).
At global level, a more aggregated indicator using multiple species groups is used such as the Living Planet Index (Loh et al., 2005). These indicators have a high data requirement, and are not used in a modelled scenario context. Indicators designed for use in a scenario context are the Biodiversity Intactness Index (Scholes and
Biggs, 2005) and the Mean Species Abundance Index (Alkemade et al., 2009). These indices are based on estimates of the relative change in population size of species compared to undisturbed or intact ecosystems. This follows the notion that conserving intact ecosystems can also conserve the highest number of species in most cases. However, these indices have the disadvantage that they are based on generic estimates and thus can no longer be related to individual species. Change in status of threatened species and species richness
Indicators of species richness have often been applied as diversity indicators at the local level. However, while they relate directly to the concept of diversity, they tend to be relatively data insensitive and only signal once a species has disappeared. Even more important, species richness often increases as original species are gradually replaced by new, human-favoured species. This is called the intermediate disturbance diversity peak (Lockwood and McKinney, 2001), and may provide a misleading picture.
Related indicators have been developed that can also be applied on a more aggregated scale such as Species-Area relationships. For example, in the Millennium Ecosystem Assessment, extinction rates for vascular plants were estimated by using Species-Area relationships (MEA, 2005; van Vuuren et al., 2006). Alternatively extinction risks can be derived from estimates of the remaining suitable area for individual species (Thomas et al., 2004; Jetz et al., 2007).
An established index, the Red List Index summarises threats to species, and combines this with species sensitivities to these threats including risk of extinction. Red List indicators for several species groups are used in the Global Biodiversity Outlook 3 (sCBD, 2010). These lists are based on the knowledge of many experts and on monitoring of species trends. However, application of this index is not straightforward in a scenario context.
Trends in genetic diversity of domesticated animals, cultivated plants, and fish species of major socio-economic importance
One of the few set of indicators to measure this aspect of biodiversity, the GBO3 (sCBD, 2010) reports on risks to extinction of breeds of domestic animals. This index is similar to the Red List Index and has the same advantages and disadvantages. Unfortunately, as no indicator can be produced in the context of scenario analyses, we are not able to report on genetic diversity.
Coverage of protected areas / wilderness areas
Coverage of protected areas is a response indicator rather than a state indicator because one way to preserve biodiversity is protection. Several indicators have been proposed that measure level of protection, either by simply looking at the total (extent of protected areas) or the degree of coverage of key ecosystems (e.g., protection of biodiversity hotspots, minimum protection of unique biomes or protection of key bird areas). Key targets for protection are intact ecosystems and wilderness areas. Several indicators have been proposed that simply estimate the degree of wilderness areas globally (Mittermeier et al., 2002; Sanderson et al., 2002).