Rapport GTB-1002
T. Vermeulen
1, A.M.A. van der Linden
2, E.A. van Os
1(eds.)
1 Wageningen UR Greenhouse Horticulture 2 RIVM
Emissions of plant protection products
from glasshouses to surface water in
The Netherlands
© 2010 Wageningen, Wageningen UR Greenhouse Horticulture (Wageningen UR Glastuinbouw)
All rights reserved. No part of this publication may be reproduced, stored in a retrieval system or transmitted, in any form of by any means, electronic, mechanical, photocopying, recording or otherwise, without the prior written permission of Wageningen UR Greenhouse Horticulture.
Wageningen UR Greenhouse Horticulture
Adres : Violierenweg 1, 2665 MV Bleiswijk, the Netherlands: P.O. Box 20, 2665 ZG Bleiswijk, the Netherlands Tel. : +31 317 - 48 56 06
Fax : +31 10 - 522 51 93 E-mail : glastuinbouw@wur.nl Internet : www.glastuinbouw.wur.nl
Working Group:
T. Cuijpers (Hoogheemraadschap van Schieland en de Krimpenerwaard) J.F.M. Huijsmans (Wageningen UR Plant Research International) R. Kruijne (Wageningen UR Alterra)
A.M.A. van der Linden (RIVM)
R.J.M. Meijer (Wageningen UR Greenhouse Horticulture) E.A. van Os (Wageningen UR Greenhouse Horticulture) E.W.M. Roex (Deltares)
M. van der Staaij (Wageningen UR Greenhouse Horticulture) C. Stanghellini (Wageningen UR Greenhouse Horticulture) Y.J. Stienstra (Ctgb)
T. Vermeulen (Wageningen UR Greenhouse Horticulture) H.A. de Werd (Applied Plant Research – PPO)
Inhoudsopgave
Summary 1 1 Introduction 4 1.1 Background 4 1.2 Aims of project 5 1.3 Set-up of project 5 1.4 Summary Phase I: Orientation 6 2 Diversity in covered cropping systems 8 2.1 Brief overview of covered cropping systems 8 2.2 Watering systems 8 2.3 Emission routes 11 2.4 Discharge strategies 13 2.5 Summary of ordering principles 15 3 Identifying water fluxes 16 3.1 Flow charts for soilless systems 16 3.2 Flow charts for soil based systems 18 4 Quantifying water fluxes 19 4.1 Model WATERSTROMEN 19 4.2 Calculations for six model crops 21 4.3 Summarising 24 5 Substance Fate Modelling 25 5.1 Application with the nutrient solution 25 5.2 Application to the crop 27 5.3 Soil-bound cultivation 32 5.4 Results 33 6 Scenario Development 39 7 Conclusions and Recommendation 41 7.1 Conclusions 41 7.2 Recommendations 44 8 References 48 Appendix I. Glossary and abbreviations 50 Appendix II. Area of covered crops in hectares 52 Appendix III. Schemes of total emission routes from glasshouse cultivation systems 53 Appendix IV. Climatic years in WATERSTROMEN 54 Appendix V: Results quantifying water fluxes with the water balance model 55 Appendix VI Some sensitivity analyses 58 Appendix VII Listing of glasshouse substrate model 1 59 Appendix IX Listing of glasshouse substrate model 3 69Summary
In the current authorisation procedure for plant protection products (PPP) in the Netherlands, a fixed percentage of 0.1% is used for the emission of PPPs from covered crops to surface water. This percentage is based on estimates of emissions from glasshouses to surface water in the early 1980’s, and is independent of the type of glasshouse, the cropping sys-tem, the application method and the crop. The same emission percentage of 0.1% is also used by some other EU member states. For the emission from soil-bound covered crops to groundwater, the authorisation procedure is not different from the procedure for field crops, using a spring application scenario. However, specific scenarios for this assessment are missing. This report investigates whether new approaches would be required since monitoring data form water boards indicate that the emission of PPP and biocides from glasshouse horticulture to surface water may be higher than assumed in the authorisation procedure.
The following aims of the project were formulated:
1. Evaluate whether the current use of a fixed percentage (0.1%) in the authorisation procedure needs changes. 2. Gaining insight into, and describing the pathways and quantities of emissions of plant protection products and biocides
from different glasshouse cropping systems to surface water. Emissions to air are only to be considered as long as these influence emissions to surface water.
3. Develop an approach (tool) and scenarios for situations to use this insight for authorisation purposes. 4. Communicate the approach with international authorisation authorities.
Results
Since standardised data from glasshouse emissions were not sufficiently available, a modelled approach was taken. For this the production systems were categorised according to (1) substrate and (2) water flows/ water systems. For the soil bound system the PEARL-model is suggested. For soilless systems the water flows were modelled and accordingly the substance flows. Three application methods were distinguished: addition via water/substrate, plant treatment, fogging treatment. For the moment the smaller crops in terms of area are not considered (bulb forcing, chicory, mushrooms, small fruits)
Covered cropping systems were ordered by their system characteristics in terms of watering system:
Watering system Model crop
Soil-bound Sprinkler irrigation Chrysanthemum
Soilless:
Production on gullies Drip irrigation Cucumber, pepper, rose Production on benches/tables Ebb/flow Kalanchoe Production on the concrete floor Ebb/flow Ficus
For further analysis a major assumption was that the discharge strategy is based on Na+- accumulation, and occasional
Calculated extremes in emissions caused by differences in rainfall, sizes of water basin and [Na+] in the water source
for additional water, based on the chosen application scheme for PPPs for one example substance and one application scheme.
Fate model Calculated for model crop Low end of emission (% of application) High end of emission(% of application)
Application via nutrient solution cucumber 0.03 11
pepper 0.02 10
rose 0.11 16
Crop application by spraying cucumber 0.01 0.5
Crop application in ebb/flow system ficus 0.01 0.5
Situations are fictitious and differ per crop. The simulations used were aimed at testing the models and performing preliminary sensitivity analysis. The results therefore give insight into the order of magnitude of emissions, but can not be used as scenarios for evaluation purposes. For example, no calculations were made to analyse emissions as function of the moment of application and of discharge – though most extreme situations were avoided, and only a limited variety of water sources was used.
In authorisation procedures for plant protection products it is nowadays quite common to use realistic worst case envi-ronmental scenarios for the assessments. It seems logical to use such scenarios also for glasshouse horticulture in the Netherlands as well. The modelled approach indicates that emissions of PPP from substrate growing systems to surface water are highly influenced by the following scenario aspects:
• the cultivation system, soil-bound or soilless; • the application method of the PPP;
• the tolerance of a crop for Na+ ions;
• the Na-concentration in the water supplied to the crop (total sodium amount).
Based on these four aspects, the work group proposes to implement the following combinations in the authorisation procedure:
No. cultivation system Fate model (based on sodium tolerance level)Crop type
1 Soil bound PEARL
-2
Soilless
Application along with the nutrient solution
Low
3 Medium
4 High
5
Application to the crop canopy; with no direct exposure of the root compartment
Low
6 Medium
7 High
8
Application to the crop canopy; with direct exposure of the root compartment
Low
9 Medium
Conclusions
The results suggest that the 0.1 % is an underestimation of the actual emissions, and emission vary widely between watering systems and crops. Evaluation of emissions from glasshouses should therefore include differences in watering system and crop characteristics.
As a consequence of the used approach, the DegT50 of a substance in water is a prerequisite and therefore needs to be available in an authorisation dossier. DegT50s in water may be derived from, amongst other, transformation studies in water / sediment systems and hydrolysis studies. A DegT50 derived from transformation studies of the PPP in water / nutrient solutions, as used in covered cropping systems, would be preferable. However, such studies seem to be lacking at the moment. Likewise uptake of PPPs in the crop, and DegT50 in substrates and could be further investigated and used in the calculations.
1
Introduction
1.1
Background
1.1.1 Current state of regulation in The Netherlands
In the current authorisation procedure for plant protection products (PPP) in the Netherlands, a fixed percentage of 0.1% is used for the emission of PPPs from covered crops to surface water. An emission of 0.1% of the application rate is used to assess the risk for aquatic organisms. This percentage is based on estimates of emissions from glasshouses to surface water in the early 1980’s, and is independent of the type of glasshouse, the cropping system, the application method and the crop. The same emission percentage of 0.1% is also used by some other EU member states. For the emission from soil-bound covered crops to groundwater, the authorisation procedure is not different from the procedure for field crops. However, specific scenarios for this assessment are missing.
The legal framework for emission reduction in glasshouses in The Netherlands is laid down in the Regulation Glasshouse Horticulture (in Dutch, Besluit Glastuinbouw). This framework focuses on limiting the use of fertilisers by limiting N and P application rates to crops. Specific prescribed measures for reducing emissions are:
• Compulsory collection and use of the condensation water.
• Discharge of recirculation water is only allowed when the concentration of Na+ exceeds a threshold level. This level is
dependent on the crop, allowing for physiological differences.
• The use of high quality water sources to minimise the frequency of discharging recirculation water.
In the regulation the emission of PPPs is not specified as such, by virtue of the supposition that measures to reduce the emission of fertilisers will also result in reduced emissions of plant protection products.
1.1.2 Recent findings in surface water
Water boards frequently measure the occurrence of PPP and biocides in surface water near and in glasshouse horticul-tural areas. For example, Teunissen (2005) summarises the results for a number of glasshouse areas over the period 2000 - 2004. From these results is was concluded that concentrations of plant production products regularly exceed the Environmental Quality Standards for fresh surface water in glasshouse horticultural areas up tot 100 times. Results from water board Zuiderzeeland for 2006 and 2007 showed that 7 active ingredients exceed the standards in surface water (s.a., 2007). Water board Rijnland concluded in 2006 that the water quality problems in glasshouse areas have not changed significantly over the past three years. Extreme (up to thousands and even tens of thousands times the standard) and frequent standard exceedings still occur (Kesslerová, 2007). Most standard exceedings are caused by insecticides and acaricides, followed by fungicides. An overview of recent monitoring results can be found in the pesticides’ atlas (in Dutch: Bestrijdingsmiddelenatlas), which is an online tool that relates monitoring results to water quality standards and displays the results on maps (www.pesticidesatlas.nl).
According to these monitoring data, it is shown that the exceedings occur both in areas with older glasshouses and in newly developed glasshouse areas (Teunissen, 2005; Van der Wal et al., 2007), suggesting that replacement of glass-houses over time will not automatically solve the emission and water quality problems.
The monitoring data also indicate that the emission of PPP and biocides from glasshouse horticulture to surface water are likely to be higher than assumed in the current authorisation procedure.
1.2
Aims of project
The following aims of the project were formulated:
1. Evaluation of the current use of a fixed percentage (0.1%) in the authorisation procedure.
2. Gaining insight into, and describing the pathways and quantities of emissions of plant protection products and biocides from different glasshouse cropping systems to surface water. Emissions to air are only to be considered as long as they influence emissions to surface water.
3. Develop an approach (tool) and scenarios for situations to use this insight for authorisation purposes. 4. Communicate the approach with international authorisation authorities.
A working group of experts was installed in 2007 to carry out this project. The working group consisted of: T. Cuijpers (Hoogheemraadschap van Schieland en de Krimpenerwaard)
J.F.M. Huijsmans (Wageningen UR Plant Research International) R. Kruijne (Wageningen UR Alterra)
A.M.A. van der Linden (RIVM)
R.J.M. Meijer (Wageningen UR Greenhouse Horticulture) E.A. van Os (Wageningen UR Greenhouse Horticulture) E.W.M. Roex (Deltares)
M. van der Staaij (Wageningen UR Greenhouse Horticulture) C. Stanghellini (Wageningen UR Greenhouse Horticulture) Y.J. Stienstra (Ctgb)
T. Vermeulen (Wageningen UR Greenhouse Horticulture) H.A. de Werd (Applied Plant Research – PPO Lisse)
1.3
Set-up of project
The Working Group uses the following approach to reach the aims of the project:
Phase I Orientation - The working group started with inventories of cropping systems and emission routes, and suggested some clustering to come to workable schemes for further quantitative analyses (Paragraph 1.4 and Cuijpers et al., 2008).
Phase II Scenario Development – ordering of diversity in systems and techniques, developing models for water flow and PPP flow, and developing scenarios for authorisation purposes.
Phase III Tool building – translating models and scenarios to a workable tool for authorisation purposes.
This report covers the findings of Phase II of the project. A summary of the findings of Phase I is given in Paragraph 1.4. The results will be used by:
• The Working Group Exposure Water Organisms for further calculations of concentrations in surface water. • The ministries of LNV, VROM and V&W for communication with stakeholders.
• The ministries of LNV, VROM and V&W for the implementation in pesticide authorisation procedures. The legal context of the project is given by:
• EU Directive 91/414.
1.3.1 Readers’ guide
This report covers Phase II of the project: model and scenario development.
Through a number of inventories and interviews the diversity in covered cropping systems was analysed. This led to in-sight into the diversity in technical systems, emission routes and discharge strategies (Chapter 2). This diversity was then clustered and ordered to describe model systems for further analyses (Chapter 2). The two principal systems (soil-bound and soilless) were further analysed for their general water flows (Chapter 3). Using the WATERSTROMEN model (Chapter 4.1), the water fluxes for different model crops were calculated using climatic and system variation (Chapter 4.2). These calculated water fluxes were then introduced in the model for SUBSTANCE FATE to calculate emissions (Chapter 5). First steps for creating scenarios for registration purposes are presented in Chapter 6. Chapter 7 presents conclusions and recommendations.
1.4
Summary Phase I: Orientation
Table 1.1 Summary of the findings of Phase I of the project. This phase involved a number of items, leading to key‑insights for the remainder of the study:
Item Result Key – insight
Availability of data on emissions There are few data on emissions from covered cropping systems
Data on emissions are too limited for quantitative analyses of emission routes. A modelling approach is needed. Existing date can possibly be used to qualitatively check the models.
Overview of cropping systems
A classification of the different cropping systems seems possible. Ordering principles would be:
• Substrate versus soil-bound production • Volumes of water flows
Overview of application methods
A classification of the different application methods seems possible. The ordering principle would be (for substrate systems):
• applying plant protection product via the substrate (water supply) versus crop application by spraying or fogging
Theoretical emission routes from covered cropping systems
Schemes of emission routes (also presented in this report: par 2.3)
Routes need to be prioritised/ranked according to their contribution to the total emission to focus the working group’s effort.
Water flow in cropping systems
A water flow model exists (Bezemer and Voogt, 2008) for the purpose of water and nutrient management in covered cropping systems
The water flow model quantifies water fluxes on a daily basis and this seems detailed enough to quantify the emissions of PPP from covered cropping systems
Substance flow
A preliminary model was developed to understand basic processes of degradation over time in different system reservoirs.
It seems possible to quantify the emissions of plant protection products from substrate cropping systems by coupling a pesticide fate model to the water flow model.
The PEARL model (Tiktak et al., 2000; Leistra et al., 2001) seems adequate to model leaching from soil-bound production systems. It is however necessary to develop scenarios for covered cropping systems.
The following approach was adopted for the remainder of the project:
• Categorise production systems according to (1) substrate and (2) water flows/ water systems.
• Design a tool for authorisation purposes based on a model for water flows and a model for substance flows. • Models should cover three application methods: addition via water/substrate, plant treatment, fogging treatment • Use the PEARL-model for soil-bound production systems – create scenarios for climate and ‘rain fall’ for glasshouses. • For the moment the smaller crops in terms of area are not considered (bulb forcing, chicory, mushrooms, small fruits)
2
Diversity in covered cropping systems
2.1
Brief overview of covered cropping systems
EFSA distinguishes several construction types which are used in the cultivation of covered crops (Stanghellini, 2009; van der Linden, 2009). The most important construction type in the Netherlands falls in the category Glasshouse. An overview of the area of different types of covered crops is given in the following table (CBS, 2009).
Table 2.1 Areas occupied by covered crops in the Netherlands (CBS, 2009).
Soil-bound cultivation (glasshouses) 2.306 ha Soilless cultivation (glasshouses) 6.716 ha
Plastic cover “umbrella” 1.350 ha (all small fruits – including uncovered production as well) Temporary plastic tunnels 500 ha (rough estimate of ‘summer flowers’ with seasonal use of tunnels) Permanent plastic tunnels 62 ha (strawberries)
Cells (bulbs) 20 ha
Mushrooms 77 ha
Cells (chicory) 7 ha
The working group focussed on the glasshouse cultivation because it covers the vast majority of the covered crop area. Other cropping systems were not considered in detail.
2.2
Watering systems
Within the construction type of Glasshouses, the cropping systems and watering systems vary highly. Systems differ in technical dimensions, substrate types, water supply and climate control. Over the years a number of principles have become more generally adopted. Some of these principles can be used for clustering for the purpose of understanding the emission routes in these ‘classes’ of cropping systems. This classification is based on the differences in the watering system. We used the following principles for ordering:
Table 2.2 Ordering of covered cropping systems by their system characteristics.
Watering system
Soil-bound Sprinkler irrigation
Soilless:
Production on gullies Drip irrigation Production on benches/tables Ebb/flow Production on the concrete floor Ebb/flow
Table 2.3 Types of covered cropping systems and the area of use.
cropping system most important crops area 2007 (ha) (CBS, 2009)
soil cultivation lettuce, radish, chrysanthemums, freesia, alstroemeria, lysianthus, amaryllis, berries, summer flowers, organic vegetable farming
vegetables: 740 (100 ha organic)
flowers: 1566
production on substrate tomato, pepper, cucumber, aubergine, courgette, rose, gerbera, anthurium, bulb forcing, strawberry
vegetables: 3310 flowers: 863
ebb/flow irrigation on tables or
concrete floors pot plants and orchids (no further distinction given in current surveys) pot plants: 2543
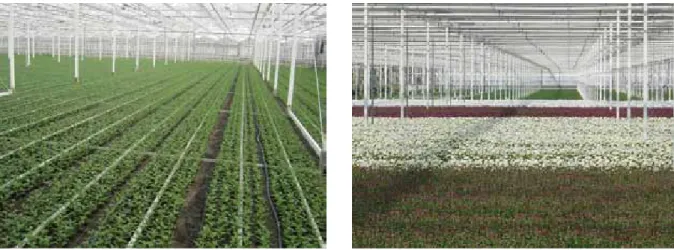
Appendix II gives an overview of areas of the most important crops and the development over the last years. The following figures give an impression of the different systems.
Figure 2.1 Soil bound production: Chrysanthemums just planted (left) and shortly before harvest (right)
Figure 2.2a Drip irrigation on substrate: Substrate slabs, lying on gullies to recirculate the surplus solution. Left cucumber on perlite and right sweet pepper on rockwool.
Figure 2.2b Drip irrigation on substrate: Rose production in an “arch‑system”.
Figure 2.3 Ebb‑flow irrigation on tables: kalanchoe
2.3
Emission routes
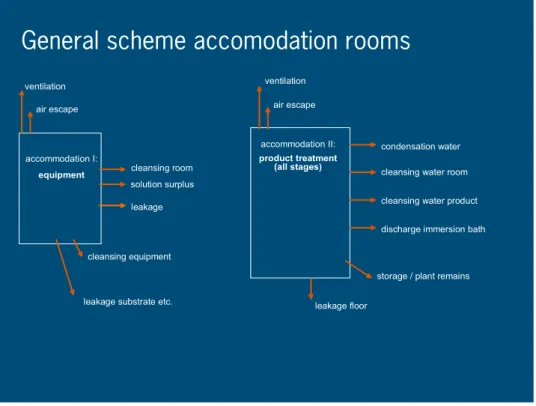
All theoretically possible emission routes to air, soil, groundwater and surface water were recorded (Cuijpers et al., 2008). A general overview of emission routes in the production unit is given in Figure 2.5 and of the accommodation unit in Figure 2.6.
Figure 2.5 Theoretical emission routes from a covered crop system – the production unit
Figure 2.6: Theoretical emission routes from a covered crop system – the accommodation unit
General scheme accomodation rooms
leakage accommodation I: equipment accommodation II: product treatment (all stages) cleansing equipment solution surplusleakage substrate etc.
cleansing water product condensation water cleansing water room
storage / plant remains leakage floor cleansing room ventilation air escape ventilation air escape
discharge immersion bath
recirculation tank
basin
soil / root treatment fogging
waste water cleansing
leakage
wash off
filter rinsing water discharge drift leakage leaching ventilation first flush forced ventilation drainage water (substrate drain) recirculation water condensation water crop treatment drainage water
General emission scheme production rooms
lateral drainage cleansing discharge of recirculation water to sewage system discharge of recirculation water to surface water ground waterThe emission routes may vary in importance between the different production systems. The most significant differences between glasshouse systems would be the leaching to groundwater for soil bound production and the different levels of recirculation and discharge. These differences are quantified in Chapters 4 and 5. Appendix III gives the emission routes for the two production systems: substrate based and soil bound cultivation.
2.3.1 Ordering principle for emission routes
The theoretical emission routes may differ strongly with respect to their contribution to total emission. For the soilless cropping systems selection criteria were established to further focus the effort of the working group. Quantifying and modelling all routes would simply be too laborious for the time given, while understanding the main emission routes was likely to yield insight into the larger part of the total emission.
Since emission of plant protection products from the glasshouse to surface water was assumed to follow water fluxes (Phase I, Cuijpers et al., 2008), the order of magnitude of water flows could be used as a guiding principle for ordering the emission routes. Table 2.4 gives the order of magnitude of the cumulative water flows. Using this simplification, the effect of concentration differences in the water system and in emission routes were not used as ordering principles. The selection of emission routes for further analyses included the following considerations:
1. The emission routes from accommodation units were not considered. Current legislation on construction of these units, cleaning and use of excess product seem to marginalise these emission routes (Besluit Glastuinbouw). 2. Drift emission from glasshouses to surface water is considered negligible, due to compulsory precautionary measures
during and shortly after application.
3. Soil-based cropping systems are considered via the PEARL-model.
Table 2.4: Ranking emission routes by their water flow (non‑soil based cropping systems)
1. discharge of recirculation water: expected highest contributor to total emission*
2. condensation water – if not re-used: 1000 m3 ha-1**
3. discharge of filter water: 250 m3 ha-1***
4. leakage – 1.5 % of water supply: 150 m3 ha-1***
5. end of year discharge (vegetables): 60 - 80 m3 ha-1*
6. wash off at end of year clean up: 10 m3 ha-1
7. overspill from rain water basin (after First Flush) ****
Figures give an indication of the order of magnitude rather than a set volume. * see paragraph 2.4, ** 1 L/m2 on 100 days / year, *** estimates model WATERSTROMEN, **** not considered in context of this report
Based on the above overview and considerations, the working group focused on the following emission routes for soilless cropping systems:
- discharge of recirculation water; - discharge of filter water;
2.4
Discharge strategies
Discharge water is expected to be the main route of emissions from non-soil based cropping systems. However, an ad-equate inventory of water discharge quantities is not available. Only recently some studies tried to quantify discharges by surveying discharges at the farm level (Cuijpers, pers. com. Kruger, 2008). These studies were hampered by inadequate definitions of emission types and differences in awareness on leaching and discharge at the growers’ level. The results indicate that discharge volumes vary from approximately 25 to over 3000 m3 per ha per year. An approximation of the 90th
percentile water discharge is 1500 – 2000 m3 ha-1 yr-1, for both ornamentals and vegetables grown on soilless cultivation
systems. These data provide an indication of the range of discharge and should not be used for further analysis.
2.4.1 Principles of discharge strategies
Discharges are a means to steer the nutrition balance of the recirculation water. The main reason for imbalance is the ac-cumulation of non-nutrients in the recirculation water. A quantifiable parameter for this imbalance, used as legally accepted reason for discharge, is the Na+-level in the recirculation water (Sonneveld and Voogt, 2009). Scientific attention however
has shifted towards other, yet undefined, growth-hampering substances (De Kreij et al. 2004; Van Os et al., 2004); pers. comm. Bram van der Maas) and growers may also use other steering parameters for discharging recirculation water. Other reasons for discharge such as mistakes in management, unforeseen happenings like system failures in the distri-bution unit or damages were not taken into account in the analyses. The working group has decided to use the current understanding on Na+ as the leading principle for discharge.
Na+ is not, or only marginally, taken up by the plants and, therefore if present in supply water, it accumulates in the
recir-culation water. Since Na+ is only a contamination in the commercial fertilizers currently used at very low level, almost all
Na+ will only enter the system along with the water. Water may be obtained from different sources. Indications on the Na+
contents of different water sources are:
- Condensation water ([Na+] ~0 mmol dm-3). Due to transpiration of the crop and by outside air cooled glass panels there
is condensation on the glass. The collection and reuse of condensation water is compulsory.
- Rainwater ([Na+] ~0 - 0.2 mmol dm-3). Along the sea coast rainwater may contain some sodium. The size of the tanks
or basins varies between 500 m3 ha-1 (minimum commitment by legislation, Besluit Glastuinbouw) to about
3000 m3 ha-1. Dependent on the size of the tanks rainwater may cover a large part and even up to 100% of the water
need at a nursery. It can be imagined that long dry periods empty the tanks and lead to the need of using additional water. As those dry periods cannot be forecasted an additional source is always available. During long wet periods the basin may get completely filled and surplus rainwater discharges directly into the surface water. In some cases the surplus water can be stored in deeper aquifers (20 - 70 m deep).
- Reversed osmosis water (RO; [Na+] ~0 - 0.2 mmol dm-3). Nowadays the most important additional water source.
Mostly groundwater is pumped up, filtered and desalinated by membranes. The brine (about 50%) is pumped back in the (same) groundwater layer.
- Well water ([Na+] ~0 - >>5 mmol dm-3). Cheap water, but in the western part of The Netherlands mostly of poor quality
because of high salt contents (brackish water). In the eastern part quality is much better and is often used instead of or in addition to rainwater.
- Surface water ([Na+] ~1 - > 5 mmol dm-3). Availability is mostly good, but quality is poor. It often contains a too high
salt concentration and moreover, besides PPP and pathogens also soluble organic matter, and therefore it needs intensive purification before use.
- Tap water ([Na+] ~1.8 mmol dm-3). Quantity is not a problem, but quality for hydroponically grown plants is poor. Tap
To reduce Na+ accumulation growers will preferably use water sources with low Na+ levels.
The tolerance for Na+ or Cl- as well as the specific effects on production or produce quality differs among crops. As a
re-sult of many years of salinity research, maximum acceptable Na+ concentrations, or threshold values for the root
environ-ment are defined for each crop (Sonneveld and Voogt , 2009). Above these values the risk of yield decrease or reduction of produce quality becomes significant. From these values, Na+ concentrations are defined (legal Na levels), which are
legally accepted as levels above which discharge is allowed. These legal Na levels are generally lower than the threshold values (Besluit Glastuinbouw,2002). At the same time, the capacity of crops to absorb Na+ differs greatly. In terms of
water fluxes this can be expressed as uptake concentration in mmol l-1. This uptake concentration is highly positively
cor-related with the ambient concentration in the root environment (Voogt and Sonneveld, 1996). So obviously the highest Na uptake is realized at the legal Na levels. Consequently crop specific maximum acceptable Na+ concentrations for water
sources were defined (Voogt, 2009)
When Na+ concentration rises different strategies can be adopted to keep the Na+ concentration below critical levels.
These strategies may range from daily discharge of small quantities to a number of larger discharges throughout the year (Figure 2.7).
Figure 2.7 Strategy of discharge, see explanation below.
Explanation of Fig. 2.7: for rose two figures are presented to show discharge of water with nutrients from the closed, recirculating system. In the left figure, the X‑axis gives the time during one year, while the Y1‑axis gives the contents of the rainwater basin in m3, the Y2‑axis is precipitation in mm. In the right figure, the X‑axis is the same as right , while the
Y1‑axis gives the [Na+] in the recirculating solution and the Y2‑axis the discharge in m3 ha‑1.
In January, water from the rainwater basin is used as the only supply (left figure purple line). Rainwater is assumed not to contain Na+ (figure right, red line). In February, it rains (left figure blue line), and the basin is filled to its – for this example
– maximal capacity of 500 m3. In March there is little rain, so the basin is empty by early April. At this moment additional
water is supplemented. The additional water is tap water with 1.8 mmol dm‑3 Na+. [Na+] soon reaches the threshold level of
4 mmol dm‑3 for rose (right figure red line). The triangles show the moments and quantities of discharge. Upon discharge
the [Na+] drops, but because of the high water uptake of crop and the little uptake of [Na+] by the crop, [Na+] rises again to
a level of 4 mmol dm‑3 followed by discharge. At the end of June there is substantial rainfall, the basin is filled up again and
less additional water is needed. In July and August extra (tap)water is needed again, resulting in a number of discharges. In October the rainfall increases, the water use of the crop reduces and the basin is filled again. From that moment there is no need for additional water. With rainwater as the only water source discharge of recirculation water is not needed anymore.
Filling off rainwater basin and precipitation
0 100 200 300 400 500 600 0-1 9-4 18-7 26-10 3-2 0 200 400 600 800 1000 1200 m3 mm filling rainfall 0.0 1.0 2.0 3.0 4.0 5.0 6.0 1-1 31-1 1-3 31-3 30-4 30-5 29-6 29-7 28-8 27-9 27-10 26-11 26-12 N a m m ol /l 0 5 10 15 20 di sc ha rg e in m 3/ ha [Na] in solution moments of discharge
2.5
Summary of ordering principles
Accordingly, we selected and ordered the total scope of emissions from glasshouse cultivation along the following line: 1. Cultivation system: focus limited to glasshouse production
2. Ordering of watering systems: soil bound, drip irrigation, ebb/flow on tables and ebb/flow on floors 3. Focus on emission routes: system discharge, filter cleaning and leakage
4. Discharge strategy based on Na+- accumulation
5. Discharge: occasional discharge of bigger volumes (as opposed to more or less continuous discharge of smaller volumes)
Based on these ordering decisions we continued with identifying water fluxes (Chapter 3), quantifying water fluxes for a number of model crops (Chapter 4) and modelled substance fate (Chapter 5).
3
Identifying water fluxes
For building understanding on emission routes and for modelling purposes the diversity described in Chapter 2 was simpli-fied by focusing on water routes generally present in covered cropping systems and developing flow charts of these. The proposed schemes are based on interviews with growers and installers.
3.1
Flow charts for soilless systems
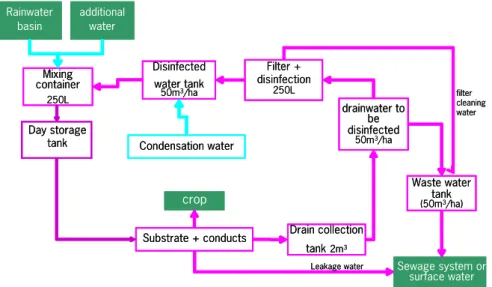
Water fluxes in glasshouses are a result of the construction of the glasshouse, the set-up of the growing system, the crop, management decisions of the grower and the availability of water sources of good quality In detail all production systems are different, but overall there is much similarity. For crops grown on substrates, there is a general scheme for water fluxes (Figure 3.1). Rainwater from the roofs is collected in tanks or basins and used for watering the crop. Before use it is mixed with fertilisers and often pumped into a daily storage tank. From there it is pumped to the plants and flows via the substrate and conducts. Plants take up water and nutrients, the surplus flows, by gravity, to the drain water collection tank. From there it is pumped to the workroom to be filtered and disinfected. After disinfection it is stored in a so-called “clean water tank”. The “clean water tank” is the buffer for making a new solution mix with rainwater and nutrients to be pumped to the plants again. If there is not enough water available in the basin, an additional water source is used. For this, there are a number of sources such as tap water, surface water, well water and reversed osmosis water (see Chapter 2). Such additional water sources are called ‘supply water’. Another water source is the condensation at the glasshouse construction. Condensation water is collected from the inner side of the glass panels and flows directly into the “clean water tank”. Outgoing water fluxes are the uptake by the crop and evaporation, leakage out of the system, discharge of drain water and the filter cleaning water which flows into the waste water tank. This waste water tank is only used in glass-houses that discharge into a sewage system. When a sewage system is not available discharge can take place directly into the surface water.
In practice water systems can vary on the following aspects: • Type of filter (sand filter or alternative (usually smaller)); • Volume of waste water tank (here 50 m3 ha-1);
• Volume of basin: 500 m³/ha (compulsory minimum) to approximately 3000 m³/ha; • Type of disinfector (UV, heat, ozone, slow sand filtration);
• Substrate and conducts (drip irrigation or ebb-flow, type of substrate, volume of substrate, etc.)
Figure 3.1: Scheme of water fluxes for closed soilless cropping systems.
Substrate + conducts Sewage system or surface water Mixing container 250L crop Filter + disinfection 250L drainwater to be disinfected 50m3/ha Rainwater basin Condensation water Disinfected water tank 50m3/ha Waste water tank (50m3/ha) filter cleaning water Leakage water Drain collection tank2m3 additional water Day storage tank Substrate + conducts Sewage system or surface water Mixing container 250L crop Filter + disinfection 250L drainwater to be disinfected 50m3/ha Rainwater basin Condensation water Disinfected water tank 50m3/ha Waste water tank (50m3/ha) filter cleaning water Leakage water Drain collection tank2m3 additional water Day storage tank
In the above-mentioned cycle of water and nutrients Plant Protection Products are not mentioned. PPP are introduced for specific reasons at specific places and specific moments in time. A limited number of PPP is directly introduced in the mixing container (Figure 3.2) to treat pathogens in the root zone or for uptake by plant roots (systemic substances). The major part of PPP is introduced by spraying the crop or treating the production room (Figure 3.3).
Figure 3.2 Application of PPP to root zones in non‑soil based systems (substrate), (between brackets the assumed volumes (m3) per hectare).
Figure 3.3 Application of PPP to the canopy in non‑soil based systems (substrate), (between brackets the assumed volumes (m3) per hectare).
substrate and conducts (125) sewage system or surface water mixing tank (0.25) crop filter (0.125) water to be disinfected (50) Version 10/06/2009 basin condensation water (c. 0.5) disinfected water tank (50) wastewater tank (50) filter cleaning water leakage Flows Reservoirs water substance water & substance internal external PPP daily stock tank (50) drainwater tank (2) disinfector (0.125) Reservoir volumes in m3ha-1 substrate and conducts (125) sewage system or surface water mixing tank (0.25) crop filter (0.125) water to be disinfected (50) Version 10/06/2009 basin condensation water (c. 0.5) and greenhouse air (50 000) disinfected water tank (50) wastewater tank (50) filter cleaning water leakage daily stock tank (50) drainwater tank (2) disinfector (0.125) PPP canopy greenhouse floor air
Figure 3.4 Rainwater collection tanks or basins are mainly located outside, but all other storage tanks stand inside the glasshouse. At the right picture at the foreground the disinfection installation (UV radiation) and the blue rapid sand filter. The tanks at the background are for collecting water to be disinfected “dirty water tank” (right) and for waste water to be emitted to the sewage system.
3.2
Flow charts for soil based systems
For the soil grown crop chrysanthemum the scheme as given in Figure 3.5 applies. The nutrient solution for the plants in the production unit is being prepared in the accommodation unit. In this unit different water fluxes (recirculation water, condensation water, fresh water from the basin or other sources) are being collected and prepared for use in the produc-tion unit. Plant protecproduc-tion products used as a root treatment may be added to the nutrient soluproduc-tion and applied together with the irrigation water. Plant protection products used as aerial and crop treatments are being applied in the production unit by different application methods. Also soil treatment (injection, incorporation) may occur.
Figure 3.5 Scheme of water fluxes in a soil‑bound system. Part of the leaching water may end up in groundwater rather than surface water.
soil Surface water Mixing container 250L
crop
Rainwater basin Condensation water storage tank50m3/ha drainage water additional water Day storage tank soil Surface water Mixing container 250Lcrop
Rainwater basin Condensation water storage tank50m3/ha drainage water additional water Day storage tank soil Surface water Mixing container 250Lcrop
Rainwater basin Condensation water storage tank50m3/ha drainage water additional water Day storage tank4
Quantifying water fluxes
Water flux calculations were made using the model WATERSTROMEN. Six model crops were selected (see Chapter 4.2) to calculate the water fluxes.
4.1
Model WATERSTROMEN
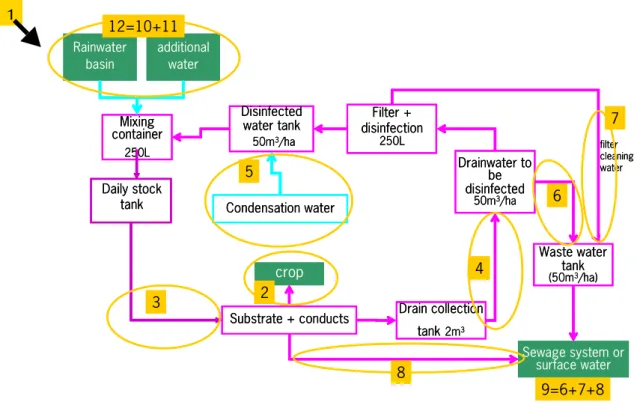
Based on the water fluxes shown in Figure3.1 and 3.5 the Model WATERSTROMEN (Bezemer & Voogt, 2008, W.Voogt, WUR Greenhouse Horticulture, see frame) was used to quantify the fluxes. The model calculates water fluxes, numbered 1 – 12 in Figure 4.1, on a daily basis. Appendix 5 summarises the water fluxes for a full growing season.
Figure 4.1 Relation between calculated fluxes (Appendix V) and identified fluxes in a closed soilless system.
Ad. 1: Precipitation and filling of the rainwater basin.
Ad. 2: Transpiration of the crop, based on models using the type of crop, plant size, solar radiation, radiation of assimilation lighting and heating energy as main parameters (De Graaf, 1988; Voogt et al., 2000)). Ad. 3: Water supply to the plants.
Ad. 4: Surplus of water which is not taken up by the plants flows via conducts to a drain collection tank from which it is pumped into a large tank to be disinfected.
Ad. 5: During the year, depending on the outside climate, water vapour condensates at the glass panels of the glass house. This water is collected and reused for irrigation.
Ad. 6: Dependent on the sodium concentration in the nutrient solution it is permitted to discharge a certain amount of solution to a sewage system or surface water. Dependent on the Water Board, a maximum discharge flux to the sewage system is allowed, for which reason a buffer tank (waste water tank) may be installed.
Ad. 7: Filter cleaning is needed after a certain amount of solution has passed the filter. The filter cleaning usually happens automatically, for example based on pressure build-up in the filter system. The cleaning water, (order of magnitude 1% of the total volume through the filter), emits to a sewage system or the surface water.
Substrate + conducts Sewage system or surface water Mixing container 250L crop Filter + disinfection 250L Drainwater to be disinfected 50m3/ha Rainwater basin Condensation water Disinfected water tank 50m3/ha Waste water tank (50m3/ha) filter cleaning water Leakage water Drain collection tank2m3 additional water Daily stock tank 12=10+11 9=6+7+8 3 5 4 8 6 7 2 Substrate + conducts Sewage system or surface water Mixing container 250L crop Filter + disinfection 250L Drainwater to be disinfected 50m3/ha Rainwater basin Condensation water Disinfected water tank 50m3/ha Waste water tank (50m3/ha) filter cleaning water Leakage water Drain collection tank2m3 additional water Daily stock tank 12=10+11 9=6+7+8 3 5 4 8 6 7 2
1
Ad 8: The leakage water is caused by an imperfect technical system and is estimated as a fixed percentage of the water supply (default 1.5%). The flow disappears as a diffuse emission into the soil.
Ad 9: = 6+7+8
Ad 10: the total amount of rainwater
Ad 11: the total amount of additional water (tap water, reversed osmosis water, surface water or groundwater) Ad 12: = 10+11: total amount of external water
The following figure gives some insight into the effect of light and temperature on evaporation and condensation (Figure 4.2) Model WATERSTROMEN, version 5.3
W. Voogt
The model WATERSTROMEN estimates the ingoing and outgoing water flows at a commercial nursery during a year or a growing cycle of a crop. The model uses the crop transpiration model of de Graaf (1988) with some modifications by Voogt et al. (2000) and parameters to simulate the water uptake for crop growth. Climate data such as temperature, the sum of radiation and precipitation as well as related greenhouse climate data are used as input.
A number of parameters are used to calculate the various water fluxes on a daily basis. The volume of the rain water collection is a fundamental parameter, because rainwater is used as the primary water source. The chosen year is a variable and can be selected from a database of measured weather data at Naaldwijk (official KNMI weather station). The ten most important greenhouse crops can be selected, amongst them tomato, sweet pepper, cucumber, rose and gerbera. For each crop some crop specific parameter values need to be chosen (day/night temperature, intensity and duration of artificial lighting, sodium threshold value, specific sodium uptake). Other parameter values to be chosen are: sources of additional water with their sodium concentration, the water supply / water uptake ratio, drain fraction, fraction of leakage and filter cleaning water, system values, etc.
As a result of the mentioned input data the model WATERSTROMEN calculates per day the amount of used rainwater, additional water and condensation water. Further the crop uptake, the required amount of discharge of the nutrient solution, resulting from Na+ accumulation above the threshold value and amounts of leakage and filter cleaning water
are calculated.
Besides water fluxes also flows and emissions N, P and other elements can be estimated. As all parameters can be easily changed, the model can be adapted to specific situations.
transpiration and water uptake
0.00 1.00 2.00 3.00 4.00 5.00 6.00 7-12 6-1 5-2 6-3 5-4 55- 4-6 4-7 3-8 2-9 2-10 1-11 1-12 31 -1 2 30 -1 m m /d ay
Verdamping straling Verdampoing stoken Verdamping assimilatie Verdamping totaal Wateropname totaal
transpiration by heating transpiration total transpiration by radiation
transpiration by assimilation water uptake total
0.0 20.0 40.0 60.0 80.0 100.0 120.0 1-1 31-1 1-3 31-3 30-4 30-5 29-6 29-7 28-8 27-9 27-10 26-11 26-12 m 3/ et m aa l Regenw ater Condensw ater Leidingw ater rainwater use condensation water tap water
Figure 4.2 Transpiration and water supply.
Explanation: The same crop (rose) and year is used as
in Figure 2.1. Crops in a glasshouse evaporate because of sun radiation (upper figure blue line). Transpiration is caused by solar radiation (upper figure dark blue line), by heating (upper figure pink line) or assimilation lighting (upper figure yellow line); total evaporation is given by the green line. Besides, there is a small quantity of water absorbed for growth (not shown), resulting in a total water uptake by the crop (purple line). The lower figure gives the total water use by the crop divided over the different water sources. In winter condensation water can supply most of the water needed. In spring and fall the rainwater is sufficiently available, while throughout the summer rainwater and tap water is used. In these months there is only limited condensation water. The wide fluctuations in water use are caused by differences in radiation (overcast versus bright sunny days).
4.2
Calculations for six model crops
For the six model crops the water balance was calculated. We used both fixed and variable parameters to calculate water fluxes in covered cropping systems and the sensitivity of the model to changes in the systems. Fixed parameters are crop-dependent, where variable parameters are system variables.
Fixed parameters per crop: - area for calculations: 1 ha
- transpiration model: different per crop
- [Na+] threshold value: crop tolerance for sodium
- Na+ uptake at maximum sodium level
Variable parameters
- year: wet, dry, warm, cold or average year;
- size of rainwater tank: 500, 1500 and 3000 m3 ha-1;
- Na+ concentration: rainwater has a standard figure of 0 mmol Na per litre, but additional water has been set at
1.8 mmol dm-3 (tap water) or 0.1 mmol dm-3 for reversed osmosis;
- presence or level of artificial light;
- heating strategy: level of heating is important for transpiration and growth.
The calculations are summarised in Appendix V. Here tables per crop are presented showing the model results with vary-ing parameters in m3 per hectare per year. Each line in the table (a varying parameter) is the total amount for the growing
season. Daily figures are not presented but used as input for the emission estimations (Chapter 5).
4.2.1 Crop characteristics
Six model crops were selected for each of the water systems (see Table 4.1). The crops were selected for their relevance to Dutch horticulture in terms of hectares.
Table 4.1 Selected model crops for the different water systems
Watering system Selected crop
soil bound sprinkler irrigation chrysanthemum
soilless:
production on gullies drip irrigation cucumber, rose, sweet pepper production on benches/tables ebb/flow kalanchoe
production on a profiled concrete floor ebb/flow ficus
As the discharge to the sewage system or surface water is highly dependent on the sodium concentration in the supply wa-ter, specific data per crop about the sodium threshold value (Besluit Glastuinbouw, 2002) and the uptake at the maximum sodium level are presented in Table 4.2. The water uptake differs widely between these model crops (Figure 4.3). Kalan-choe and ficus are year round growing crops. Light intensity is highly controlled by screens. Sweet pepper, cucumber and chrysanthemum have a similar water uptake. The uptake of water by rose however, is much higher, which is caused by the year-round use of artificial light and high temperatures and the absence of a period without production. Sweet pepper and cucumber have a crop cycle of about 11 months and in the 12th month the glasshouse is emptied, cleaned and replanted.
Table 4.2: Crop specific sodium threshold values, legal acceptable values and maximum uptake values at the threshold values (Voogt and Sonneveld, 1996; Besluit Glastuinbouw 2002)
crop threshold value (mmol dm-3) Legal Na levels uptake at maximum [Na] (mmol dm-3)
cucumber 8 6 1 sweet pepper 6 6 0.5 – 0.11 rose 4 4 < 0.1 kalanchoe 1 4 0.1 ficus 5 4 0.1 chrysanthemum 8 * < 0.1
1 apparent difference between vegetative and generative crop development stage
* not defined for soil grown crops
4.2.2 Climate
The water uptake does not vary much with changes in the outside climates (Figure 4.3), since the inside climate is highly regulated and, consequently, the variations per day are highly compensated during the overall year. Characteristics of the climate in that specific year are described in Appendix III.
Figure 4.3: Water uptake by the crop in relation to outside climate conditions. Dry/cold, wet and warm are specifications of a specific climatic year (Appendix III). Additional conditions: rainwater basis 1500 m3 ha‑1, [Na+] in
rainwater 0 mmol dm‑3 and in additional water 1.8 mmol dm‑3.
Calculation of the amounts of discharge in the same specified years shows another view (Figure 4.4). First there is a clear distinction between soilless crops and the soil-bound crop chrysanthemum. The latter does not have any recirculation and, consequently, the differences between the climatic years are similar to crop uptake (Figure 4.3). Differences between specified years are mainly influenced by the availability of rainwater. In a dry year there is less precipitation (496 mm, Appendix IV) than in a wet year (1091 mm) and, consequently, more supply water (of less quality ([Na+] = 1.8 mmol dm-3))
needs to be used. The absolute level of discharge highly depends on the sodium threshold level as given in Table 4.2. 0 2000 4000 6000 8000 10000 12000
cucumber sweet pepper rose phaleanopsis ficus chrysanthemum
m
3/
ha
.y
r
Figure 4.4: Discharge of water in relation to outside climate conditions. Dry/cold, wet and warm are specifications of a specific climatic year (Appendix III). Additional conditions: rainwater basin 1500 m3 ha‑1, [Na+] in rainwater
0 mmol dm‑3 and in additional water 1.8 mmol dm‑3.
Values shown in Table 4.3 give an indication of the reduced water discharge if a grower differs from the standard starting points. In principle it can be said that if a crop is grown either with less light or with less heat there will be a reduction in the water discharged to sewage system or surface water.
Table 4.3: Relation between water discharge (m3) and lower heat or light levels*.
* Additional conditions: rainwater basin 1500 m3 ha‑1, [Na+] in rainwater 0 mmol dm‑3 and in additional water
1.8 mmol dm‑3, – means that calculation has not been performed.
4.2.3 Size of rainwater basin and type of supply water
Rainwater is in most cases the best quality supply water available. Following legislation (Besluit Glastuinbouw, 2002) a minimum basin size of 500 m3 ha-1 is compulsory if a better quality source is not available. Growers are most interested
to have a larger basin, but for a number of reasons this is not always possible (space, ground price). If the size is not sufficient to cover the water need of a crop additional supply water is needed. The worst case is to use tap water with a Na+ contents varying between 1.5 and 2.5 mmol dm-3. As a number of drinking water companies in the horticultural area
deliver tap water with a [Na+] of 1.8 mmol dm-3 this concentration has been chosen for the calculations. In Table 4.4 an
overview is given of the amounts of discharge in relation to the size of the rainwater basin, in wet and dry years. 0 500 1000 1500 2000 2500
cucumber sweet pepper rose phaleanopsis ficus chrysanthemum
m
3/
ha
.y
r
Dry/Cold Wet Warm
standard less heat less light
cucumber 700 660 480 sweet pepper 860 -- --rose 2052 1936 1705 kalanchoe 0 0 --ficus 220 140 --chrysanthemum 1726 --
--Table 4.4: Relation between amount of discharge in different climatic years and the size of the rainwater basin*.
*Additional conditions: [Na+] in rainwater 0 mmol dm‑3 and in additional water 1.8 mmol dm‑3.
In general it can be seen that a larger basin reduces the amount of discharge. In a few cases a size of 1500 m3 ha-1 is
sufficient to reduce the discharge to zero, but for some crops a basin of 3000 m3 ha-1 is not yet sufficient to come to
a zero discharge throughout the years. As high sodium levels may also reduce product quantity and/or quality growers tend to use ‘cleaner’ water sources. In the last few years the use of reversed osmosis; [Na+] varying between 0 and 0.3
mmol dm-3 has become popular as an additional source of good quality water.
4.3 Summarising
Parameters with greatest impact on total discharge are (order without regard to importance): 1) crop characteristics for water uptake and Na+-sensitivity, 2) rainfall, 3) temperature and light settings in the glasshouse, and 4) the size of rain
water basin in combination with the source of supply water.
year 500 1500 3000
cucumber dry 940 860 300
wet 400 140 0
sweet pepper dry 1260 860 300
wet 500 100 0 rose dry 2619 2052 1166 wet 963 417 0 kalanchoe dry 4516 0 0 wet 0 0 0 ficus dry 780 220 0 wet 40 0 0 chrysanthemum dry 1726 1726 1726 wet 1732 1732 1732
5
Substance Fate Modelling
As described earlier (Chapter 2) the major part of covered cropping systems in the Netherlands is substrate cultivation. Application of plant protection products in such systems may be according to one of three possibilities, 1) application with the nutrient solution, 2 plant or crop treatment (spraying), and 3) treatment of the glasshouse air compartment (fogging or fumigation). The last two possibilities can be combined into one scenario, but with two variants dependent on the possible direct exposure of the root compartment. The first possibility also needs two variants, one for inert substrate and one for substrates interacting with the PPP. It is however assumed that application of PPP at the nutrient solution is of minor importance in ebb/flow systems, so interaction with the substrate is neglected. About 25% of the area is however still soil bound and obviously an additional scenario is necessary for soil bound cultivations. This chapter describes the concepts of the approach adopted for each of the scenarios.
5.1 Application with the nutrient solution
Figure 3.2 gives a schematic representation of a substrate cultivation system. In practice several variants of the system occur and also volumes may be different. For the development of the substance fate model it was assumed that the Daily Stock Tank is not installed and water, nutrients and PPP directly flow from the mixing tank to the substrate compartment. This assumption was done for practical reasons, to circumvent incorporating time delays in the computer code.
5.1.1 Model concepts
water flows
The water requirements of the system are described in Chapter 4.
The following results of the water model WATERSTROMEN, on a daily basis, are used as input to the substance model: • the water uptake by the crop;
• the amount of condensation;
• the discharge of the water to be disinfected to the waste water tank. All other water flows are derived from these three water flows on the basis of: • a water balance for each tank;
• a fixed relation with one of the three given water flows;
• a constant flow rate to a sewage treatment plant according to permit stipulations, when applicable;
• constant volumes of cultivation tank (cult), drain water tank (dwt), filter (fi), disinfection tank (dinf) and mixing tank (mt); and
• maximum volumes of water-to-be-disinfected tank (used water tank, uwt) and clean water tank (cwt).
In case uwt and cwt are not fully loaded, the water flow out of the tank is zero unless according to the input file water is discharged.
The disposal of water to a sewage system is usually limited to a maximum rate as laid down in permits or prescribed by district water boards. The maximum disposal rate is based on the capacity of the sewage system. Values of 12 - 24 m3
d-1 for the discharge are quite common. The discharge to surface water is often not limited.
Temperature
The model allows input of the temperature from a file. For the moment, glasshouse temperature is assumed constant over the growing season, with a daily fluctuation of a few degrees Celsius according to a sine function. Minimum temperature is at 6 o’clock in the morning. It is assumed that the temperature in the cultivation compartment (cult + dwt) is 2 degrees above the temperature in the storage room (mt, uwt, wwt, fi, dinf, cwt).