The ConsExpo Spray Model
Modeling and experimental validation of the inhalation
exposure of consumers to aerosols from spray
cans and trigger sprays
Report 320104005/2009 J.E. Delmaar | H.J. Bremmer
RIVM Report 320104005/2009
The ConsExpo spray model
Modelling and experimental validation of the inhalation exposure of
consumers to aerosols from spray cans and trigger sprays
J.E. Delmaar H.J. Bremmer
Contact: J.E. Delmaar
Centre for Substances and Integrated Risk Assessment christiaan.delmaar@rivm.nl
This investigation has been performed by order and for the account of the Food and Consumer Products Safety Authority (VWA), within the framework of 320104, Risk Assessment for the Consumer
© RIVM 2009
Parts of this publication may be reproduced, provided acknowledgement is given to the 'National Institute for Public Health and the Environment', along with the title and year of publication.
Abstract
The ConsExpo spray model
The National Institute for Public Health and the Environment (RIVM) has commissioned research on the exposure characteristics of propellant sprays and trigger sprays. The results have been used to improve the ConsExpo spray model. This model calculates the human exposure that arises following the use of propellant sprays and trigger sprays. ConsExpo is a computer program that is used
internationally to assess the exposure of consumers to substances in consumer products. The program includes several models that simulate the exposure and uptake of substances through the skin, mouth and by inhalation.
The validation of models based on experimental research is essential to improve the reliability of the exposure assessment. To validate the spray model, RIVM commissioned the research institute TNO to conduct experiments on sprays. The research was funded by the Dutch Food and Consumer Product Safety Authority (VWA).
Several characteristics of spray products determine the level of exposure. The most important of these are the mass generation rate of the emitted product, and the size of the generated particles. In the research, these characteristics were determined for 23 spray cans and trigger sprays. Subsequently, the exposure of 9 of these products was simulated during use. To this end, the sprays were used in a sealed room, and over a certain period of time the air concentrations and particle sizes were monitored at different positions in the room.
Key words:
Rapport in het kort
Het spuitmodel in ConsExpo
Het RIVM heeft onderzoek laten uitvoeren waarmee het ConsExpo-spuitmodel is verbeterd. Dit model berekent in welke mate de mens blootstaat aan deeltjes na gebruik van spuitbussen en pompverstuivers. ConsExpo is een internationaal gebruikt computerprogramma waarmee de blootstelling van mensen aan stoffen in consumentenproducten kan worden geschat. Het programma bevat meerdere modellen die de blootstelling en de opname van stoffen via de huid, de mond en via inhalatie beschrijven. Validatie van modellen met behulp van meetgegevens is noodzakelijk om de betrouwbaarheid van de blootstellingsschatting te verbeteren. Voor de validatie van het spuitmodel heeft het RIVM
experimenten aan spuitbussen laten uitvoeren door TNO. Het onderzoek is uitgevoerd in opdracht van de Voedsel en Waren Autoriteit (VWA).
Meerdere eigenschappen van spuitproducten bepalen de mate van blootstelling. De belangrijkste zijn de hoeveelheid materiaal die per tijdseenheid wordt uitgestoten en de grootte van de deeltjes die hierbij vrijkomen. In het onderzoek zijn deze karakteristieken voor 23 spuitbussen en pompverstuivers bepaald. Vervolgens is de blootstelling aan 9 producten tijdens gebruik gesimuleerd. Hiervoor is in een afgesloten kamer met deze spuitbussen en pompverstuivers gespoten. Vervolgens zijn gedurende een bepaalde tijd op verschillende plaatsen in de ruimte de hoeveelheid en de grootte van de aanwezige deeltjes gemeten.
Trefwoorden:
Contents
Summary 9
Samenvatting 11 1 Introduction 13 1.1. General 13 1.2 Critical spray product parameters 14 2 Experiments on the product parameters and air concentrations 15 2.1 Product selection 15 2.2 Description of the measurement equipment 15 2.3 Mass generation rate 16 2.4 Particle size distributions 18 2.4.1 Measurement method 18 2.4.2 Results 18 2.5 Aerosol concentrations after spraying 20 2.5.1 Measurement method 20 2.5.2 Results 23 3 Exposure model 29 3.1 Dispersion 29 3.2 Evaporation 29 3.3 Gravitational settling 32 3.4 Exposure model 34 4 Model versus experiment 37 5 Default product parameters and application in the ConsExpo program 43 5.1 Simulation the experiments with default values 53 6 Conclusions 61 References 63 Appendix 1: Description of the measurement equipment 65 Appendix 2: Aerosol size distributions in time 67
Summary
ConsExpo is a computer program to assess the exposure of humans to chemical substances in consumer products.
ConsExpo combines data on the consumer products and mathematical exposure models. The implemented models describe the exposure and uptake of chemicals via skin, through inhalation and oral contact in different situations.
This report describes a research that was conducted to develop and validate an improved model of the exposure to chemicals in aerosol particles from spray cans and trigger sprays.
For 23 products important exposure parameters were determined such as the emitted amount of material per second and the sizes of the particles that these products generate.
With a more limited selection of 9 products additional research was conducted.
In a climate test chamber the exposure during use was simulated. The particle concentrations and sizes were monitored at six different positions in the room air in the course of time.
The results of these measurements have been used to develop a new model that describes the inhalation exposure of humans to chemicals in the emitted aerosol particles.
The model uses data on the chemical formulation of the product, the initial particle size distribution and the mode of use of the spray (targeting a surface, as an air space, or aimed directly at a person). The model describes the deposition of particles under gravity and the removal by ventilation of the room. Other important processes such as dispersion of the aerosol particle cloud and the evaporation of solvents have only been included in a simplified manner.
The model predictions showed a good agreement with the time profiles of measured concentrations in the experiments.
Samenvatting
ConsExpo is een computermodel om de blootstelling aan stoffen uit consumentenproducten en de opname daarvan door de mens te kunnen schatten en beoordelen. Consexpo is opgebouwd uit gegevens over het gebruik van producten en uit mathematische concentratiemodellen. Het betreft relatief simpele modellen die voor verschillende situaties de inhalatoire, de dermale en de orale blootstelling en opname beschrijven.
In dit rapport is onderzoek beschreven om het model dat de inhalatoire blootstelling aan aerosoldeeltjes uit spuitbussen en triggerspray’s beschrijft, te verbeteren en te valideren.
Van 23 spuitbussen en triggerspray’s werden de vormingssnelheid en de initiële
deeltjesgrootteverdeling gemeten. Met een selectie van 9 producten is vervolgonderzoek uitgevoerd. In een klimaatkamer werden de producten verspoten op een manier die overeenkomt het gebruik in de praktijk. Op een zestal plaatsen in de ruimte zijn de concentratie en de grootte van de gevormde aerosoldeeltjes in de tijd bepaald.
Op grond van de resultaten van de metingen is een nieuw spuitmodel ontwikkeld dat de inhalatoire blootstelling aan aerosoldeeltjes bij spuiten met spuitbussen en triggerspray’s beschrijft.
Het model gaat, naast de samenstelling van het product, uit van de initiële deeltjesgrootteverdeling, de vormingssnelheid en de manier van spuiten (op een oppervlak of in de ruimte; naar de gebruiker toe of van de gebruiker af). In het model wordt rekening gehouden met de dispersie van de aerosolwolk, de verdamping van stoffen uit de gevormde aerosoldeeltjes, de depositie van deeltjes door de
zwaartekracht en de ventilatie in de ruimte.
De gemeten concentraties van de aerosoldeeltjes in de tijd in de klimaatkamer en de waarden, berekend met het nieuwe spuitmodel, komen goed overeen.
1 Introduction
1.1. General
Consumers are daily exposed to chemical substances (chemicals) that are released from consumer products such as cosmetics, paints, cleaning products, pesticides. The ways in which exposure takes place vary largely. Consumers may inhale evaporated substances such as solvents from paints, they may absorb chemicals from products that are applied to the skin such as cosmetic creams, or they may ingest chemicals that migrate from a product that is mouthed (for instance a teething ring).
Direct measurements of exposures resulting from product use are scarce. To assess the risks associated with the use of consumer products the assessor often has to revert to the use of models to estimate the exposure levels arising in the use of a specific product. RIVM has developed a computer program, ConsExpo, that implements a set of exposure models that can be used to estimate the exposure of consumers to chemicals from consumer products. The program contains models for inhalation, dermal and oral routes of exposure having various degrees of complication, ranging from simple, screening level to more advanced, mechanistic models (Delmaar et al., 2004).
One potentially important pathway of exposure is the inhalation of respirable aerosol particles that are generated during the use of spray cans and trigger sprays. Adverse effects resulting from the inhalation of insecticides, perfumes and hair sprays in sensitive subgroups have been described, although these could not all be positively related to the inhalation of the aerosol particles (Kumar et al., 1995; Schluetter et al., 1979; Shim and Williams, 1986; Salome et al., 2000). Incidents after inhalation exposure to waterproofing and sealing sprays in the Netherlands, Switzerland, Japan and Germany have demonstrated the potential severe risks associated with exposure of consumers to inhalable aerosols from spray products (Van Velzen et al., 2004; BFR)
To assess the severity of potential health risks associated with these exposures and to evaluate the effectiveness of risk reduction measures, a reliable estimate of the magnitude of the exposure is needed. To this end good quality data on the processes and factors determining the exposure are required. These factors are diverse and include physical and chemical properties of the product and the chemical of concern, the behaviour of the consumer, and characteristics of the indoor environment. Data on many of these factors are scarce.
The aim of this study was to collect data on spray product properties that are essential for performing generalizable and reliable exposure assessments for consumers of these products. To establish the relationship between these data and the inhalation exposures, air concentrations arising under controlled conditions, simulating typical use of the sprays were also determined for a set of spray products. Based on these experiments a new ConsExpo model was developed. This model describes the inhalation exposure to non-volatile substances that are released as particulates from spray cans and trigger sprays.
The experimental part of the study was conducted in 2004 in collaboration with TNO Rijswijk. The study is described in detail in (Tuinman, 2004) The results are presented in chapter 2.
The model that has been developed on basis of these experiments is described in chapter 3. How the model performs in describing the experimental data is discussed in chapter 4.
In chapter 5 measurements are described for the mass generation rate and the initial particle size distribution for different spray product groups. From these data, default values for the initial particle size distribution and mass generation rate are derived for the different spray product groups. Using these default values for the spray product parameters the ConsExpo program was used to simulate the experiments in the climate chamber.
1.2 Critical spray product parameters
Inhalation exposure to aerosol particles from spray products is determined by a variety of factors. Some of these relate to the behaviour of the exposed persons and the conditions under which the product is used, others relate to the physical properties of the product.
Among the first are factors such as the ventilation rate of the room, how long persons will be present during or after spraying, the way the product is used, et cetera.
The study described in this report focuses on the physical properties of spray cans and trigger spray that drive the exposure. These include:
• the mass released per unit time during spraying • the size of the particles of the sprayed product
The particle size is an important determinant of the exposure for two reasons:
First, the size of the aerosol particle strongly influences the rate at which particles are removed from the air (and thus are not longer available for inhalation). And second, the size determines the degree of inhalability of the aerosol particles. Of specific importance are the aerosol particles that have a potential to penetrate into the lower (unciliated) airways (referred to as ‘respirable’ particles). This group is limited to aerosol particles with aerodynamic diameters smaller than about 10 µm (European Committe for Standardization, 1993; De Winter and Cassee, 2002)
The size of the produced aerosol varies from product to product. It depends on factors such as
composition of the product, and type of spray container (e.g. whether a propellant or mechanical force is used to drive out the product, the nozzle of the spray container et cetera.).
Spray containers can be divided into two classes: spray cans, which use the expansion of a pre-pressurized propellant gas to drive out the aerosol, and pump and trigger sprays, which operate by means of mechanical force.
Large differences in exposure are expected between these types of sprays and hence products of both types have been included in the research.
2 Experiments on the product parameters and air
concentrations
The experiments described in this report consisted of two phases. In the first phase, important determinants of the aerosol exposure from spray products were measured for a number of spray cans and trigger sprays. These included the size distributions of the generated aerosols and the amount of mass generated per unit time during spraying.
In the second phase, air concentrations arising during typical use of the spray were monitored under well defined and controlled conditions for a selection of these sprays.
2.1 Product selection
In selecting the spray cans and trigger sprays to be used for the experiments for the first phase care was taken to include a wide variety of consumer products. Products chosen included cosmetics, cleaning products, paints, but a special interest was in pesticides in view of their importance as potentially hazardous products.
Selected products included both spray cans and trigger sprays. However, since spray cans generally produce smaller aerosols and are therefore potentially more important as a source of inhalation exposure, these formed the larger portion of the selection.
In addition, in making the product selection, attention was paid to the way the product should be used, as this is anticipated to be an important determinant of exposure. A number of use categories was defined. Sprays from all these use categories were selected for the experiments.
The following use categories were distinguished:
1) air space: the product is sprayed into the air (i.e. flying insect sprays, toilet fresheners) 2) surface: the product is used to target a surface or spot (i.e. crack and crevice, on a plant) 3) toward person: the product is sprayed directly toward a person. (i.e. hair spray, deodorant) The selected products are presented in the first column of Table 1 in section 2.3.
2.2 Description of the measurement equipment
In the determination of aerosol sizes and aerosol air concentrations, three instruments were used: • Mastersizer S
• APS • ELPI
each with specific ranges of aerosol sizes that can be measured. Below, short descriptions of these instruments are given. For a more detailed description of these instruments the reader is referred to Appendix 1.
The Mastersizer S
This instrument derives the size distribution of an aerosol from the scattering profile of a sample that is placed in a HeNe laser beam. The instrument can measure particle diameters over a range of 0.5 to 900 µm.
The Aerodynamic Particle Sizer: APS
The instrument determines the aerodynamic diameter (the diameter, assuming that the particle is solid and has a spherical shape) of particles from the speed with which they adapt to changes in air flow velocity. The range of particle diameters that can be measured is from 0.3 µm to 20 µm.
Electrical low pressure impactor: ELPI
An impactor is a classic device for separating airborne particles into different size classes based on their inertia. ELPI is capable of measuring aerosol sizes from about 0.05 µm to 10 µm.
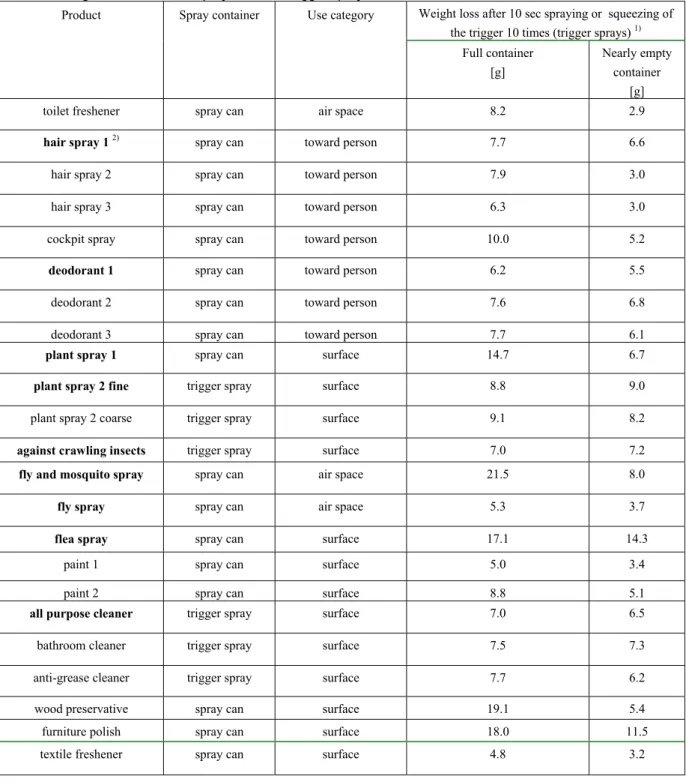
2.3 Mass generation rate
For 23 sprays selected for the experiments, the mass generation rate was determined by spraying for 10 seconds (spray cans) or squeezing 10 times (trigger spray; squeezing 10 times take approximately 6 seconds) and determining the weight loss of the spray. To get insight into the variation of the mass generation rate during the lifetime of the product the weight loss was determined for two cases: when the spray container was full and when it was nearly empty. The selected sprays and their mass generation rates are given in Table 1.
Table 1: Mass generation rates of spray cans and trigger sprays.
Weight loss after 10 sec spraying or squeezing of the trigger 10 times (trigger sprays) 1)
Product Spray container Use category
Full container [g]
Nearly empty container
[g]
toilet freshener spray can air space 8.2 2.9
hair spray 1 2) spray can toward person 7.7 6.6
hair spray 2 spray can toward person 7.9 3.0
hair spray 3 spray can toward person 6.3 3.0
cockpit spray spray can toward person 10.0 5.2
deodorant 1 spray can toward person 6.2 5.5
deodorant 2 spray can toward person 7.6 6.8
deodorant 3 spray can toward person 7.7 6.1
plant spray 1 spray can surface 14.7 6.7
plant spray 2 fine trigger spray surface 8.8 9.0
plant spray 2 coarse trigger spray surface 9.1 8.2
against crawling insects trigger spray surface 7.0 7.2
fly and mosquito spray spray can air space 21.5 8.0
fly spray spray can air space 5.3 3.7
flea spray spray can surface 17.1 14.3
paint 1 spray can surface 5.0 3.4
paint 2 spray can surface 8.8 5.1
all purpose cleaner trigger spray surface 7.0 6.5
bathroom cleaner trigger spray surface 7.5 7.3
anti-grease cleaner trigger spray surface 7.7 6.2
wood preservative spray can surface 19.1 5.4
furniture polish spray can surface 18.0 11.5
textile freshener spray can surface 4.8 3.2
1) Ten squeezes of the trigger take approximately 6 seconds
2.4 Particle size distributions
2.4.1 Measurement method
The measurements of the particle size distributions as emitted by the spray products were performed using the Mastersizer S.
The spray cans were activated in bursts of approximately 3 seconds with 3 second intervals. The trigger sprays were sprayed by pumping with a frequency of 10 times per 6 seconds. The distance between the nozzle of the spray can and the centre of the Mastersizer laser beam was kept fixed at 30 cm.
2.4.2 Results
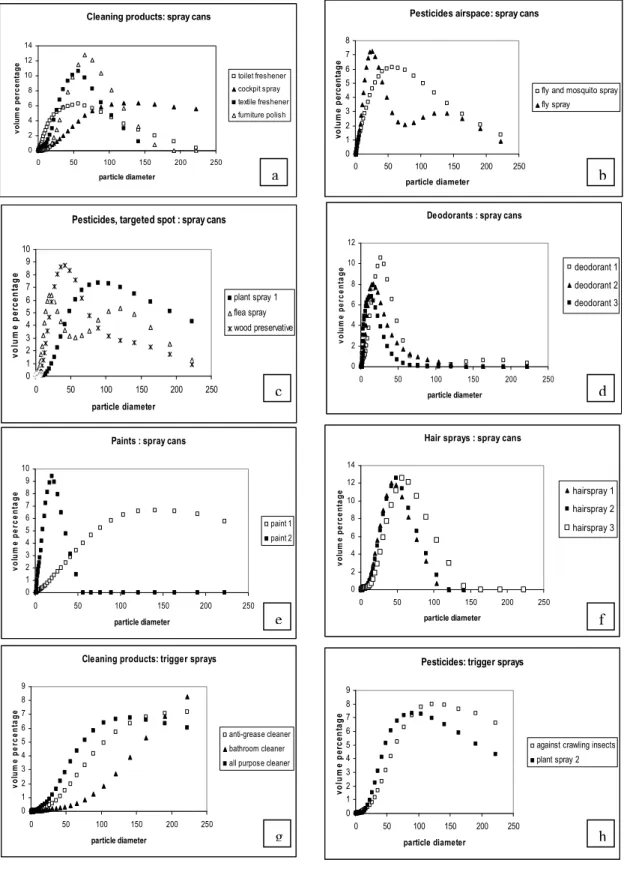
Examples of measured aerosol size distributions for all products are shown in Figure 1. The distributions are presented as normalized volume distributions. Assuming that the mass density is independent of the aerosol size, a volume distribution is equivalent to the mass distribution. From the graphs in Figure 1, it can be seen that trigger sprays (graphs 1g and 1h), tend to produce larger aerosols than spray cans. For trigger sprays median aerosol diameters range from about 70 µm up to well over 100 µm. The differences between the different spray cans on the other hand, are much larger. The smallest aerosols are generated by the deodorants, which emit almost all of their material in aerosols with diameters smaller than 50 µm, and the largest aerosols are produced by ‘paint 1’, the ‘cockpit spray’ and the ‘fly and mosquito spray’. These sprays approach the aerosol sizes of the trigger sprays.
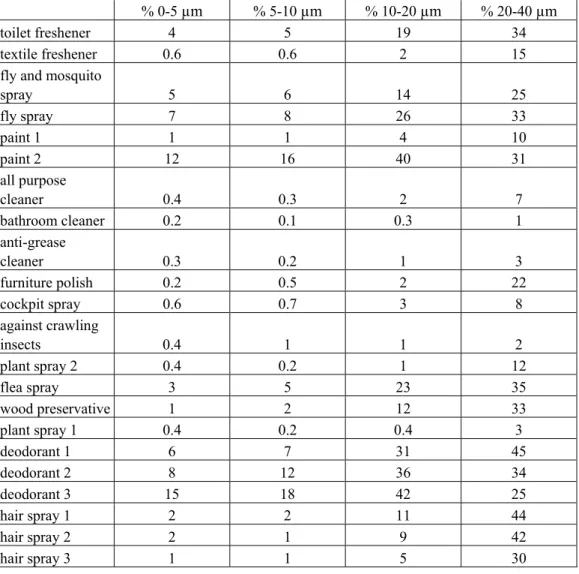
As the mass released in the smaller aerosols is the most important with respect to inhalation exposure, the fractions of total mass that end up in the smaller aerosols (diameters up to 40 µm) are presented separately in Table 2.
Figure 1a-h: Experimental particle size distributions for consumer products in spray cans and trigger sprays grouped according to product category, use category and container type (spray can or trigger spray).
Pesticides, targeted spot : spray cans
0 1 2 3 4 5 6 7 8 9 10 0 50 100 150 200 250 particle diameter vol um e pe rc ent age plant spray 1 flea spray wood preservative
Pesticides airspace: spray cans
0 1 2 3 4 5 6 7 8 0 50 100 150 200 250 particle diameter vo lu m e p er cen tag e
fly and mosquito spray fly spray Cleaning products: spray cans
0 2 4 6 8 10 12 14 0 50 100 150 200 250 particle diameter vo lu m e p e rc en tag e toilet freshener cockpit spray textile freshener furniture polish
Paints : spray cans
0 1 2 3 4 5 6 7 8 9 10 0 50 100 150 200 250 particle diameter v o lu m e p e rc e n ta g e paint 1 paint 2
Cleaning products: trigger sprays
0 1 2 3 4 5 6 7 8 9 0 50 100 150 200 250 particle diameter vo lu m e p e rcen tag e anti-grease cleaner bathroom cleaner all purpose cleaner
Pesticides: trigger sprays
0 1 2 3 4 5 6 7 8 9 0 50 100 150 200 250 particle diameter vo lu m e p er cen ta g e
against crawling insects plant spray 2
Deodorants : spray cans
0 2 4 6 8 10 12 0 50 100 150 200 250 particle diameter vo lu m e p er c en tag e deodorant 1 deodorant 2 deodorant 3
Hair sprays : spray cans
0 2 4 6 8 10 12 14 0 50 100 150 200 250 particle diameter vo lu m e p er ce n tag e hairspray 1 hairspray 2 hairspray 3 a b c d e f g h
Table 2: Experimental percentages of the total mass sprayed per aerosol size class for the most relevant size classes with respect to inhalation potential.
% 0-5 µm % 5-10 µm % 10-20 µm % 20-40 µm
toilet freshener 4 5 19 34
textile freshener 0.6 0.6 2 15
fly and mosquito
spray 5 6 14 25 fly spray 7 8 26 33 paint 1 1 1 4 10 paint 2 12 16 40 31 all purpose cleaner 0.4 0.3 2 7 bathroom cleaner 0.2 0.1 0.3 1 anti-grease cleaner 0.3 0.2 1 3 furniture polish 0.2 0.5 2 22 cockpit spray 0.6 0.7 3 8 against crawling insects 0.4 1 1 2 plant spray 2 0.4 0.2 1 12 flea spray 3 5 23 35 wood preservative 1 2 12 33 plant spray 1 0.4 0.2 0.4 3 deodorant 1 6 7 31 45 deodorant 2 8 12 36 34 deodorant 3 15 18 42 25 hair spray 1 2 2 11 44 hair spray 2 2 1 9 42 hair spray 3 1 1 5 30
2.5 Aerosol concentrations after spraying
2.5.1 Measurement method
For the second phase of the experiment the selection of 23 spray products was reduced to a number of 9, which included 3 trigger sprays and 6 spray cans. For these sprays aerosol concentrations in a room for which the ventilation could be controlled, were measured as a function of time under conditions simulating the anticipated use of the product. The sprays used in these experiments are written in bold in Table 1.
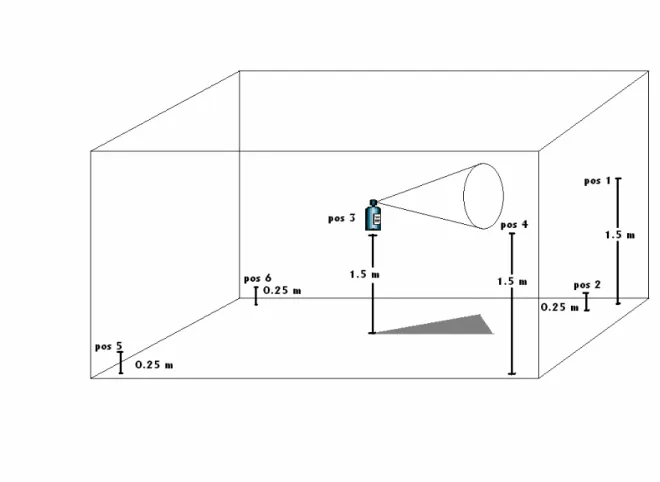
Spraying was performed from the middle of the room in the direction of one of the corners (the corner that contains the sample points 1 and 2 (see Figure 2)). Depending on the spray scenario, the spraying was directed into the air or on a surface. The target surface was either on the floor (near sample position 2) or at 1.5 m height (near sample position 1).
The spraying was done following a scenario simulating normal use of the spray. The following scenarios were used for the different sprays:
• spray against crawling insects: the trigger was squeezed 10 times with the nozzle pointed towards the ground 30 cm from the surface. The spray covered a square area of 70 cm x 70 cm (position 2).
• anti-flea spray: sprayed continuously for 10 seconds with the nozzle pointed towards
the ground 30 cm from the surface. The spray covered a square area of 70cm x 70 cm
(position 2).
• all purpose cleaner and plant spray 2 fine and coarse setting: the trigger was squeezed
10 times with the nozzle pointed towards the back wall 30 cm from the surface. The spray
covered a 70 cm x 70 cm square with its center at a height of 150 cm from the floor
(position 1).
• deodorant 1, plant spray 1, hair spray 1: sprayed continuously for 5, 10 and 10 seconds
respectively against the back wall keeping the spray nozzle 30 cm from the surface. The
spray covered a 70 cm x 70 cm square area with its center at a height of 150 cm from the
floor (position 1).
• fly and mosquito spray and fly spray: sprayed continuously for 5 seconds standing in
the center of the room and point toward the upper corner above positions 1 and 2.
The measurements of air concentrations were performed with the APS and ELPI in a room of volume 19.5m3 (3.90m x 2.10m x 2.38 m). The measurement set-up is shown in Figure 2.
Measurements of the air concentration were performed at heights of 25 cm and 150 cm above the ground at various positions in the experimental room.
After each measurement the room was cleaned by pumping filtered air through it for
5-20 minutes depending on the remaining aerosol concentration.
Figure 2: Experimental set-up air concentration measurements. The spray was operated in the middle of the room and directed into the corner containing positions 1 and 2. Positions 1-6 indicate the different positions where APS measurements were taken to monitor aerosol concentrations in the room. ELPI samples were taken at position 3 only.
The APS recorded data for each spraying event in two sets. The first set consisted of
10 samples of 15 seconds, totalling 2.30 minutes. In this period air concentrations of the
particles changed fast due to dispersion of the cloud through the room and deposition of
the larger particles. The second set consisted of 14 samples of 240 seconds each for the
spray cans, spanning a total sampling time of approximately one hour. The trigger sprays
were sampled for a shorter period since the aerosol concentration barely exceeded
background levels after the first two minutes.
The sampling of air concentrations started simultaneously with the application of the
spray.
The APS generated two types of measurements: the distribution of the diameters of the
airborne particles (see, for example Figure 3), and the total air concentration of all the
particles with diameter < 20 µm (as in Figure 4 and 5).
The ELPI was placed in the middle of the room at 150 cm height (sample position 3, see
Figure 2). ELPI measures aerosol concentrations continuously for 12 size classes. Sample
times where the same as for the
APS.2.5.2 Results
APS measurements
Output of the APS measurements includes the mass-size distribution at the position 1 at
every sampling time point. The distribution ranges from aerosol diameter 0.5 µm to
20 µm. An example of a mass distribution function as recorded in the course of time is
presented in Figure 3 (for additional examples, see Appendix 2: aerosol size distributions
in time).
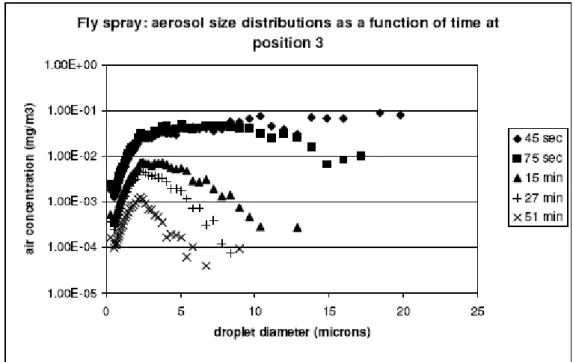
These measurements show that the mass distribution becomes more skewed towards lower
diameters as time passes and the total air concentrations drop.
This is due two processes: first, the larger aerosols are being removed from the air more
quickly by gravitation than the smaller aerosols. And second, the larger aerosols may, in
contrast to the smaller aerosols, still contain volatile components such as solvents, which
will evaporate and cause the aerosol to shrink (and therefore these aerosols move towards
the lower diameters in the distribution).
From the aerosol size distributions as described above, total air concentrations of aerosol
mass (in the range 0.5-20 µm) are obtained by integration over the entire range.
Figure 3: Aerosol size distribution of a fly spray in the middle of the room (position 3) at different times.
Examples of the time dependent air concentration are plotted in Figure 4 and 5. In these
graphs, the air concentrations measured at different sample positions in the room are
shown.
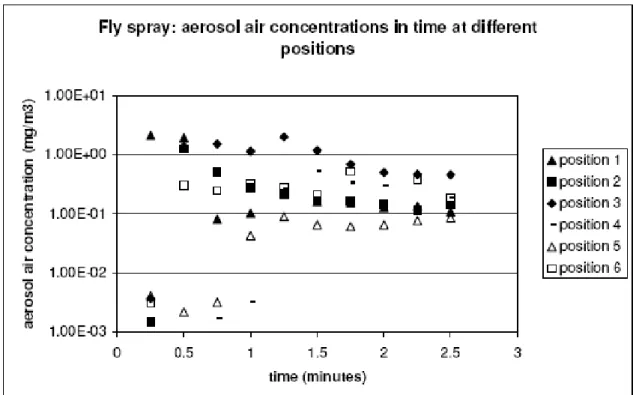
Variations in concentration level across the room are larger in the initial phase after
release (see Figure 5), the highest values are reached at sample positions 1, 2 and 3, i.e. in
the corner where the spray is released and at the position of the user of the spray. It can be
seen from these figures that the time it takes for the aerosol cloud to disperse throughout
the room is about 1 minute. After dispersion the concentration levels vary within at most
one order of magnitude across the room.
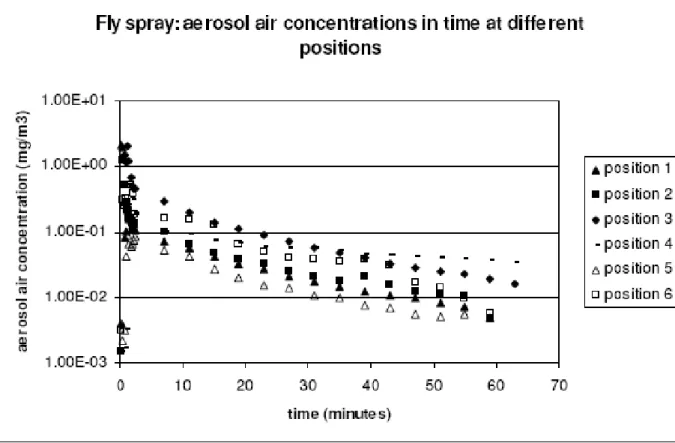
Figure 4: Measured aerosol air concentration profiles at different positions in the experimental room for the full duration of the sampling (60 minutes) (Refer to Figure 2 for the definition of the measurement positions ).
The concentrations of aerosols in air show for all products a similar time dependence. The
concentration profiles show a marked maximum right after spraying at the positions 1 and 2 (in the corner into which the spray was directed) which varies among the tested sprays between 0.5 mg/m3 and 30 mg/m3. After an initial phase of about 2 minutes, the recorded profiles have similar shapes. The air concentration diminishes slowly, presumably mainly because of the gravitational settling of the remaining (smaller) aerosols.
Figure 5: Measured aerosol air concentration profiles at different positions in the experimental room for the first 3 minutes of the sampling.
Highest concentrations are reached for sprays with a high mass generation rate (fly and mosquito spray) and sprays that produce the smallest aerosols (fly spray, hair sprays, deodorants). The higher levels of the latter can be explained by the fact that the removal of the mass in these smaller particles is much slower because of the lower settling velocity of smaller aerosols.
The sprays with the larger particles such as the plant spray with the coarse aerosols and the spray against crawling insects do not reach appreciable aerosol air concentrations after the dispersion of the initial cloud (the levels of about 0.001-0.01 mg/m3 were only just above background levels). The spray products with the smaller aerosol size distributions on the other hand, show aerosol air concentrations that are low (about 0.1-1 mg/m3) but persist for a significant amount of time (up to 1 hour after spraying).
As can be seen from Figure 3 this long-term exposure is mostly due to aerosols with diameter smaller than 5 micrometer.
2.5.3 ELPI measurements
APS measures particles in the range of 0.5 to 20 µm. The mass in these aerosols constitutes the bulk of the total inhalable material, however to get a more complete picture of the total exposure, air
concentrations of smaller aerosols were also monitored in the middle of the room (position 3, see Figure 2), using the ELPI. In spite of the small amount of mass contained in these smaller aerosols, the
exposure to them may be important as they have a higher potential to reach the lowest regions of the respiratory tract (alveolar region).
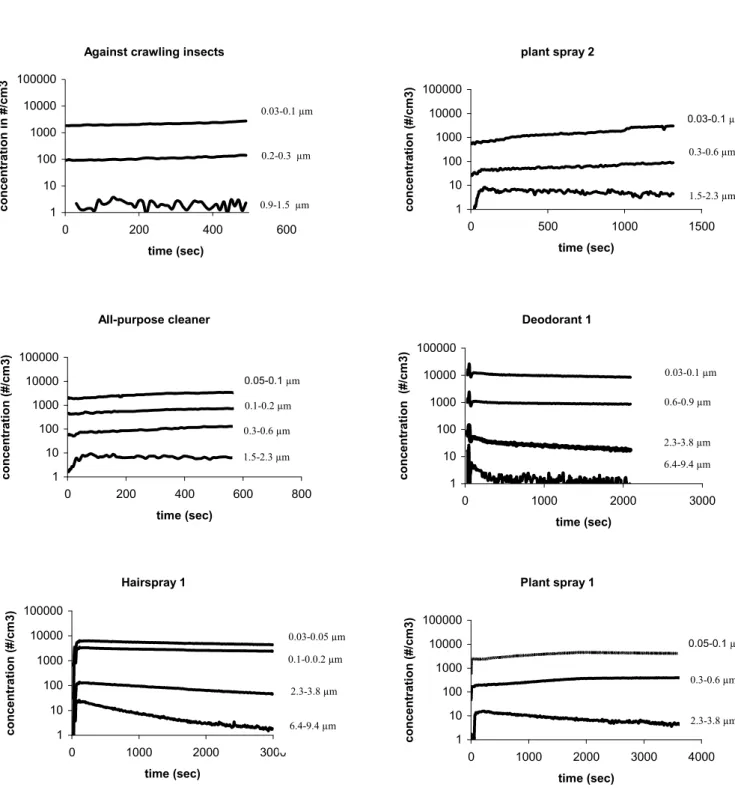
The ELPI registers the number of particles of a given size class per unit volume (see appendix 1 for a description of the size bins used in these experiments. The average size of a particle in a bin is reported in all the graphs). The monitoring is continuous in time. Measurements for all the aerosol spray cans are shown in Figure 6.
It can be seen from these results that the concentrations of the smaller aerosols remain at roughly constant levels for most of the duration of the experiments. At the same time, these levels are very low in terms of mass concentrations (well below 0.1-0.01 mg/m3 for most aerosol sizes).
Against crawling insects 1 10 100 1000 10000 100000 0 200 400 600 time (sec) concentra ti on i n #/ cm 3 plant spray 2 1 10 100 1000 10000 100000 0 500 1000 1500 time (sec) concent ra ti on ( #/ cm3) All-purpose cleaner 1 10 100 1000 10000 100000 0 200 400 600 800 time (sec) concentrati o n (#/ cm 3) Deodorant 1 1 10 100 1000 10000 100000 0 1000 2000 3000 time (sec) concent rati on (#/ cm 3) Hairspray 1 1 10 100 1000 10000 100000 0 1000 2000 3000 time (sec) concentrati on (#/ cm 3) Plant spray 1 1 10 100 1000 10000 100000 0 1000 2000 3000 4000 time (sec) concentrati o n (#/ cm 3)
Figure 6: ELPI measurements: aerosol number concentrations (in #/cm3) in the room air per size class as a function of time. 6.4-9.4 µm 0.03-0.1 µm 1.5-2.3 µm 0.3-0.6 µm 0.03-0.1 µm 0.9-1.5 µm 0.2-0.3 µm 0.05-0.1 µm 1.5-2.3 µm 0.3-0.6 µm 0.1-0.2 µm 0.03-0.1 µm 2.3-3.8 µm 0.6-0.9 µm 0.05-0.1 µm 2.3-3.8 µm 0.3-0.6 µm 0.1-0.0.2 µm 0.03-0.05 µm 2.3-3.8 µm 6.4-9.4 µm
3 Exposure model
The results from the experiments described in chapter 2 were used to develop a model that is to be used in predictive exposure assessments. In order to be applicable in practical situations, such a model has to be relatively simple and contain only the most essential processes that determine the final aerosol concentrations.
The aerosol concentrations in room air will be determined by several factors: - the mass emitted by the spray
- the dispersion of the initial spray cloud through the room - the evaporation of volatile material from the aerosols - the gravitational settling of the aerosols
In practice, the airborne particles will be largely removed by ventilation of the room, but in these experiments, ventilation was kept at zero. Future research could include the effect of ventilation.
3.1 Dispersion
As pointed out in the discussion of the aerosol concentration profiles in figures 4 and 5, the dispersion of the aerosol cloud throughout the room is not complete, but concentration levels settle at constant ratios after a short time after spraying (within approximately 1 minute). Measurements of indoor air mixing times indicate that these may range from more than an hour down to several minutes for different heating conditions (Baughman et al., 1994). In the experimental setup no special effort was taken to keep the temperature of the room fixed. The presence and size of thermal gradients are not known, but are assumed to be the principle source of air convection. Other sources of convection where kept at a minimum. In any practical situation, presence of ventilation, additional thermal sources and persons moving through the room will likely bring about a better mixing of the room air than in the experimental set-up.
As a first approximation in our model, it is assumed that the room air is well mixed at all times.
Expecting that the margin of error in the prediction of room air concentrations in a real situation will be at most one order of magnitude (as observed in the experiments described above), but probably much less due to fact that air mixing in any realistic situation will likely be much higher than in our
experimental setup.
3.2 Evaporation
Different spray products will obviously have different compositions. Components of spray products will have different volatilities, ranging from very high (e.g., propellant gases) to high/intermediate (solvents), to very low (e.g. active ingredients of pesticides, surfactants etc.).
After release of the aerosol these components will evaporate at different rates, causing the aerosol to shrink.
The change in aerosol diameter due to evaporation of one of its components can be approximated by:
1) p
4
v(
p dd
D M
d
t
ρ
RT
∂
=
which, after integration, leads to: 2)
(
p)
21
1
2(
8
v s o o dd
D MP
t
d
= −
d
ρ
RT
)
if the vapour pressure P of the evaporating substance can be neglected compared to its saturated vapour pressure Ps (i.e. P = 0).
In these equations:
p
d
the particle (time dependent) diametero
d
the initial particle diameterv
D
the diffusion coefficient of the evaporating component through airM
the molecular weight of the componentP
vapour pressure of the components
P
saturated vapour pressure of the componentR
(ideal) gas constantT
temperatured
ρ
mass density of the droplett
timeThe smallest diameter do which an aerosol might reach is determined by the amount and mass density
of the non-volatile (or hardly volatile) components.
From equation 2 it can be seen that the relative speed with which droplets shrink will depend on the (initial) aerosol size (do). The small aerosols shrink relatively faster than the larger aerosols.
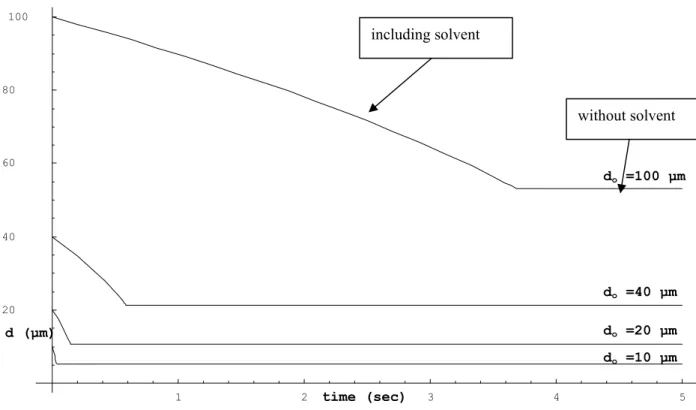
To give an example: for aerosols that consist of a mixture of water and some non-volatile chemical, the calculated aerosol diameter as a function of time is shown for different aerosol sizes do (10, 20, 40 and
100 μm, respectively) in Figure 7. For the simulated aerosol diameters the relative air humidity was set to 50 %. The mixture is supposed to consist for 80 % of water.
It is seen for these aerosols, which represent the most important size range with respect to the
inhalability of the aerosols, that the evaporation of solvent is quick. For aerosols with do < 40 μm all of
the water has evaporated well within 1 second. In addition, it should be noted that water is just a moderately volatile solvent.
1 2 3 4 5 20 40 60 80 100 d including solvent without solvent o =100 μm d =40 μmo d =20 μm d (μm) o d =10 μmo time (sec)
Figure 7: Calculated change in aerosol diameter as a result of evaporation of a solvent (water) from a 2-component mixture. Time dependent diameter is shown for do= 10, 20 and 40 μm respectively. Relative air humidity was 50 %, solvent content in the aerosols: 80 %
These calculations show that the inhalable aerosol particles (i.e.: particles < 10-15 μm) formed during the use of spray cans will contain mostly non- or low volatile substance for most of the time. Even at the instant the initial aerosol size distribution was measured, a large fraction of the higher volatility components will already have evaporated, since it takes a finite time for the aerosols to reach the detector.
In view of the results of these calculations on the evaporation of solvents from a mixture, it is assumed that all of the solvent will already have evaporated from the aerosols at the instant the aerosol size distribution was recorded. This assumption will only hold for volatile solvents (at least as volatile as water) and for the small size aerosols in the distribution (diameters up to about 10 µm). These smaller aerosols, however are precisely the ones that are of interest with respect to inhalation exposure. But it must be kept in mind that this is a crude assumption that may hold only approximately for less volatile solvents.
In developing and verifying a model that describes the aerosol concentrations resulting from the use of sprays, the assumption above implies that we only account for the non-volatile components in the spray products, and evaporation is not included explicitly in the model.
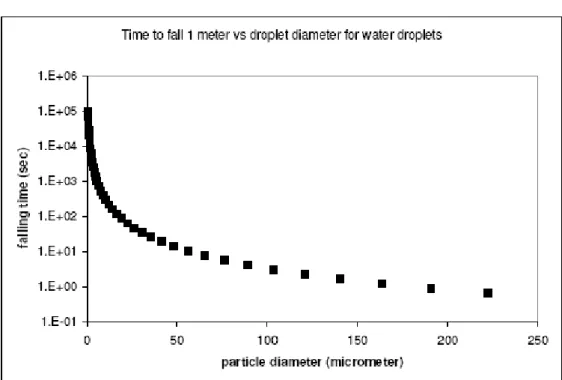
3.3 Gravitational settling
Airborne aerosols will fall down under influence of gravitation. The speed at which they fall is given by Stokes’s settling velocity vs(dp)(Hinds, 1982):
3) vs(dp)=18ρgη
d S
p2 in which:s
v
Stokes’s settling velocityp
d
particle diameterρ
mass density of the aerosolg
gravitational constantη
air viscosityS
correction factor (either slip correction or the coefficient of drag)S is a correction factor which is either (depending on the size of the particle) the Cunningham slip correction factor or the coefficient of drag. In the range of aerosol sizes considered in the APS measurements (~1-20 μm) this factor can be set to 1.
Stokes’s settling velocity depends on the aerosol diameter dp, larger aerosol particles will fall faster
than smaller aerosol particles (see Figure 8).
For the larger aerosol particles (50 µm and above), residence times in the room air will typically be about a few seconds or less. For smaller aerosols, these residence times quickly rise with decreasing diameter and may reach values up to several hours, or even days.
3.4 Exposure model
Summarizing the sections above, in developing a model that describes the experiments, the following simplifying assumptions are made:
- after release of the particles, the room air is assumed to be well-mixed, i.e. the aerosol concentration is assumed to be homogeneously distributed throughout the room.
- all of the more volatile components such as propellants and solvents are assumed to have evaporated from the aerosols immediately after the spray has been used. (In particular, the particle size distribution as recorded by the mastersizer is assumed to contain only non-volatile material). This assumption will clearly not hold for the larger aerosol particles, but seems reasonable for the respirable aerosol particles.
- removal of aerosol particles in the experiment is entirely due to gravitational sedimentation as in these experiments ventilation was kept at zero. Ventilation is included in the final model by assuming well-mixed air conditions (homogeneous concentrations in the room air), and a removal rate of the aerosol proportional to the air exchange rate.
To predict aerosol particle concentrations in air, the model takes as input the non-volatile mass that is being sprayed, the initial particle distribution as measured in the Mastersizer experiment, room dimensions and room ventilation.
In the mathematical description of the model we use the following symbols:
M
δ
: total mass of aerosols with diameterδ
t
: time20
airborne m
f
< μ : fraction of respirable (i.e. with diameter smaller than 20 µm) aerosols thatbecomes airborne.
M
tot
: total mass sprayed( )
P
δ
: probability density function for aerosol of diameterδ
δ
: aerosol diameterair
A
: airborne massC
air
: room air concentrationroom
S
: room surface areav
s
: Stokes’s settling velocityroom
V
: room volumeh
: room heightq
: ventilation rate (number of air changes per unit time)The total mass of particles of diameter
δ
generated by the spray can is described by the normalized particle mass-size distribution function P(δ
) as:4)
M
f
airborne 20 mM
P
( )
tot
μ
δ
d
δ
Mtot is the total non-volatile mass being sprayed. It is determined from the formulation of the spray
product and the total mass sprayed during a spray event (i.e. it equals the fraction of non-volatile components in the total mass sprayed Mtot). In calculations the distribution function is discretisized in
bins of width d
δ
for which the average aerosol diameter is taken as a representative.Aerosols that have become airborne will settle under the force of gravity with a velocity given by equation 3. Removal of aerosols (with a total mass
A
δ) with diameterδ
from a well-stirred concentration by settling is given by :5)
( )
( )
room( )
( )
room roomv
dA
S
s
C
S
v
A
v
A
air
s
s
dt
V
h
δ δ δδ
δ
δ
δ
= −
×
×
= − ×
×
= − ×
The removal of chemical from air by ventilation, assuming well mixed air conditions, is given by:
6)
( )
roomdA
C
air
V
q
A
dt
δ δδ
= −
×
× = − × q
The solution for the total air concentration is obtained by summation over all diameter bins. Assuming an instantaneous release of aerosols, it is given by:
( ) 20 20 ( ) ( ) ( ) ( ) s s s v q t h
airborne µm tot airborne µm tot air
air
room room room
dA v v A A q q A dt h h A e f M P f M A C d V V V δ δ δ δ δ δ δ δ
δ
δ
δ
P dδ
δ
δ
⎛ ⎞ −⎜ + ⎟ ⎝ ⎠ < < ⎛ ⎞ = − × − × = −⎜ + ⎟ ⎝ ⎠ = × × × = = ∑ × = ∑ ×where use was made of the fact that:
A t
air( )
f
airborne 20μmM
totP
( )
δ
δ
δ
<
=
∑
×
×
× Δ
This finally leads to:
7) ( ( )/ ) 20
( )
( )
vs h q air tot air airborne m room roomA
M
C
t
f
P
e
V
V
δ μ δδ
δ
− + <=
=
×
∑
× Δ ×
t4 Model versus experiment
In order to test the proposed model (equation 7) against the experimental data, it should (again) be noted that there was no ventilation in the experiments, i.e. q = 0 in the equations.
In addition to the measured mass generation rate and the initial particle distribution P(δ,0) of the sprays, data on the fraction of non-volatile material in the product, the mass density of the non-volatile product and the fraction of the sprayed product that becomes airborne during spraying have to be determined. The formulation of the spray products was in most cases approximately known, but not exactly. The fraction of non-volatile material was estimated from the formulations, but the (average) mass density of all the non-volatile material was treated as an unknown parameter.
Similarly, the airborne fraction fairborne<20µm , was unknown. Both these unknown parameters were
determined by fitting the model to the experimental data.
Following this procedure for a fly spray the results shown in figures 9 and 10 were obtained. The model prediction of the total particle concentration in air is in satisfactory agreement with the averaged room concentrations as measured in the experiments.
Also, the model prediction of the time dependent particle concentration distribution (Figure 10) is in general good, although it can be observed that for longer times, the model tends to overpredict the air concentrations for all particle sizes. This might be brought about by additional evaporation of the low volatile material from the particles, that in the model is assumed to be completely non-volatile.
Figure 9: Modelled aerosol air concentration versus experiment for a fly spray. The experimental concentrations are averaged over different positions in the room. The error bars indicate the standard deviation in concentration values over the different sample positions in the room.
Figure 10: Modelled air concentration per aerosol diameter versus experimental particle size distributions.
Following the same approach for the other spray products the graphs of Figure 11 were obtained. For most of the spray products the results are again satisfactory. The values that were used for the airborne fraction of the respirable particles are given in Table 3. It is seen that this airborne fraction is largest for the sprays that produce small particles, approaching 100 % for hair spray and deodorant. Relatively low airborne fractions were found for sprays that were used to treat a surface.
These determined airborne fractions are, of course, specific for the spray product under consideration and the way in which the product is used.
The values obtained for the densities of the non-volatile material are presented in Table 4 (the weight fractions were estimated from data on the composition of the products).
Droplet air concentration experiment vs model: fly and mosquito spray 1.E-03 1.E-02 1.E-01 1.E+00 0 10 20 30 40 50 60 70 time (min) conc entr ation ( mg/m3) experiment model
Droplet air concentration experiment vs model: flea spray 1.E-03 1.E-02 1.E-01 1.E+00 1.E+01 0 20 40 60 80 time (min) conc entr ation ( mg/m3) experiment model
Droplet air concentration experiment vs model: against crawling insects
1.E-04 1.E-03 1.E-02 1.E-01 1.E+00 0 20 40 60 80 time (min) conc entr ation ( mg/m3) experiment model
Droplet air concentration experiment vs model: plant spray 1 1.E-03 1.E-02 1.E-01 1.E+00 1.E+01 0 20 40 60 80 time (min) conc ent rat ion (m g/ m 3) experiment model
Droplet air concentration experiment vs model: plant spray 2 (fine)
1.E-03 1.E-02 1.E-01 1.E+00 1.E+01 0 20 40 60 80 time (min) conc entr ation ( mg/m3) experiment model
Droplet air concentration experiment vs model: all purpose cleaner 1.E-03 1.E-02 1.E-01 1.E+00 0 20 40 60 80 time (min) conc entr ation ( mg/m3) experiment model
Droplet air concentration experiment vs model: hair spray 1.E-02 1.E-01 1.E+00 1.E+01 1.E+02 0 20 40 60 80 time (min) conc entr ation ( mg/m3) experiment model
Droplet air concentration experiment vs model: deodorant 1.E-02 1.E-01 1.E+00 1.E+01 0 10 20 30 40 50 60 70 time (min) conc entr ation ( mg/m3) experiment model
Table 3: Values for airborne fraction obtained from a model fit to experimental concentration levels.
Product Airborne fraction<20 µm (%)
Fly and mosquito spray 60
Fly spray 60
Deodorant 1 100
Hair spray 1 100
Flea spray 50
Plant spray 1 10
Plant spray 2 fine 20
Against crawling insects 10
All purpose cleaner 10
Table 4: Estimated values for density of the non-volatile fraction and fitted values for the mass density of the non- volatile material of the sprayed product.
Product Weight fraction non-volatile Density non-volatile
Fly and mosquito spray 0.007 1
Fly spray 0.0225 2.5
Deodorant 1 0.025 1.5
Hair spray 1 0.05 0.7
Flea spray 0.002 2
Plant spray 1 0.012 1
Plant spray 2 fine 0.001 1
Against crawling insects 0.004 1
5 Default product parameters and application in
the ConsExpo program
The model as described in chapter 3 has been implemented in the ConsExpo program.
The model takes a number of critical, product specific input values that are in principle relatively straightforward to obtain by experiment but are in the regulatory practice seldom available. These parameters include the initial particle size distribution and the mass generation rate of the spray product.
To facilitate a framework were a reasonable accurate exposure assessment can be made quickly and without the need for initial measurements, default values for these parameters for a number of different product groups are provided. To this end, a number of additional measurements of the mass generation rate and the initial particle size distributions were performed for various products. The products in this additional study were chosen to be representative for a number of different spray product categories. Based on the measured product parameters default values for the product categories these products represent are defined.
The measured mass generation rates of the products are listed in Table 5. These measurements combine the mass generation rates of the original dataset (Tuinman, 2004) with the newly obtained data (Tuinman, 2007).
Table 5: Mass generation rates measured per spray product.
Product category Product Mass generation rate
[g/sec]
Reference
Pesticides
Spray can, air space spray
Spray can, on surfaces
Trigger, ready to use on surfaces
Trigger, plant spray
Cosmetics
Spray can, deodorant
Fly and mosquito spray Fly spray
Flying pests Flying insect spray Fly and mosquito spray 2 Flea spray
Plant spray 1 Wood preservative
Against crawling insects and wasps carpet spray
Aphid stop Plant spray 3
Against crawling insects Against aphids
Against crawling insects 2 Plant spray 2, fine Plant spray 2, coarse Plant spray 4 Plant spray 5 Deodorant 1 Deodorant 2 Deodorant 3 Deodorant 4 Deodorant 5 2.2 0.5 2.1 1.3 2.3 1.7 1.5 1.9 2.2 2.0 2.5 2.6 1.2 1.6 1.6 1.5 1.5 2.2 1.4 0.6 0.8 0.8 0.8 0.9 Tuinman, 2004 ,, Tuinman, 2007 ,, ,, Tuinman, 2004 ,, ,, Tuinman, 2007 ,, ,, ,, Tuinman, 2004 Tuinman, 2007 ,, Tuinman, 2004 ,, Tuinman, 2007 ,, Tuinman, 2004 ,, ,, Tuinman, 2007 ,,
Spray can, hair spray
Pump spray, toilet water
Cleaning products
Trigger, all purpose cleaner
Trigger, bathroom and anti-grease cleaner
Paints
Spray can, paint
Furniture polishes
Spray can, furniture polish Cockpit sprays
Spray can, cockpit spray
Deodorant 6 Hair spray 1 Hair spray 2 Hair spray 3 Hair spray 4 Hair spray 5 Hair spray 6 Eau de toilette 1 Eau de toilette 2 Eau de toilette 3 Eau de perfume 1 Eau de perfume 2 all purpose cleaner all purpose cleaner 2 Bathroom cleaner Bathroom cleaner 2 Anti-grease cleaner Anti-grease cleaner 2 Paint 1 Paint 2 Paint 3 Paint 4 Paint 5 Furniture polish Furniture spray 2 Cockpit spray 0.9 0.8 0.8 0.6 0.7 0.8 0.7 0.09 0.1 0.1 0.08 0.09 1.2 1 1,3 1.6 1.3 1.7 0.5 0.9 0.7 0.5 0.9 1.8 0.8 1.0 Tuinman, 2007 Tuinman, 2004 ,, ,, Tuinman, 2007 ,, ,,,, Tuinman, 2007 ,, ,, ,, ,, Tuinman, 2004 Tuinman, 2007 Tuinman, 2004 Tuinman, 2007 Tuinman, 2004 Tuinman, 2007 Tuinman, 2004 ,, Tuinman, 2007 ,, ,, Tuinman, 2004 Tuinman, 2007 Tuinman, 2004 Tuinman, 2007
Lubricants
Spray can silicone spray Spray can, penetrating spray Air fresheners
Spray can, air freshener
Water-repellant making products Spray can, anti-rain spray
Cockpit spray 2 silicone spray 1 silicone spray 2 penetrating spray 1 penetrating spray 2 toilet freshener textile freshener air freshener 2 air freshener 3
anti-rain textile spray
0.8 0.9 1.2 1.5 1.1 0.8 0.5 2.0 1.0 0.6 Tuinman, 2007 ,, ,, ,, Tuinman, 2004 Tuinman, 2004 Tuinman, 2007 Tuinman, 2007 Tuinman, 2007
Table 6: Default values mass generation rate.
Spraying device Product category Mass generation rate 1)
[g/sec]
N 2)
Spray cans Pesticides
Deodorant Hair spray Paints
Other spray cans
2.2 0.9 0.8 0.9 1.2 12 6 6 5 13
Trigger sprays All trigger sprays 1.6 12
Pump sprays Toilet water 0.1 5
1) 75-percentile values of measured products 2) number of measured products
For measuring the intitial particle size distributions, the measurement method was the same as described in section 2.4.
Particle size distributions : hair sprays 0 2 4 6 8 10 12 14 0 50 100 150 200 250 particle diameter vo lu m e p er cen tag e
Figure 12: Measured initial particle size distributions for different spray products. hair spray 4
hair spray 5 hair spray 6
Particle size distributions : toilet w ater
0 2 4 6 8 10 12 14 0 50 100 150 200 250
particle diam eter
vo lu m e p er ce n ta g e eau de toilette 1 eau de toilette 2 eau de toilette 3 eau de perfume 1 eau de perfume 2
Particle size distributions : cleaning products
0 2 4 6 8 10 12 14 16 0 500 1000 particle diameter vo lu m e p er cen tag e
all purpose cleaner 2 bath room cleaner 2 anti grease cleaner 2
Particle size distributions : pesticides
0 2 4 6 8 10 12 14 16 0 500 1000 particle diameter vo lu m e p er cen tag e plant spray 3 plant spray 4 plant spray 5 aphid stop against aphids
Particle size distributions : paints
0 1 2 3 4 5 6 7 8 0 50 100 150 200 250 particle diameter vo lu m e p er cen tag e paint 3paint 4 paint 5
Particle size distributions : pesticides
0 2 4 6 8 10 12 0 200 400 600 800 1000 1200 particle diameter vo lu m e p er cen tag e
against craw ling insects and w asps against craw ling insects 2 carpet spray Particle size distributions : lubricants
0 1 2 3 4 5 6 7 8 0 100 200 300 400 500 particle diameter vo lu m e p er cen tag e silicone spray 1 silicone spray 2 penetrating spray 1 penetrating spray 2
Particle size distributions : deodorants
0 2 4 6 8 10 0 20 40 60 80 100 particle diameter vo lu m e p er ce n ta g e deodorant 4 deodorant 5 deodorant 6
Particle size distributions : pesticides
0 2 4 6 8 10 12 -300 200 700 1200 particle diameter vo lu m e p er cen tag e flying pests flying insect spray fly and mosquito spray 2 Particle size distributions : air fresheners
0 2 4 6 8 10 12 14 16 0 100 200 300 particle diameter vo lu m e p er cen tag e air freshener 2 air freshener 3
At the moment of writing the version of the model as implemented in the ConsExpo software takes only parametric distributions (either normal or lognormal distributions) for input of the particle size distribution. A lognormal fit of the experimental distributions over the entire range of particle diameters proved poor in general. As the smaller particles in the distribution are the most critical with respect to inhalation exposure, we chose to fit the size distributions in the region of diameters up to 22.5 µm, realizing that the fit of the distribution for larger particle sizes will not be valid.
In the fitting procedure the size distributions of different products from the same product group were aggregated. A log-normal distribution was fit on the 90-percentile of this aggregate in each size bin. Thus, for example, all deodorants were grouped together. Every size particle size distribution was regarded as a statistical sample of the ‘standard’ deodorant particle distribution. From the ensemble of deodorants a 90-percentile curve was constructed by taking the 90 percentile per particle diameter bin. To the resulting 90-percentiles curve a lognormal curve (equation 8) was fit.
8) 2 2 (ln( ) ) 2 1 ( ) 2 p d p p f d e d μ σ
σ
π
− − =This fitted distribution is chosen as a default distribution representing the particle size distribution of all deodorant sprays. The distribution parameters of the default distributions per product category (mean and coefficient of variation) are summarized in Table 7.
In the process of fitting, the default distributions were scaled by multiplication with a scaling factor fscale that represents the mass fraction of the particles with a diameter < 22.5 µm of the total
mass sprayed of the product. This factor is not a separate factor in the ConsExpo model. In order to accommodate this factor, it is to be combined with the airborne fraction of the ConsExpo model. Therefore, this fraction now consists of two contributions: this scale factor fscale and
fairborne,which was obtained from the fit of the model with the experimental data (presented earlier
in Table 3). Both factors are given separately in Table 8 but should be used as one aggregate factor in the ConsExpo evaluations (i.e. Airborne fractionnew = fairborneold x fscale ).
Table 7: Default values for distribution parameters (median and coefficient of variation).
Product category P50 CV
Pesticides:
Spray can, air space spray 28.1 1.6 Spray can, on surfaces 3.6 0.57 Trigger, ready to use on surfaces 7.7 1.9 Trigger, plant spray 2.0 0.39
Cosmetics:
Spray can, deodorant 8.3 0.84 Spray can, hair spray 46.5 2.1 Pump spray, toilet water 2.7 0.73
Cleaning products:
Trigger, all purpose cleaner 2.4 0.37 Trigger, bathroom and anti-grease cleaner 3.6 0.52
Paints:
Spray can, paint 15.1 1.2
Furniture polishes:
Spray can, furniture polish 10.8 0.81
Cockpit sprays:
Spray can, cockpit spray 10.1 0.81
Lubricants:
Spray can, silicone spray 19.8 1.3 Spray can, penetrating spray 23.3 1.3
Air fresheners:
Spray can, air freshener 3.9 0.65
Water-repellent making products:
Table 8: Default values for Fscale (fraction particles < 22.5 um).
F scale default values
number of number of range fraction particles < 22.5 um
products measurements particles < 22.5 um (75-percentile measured values)
Pesticides spray can air space 5 13 0.06 - 0.48 0.3 spray can on plants and surfaces 7 18 0.01 - 0.42 0.2
trigger RTU 3 8 0.02 -0.04 0.04
trigger plantspray, fine 3 7 0.03 -0.16 0.09
Cosmetics spray can deodorant 6 15 0.51 - 1 0.9 spray can hair spray 6 15 0.09 - 0.42 0.2 pump eau de toilette, eau de perfume 5 15 0.04 - 0.11 0.1
Paints spray can 5 13 0.08 - 0.76 0.7
Cleaning products trigger all purpose cleaner 2 4 0.02 - 0.05 0.03 trigger bathroom, anti-grease cleaner 4 8 0.005 - 0.02 0.009 spray can furniture polish 2 5 0.04 - 0.37 0.3
Air freshener spray can 4 10 0.04 - 1 0.8
Cockpit spray spray can 2 5 0.05 - 0.45 0.4
Lubricants spray can silicone spray 2 6 0.28 - 0.62 0.5 spray can penetrating spray 2 5 0.11 - 0.24 0.2
5.1 Simulation the experiments with default values
Using the default values suggested above for the spray product parameters the ConsExpo program was used to simulate the experiments in the climate chamber described in section 2.5. In order to be robust and reliable a generic default should give a reasonable reproduction of the measured air concentrations. If deviations occur these should amount to over-estimation of the exposure. The model parameters were chosen to represent the experimental conditions as closely as possible. As an example the simulation of the air concentration levels with the ConsExpo model, the program inputs for the fly spray are given in Figure 13.
For the product parameters in this simulation the defaults proposed above were used.
The simulated air concentration level as a function of time was compared with the experimentally observed levels. From Figure 14 it can be seen that for most of the simulation time the modelled concentrations are above the experimental levels. Only in the onset of the exposure the model tends to under-predict the concentration levels. This is due to the fact that in this initial phase several of the model assumptions, such as the assumption of well-mixed room air and the complete evaporation of solvent do not hold very well.
ConsExpo evaluation with default distribution vs experiment: fly spray
1.E-03 1.E-02 1.E-01 1.E+00 1.E+01 1.E+02 0 10 20 30 40 50 60 70 time (min) conc entr at ion ( mg/m3) experiment ConsExpo
Figure 14: ConsExpo simulation of the air concentration of fly spray in the experimental room using the proposed defaults compared with the measured concentrations. The error bars indicate the standard deviation in concentration values over the different sample positions in the room.
The resulting air concentration for the other sprays were calculated in a similar way, using values for airborne fraction , spray duration, mass generation rate and the used default values for the parametric (lognormal) initial particle size distribution as described in Table 9 and values for weight fraction non-volatile and density non-non-volatile as described in Table 4.
Table 9: Values for airborne fraction, spray duration, mass generation rate and the used default values for the parametric (lognormal) initial particle size distribution. Product Fairborne Airborne fractionold default values Fscale Fraction < 22.5 µm default values Airborne fraction new Spray duration [sec] Mass generation rate [g/sec] default values
Initial particle size distribution [µm]
P 50 (C.V.) default values
Fly and mosquito spray 1 0.3 0.3 5 2.2 28.1 (1.6)
Fly spray 1 0.3 0.3 5 2.2 28.1 (1.6)
Deodorant 1 0.9 0.9 5 0.9 8.3 (0.84)
Hair spray 1 1 0.2 0.2 10 0.8 46.5 (2.1)
Flea spray 1 1 0.2 0.2 10 2.2 3.6 (0.39)
Plant spray 1 0.2 0.2 0.04 10 2.2 3.6 (0.39)
Plant spray 2 fine 0.2 0.09 0.018 6 1.6 2.0 (0.39)
Against crawling insects 0.2 0.04 0.008 6 1.6 7.7 (1.9)